CONFIDENTIAL BUSINESS INFORMATION/TRADE SECRET Final Report Toxic Air Contaminant Emissions Inventory and Air Dispersion Modeling Report for the Stockton Rail Yard, Stockton, California prepared for: Union Pacific Railroad Company January 2007 prepared by: Sierra Research, Inc. 1801 J Street Sacramento, California 95814 (916) 444-6666
Transcript
CONFIDENTIAL BUSINESS INFORMATION/TRADE SECRET
Final Report
Toxic Air Contaminant Emissions Inventory and Air Dispersion Modeling Report for the Stockton Rail Yard, Stockton, California
prepared for:
Union Pacific Railroad Company
January 2007
prepared by:
Sierra Research, Inc. 1801 J Street Sacramento, California 95814 (916) 444-6666
CONFIDENTIAL BUSINESS INFORMATION/TRADE SECRET
Toxic Air Contaminant Emissions Inventory and Air Dispersion Modeling Report
for the Stockton Rail Yard, Stockton, California
prepared for:
Union Pacific Railroad Company
January 2007
prepared by:
Sierra Research, Inc. 1801 J Street
Sacramento, CA 95814
and
Robert Ireson, Ph. D. Air Quality Management Consulting
161 Vista Grande Greenbrae, CA 94904
CONFIDENTIAL BUSINESS INFORMATION/TRADE SECRET
-i-
SUMMARY In accordance with the 2005 California Air Resources Board (CARB)/Railroad Statewide
Agreement (MOU), Union Pacific Railroad Company (UPRR) has prepared a facility-
wide emission inventory for the Stockton Rail Yard (Yard) in Stockton, California. The
inventory quantifies emissions of specified toxic air contaminants (TACs) (including
Diesel particulate matter [DPM]) from stationary, mobile, and portable sources at the
Yard. The inventory has been prepared in accordance with CARB's Rail Yard Emission
Inventory Methodology guidelines (July 2006) and UPRR's Emission Inventory Protocol
(May 2004).
Activities at the Yard include receiving inbound trains, switching cars, servicing local
industries by picking up and delivering freight cars, building and departing outbound
trains, repairing freight cars, and servicing and repairing locomotives. Facilities within
the Yard include classification tracks, a locomotive service track, a locomotive
maintenance shop, a freight car repair shop, an on-site wastewater treatment plant,
maintenance of way buildings and storage areas, and various buildings and facilities
supporting railroad operations. Altamont Commuter Express (ACE) leases a portion of
the Diesel Shop, steam cleaning area, and the locomotive and passenger car wash rack,
where locomotive and passenger car cleaning, service, and repair are performed.
Emission sources include, but are not limited to, locomotives, sand tower, wastewater
treatment plant, Diesel-fueled trucks and heavy equipment, and storage tanks. Emissions
were calculated on a source-specific and facility-wide basis for the 2005 baseline year.
Emissions from the ACE-owned and -operated locomotives and other operations are
included in the inventory for the Stockton Yard.
An air dispersion modeling analysis was also conducted for the Stockton Yard. The
purpose of the analysis was to estimate ground-level concentrations of DPM and other
TACs, emitted from Yard operations, at receptor locations surrounding the Yard out to a
distance of approximately 6 miles. Emissions from locomotives and Diesel-fueled heavy
equipment were included in the modeling analysis. The air dispersion modeling was
conducted using the AERMOD Gaussian plume dispersion model and wind speed and
CONFIDENTIAL BUSINESS INFORMATION/TRADE SECRET
-ii-
direction, temperature and cloud cover data from the Stockton Municipal Airport. The
meteorological data were processed using the AERMET program. The modeling analysis
was conducted in accordance with the Health Risk Assessment Guidance for Rail Yard
and Intermodal Facilities (July 2006) and UPRR's Modeling Protocol (August 2006).
CONFIDENTIAL BUSINESS INFORMATION/TRADE SECRET
-iii-
Toxic Air Contaminant Emissions Inventory and Air Dispersion Modeling Report
for the Stockton Rail Yard, Stockton, California
TABLE OF CONTENTS Page
SUMMARY ......................................................................................................................... i PART I. INTRODUCTION ................................................................................................1 PART II. FACILITY DESCRIPTION................................................................................3
A. Facility Name and Address .......................................................................3 B. Facility Contact Information .....................................................................3 C. Main Purpose of the Facility .................................................................... 3 D. Type of Operations Performed at the Facility .......................................... 3 E. Facility Operating Schedule ......................................................................4 F. General Land Use Surrounding the Facility .............................................4
PART III. MAP AND FACILITY PLOT PLAN .............................................................. 5 PART IV. COVERED SOURCES .....................................................................................8 PART V. SITE-SPECIFIC EQUIPMENT INVENTORY .................................................9
A. Locomotives ............................................................................................. 9 B. HHD Diesel-Fueled Trucks ....................................................................12 C. On-Road Diesel-Fueled Trucks ..............................................................12 D. Heavy Equipment ................................................................................... 13 E. Tanks .......................................................................................................14 F. Sand Tower ............................................................................................ 15 G. Wastewater Treatment Plant ...................................................................15 H. Auxiliary Generator Sets .........................................................................15 I. Heaters ....................................................................................................16 J. Welders ...................................................................................................17 K. Steam Cleaners ........................................................................................17 L. Miscellaneous Combustion Devices .......................................................18
PART VI. ACTIVITY DATA ..........................................................................................20 A. Locomotives ........................................................................................... 20 B. HHD Diesel-Fueled Trucks ....................................................................24 C. On-Road Diesel-Fueled Trucks ..............................................................25 D. Heavy Equipment ................................................................................... 26 E. Tanks .......................................................................................................27 F. Sand Tower ............................................................................................ 27 G. Wastewater Treatment Plant ...................................................................27
CONFIDENTIAL BUSINESS INFORMATION/TRADE SECRET
-iv-
TABLE OF CONTENTS (CONTINUED) Page
H. Auxiliary Generator Sets .........................................................................28 PART VII. EMISSIONS ...................................................................................................29
B. TAC Emissions by Source Type .............................................................40 C. Facility Total Emissions .........................................................................44
PART VIII. RISK SCREENING CALCULATIONS ..................................................... 45 PART IX. AIR DISPERSION MODELING ....................................................................47
A. Model Selection and Preparation ............................................................47 1. Modeled Sources and Source Treatment ..........................................47 2. Model Selection ................................................................................50 3. Modeling Inputs ................................................................................51 4. Meteorological Data Selection ..........................................................55 5. Model Domain and Receptor Grids ..................................................56 6. Dispersion Coefficients .....................................................................62 7. Building Downwash ..........................................................................62
B. Modeling Results ....................................................................................63 C. Demographic Data ..................................................................................63
PART X. REFERENCES ................................................................................................ 64
1. Summary of Locomotive Models (Road Power) ..................................................... 11 2. Fleet Distribution for HHD Diesel-Fueled Trucks .................................................. 12 3. Equipment Specifications for On-Road Diesel-Fueled Trucks .................................13 4. Equipment Specifications for Diesel-Fueled Heavy Equipment ..............................13 5. Storage Tank Specifications .....................................................................................14 6. Equipment Specifications for Heaters.......................................................................16 7. Equipment Specifications for Portable Welders .......................................................17 8. Equipment Specifications for Portable Steam Cleaners .......................................... 18 9. Equipment Specifications for Portable Miscellaneous Combustion Devices ...........19 10. Train Activity Summary ...........................................................................................21 11. Service and Shop Releases and Load Test ................................................................24 12 Summary of HHD Diesel Truck Activity Data .........................................................25 13. Activity Data for On-Road Diesel-Fueled Trucks ....................................................26 14. Activity Data for Diesel-Fueled Heavy Equipment ..................................................26 15. Activity Data for Storage Tanks ...............................................................................27 16. Locomotive Diesel Particulate Matter Emission Factors ..........................................33 17. Locomotive Diesel Particulate Matter Emission Factors ..........................................34 18. Emission Factors for HHD Diesel-Fueled Trucks ....................................................35 19. Emission Factors for On-Road Diesel-Fueled Trucks ..............................................37 20. Emission Factors for Diesel-Fueled Heavy Equipment ........................................... 38 21. Emission Factors for Sand Tower Operation ........................................................... 39 22. Emission Factors for Wastewater Treatment Plant ...................................................39 23. Emission Factors for Diesel-Fueled Auxiliary Generator Sets ................................ 40 24. Locomotive Duty Cycles ......................................................................................... 40 25. DPM Emissions from Locomotives ......................................................................... 41 26. DPM Emissions from HHD Diesel-Fueled Trucks ..................................................42 27. DPM Emissions from On-Road Diesel-Fueled Trucks .............................................42 28. DPM Emissions from Diesel-Fueled Heavy Equipment ..........................................43 29. TAC Emissions from the WWTP .............................................................................43 30. DPM Emissions from Auxiliary Generator Sets .......................................................43 31. Facility-Wide Diesel Particulate Emissions ..............................................................44 32. Summary of Weighted Risk by Source Category .................................................... 45 33. Summary of De Minimis Sources ............................................................................ 46 34. Source Treatment for Air Dispersion Modeling ...................................................... 48 35. Locomotive Modeling Inputs ................................................................................... 53 36. Non-Locomotive Modeling Inputs ...........................................................................54 37. Sensitive Receptor Locations ................................................................................... 57
CONFIDENTIAL BUSINESS INFORMATION/TRADE SECRET
-vi-
LIST OF APPENDICES Appendix A - Locomotive Data
Appendix B - Emission Factor Derivation, EMFAC-WD 2006 Output, and the Technical
Support Document for HHD Diesel-Fueled Trucks Appendix C - Emission Factor Derivation and EMFAC-WD 2006 Output for On-Road
Diesel-Fueled Trucks Appendix D - Emission Factor Derivation and OFFROAD2006 Output for Heavy
Equipment Appendix E - Emission Factor Derivation and OFFROAD2006 Output for Auxiliary
Generator Sets Appendix F - Detailed Emission Calculations
Appendix G - Detailed Risk Screening Calculations
Appendix H - Source Treatment and Assumptions for Air Dispersion Modeling for Non- Locomotive Sources
Appendix I - Seasonal and Diurnal Activity Profiles
Appendix J - Selection of Population for the Urban Option Input in AERMOD Air
Dispersion Modeling Analysis Appendix K - Demographic Data
CONFIDENTIAL BUSINESS INFORMATION/TRADE SECRET
-1-
Toxic Air Contaminant Emissions Inventory and Air Dispersion Modeling Report
for the Stockton Rail Yard, Stockton, California
PART I. INTRODUCTION
In accordance with the 2005 California Air Resources Board (CARB)/Railroad Statewide
Agreement (MOU), Union Pacific Railroad Company (UPRR) has prepared a facility-
wide emission inventory for the Stockton Rail Yard (Yard) in Stockton, California. The
inventory quantifies emissions of specified toxic air contaminants (TACs) (including
Diesel particulate matter [DPM]) from stationary, mobile, and portable sources at the
Yard. Both source-specific and facility-wide emission estimates are shown. The
inventory has been prepared in accordance with CARB's Rail Yard Emission Inventory
Methodology guidelines (July 2006) and the Emission Inventory Protocol, which UPRR
submitted to CARB in May 2006. Emissions have been calculated for the baseline year
of 2005.
Altamont Commuter Express (ACE) leases a portion of the Diesel Shop, steam cleaning
area, and the locomotive and passenger car wash rack, where locomotive and passenger
car cleaning, service, and repair are performed. Emissions from the ACE-owned and
-operated locomotives and other operations are included in the inventory for the Stockton
Yard.
An air dispersion modeling analysis was also conducted for the Stockton Yard. The
purpose of the analysis was to estimate ground-level concentrations of DPM and other
TACs, emitted from Yard operations, at receptor locations surrounding the Yard out to a
distance of approximately 6 miles. Emission sources included in the modeling analysis
were locomotives and Diesel-fueled heavy equipment. The air dispersion modeling was
conducted using the AERMOD Gaussian plume dispersion model and surface
meteorological data from the Stockton Municipal Airport. The meteorological data was
processed using the AERMET program. The modeling analysis was conducted in
CONFIDENTIAL BUSINESS INFORMATION/TRADE SECRET
-2-
accordance with the Health Risk Assessment Guidance for Rail Yard and Intermodal
Facilities (July 2006) and UPRR's Modeling Protocol (August 2006).
CONFIDENTIAL BUSINESS INFORMATION/TRADE SECRET
-3-
PART II. FACILITY DESCRIPTION
A. Facility Name and Address
Union Pacific Railroad Company Stockton Rail Yard 833 East 8th St. Stockton, CA 95206
B. Facility Contact Information
Jim Diel Manager of Environmental Field Operations Union Pacific Railroad Company 9451 Atkinson St. Roseville, CA 95747 Phone: (916) 789-5184 Fax: (402) 501-2396 [email protected]
C. Main Purpose of the Facility
The Stockton Yard is a support facility for railroad operations. Facilities within the Yard
include classification tracks, a locomotive service track, a locomotive maintenance shop,
a freight car repair shop, a wastewater treatment plant, maintenance-of-way buildings and
storage areas, and various buildings and facilities supporting railroad operations.
D. Type of Operations Performed at the Facility
Activities at the Yard include receiving inbound trains, switching cars, servicing local
customers by picking up and delivering freight cars, building and departing outbound
trains, repairing freight cars, and servicing and repairing locomotives. The Yard includes
two main lines with freight and passenger train traffic; the East Yard, which handles most
of the in-yard freight traffic; the West Yard (the former SP Yard), which is less heavily
used; and a service area with locomotive shop.
Within the Yard, the primary locomotive activities are associated with arriving and
departing "manifest" (mixed freight) trains, and servicing the locomotives that power
1. Exempt from permitting requirements per SJVAPCD Rule 2020, Section 6.6.5. 2. Exempt from permitting requirements per SJVAPCD Rule 2020, Section 6.6.4. 3. Since these tanks are empty, they are not an emission source and will not be included in the
emission inventory or modeling analysis.
Storage tanks with a capacity of 250 gallons or less are exempt from SJVAPCD
permitting requirements per Rule 2020, Section 6.6.4. As shown in Table 5, the
capacities of TNKG-0079 (Diesel), TNKG-0079 (Gasoline), and the ACE tank are less
than 250 gallons; therefore, the tanks are exempt from permitting requirements per Rule
2020, Section 6.6.4. Since the storage tanks are exempt from local air district rules, the
emissions from the tanks were not included in the inventory or the dispersion modeling
analysis, consistent with the UPRR inventory protocol.
SJVAPCD Rule 2020, Section 6.6.5 exempts unheated storage of organic material within
an initial boiling point of 302 °F or greater from permitting requirements. Per the Air
CONFIDENTIAL BUSINESS INFORMATION/TRADE SECRET
-15-
Emission Inventory and Regulatory Analysis Report for the Stockton Rail Yard (Trinity
Consultants, July 2003), laboratory testing was conducted on the contents of the
wastewater and recovered oil tanks at the yard. The testing showed that the initial boiling
point of this material was greater than 302 °F. Therefore, tanks AST-1 and TNKO-0295
are exempt from SJVAPCD permitting requirements per Rule 2020, Section 6.6.5. Since
the storage tanks are exempt from local air district rules, the emissions from the tanks
were not included in the inventory or the dispersion modeling analysis, consistent with
the UPRR inventory protocol.
F. Sand Tower
Locomotives use sand for traction and braking. The sand tower consists of a storage
system and a transfer system. The storage system includes a pneumatic delivery system
and a storage silo. The transfer system includes a pneumatic transfer system, an elevated
receiving silo, and a moving hopper and gantry system. The system is equipped with a
baghouse for emissions control.
G. Wastewater Treatment Plant
The Stockton Yard also has a wastewater treatment plant (WWTP). Equipment at the
WWTP includes a primary clarifier, a pair of equalization tanks, a secondary clarifier, a
coagulation tank, a mix tank, a dissolved air flotation (DAF) unit, and two storage tanks
used for accumulation of used oil and sludge. Air emission sources at the WWTP are the
two clarifiers.
H. Auxiliary Generator Sets
In addition to the UPRR operated equipment, ACE also operates three commuter trains
that are housed at the Stockton Yard. Each train is equipped with a 750 horsepower,
Diesel-fueled auxiliary generator set to provide air conditioning and lighting to railcars
when the attached locomotive is not operating. Each generator set is a 1998 model year
unit.
CONFIDENTIAL BUSINESS INFORMATION/TRADE SECRET
-16-
I. Heaters
Table 6 summarizes the equipment specifications for the various heaters located at the
Stockton Yard.
Heaters with a rating of 5.0 MMBtu/hr or less and fired exclusively with natural gas or
propane are exempt from SJVAPCD permitting requirements per Rule 2020, Section
6.1.1. As shown in Table 6, all of the heaters at the Stockton Yard have a rated capacity
of less than 5.0 MMBtu/hr and are fired exclusively with natural gas or propane.
Table 6 Equipment Specifications for Heaters
Stockton Rail Yard
Location
Heater Type
Fuel Type Rating
(MMBtu/hr) Yard Office Space Heater Natural Gas 0.065 Yard Office Space Heater Natural Gas 0.065 Yard Office Space Heater Natural Gas 0.065 Yard Office Water Heater Natural Gas 0.035 Signal Shop Space Heater Propane 0.125 Engineering Office Space Heater Natural Gas 0.05 Engineering Office Space Heater Natural Gas 0.05 Engineering Office Space Heater Natural Gas 0.05 Engineering Office Space Heater Natural Gas 0.05 Engineering Office Space Heater Natural Gas 0.05 Engineering Office Space Heater Natural Gas 0.05 Notes:
1. Heaters with a rating of 5.0 MMBtu/hr or less and fired exclusively with natural gas or propane are exempt from SJVAPCD permitting requirements per Rule 2020, Section 6.1.1.
Therefore, these heaters are exempt from SJVAPCD permitting requirements. Since the
heaters are exempt from local air district rules, the emissions from the heaters were not
included in the inventory or the dispersion modeling analysis, consistent with the UPRR
inventory protocol.
CONFIDENTIAL BUSINESS INFORMATION/TRADE SECRET
-17-
J. Welders
A variety of portable welders are used in Yard operations. Equipment specifications for
welders used at the Yard are shown in Table 7.
Internal combustion engines rated at 50 hp or less are exempt from SJVAPCD permitting
requirements per Rule 2020, Section 6.1.2. As shown in Table 7, the rating of each of the
portable welders at the Stockton Yard is less than 50 hp. Therefore, these units are
exempt from permitting requirements per Rule 2020, Section 6.1.2. In addition, Rule
2020, Section 6.10 exempts welding equipment and operations from permitting
requirements. Since the welders are exempt from local air district rules, the emissions
from the welders and welding operations (acetylene and rod/electrode use) were not
included in this inventory or in the dispersion modeling analysis, consistent with the
UPRR inventory protocol.
Table 7 Equipment Specifications for Portable Welders
Stockton Rail Yard Equipment Location Fuel Type Rating (hp) No. of Units
One Spot Car Department Gasoline 16 1 One Spot Car Department Gasoline 15 2 One Spot Car Department Gasoline 12.5 5 Boom Truck Diesel 20 1 Boom Truck Diesel 40 1 Boom Truck Diesel 35 1 Locomotive Maintenance Truck Gasoline 20 1 Bridge Maintenance Gasoline 16 2 Bridge Maintenance Gasoline 16 1 WWTP Repair Truck Gasoline 16 1 Notes:
1. Welding equipment and operations are exempt from SJVAPCD permitting requirements per Rule 2020, Section 6.10.
2.
Internal combustion engines rated at 50 hp or less are exempt form SJVAPCD permitting requirements per Rule 2020, Section 6.1.2.
K. Steam Cleaners
Both UPRR and ACE own and operate steam cleaners at the Yard. Equipment
specifications for the portable steam cleaners are shown in Table 8.
CONFIDENTIAL BUSINESS INFORMATION/TRADE SECRET
-18-
Table 8 Equipment Specifications for Portable Steam Cleaners
Stockton Rail Yard
Location
Make Emission
Unit Fuel Type
Rating (MMBtu/hr or hp)
Locomotive Maintenance Unknown Pump Electric NA
Heater Diesel 0.245 ACE Lambda Pump Gasoline 11
Heater Diesel 0.245 Locomotive Maintenance (Contractor Owned) North Star Pump Gasoline 13
Heater Diesel 0.245 Notes:
1. Internal combustion engines rated at 50 hp or less are exempt from SJVAPCD requirements per Rule 2020, Section 6.1.2.
2. Diesel-fueled heaters are "low emitting units" per Rule 2020, Section 3.6.
Internal combustion engines rated at 50 hp or less are exempt from SJVAPCD permitting
requirements per Rule 2020, Section 6.1.2. As shown in Table 9, the rating of the pumps
in each portable steam cleaner at the Stockton Yard is less than 50 hp. Therefore, the
pumps in these units are exempt from permitting requirements per Rule 2020, Section
6.1.2. In addition, Rule 2020, Section 3.6 exempts "low emitting units" from permitting
requirements. Based on the small size and limited use, these units qualify as "low
emitting units" and are therefore exempt from permitting requirements. Since the steam
cleaners are exempt from local air district rules, the emissions from these units were not
included in this inventory or in the dispersion modeling analysis, consistent with the
UPRR inventory protocol.
L. Miscellaneous Combustion Devices
A variety of portable equipment is used to support Yard operations. Equipment
specifications for the other miscellaneous portable combustion devices operated at the
Stockton Yard are shown in Table 9.
CONFIDENTIAL BUSINESS INFORMATION/TRADE SECRET
-19-
Table 9 Equipment Specifications for Portable Miscellaneous Combustion Devices
Stockton Rail Yard Location Equipment Type Fuel Type Rating (hp)
MoW Repair Compound Hydraulic Power Pack Gasoline 18 MoW Repair Compound Pressure Washer Gasoline 18 One Spot Car Department Air Compressor Gasoline 5 Locomotive Repair Pressure Washer Diesel 10 Locomotive Repair Pressure Washer Diesel 10 Bridge Maintenance Hydraulic Jack Gasoline 5.5 Maintenance Crew Air Compressor Gasoline 5 Note:
1. Internal combustion engines rated at 50 hp or less are exempt from SJVAPCD requirements per Rule 2020, Section 6.1.2.
As previously discussed, internal combustion engines rated at 50 hp or less are exempt
from SJVAPCD permitting requirements per Rule 2020, Section 6.1.2. As shown in
Table 9, the rating of each portable combustion device at the Stockton Yard is less than
50 hp. Therefore, these units are exempt from permitting requirements per Rule 2020,
Section 6.1.2. Since the portable equipment is exempt from local air district rules, the
emissions from these units were not included in this inventory or in the dispersion
modeling analysis, consistent with the UPRR inventory protocol.
CONFIDENTIAL BUSINESS INFORMATION/TRADE SECRET
-20-
PART VI. ACTIVITY DATA
Emissions from mobile sources are based on the number and type of equipment,
equipment size, load factor, and operation during the baseline year of 2005. Since fuel
consumption data were not available, the default load factors from the OFFROAD2006
model and operating data were used for emission calculations. For sources where
operating data weren't available, an average operating mode (AOM) was developed
based on employee interviews.
A. Locomotives
Locomotive emissions were based on the number, model distribution, and operating
conditions (idling, throttle notch, and speeds of movements, etc). Table 10 summarizes
the activity data for locomotives operating on trains at the Stockton Yard, including the
number of trains and number of working locomotives per consist, as well as their idle and
working time, and speed on arrival or departure. In general, arriving trains enter the Yard
and stop while the railcars are detached from the locomotive. After the railcars have been
detached, the locomotives move to the service area for refueling. On departure,
locomotive consists are moved from the service area to the appropriate end of an
outbound train. The train departs after completion of the Federal Railroad
Administration (FRA) mandated safety inspections (e.g., air pressure and brakes) and the
arrival of the train crew. In some cases, trains that are nominally "through" trains
(arriving and departing under the same train symbol and date) add or drop cars or
locomotives at the Stockton Yard. These trains are counted separately, as the idling
period is shorter prior to departure, and the locomotive consist is not disconnected nor
moved to the service track.
CONFIDENTIAL BUSINESS INFORMATION/TRADE SECRET
Table 10 Train Activity Summary
Stockton Rail Yard
Train Type
East Bound West Bound Arrival/Departing Speed (mph)
1. Data reflects the number of operating locomotives; locomotives that are being transported, but are not under power, are not shown. 2. In addition to the activities described above, three sets of GP-38s and a pair of switcher locomotives were used for yard operation. 3. Power move idling is included in service time.
-21-
CONFIDENTIAL BUSINESS INFORMATION/TRADE SECRET
-22-
The Yard also provides service and maintenance for the road power on trains arriving and
departing from other locations. Arriving trains from mountainous routes will typically
have higher available horsepower per trailing ton than trains operating in flatter terrain.
This can result in "surplus" power, which is sent to other locations for use. In some
cases, power moves may occur without a train symbol being assigned, with the
result that it does not appear in the train database used to develop locomotive activity
data. The total locomotive count for arriving and departing locomotives on trains shows
a net imbalance of approximately 700 locomotives for 2005. For purposes of emission
calculations, it is assumed that this imbalance represents outbound power moves from
Stockton to other locations, with the same average consist size and proportion of east-
bound and west-bound units as other identified power moves. This results in a net
balance in the number of arriving and departing locomotives. Although power moves
may have as many as 10 or more locomotives, typically only one or two locomotives are
actually working. For emission calculations, power moves were assumed to have 1.5
working locomotives (except for power moves involving just one locomotive).1 In
addition to road power, four sets of yard locomotives operate in the yard to move sections
of inbound trains, spot them in the appropriate areas for handling, and subsequently
reconnect these sections and move them to the appropriate outbound train areas. One set
of GP-38s operates between 4 PM and 4 AM in the SP Yard; two sets of GP-38s operate
at the south end of the East Yard (one 24 hours per day, and the other 16 hours per day);
and a set of switchers operates at the north end of the East Yard 24 hours per day.
A separate database provided information on each locomotive handled by the service area
and locomotive maintenance shop at Stockton. Locomotive servicing and maintenance
involve routine activities to ready a locomotive for operation (refueling, checking oil
levels, etc.) as well as a broad range of maintenance activities including both minor
repairs (light bulbs, paint, etc.) and major repairs of locomotive components (traction
motor replacement, and Diesel engine maintenance requiring load testing). Based on
detailed information on the reason and type of service or maintenance performed,
1 UP personnel report that although the train data records for power moves may show all locomotives "working," in actuality all locomotives except for one at the front and rear end (and more commonly only one at the front end) are shut down as they are not needed to pull a train that consists only of locomotives. Assuming 1.5 working locomotives per power move may slightly overestimate the actual average number of working locomotives per power move.
CONFIDENTIAL BUSINESS INFORMATION/TRADE SECRET
-23-
separate counts of service and maintenance activities were developed, as detailed in
Table 11.
Routine service of locomotives involves idling and short movements in the service area
associated with refueling, oiling, and other service activities prior to their movement to
the ready track area where locomotives are consisted for outbound trains. If maintenance
is required at the locomotive shop, additional short movements and idling occur.
Depending on the type of maintenance, load testing prior to and after maintenance may
be performed. The number of these events was determined based on the location and
service codes for each locomotive maintenance event in the database.
Based on estimates provided by UPRR personnel for the Roseville Rail Yard Study
(October 2004), routine servicing of a locomotive occurs over several hours, during
which time the locomotive may be idling or shut down (if equipped with ZTR/AESS2
technology). Locomotives must be idling during oil checks. Following service, there is a
second two-hour period during which the locomotives may be idling or shut down. For
emission calculations, it is assumed that ZTR/AESS-equipped locomotives idle for ½
hour during service and ½ hour after service, and that other units idle for two hours
during and two hours after service.
Locomotives that are identified as undergoing maintenance at the locomotive shop (a
separate facility from the service area) are assumed to have two additional one-hour
idling periods before and after maintenance, based on estimates provided by UPRR
personnel for the Roseville Rail Yard Study. The emissions generated during the short
movements between the service area and shop are included with the idling emissions.
ZTR/AESS-equipped units are assumed to idle for only ½ hour of each of these periods.
Load testing is required by the FRA for periodic quarterly, semiannual, and annual
maintenance, and may also be performed as part of unscheduled maintenance. Service
2 There are two primary types of auto start/stop technology-"Auto Engine Start Stop" (AESS), which is factory-installed on recent model high horsepower units; and the ZTR "SmartStart" system (ZTR), which is a retrofit option for other locomotives. Both are programmed to turn off the Diesel engine after 15 to 30 minutes of idling, provided that various criteria (air pressure, battery charge, and others) are met. The engine automatically restarts if required by one of the monitored parameters. We assume that an AESS/ZTR-equipped locomotive will shut down after 30 minutes of idling in an extended idle event.
CONFIDENTIAL BUSINESS INFORMATION/TRADE SECRET
-24-
and shop databases were used to identify the number of each type of events, as well as the
locomotive model, tier, and ZTR/AESS technology distributions. Emission factors were
developed for the model distribution for all units in service, and also for the model
distribution of the subset of units that underwent load testing. Post-maintenance load
testing at Commerce is conducted at the west end of the service building and is assumed
to include opacity testing as part of the load testing. The total emissions associated with
service and shop activities are the sum of idling during and after service, idling before
and after shop maintenance, and load testing. The emissions from shop and service
activities are shown in Part VII.
The specific nature (duration and throttle setting) of such load testing events is described
in Part VII. For ACE locomotives, it was assumed that each of the five locomotives had
four load test events per year in conjunction with routine 92-day, semi-annual, and annual
Emissions from HHD Diesel-fueled trucks are based on the number of truck trips, the
length of each trip, and the amount of time spent idling. As shown in Table 2, a small
fleet of HHD trucks is used to move heavy equipment that is housed in the Yard to
locations along the main lines where maintenance is needed. It was assumed that each
CONFIDENTIAL BUSINESS INFORMATION/TRADE SECRET
-25-
truck made one round trip per day. The VMT per trip is based on the distance from the
equipment parking area to the Yard entrance. Based on operator interviews, it was
assumed that each truck idled no more than 5 minutes per trip. Table 12 summarizes the
activity data for HHD Diesel-fueled trucks operating at the Yard.
Table 12 Summary of HHD Diesel Truck Activity Data
Stockton Rail Yard Number of
Truck Trips1 VMT Per Trip2
VMT per Year Idling
(mins/trip)3 (hr/yr) 2,920 0.5 1,460 5 243
Notes: 1. Number of truck trips is equal to 8 vehicles at 1 round trip (in and out of the yard) per day. 2. VMT per trip based on the distance from the equipment parking area to the gate. 3. Idling time per day based on interviews with UPRR personnel.
C. On-Road Diesel-Fueled Trucks
Emissions from the on-road Diesel-fueled trucks operating at the Yard are based on the
vehicle class, engine model year, annual vehicle miles traveled (VMT), and the amount
of time spent idling. Annual VMT was estimated based on the total vehicle mileage and
the amount of time the vehicle operated in the Yard, as estimated by UPRR personnel.
Table 13 summarizes the activity data for the other on-road Diesel-fueled trucks
operating at the Yard.
CONFIDENTIAL BUSINESS INFORMATION/TRADE SECRET
-26-
Table 13 Activity Data for On-Road Diesel-Fueled Trucks
1. Annual VMT estimated by UPRR personnel based on total vehicle mileage and the amount of time the vehicle operated in the Yard.
2. Idling time (min/day) estimated by UPRR personnel.
D. Heavy Equipment
Emissions from heavy equipment operating at the Yard are based on the number and type
of equipment, equipment model year, equipment size, and the annual hours of operation.
Annual hours of operation are based on operator interviews. The activity data for the
Diesel-fueled heavy equipment are summarized in Table 14.
Table 14 Activity Data for Diesel-Fueled Heavy Equipment
Stockton Rail Yard Equipment
Type
Make/Model Model Year
Rating (hp)
Hours of Operation (hr/yr)
Backhoe John Deere 610C 1992 95 300 Backhoe Case 480C Pre-1990 177 30 Trackmobile Trackmobile TM4000 1990 115 730 Fork Lift Clark Pre-1985 47.5 10 Crane Pettibone 25RS 1970 122 120 Crane Century 6CT8-3-C 1980 215 15 Forklift JCB930 2000 75 365 Notes: 1. Hours of operation estimated by UPRR personnel.
CONFIDENTIAL BUSINESS INFORMATION/TRADE SECRET
-27-
E. Tanks
Emissions from the non-exempt storage tanks located at the Stockton Yard are based on
the size of the tank, material stored, and annual throughput. Activity data for the non-
exempt tanks are shown in Table 15.
Table 15 Activity Data for Storage Tanks
Stockton Rail Yard
Tank No.
Location
Material Stored Throughput (gal/yr)1,2
TNKO-0294 WWTP Sludge 8,000 TNKS-0056 WWTP Industrial Storm water 1,562,030 TNKD-9010 WWTP Industrial Storm water 1,562,030
Notes: 1. Annual throughput provided by UPRR personnel. 2. Equal to the annual process rate for the WWTP.
F. Sand Tower
Emissions from the sand tower are based on the annual sand throughput. Records of
actual material throughput for the sand tower were not readily available. Therefore, the
monthly sand throughput limit contained in the SJVAPCD Permit to Operate for this
source was used. The Permit limits sand throughput to 26 tons per month or 312 tons per
year.
G. Wastewater Treatment Plant
Emissions were also calculated for the WWTP. Per the WWTP operator records, during
the 2005 baseline year the WWTP processed 1,562,030 gallons of wastewater.
CONFIDENTIAL BUSINESS INFORMATION/TRADE SECRET
-28-
H. Auxiliary Generator Sets
As previously discussed, the auxiliary generator sets are located on the three passenger
trains owned and operated by ACE and are used to provide air conditioning and lighting.
The generator set on one train is operated each weeknight to provide air conditioning and
lighting for cleaning and maintenance crews. The other two trains are connected to
trackside power; therefore, the generators are not used. Per discussions with ACE
personnel, the generator operates 9 hours per day, 5 days per week (8:00 p.m. to 5:00
a.m. from Sunday through Friday). The total annual hours of operations (2,340 hours)
were allocated evenly between the three generators.
CONFIDENTIAL BUSINESS INFORMATION/TRADE SECRET
-29-
PART VII. EMISSIONS
A. Calculation Methodology and Emission Factors
Emission calculations were based on the site-specific equipment inventory, equipment
activity data, and the source-specific emission factors. The calculation methodology and
emission factors for each specific source type are further discussed below. Emissions
were calculated in accordance with CARB Guidelines (July 2006) and the UPRR
Emission Inventory Protocol.
1. Locomotives
Emissions were calculated for UPRR-owned and -operated locomotives, as well as
"foreign" locomotives3 operating in the rail yard, and through trains on the main lines.
Procedures for calculating emissions followed the methods described in Ireson et al.
(2005).4 A copy of Ireson et al is contained in Appendix A-6.
Emissions from locomotive activities were calculated based on the number of working
locomotives, time spent in each notch setting, and locomotive model-group distributions,
with model groups defined by manufacturer and engine type.5 A separate calculation was
performed for each type of locomotive activity, including line-haul or switcher
locomotive operations, consist movements, locomotive refueling, and pre- and-post
locomotive service and maintenance testing. Speed, movement duration, and throttle
notch values were obtained from UPRR personnel for the Stockton Yard for different
types of activities. Detailed counts of locomotive by model, tier and train type are
shown in Appendix A-1 and A-2. Maps detailing the principal locomotive routes at the
Yard are contained in Appendix A-5.
3 Foreign locomotives are locomotives not owned by UPRR, including passenger trains and locomotives owned by other railroads that are brought onto the UPRR system via interchange. 4 Ireson, R.G., M.J. Germer, L.A. Schmid (2005). "Development of Detailed Railyard Emissions to Capture Activity, Technology, and Operational Changes." Proceedings of the USEPA 14th Annual Emission Inventory Conference, http://www.epa.gov/ttn/chief/conference/eil4/session8/ireson.pdf, Las Vegas NV, April 14, 2006. 5 Emission estimates are based on the total number of working locomotives. Therefore, the total number of locomotives used in the emission calculations, shown in Table 10, is slightly lower than the total number of locomotives counted as arriving, departing, or through trains (shown in Table 1). See Appendix A for detailed emission calculations.
Notes: 1. EPA Regulatory Support Document, "Locomotive Emissions Regulation," Appendix B, 12/17/97, as tabulated by ARB and ENVIRON 2. Base emission rates provided by ENVIRON as part of the BNSF analyses for the Railyard MOU (Personal communication from Chris Lindhjem to R. Ireson,
2006) based on data produced in the AAR/SwRI Exhaust Plume Study (Personal communication from Steve Fritz to C. Lindhjem, 2006). 3. SwRI final report "Emissions Measurments - Locomotives" by Steve Fritz, August 1995. 4. Manufacturers' emissions test data as tabulated by ARB. 5. Base SD-70 emission rates taken from data produced in the AAR/SwRI Exhaust Plume Study (Personal communication from Steve Fritz to R. Ireson, 2006). 6. Average of manufacturer's emissions test data as tabulated by ARB and data from the AAR/SwRI Exhaust Plume Study, tabulated and calculated by ENVIRON..
CONFIDENTIAL BUSINESS INFORMATION/TRADE SECRET
-35-
2. HHD Diesel-Fueled Trucks
Emission estimates for the HHD Diesel-fueled trucks are based on the number of trucks
by model year and annual VMT within the Yard. Per CARB guidelines, the emissions
from idling and traveling modes have been separated because different source treatments
(point or volume source) will be used in the air dispersion modeling analysis for these
modes. A fleet-weighted average emission factor for traveling emissions was calculated,
based on the model year distribution provided by UPRR (see Table 2), using the
EMFAC-WD 2006 model with the BURDEN output option. Fleet-weighted idling
emission factors were calculated, based on the model year distribution provided by
UPRR, using the EMFAC-WD 2006 model with the EMFAC output option. The
emission factors for the HHD Diesel-fueled trucks are shown in Table 18. Detailed
emission factor derivation calculations and EMFAC-WD 2006 output are contained in
Appendix B.
Table 18 Emission Factors for HHD Diesel-Fueled Trucks
Stockton Rail Yard Operating Mode
Fleet Weighted Emission Factors ROG CO NOx DPM4 SOx
1. Traveling exhaust emission factors were calculated from EMFAC-WD 2006 with the BURDEN output option. 2. Idling exhaust emission factors were calculated from EMFAC-WD 2006 with the EMFAC output option.
-37-
CONFIDENTIAL BUSINESS INFORMATION/TRADE SECRET
-38-
Table 20 Emission Factors for Diesel-Fueled Heavy Equipment
Stockton Rail Yard Equipment Type
Make/Model
Model Year
Exhaust and Crankcase Emission Factors (g/hp-hr)1
VOC2 CO NOx DPM3,4 SOx4 Backhoe John Deere 610C 1992 1.87 4.64 10.47 0.98 0.06 Backhoe Case 480C Pre-1990 1.93 5.72 13.73 0.90 0.06
1. Emission factors from CARB's OFFROAD2006 model. 2. VOC evaporative emissions are negligible. 3. Diesel PM10 (DPM) is a TAC. 4. Assumes a Diesel fuel sulfur content of 130 ppm.
6. Sand Tower
Emission estimates for the sand tower are based on annual sand throughput and emission
factors from EPA's AP-42 document.6 The sand transfer system consists of two parts:
pneumatic transfer and gravity transfer. The pneumatic transfer system is similar to those
used to unload cement at concrete batch plants. The gravity feed system is similar to the
sand and aggregate transfer operations at concrete batch plants. Therefore, emissions
were calculated using the AP-42 emission factors for concrete batch plants. As
previously discussed, the system is equipped with a baghouse for emission control.
Therefore, the AP-42 emission factors for a controlled system were used. The emission
factors are shown in Table 21.
6 USEPA. Compilation of Air Pollutant Emission Factors, Volume 1, Stationary Point and Area Sources, Chapter 11, June 2006.
CONFIDENTIAL BUSINESS INFORMATION/TRADE SECRET
-39-
Table 21 Emission Factors for Sand Tower Operations
1. Emission factor from AP-42, Table 11.12-5, 6/06. Factor for controlled pneumatic cement unloading to elevated storage silo was used. The unit is equipped with a fabric filter.
2. Emission factor from AP-42, Table 11.12-5, 6/06. Factor for sand transfer was used. 3. There are no TAC emissions from this source.
7. Wastewater Treatment Plant
Emission estimates for the WWTP were based on emission rates from the Air Emission
Inventory and Regulatory Analysis Report for Stockton Yard (Trinity Consultants, July
2003) and the annual wastewater flow rate. Emission rates were calculated by Trinity
Consultants using EPA's WATER9 program. The emission rates are shown in Table 22.
Table 22 Emission Factors for the Wastewater Treatment Plant
Stockton Rail Yard Pollutant Emission Rate (grams/sec) Benzene 2.26 x 10⁻⁷ Bis (2-ethylhexyl) Phthalate 2.28 x 10⁻⁷ Bromomethane 4.40 x 10⁻⁷ Chloroform 2.74 x 10⁻⁷ Ethylbenzene 1.14 x 10⁻⁶ Methylene Chloride 5.15 x 10⁻⁶ Toluene 1.39 x 10⁻⁶ Xylene 2.67 x 10⁻²¹ Total 8.85 x 10⁻⁶ Notes: 1. Emission rates from Air Emission Inventory and Regulatory Analysis for Stockton Yard, Trinity Consultants, July 2003.
8. Auxiliary Generator Sets
Emission estimates for the ACE-owned and -operated Diesel-fueled auxiliary generator
sets are based on the model year and the hours of operation within the Yard. Emission
factors were calculated using CARB's OFFROAD2006 model. The emission factors for
CONFIDENTIAL BUSINESS INFORMATION/TRADE SECRET
-40-
the generators are shown in Table 23. Detailed emission factor derivation calculations
and OFFROAD2006 output are contained in Appendix E.
Table 23 Emission Factors for Diesel-Fueled Auxiliary Generator Sets
Stockton Rail Yard
Equipment Type
Model Year
Exhaust and Crankcase Emission Factors (g/hp-hr)1
VOC2 CO NOx DPM3,4 SOx4 Aux. Generator Set 1998 0.419 0.966 6.175 0.40 0.053 Notes:
1. Emission factors from CARB's OFFROAD2006 model. 2. VOC evaporative emissions are negligible. 3. Diesel PM10 (DPM) is a TAC. 4. Assumes a Diesel fuel sulfur content of 130 ppm.
B. TAC Emissions by Source Type
TAC emission calculations for each source type were based on the site-specific
equipment inventory (shown in Part V of this report), equipment activity data (shown in
Part VI of this report), and the source-specific emission factors shown in Part VII.A
above.
Emissions from locomotive operations were based on the emission factors shown in
Tables 16 and 17, the number of events, the number of locomotives per consist, duration,
and duty cycle of different types of activity. Table 24 shows the duty cycles assumed for
Activity Duty Cycle Through train movement EB: N4 - 100%; WB: N3- 100% Movements within the yard N1 - 50%, N2- 50% Yard operations EPA Switch Duty Cycle1 Notes: 1. EPA (1998) Regulatory Support Document.
CONFIDENTIAL BUSINESS INFORMATION/TRADE SECRET
-41-
For locomotive models and tiers for which specific emission factors were not available,
the emissions for the next lowest tier were used, or the next highest tier if no lower tier
data were available. Emission factors for the "average locomotive" for different types of
activity were developed from the emission factors and the actual locomotive model and
technology distributions for that activity. Separate distributions were developed for
seven types of activity: through trains (including through power moves); eastbound
freight; westbound freight; arriving and departing power moves; ACE arrivals and
departures; GP-38 yard operations; and switcher yard operations. Table 25 shows the
TAC emission estimates for the different types of activities.
Table 25 DPM Emissions from Locomotives
Stockton Rail Yard Activity DPM Emissions (tpy)
Through trains 0.381 Freight trains 1.276 ACE trains 0.418 Power moves 0.005 Yard operations 3.578 Service and Shop Idling 0.782 Load tests 0.032 Total 6.472 Notes:
1. See Table 1 for equipment specifications. 2. See Table11 for activity data. 3. See Tables 16 and 17 for emission factors. 4. Emissions from yard operations are based on the locomotive type and the hours of operation for
each captive unit, the EPA Switch Duty Cycle, and the emission factors shown in Tables 16 and 17.
5. See Appendices A-3 and A-4 for detailed emission calculations. The calculations of sulfur adjustments are shown in Appendix A-7.
DPM emissions from HHD Diesel-fueled trucks are shown in Table 26. DPM emissions
from on-road Diesel-fueled trucks are shown in Table 27. Table 28 summarizes the DPM
emissions from Diesel-fueled heavy equipment operating at the Yard. TAC emissions
from the WWTP emissions are shown in Table 29. DPM emissions from the Diesel-
fueled auxiliary generator set are shown in Table 30. As discussed above, emissions
from storage tanks AST-3, AST-5, and AST-6 are negligible and there are no TAC
CONFIDENTIAL BUSINESS INFORMATION/TRADE SECRET
-42-
emissions from sand tower operations. Detailed emission calculations for each source
group are contained in Appendix F.
Table 26 DPM Emissions from HHD Diesel-Fueled Trucks
1. See Table 3 for equipment inventory. 2. See Table 13 for activity data. 3. See Table 19 for emission factors.
CONFIDENTIAL BUSINESS INFORMATION/TRADE SECRET
-43-
Table 28 DPM Emissions from Diesel-Fueled Heavy Equipment
Stockton Rail Yard Equipment Type Make/Model Model Year Emissions (tpy) Backhoe John Deere 610C 1992 0.017 Backhoe Case 480C Pre-1990 0.003 Trackmobile Trackmobile TM4000 1990 0.064 Forklift Clark Pre-1985 0.000 Crane Pettibone 25RS 1970 0.005 Crane Century 6CT8-3-C 1980 0.001 Forklift JCB930 2000 0.009 Total 0.099 Notes:
1. See Table 4 for equipment inventory. 2. See Table 14 for activity data. 3. See Table 20 for emission factors.
Table 29 TAC Emissions from the WWTP
Stockton Rail Yard Pollutant Emissions (tpy)
Benzene 1.11 x 10⁻⁵ Bis (2-ethylhexyl) Phthalate 1.12 x 10⁻⁵ Bromomethane 2.15 x 10⁻⁵ Chloroform 1.34 x 10⁻⁵ Ethylbenzene 5.58 x 10⁻⁵ Methylene Chloride 2.52 x 10⁻⁴ Toluene 6.81 x 10⁻⁵ Xylene 1.31 x 10⁻¹⁹ Total 4.33 x 10⁻⁴ Notes:
1. See Part V for equipment inventory. 2. See Part VI for activity data. 3. See Table 22 for emission factors.
Table 30 DPM Emissions from Auxiliary Generator Sets
Stockton Rail Yard Equipment Type DPM Emissions (tpy)
Auxiliary Generator Sets 0.068 Notes:
1. See Part V for equipment specifications. 2. See Part VI for activity data. 3. See Table 23 for emission factors.
CONFIDENTIAL BUSINESS INFORMATION/TRADE SECRET
-44-
C. Facility Total Emissions
Facility-wide DPM emissions are shown in Table 31. The only source of TAC emissions
other than DPM is the WWTP. Therefore, other TAC emissions are summarized in
1. See Table 25. 2. See Table 26. 3. See Table 27. 4. See Table 28. 5. See Table 30.
CONFIDENTIAL BUSINESS INFORMATION/TRADE SECRET
-45-
PART VIII: RISK SCREENING CALCULATIONS
As discussed in Part IV of this report and agreed upon with CARB, de minimis sources,
based on weighted health risk, were identified in the inventory but were not included in
the modeling analysis. De minimis sources are the individual source categories that
represent less than 3 percent of the facility-total weighted-average site health impacts
(determined separately for cancer risk and non-cancer chronic health hazard). Total
exclusions for all de minimis sources did not exceed 10 percent of the facility-total
weighted-average site health impacts.
The OEHHA unit risk factor for each pollutant was multiplied by the annual emissions of
that pollutant to generate a risk index value for each source. Each source-specific risk
index was divided by the facility total risk index to get the fractional contribution to the
total risk for each source. Table 32 summarizes the cancer risk, the non-cancer health
hazard index, and the fractional contribution to the cancer risk and non-cancer chronic
health hazard for each source. Detailed cancer risk and non-cancer health hazard index
calculations are in Appendix G.
Table 32 Summary of Weighted Risk by Source Category
Stockton Rail Yard
Non-Cancer Chronic Cancer Risk
Health Hazard
Health Percent of Risk Index Percent of Hazard Total
Source Value Total Risk Index Value Hazard Locomotives 1.94 x 10⁻³ 94.90 3.24 x 101 94.24 HHD Diesel-Fueled Trucks 5.21 x 10⁻⁵ 2.55 8.69 x 10⁻¹ 2.53 On-Road Diesel-Fueled Trucks 2.23 x 10⁻⁶ 0.11 3.71 x 10⁻² 0.11 Heavy Equipment 2.97 x 10⁻⁵ 1.45 4.95 x 10⁻¹ 1.44 WWTP 6.44 x 10⁻¹⁰ 0.00 2.38 x 10⁻¹ 0.69 Auxiliary Generator Sets 2.03 x 10⁻⁵ 0.99 3.38 x 10⁻¹ 0.99 Total 2.05x 10⁻³ 100 3.43 x 101 100
Sources that represent less than 3 percent each of the facility-total weighted-average
cancer risk and non-cancer chronic risk, as shown in Table 32, are de minimis. Table 33
lists the de minimis sources for the Stockton Yard.
CONFIDENTIAL BUSINESS INFORMATION/TRADE SECRET
-46-
Table 33 Summary of De Minimis Sources
Stockton Rail Yard De minimis Sources for
Cancer Risk De Minimis Sources for
Non-Cancer Chronic Health Hazard HHD Diesel-Fueled Trucks On-Road Diesel-Fueled Trucks Heavy Equipment Auxiliary Generator Sets WWTP
and the WWTP) are not included in the dispersion modeling analysis. At CARB's
request, heavy equipment was included in the dispersion modeling analysis
notwithstanding their de minimis risk contribution.
CONFIDENTIAL BUSINESS INFORMATION/TRADE SECRET
-47-
PART IX: AIR DISPERSION MODELING
An air dispersion modeling analysis was conducted for the Stockton Yard. The purpose
of the analysis was to estimate ground-level concentrations of DPM and other TACs,
emitted from Yard operations, at receptor locations surrounding the Yard out to a
distance of approximately 6 miles. Air dispersion modeling was conducted in accordance
with the Health Risk Assessment Guidance for Rail Yard and Intermodal Facilities (July
2006) and UPRR's Modeling Protocol (August 2006). Each aspect of the modeling is
further described below.
A. Model Selection and Preparation
1. Modeled Sources and Source Treatment
As discussed in Part VIII, only sources that represent more than 3 percent of the facility-
total weighted-average site health impacts (determined separately for cancer risk and
non-cancer chronic health hazard) were included in the dispersion modeling analysis. At
the request of CARB, heavy equipment was included as well, notwithstanding their
de minimis risk contribution. Emissions from heavy equipment and moving locomotives
were simulated as a series of volume sources along their corresponding travel routes and
work areas. Idling and load testing of locomotives was simulated as a series of point
sources within the areas where these events occur. The elevation for each source was
interpolated from a 50 m grid of USGS terrain elevations. Table 34 shows the sources
that were included in the modeling analysis and treatment used for each source.
Assumptions used to spatially allocate emissions from locomotive operations within the
Yard are included in Appendix A-4. Assumptions used to spatially allocate emissions
from non-locomotive sources are contained in Appendix H.
CONFIDENTIAL BUSINESS INFORMATION/TRADE SECRET
-48-
Table 34 Source Treatment for Air Dispersion Modeling
Stockton Rail Yard Source Source Treatment
Locomotives (idling) Point Locomotives (traveling) Volume Heavy Equipment (idling) Volume Heavy Equipment (traveling) Volume Notes:
1. See Figure 3 for source locations.
CONFIDENTIAL BUSINESS INFORMATION/TRADE SECRET
-49-
Figure 3 Source Locations
CONFIDENTIAL BUSINESS INFORMATION/TRADE SECRET
-50-
2. Model Selection
Selection of air dispersion models depends on many factors, including the type of
emissions source (point, line, or volume) and type of terrain surrounding the emission
source. The USEPA-approved guideline air dispersion model, AERMOD, was selected
for this project. AERMOD is recommended by EPA as the preferred air dispersion
model, and is the recommended model in CARB's Health Risk Assessment Guidance for
Rail Yard and Intermodal Facilities (July 2006).
AERMOD is a steady-state,7 multiple-source, Gaussian dispersion model designed for
use with emission sources situated in terrain where ground elevations can exceed the
release heights of the emission sources (i.e., complex terrain).8 AERMOD was used with
hourly wind speed and direction, temperature and cloud cover data from the Stockton
Municipal Airport. AERMOD used these parameters to select the appropriate dispersion
coefficients.
Standard AERMOD control parameters were used, including stack-tip downwash, non-
screening mode, non-flat terrain, and sequential meteorological data check. Following
USEPA guidance, the stack-tip downwash option adjusted the effective stack height
downward following the methods of Briggs (1972) for stack exit velocities less than 1.5
times the wind speed at stack top.
Two AERMET preprocessors (Stages 1 and 2, and Stage 3) were used to prepare
meteorological data for use in AERMOD. Surface roughness, albedo and Bowen ratio9
were estimated in multiple wind direction sectors surrounding the meteorological
monitoring site at the Stockton Municipal Airport. The Yard is close enough to the
7 The term "steady-state" means that the model assumes no variability in meteorological parameters over a one-hour time period. 8 Federal Register, November 9, 2005; Volume 70, Number 216, Pages 68218-68261. 9 The albedo of a specified surface is the ratio of the radiative flux reflected from the surface to the radiative flux incident on the surface. Flux is the amount of energy per unit time incident upon or crossing a unit area of a defined flat plane. For example, the albedo for snow and ice varies from 80% to 85% and the albedo for bare ground from 10% to 20%. Bowen ratio is the ratio of heat energy used for sensible heating (conduction and convection) of the air above a specified surface to the heat energy used for latent heating (evaporation of water or sublimation of snow) at the surface. The Bowen ratio ranges from 0.1 for the ocean surface to more that 2.0 for deserts; negative values are also possible.
CONFIDENTIAL BUSINESS INFORMATION/TRADE SECRET
-51-
airport so that the selection of values for these three parameters in sectors around the
airport is reasonably representative of the same parameters around the Yard.
As suggested by USEPA (2000), the surface characteristics were specified in sectors no
smaller than a 30-degree arc. Specifying surface characteristics in narrower sectors
becomes less meaningful because of expected wind direction variability during an hour,
as well as the encroachment of characteristics from the adjacent sectors with a one-hour
travel time. Use of weighted-average10 characteristics by surface area within a 30-degree
(or wider) sector made it possible to have a unique portion of the surface significantly
influence the properties of the sector that it occupies. The length of the upwind fetch for
defining the nature of the turbulent characteristics of the atmosphere in each sector
surrounding the source location was 3 kilometers as recommended by Irwin (1978) and
USEPA's Guideline on Air Quality Models.11
Modeling was based on the annual average emissions for each source as discussed in Part
VII.B above. Diurnal and/or seasonal activity scalars were applied to locomotive
activities and heavy equipment operations. The following profiles were used in the
modeling. See Appendix A-4 for the profiles used and Appendix I for a description of
the methods used to develop these profiles.
A seasonal/diurnal activity profile was calculated for freight locomotive idling
based on the number of arrivals and departures in each hour of the day and the
number of arriving and departing trains in each season. Each hourly factor was
based on the number of arrivals and departures in that hour, the number of arrivals
in the preceding two hours, and the number of departures in the following two
hours. This approach captures the idling times for consists on arrival and
departure. These factors were applied to consist idling for arriving and departing
trains, and idling at the service track.
A seasonal/diurnal activity profile was calculated for in-yard locomotive
movements of road power using the same approach as for idling. In this case,
10 Weighting was based on wind direction frequency, such as determined from a wind rose. 11 USEPA (1986), and published as Appendix W to 40 CFR Part 51 (as revised).
3. Modeling Inputs
CONFIDENTIAL BUSINESS INFORMATION/TRADE SECRET
-52-
however, only the number of arriving and departing trains in a single hour was
used for that hour's factor.
Diurnal profiles were developed for switching operations in the different areas of
the yard based on operating shift schedules for the yard switchers. Seasonal
adjustment factors were not used for yard switching.
A seasonal profile was applied to freight locomotive service activities as the level
of activity increased substantially from the beginning to the end of 2005.
Diurnal profile for ACE commuter train idling and movements were developed
based on their operating schedules. No seasonal adjustment factors were applied
to commuter rail activity.
The volume source release heights and vertical dispersion parameters ( z) were those
used by CARB for the Truck Stop Scenario in Appendix VII of the Diesel Risk
Reduction Plan for mobile vehicles and equipment other than locomotives. For
locomotives, the release height and z values used were those developed by CARB for
daytime and nighttime locomotive movements in the Roseville Risk Assessment
modeling. Stack parameters used to create the AERMOD input file for locomotive
operations are shown in Table 35. Table 36 summarizes the modeling inputs used to
create the AERMOD input file for each non-locomotive source at the Yard.
1 Stack parameters for stationary locomotives taken from the CARB Roseville modeling. 2 Idling road power stack parameters are those of the most prevalent locomotive model (SD-7x). 3 Load test stack parameters are those of the most prevalent locomotive model (SD-7x). 4 All locomotive movements for road power and yard locomotives while working are the day and night volume source parameters for moving locomotives
from the CARB Roseville modeling. 5 Lateral dispersion coefficient ( y) for moving locomotive volume sources was set to values between 20 and 50 m, depending on the spacing of sources in
different areas of the yard and proximity to yard boundaries.
1. Stack parameters from equipment manufacturers. 2. Low level sources treated as volume sources using the release height and vertical dispersion parameter ( z) from the CARB Diesel Risk Reduction Plan (Sept
13, 2000), Appendix VII, Table 2 (Truck stop scenario). 3. Low level source lateral dispersion parameter ( y) set to a value between 20 and 50 meters based on spacing between sources and proximity to the yard
boundary.
CONFIDENTIAL BUSINESS INFORMATION/TRADE SECRET
-55-
4. Meteorological Data Selection
The Yard does not monitor meteorological variables on site. Surface data from the
nearby (i.e., 2.6 miles) Stockton Municipal Airport, and upper air data from the Oakland
International Airport, operated by the National Weather Service, were used for this
project. Missing surface data were replaced according to USEPA guidance12. The
completed dataset was processed in AERMET, the meteorological preprocessor for
AERMOD.
Fifteen years, 1991 through 2005, of meteorological data were processed with AERMET
to assure that an adequate number of years of acceptable data completeness and quality
would be available for AERMOD modeling. It is expected that year-to-year variability
would not cause significant differences in the modeled health impacts and, hence, would
justify needing only to subject the full set of receptors to one year of meteorological data.
For rail yard dispersion modeling, the meteorological data from 2005 were selected, the
most current year available.
In the absence of more detailed data and given the inability of steady-state Gaussian
models such as AERMOD to treat non-uniform flow fields, some uncertainty will exist in
the ability of the model to predict the locations of highest concentrations outside of the
Yard.
Because rail yards, especially emissions from locomotives, tend to be aligned linearly
along the main track routes, the directions of prevailing surface winds were important to
model predictions in the near field. For longer transport distances (e.g., 1 to 10 km),
surface winds were still the primary consideration, with atmospheric stability also playing
an important role. Due to the relatively low release heights and limited plume rise of rail
yard sources, modeled concentrations are relatively insensitive to mixing heights,
temperatures, and vertical temperature and wind profiles. Due to the generally flat terrain
throughout the modeling domain and the proximity of the surface wind station to the
12 USEPA "Meteorological Monitoring Guidance for Regulatory Modeling Applications" Section 6.8; Atkinson & Lee "Procedures for Substituting Values for Missing NWS Meteorological Data for Use in Regulatory Air Quality Models"
CONFIDENTIAL BUSINESS INFORMATION/TRADE SECRET
-56-
Yard, the meteorological data used should be reasonably representative of conditions at
the Yard.
5. Model Domain and Receptor Grids
A domain size of 20 km by 20 km with varying receptor spacing was used. Within 300
m of the facility, receptor spacing was 50 m. Between 300 and 600 m, and between 600
m and 1 km, receptor spacings were 100 m and 200 m, respectively. Receptors were
spaced 500 m apart throughout the rest of the domain.
All receptors were identified by UTM coordinates. United States Geological Survey
(USGS) 7.5 Minute digital elevation model (DEMs) information was used to identify
terrain heights at each receptor. Figures 4 and 5 show the outline of the Yard along with
the coarse and fine receptor grids.
Sensitive receptors, consisting of hospitals, schools, day-care centers, and elder care
facilities, within a 1-mile radius of the Yard, were identified. Table 37 lists the address,
elevations, and UTM coordinates for each sensitive receptor. Figure 6 shows the outline
of the Yard and the location of each sensitive receptor identified in Table 37.
CONFIDENTIAL BUSINESS INFORMATION/TRADE SECRET
-57-
Table 37 Sensitive Receptor Locations
Stockton Rail Yard
Receptor
Address Elevation
(m) UTM-E
(m) UTM-N
(m) Apostolic Christian Academy 2222 Lever Blvd, Stockton, CA 95206 3 649726 4199028 Clare Mohammed School 2065 E Eighth St, Stockton, CA 95206 7 653436 4199974 Edison High School 1425 S Center St, Stockton, CA 95206 4 650561 4200187 Garfield Elementary School 1670 E Sixth St, Stockton, CA 95206 6 652578 4200078 Golden Valley Secondary Community Day School 1141 E Weber St, Stockton, CA 95205 6 651413 4202354 Grant Elementary School 1800 S Sutter St, Stockton, CA 95206 5 651149 4199893 Great Valley Elementary School 4223 McDougald Blvd, Stockton, CA 95336 4 649839 4196607 Hamilton Middle School 2245 E Eleventh St, Stockton, CA 95206 7 653759 4199746 Hazelton Elementary School 535 W Jefferson St, Stockton, CA 95206 4 649837 4200595 Huerta Elementary School 1644 S. Lincoln St, Stockton, CA 95206 3 650194 4199902 McKinley Elementary School 30 W Ninth St, Stockton, CA 95206 4 650976 4199077 Monroe Elementary School 2236 E Eleventh St, Stockton, CA 95206 7 653805 4199615 Nightingale Elementary School 1721 Carpenter Rd, Stockton, CA 95206 6 653326 4198362 Samuel N Hancock School 1610 E Main St, Stockton, CA 95205 7 652012 4202260 St George School 144 W 5th St, Stockton, CA 95206 4 650613 4199641 St Gertrude School 1701 E Main St, Stockton, CA 95205 7 652177 4202327 Stockton Seventh Day Adventist School 2929 S B St, Stockton, CA 95206 7 653585 4199073 Taft Elementary School 419 S Downing Ave, Stockton, CA 95206 4 650808 4197663 Van Buren Elementary School 1628 E Tenth St, Stockton, CA 95206 6 652906 4199510 Creative Child Care - Conway Development Center 742 Dallas Ave, Stockton, CA 95206 3 649696 4198568 Creative Child Care - Sierra Vistchild Development Center
1700 E Eleventh St, Stockton, CA 95206
6
653056
4199315
Head Start Child Development Council - Gemini Community Center
1807 E Tenth St, Stockton, CA 95206
7
653070
4199600
CONFIDENTIAL BUSINESS INFORMATION/TRADE SECRET
-58-
Head Start Child Development Council - Grant Village
2040 S Grant St, Stockton, CA 95206
5
651619
4199772
Head Start Child Development Council - Kennedy Community Center
2800 S D St, Stockton, CA 95206
6
652397
4199411
Head Start Child Development Council - Latin American Club
548 S Wilson Way, Stockton, CA 95205
7
652001
4201723
Head Start Child Development Council - Leo Gloria Center
215 W Fifth St, Stockton, CA 95206
4
650423
4199683
Head Start Child Development Council - White Rose Church
2340 S Pilgrim St, Stockton, CA 95206
6
652181
4199415
Picola Frye Daycare 3219 Volney St, Stockton, CA 95206 6 652913 4198509 Sedalia s Place 1637 Spring St, Stockton, CA 95206 6 652760 4199823 Sister Diane s Day Care Center 1616 E Main St, Stockton, CA 95205 7 651976 4202309 Community Medical Center 701 E Channel St, Stockton, CA 95202 5 650898 4202338 Primary Care Physicians Critical Care Center 102 S San Joaquin St, Stockton, CA 95202 5 650523 4201884 San Joaquin County Public Health Center 1601 E Hazelton Ave, Stockton, CA 95205 7 652126 4201703 Notes: 1. UTM Coordinates are in Zone 11, NAD 83.
CONFIDENTIAL BUSINESS INFORMATION/TRADE SECRET
-59-
Figure 4 Coarse Modeling Grid
CONFIDENTIAL BUSINESS INFORMATION/TRADE SECRET
-60-
Figure 5 Fine Modeling Grid
CONFIDENTIAL BUSINESS INFORMATION/TRADE SECRET
-61-
Figure 6 Sensitive Receptors
CONFIDENTIAL BUSINESS INFORMATION/TRADE SECRET
-62-
6. Dispersion Coefficients
Dispersion coefficients are used in air dispersion models to reflect the land use over
which the pollutants are transported. The area surrounding the Stockton Municipal
Airport was divided into sectors to characterize the surface roughness, albedo, and
Bowen ratio. These parameters were provided along with the meteorological data to the
AERMET software. The resulting meteorological input file allows AERMOD to select
appropriate dispersion coefficients during its simulation of air dispersion. AERMOD
also provides an urban input option to use the overall size of the Standard Metropolitan
Statistical Area that contains the emission source (i.e., the Yard) in accounting for the
urban heat island effect on the nocturnal convective boundary layer height. If the option
is not selected, AERMOD defaults to rural dispersion coefficients. If the urban option is
selected, but no surface roughness is specified (not to be confused with the surface
roughness parameters already specified for sectors around the meteorological monitoring
station and input to AERMET), AERMOD assigns a default "urban" surface roughness
of 1 meter. For the Stockton Yard, AERMOD was run with the urban option. Based on
CARB and USEPA guidance,13 namely "For urban areas adjacent to or near other
urban areas, or part of urban corridors, the user should attempt to identify that part of
the urban area that will contribute to the urban heat island plume affecting the source,"
the area encompassed by the surrounding City of Stockton was considered to determine
the urban heat island effect on the nocturnal convective boundary layer height. The
population of Stockton14 is approximately 286,926, and the surface roughness that
characterizes this metropolitan area was set to the URBANOPT default of 1 m. See
Appendix J for additional discussion of this issue.
7. Building Downwash
Building downwash effects were considered for the Yard. Stack-tip downwash adjusted
the effective stack height downward following the methods of Briggs (1972) when the
13 AERMOD Implementation Guide, September 27, 2005, http://www.epa.gov/scram001/7thconf/aermod/aermod_implmtn_guide.pdf
14 City of Stockton. http://www.city-data.com/city/Stockton-California.html.
stack exit velocity was less than 1.5 times the wind speed at stack top. The locomotives
are the only structures in the Yard of sufficiently large size and close enough proximity to
the modeled emission sources (i.e., their own stacks) to be entered into the Building
Profile Input Program (BPIP) with one set of dimensions for a "standard" locomotive
(24.2 m. long x 4.0 m. wide x 4.6 m. high).
B. Modeling Results
The AERMOD input and output files have been provided to CARB in an electronic
format.
C. Demographic Data
Demographic data files have been provided to CARB in an electronic format. See
Appendix K for a description of the data.
CONFIDENTIAL BUSINESS INFORMATION/TRADE SECRET
-64-
PART X: REFERENCES
Briggs, G.A. (1972). Discussion on Chimney Plumes in Neutral and Stable Surroundings. Atmos. Environ. 6:507-510.
CARB (2000). Risk Reduction Plan to Reduce Particulate Matter Emissions from Diesel-Fueled Engines and Vehicles. (Available at www.arb.ca.gov/diesel/documents/rrpapp.htm)
CARB (2003). Staff Report: Initial Statement of Reasons for Proposed Rule Making for the Airborne Toxic Control Measure for In-use Diesel-Fueled Transport Refrigeration Units (TRU) and TRU Generator Sets, and Facilities Where TRUs Operate. (Available at www.arb.ca.gov/regact/trude03/isor.pdf)
CARB (2004). Roseville Rail Yard Study. (Available at www.arb.ca.gov/diesel/documents/rrstudy/rrstudyl0l404.pdf)
CARB (2006). Health Risk Assessment Guidance for Rail Yards and Intermodal Facilities. (Available at www.arb.ca.gov/railyard/hra/07l806hra_guideline.pdf)
CARB (2006). EMFAC-WD2006 Model. (Available at www.arb.ca.gov/msei/onroad/latest_version.htm)
CARB (2006). OFFROAD2006 Model. (Available at www.arb.ca.gov/msei/offroad/offroad.htm)
CARB (2006). Rail Yard Emission Inventory Methodology. (Available at www.arb.ca.gov/railyard/hra/07l806hra_eim.pdf)
Ireson, R.G., M.J. Germer, L.A. Schmid (2005). Development of Detailed Rail yard Emissions to Capture Activity, Technology, and Operational Changes. Proceedings of the USEPA 14th Annual Emission Inventory Conference, Las Vegas NV, April 14, 2006. (Available at www.epa.gov/ttn/chief/conference/eil4/session8/ireson.pdf)
Irwin, J.S. (1978). Proposed Criteria for Selection of Urban Versus Rural Dispersion Coefficients. Staff Report. Meteorology and Assessment Division, U.S. Environmental Protection Agency, Research Triangle Park, NC. (Air Docket Reference No. II-B-8 for the Fourth Conference on Air Quality Modeling).
Nappo, C. J. et al. (1982). The Workshop on the Representativeness of Meteorological Observations, June 1981, Boulder, CO. Bulletin Amer. Meteor. Soc., Vol. 63, No. 7, pp. 761-764. American Meteorological Society, Boston, MA.
Trinity Consultants (2003). Air Emission Inventory and Regulatory Analysis Report for Stockton Yard.
USEPA (1986). Guideline on Air Quality Models (Revised). U.S. EPA-45/2-78-027R, Office of Air Quality Planning and Standards, Research Triangle Park, NC.
USEPA (1987a). Supplement A to the Guideline on Air Quality Models (Revised). Office of Air Quality Planning and Standards, Research Triangle Park, NC.
USEPA (1987b). Ambient Monitoring Guidelines for Prevention of Significant Deterioration (PSD). Office of Air Quality Planning and Standards, and Office of Research and Development, Research Triangle Park, NC.
USEPA (1995). Compilation of Air Pollutant Emission Factors, Volume l: Stationary Point and Area Sources. (Available at www.epa.gov/ttn/chief/ap42/)
USEPA (1998). Locomotive Emission Standards -- Regulatory Support Document. (Available at www.epa.gov/otaq/regs/nonroad/locomotv/frm/locorsd.pdf).
USEPA (2000). Meteorological Monitoring Guidance for Regulatory Modeling Applications. Publication No. EPA-454/R-99-005. Office of Air Quality Planning & Standards, Research Triangle Park, NC. (PB 2001-103606) (Available at www.epa.gov/scram00l/)
USEPA (2004). Final Regulatory Impact Analysis: Control of Emissions from Non- Road Diesel Engines. U.S. EPA 420-R-04-007. Office of Air Quality Planning and Standards, Assessment and Standards Division, Research Triangle Park, NC.
USEPA (2005). AERMOD Implementation Guide. (Available at www.epa.gov/scram00l/7thconf/aermod/aermod_implmtn_guide.pdf).
Wong, W (undated). Changes to the Locomotive Inventory. Draft OFFROAD Modeling Change Technical Memo.
Note: ACE trains are all pre-tier 0 GP-40 equivalents without SmartStart Note: Yard operation switch and GP-38 SmartStart and tier fractions are the same as observed at the service area.
CONFIDENTIAL BUSINESS INFORMATION/TRADE SECRET
CONFIDENTIAL BUSINESS INFORMATION/TRADE SECRET
APP-16
Appendix A-3 Locomotive Service and Load Tests by Train Type Groups
Locomotives in Service Service distn Switch GP3x GP4x GP5x SD60 SD7x SD90 Dash7 Dash8 Dash9 C60
Main Line 1 2.2808 South End to East Yard South End 2 0.6048 North End to East Yard North End 3 0.6793 East Yard South End 4 0.4985 East Yard South End to RIP Track 5 0.4783 RIP Track to East Yard North End 6 0.5476 East Yard North End to Service 7 0.3300 Service to North End of Yard 8 0.3532 SP Yard 9 0.9132 East Yard South End Yard Operations 10 0.4985 East Yard North End Yard Operations 11 0.4985 East Yard North End 12 0.4985
Notes (1) Segment numbers listed as negative values are in-yard power moves from arriving trains to service or from service to departing trains (2) Non-ZTR Idling is the duration of an idle event when units without ZTR continue to idle after ZTR-equipped units have shut down (3) Idling All is the duration of idling during which all locomotives continue to idle (4) Fraction of Segment Moving is the fraction of the length of the segment over which the movement occurs
(On departure, power moves from service are assumed to connect to trains 20% of the way into a track segment)
Duty Non-ZTR Activity Cycle Idle Time ZTR Idle Working Time Yard Operations Code Number (hrs) Time (hrs) (hrs) SP Yard (GP-38) 22 4 1 0.5 11 East Yard South End Day and Night Shift Set (GP-38s) 23 4 1.5 1 14 East Yard South End Three-Shift Set (GP-38s) 23 4 2 1 21 East Yard North End Three-Shift Set (Switchers) 24 4 2 1 21
Number of Quarterly Maintenance Load Tests 112 Fraction of Calif. Fuel 0.90
Idle- Emission Factors (g/hr) Group ID NonZTR Idle-All DB N1 N2 N3 N4 N5 N6 N7 N8 UPRR Load Test - CA Fuel 2 29.10 40.13 72.73 44.26 118.00 212.80 250.14 341.16 463.75 508.61 654.99 UPRR Load Test - 47-State Fuel 2 29.10 40.13 72.73 44.26 118.00 231.51 277.88 383.55 520.91 576.45 742.19 CA Fuel-Fraction Adjusted Rates 2 .l0 40.l3 72.73 44.26 ll8.00 2l4.67 2 2. l 34 .40 46 .47 l .3 663.7l
Duration (minutes)
Number of Idle- Activity Locomotives NonZTR Idle-All DB N1 N2 N3 N4 N5 N6 N7 N8 Quarterly Maintenance Load Test 112 0 2 0 0 0 0 0 0 0 0 8
Emissions (g) Notch-Specific 0.0
149.8
0.0
0.0
0.0
0.0 0.0
0.0
0.0
0.0 9911.4
Total Emissions (g/yr) 10061
APP-29
APPENDIX A-4
METHODOLOGY FOR ESTIMATING LOCOMOTIVE EMISSIONS AND GENERATING AERMOD EMISSION INPUTS
CONFIDENTIAL BUSINESS INFORMATION/TRADE SECRET
A-4-1 APP-30
Appendix A-4
Methodology for Estimating Locomotive Emissions and Generating AERMOD Emission Inputs
Overview This appendix describes the general procedures followed for developing locomotive emission inventories for the Union Pacific Railroad (UPRR) rail yards under the Memorandum of Understanding with the California Air Resources Board. It also describes the procedure by which the emission inputs for both locomotive and non- locomotive sources used in AERMOD dispersion modeling.
EMISSION CALCULATIONS This section describes the details of the development of activity inputs, emission factors, and emission estimates for locomotive operations. Separate procedures are followed for estimating activity associated with locomotives on trains, locomotive consist movements within a yard, service and shop activity (if occurring at a specific yard), and yard switching operations within a yard. Emission factors are developed for each of the types of locomotive activity based on the model and technology distribution of locomotives involved in each activity. Emission estimates are then developed for the activities and specific areas of a yard in which each activity occurs. The data used to calculate these emissions are included in the Appendix A-3 Excel workbook, which includes a "Sample Calculations" worksheet showing the linkages between the various activities, emission factors, and operating characteristics data.
Train Activity Train activity data for emissions calculations includes a number of separate components:
The number of trains arriving, departing, or passing through a yard, broken down by type of train
The average composition of working locomotives in each consist1, including the fraction of locomotives of different models, emissions technology tier, and automatic idling control equipment2
The identification of routes followed for different types of train activities
1 The term "consist" refers to the group of locomotives (typically between one and four) that provide power for a specific train. 2 Two types of automatic idling control equipment are in use, known as ZTR SmartStart (typically retrofit equipment on low horsepower units) and AESS (typically factory installed on newer high horsepower units). Both are programmed to automatically shut of the engines of parked idling locomotives after a specified period of time, and to restart the unit if any of a number of operating parameters (battery state, air pressure, coolant temperature, etc.) reach specified thresholds.
CONFIDENTIAL BUSINESS INFORMATION/TRADE SECRET
A-4-2 APP-30
Identification of the speeds and throttle settings for different types of train activities in different locations.
The primary source of information for estimating train activity is a database identifying the arrival and departure of locomotives at a specific yard. This database identifies locomotives by their ID numbers and models, the status on the train (working or not working), and the specific train to which they are connected. From these data, the total numbers of trains of different types are identified based on train symbols, train dates, train origination and termination indicators, and dates and times of arrival and departure. For each type of train and activity, the average number of locomotives per consist is calculated along with the distribution of locomotive models, emission technology tiers, and automatic idling control equipment. A separate database of UPRR locomotives is consulted based on locomotive ID to determine the tier and date of any retrofits of automatic idling controls to complete the development of these model distributions. The activity data so derived are shown on the "Activities" worksheet in the Appendix A-3 Excel workbook, and the model and technology distributions are shown on the "Consist Emissions" worksheet. The types of trains to be identified can vary from yard to yard. For all yards, through trains (which bypass the yard itself on mainline tracks adjacent to the yard) are identified. Depending on the yard, trains entering or departing from the yard can be of several types, including:
Intermodal trains
Automobile trains
"Manifest" or freight trains
Local trains
Power moves Power moves are trains consisting only of locomotives which are either arriving at the yard to be serviced or used for departing trains, or departing from the yard to be serviced at another location or used for trains departing from another location. The routes followed by each type of train on arrival and departure are identified in consultation with UPRR yard personnel, along with estimates of average speeds and duty cycles (fraction of time spent at different throttle settings) for different areas. Specific track subsections are identified by UTM coordinates digitized from georeferenced aerial photographs. The segments identified and their lengths are shown on the "Track Segments" worksheet of Appendix A-3. For each train type, direction, and route, a listing of track segments, segment lengths, and duty cycles is developed. Duty cycles are shown on the "Consist Emissions" worksheet of Appendix A-3, and the segment speeds, duty cycles, idling durations are shown on the "Movements and Yard Operations" worksheet. This listing, along with the number of locomotives per consist and number of trains of each type, allows calculation of the number of locomotive hours in each duty cycle to be calculated for each section of track. For arriving and departing trains, estimates of the duration of idling were developed in consultation with UPRR personnel. These idling periods were divided into two parts - the assumed amount of
CONFIDENTIAL BUSINESS INFORMATION/TRADE SECRET
A-4-3 APP-30
time that all locomotives in a consist would idle on arrival or departure, and the amount of time that only locomotives not equipped with automatic idle controls would idle. Idling periods were assigned to a segment of the arrival or departure track one fifth of the length of the track at the appropriate end.
Service and Shop Activity If there is a service track and/or shop at a yard, locomotives (including both road power from trains as well as yard switchers) undergo a variety of activities at these locations. If present at a yard, details of the service and shop activity, model distributions, and emission factors are shown on the "Service and Shop" worksheet of Appendix A-3. Specific locomotive activities involve idling while awaiting or undergoing routine service (cleaning, refueling, oiling, sanding, and other minor maintenance), movement and idling between service and maintenance areas, and stationary load testing associated with specific types of maintenance events. A database of service events at individual yards identifies the number of service events during the year, the locomotive ID and model, and the nature of servicing performed. Routine servicing involves periods of idling prior to and during service, and additional idling prior to movement of consists to departing trains in the yard. Estimates of the duration of idling associated with servicing are developed in consultation with UPRR personnel. As was done for trains, these idling periods were separated into two parts, the average total duration of idling by all locomotives, and the average duration of additional idling by locomotives not equipped with automatic idling controls. The database also specifically identifies load test events and the type of maintenance with which the load testing is associated. These types include planned maintenance at different intervals (e.g., quarterly, semiannual) as well as unscheduled maintenance which may involve both diagnostic load testing prior to maintenance and post- maintenance load testing. The duration of load test events in each throttle setting depend on the equipment available and types of maintenance performed at the yard. Estimates of these durations, as well as the identification of load testing activity by type of load test and the time and duration of any additional idling and movements are developed in consultation with UPRR personnel. A total number of events (servicing and load testing by location and type) are developed from these data, as are locomotive model and technology distributions for all locomotives serviced and for those specific locomotives undergoing load testing (if applicable). From these event counts and durations, the total number of hours of locomotive idling and higher throttle setting operation in different portions of the service areas are calculated for each of the two model distributions.
Yard Switcher Activity In each yard, there are routine jobs assigned to individual switchers or sets of switchers. These activities are generally not tracked from hour to hour, but they occur routinely within yard boundaries during specified work shifts. Similarly, the specific yard switcher locomotive IDs assigned to these jobs are not routinely tracked, but these yard jobs are
CONFIDENTIAL BUSINESS INFORMATION/TRADE SECRET
A-4-4 APP-30
generally assigned to a specific model of low horsepower locomotive. From the assigned yard switcher jobs and shifts, and in consultation with UPRR personnel, an estimate of the hours per day of switcher operation in a yard are developed, along with the specific times of day when these activities occur (time of day assignments were made only if operation was less than 24 hour per day). Duty cycles for switching operation are also developed in consultation with local UPRR personnel. Depending on the type of activity and type of trains being handled in a yard, duty cycle estimates may vary. In the absence of more detailed information, the USEPA switcher duty cycle is assumed to be representative of each switcher's operation3. The total number of locomotive hours of operation for each model are calculated and assigned to the areas in which the units work. In some cases, yard jobs are assigned to specific areas within the yard and specific models of locomotives. In these cases, the switcher activities are assigned specifically to these areas of the yard.
Emission Factor Development The locomotive model and technology group distributions derived in the development of activity data are grouped by type or types of activity with consideration for the level and nature of the activity. For example, a single distribution is used for through trains of all types, including power moves, while consist model distributions for different types of trains within a yard may be treated as separate distributions if they are handled in different areas of a yard. As shown in Part VII of this report model-group-specific emission factors by throttle setting were developed based on emission test data and sulfur content adjustment factors. From these emission factors and the locomotive model and technology distributions for different types of trains and activities, weighted average emission factors are calculated for the "average" locomotive for that train type or activity on a gram per hour basis. For each train type or activity, two separate idle emission rates are calculated. The first is the straight weighted average emission rate for all locomotives, while the second is the weighted average only for the fraction of locomotives without automatic idle controls. Mathematically,
Q(l) 11 4 2
F (i, j, k ) Q(i, j,l) i 1 j 1 k 1
for l corresponding to idle through N8, and
Q(l*)
11 4
F (i, j,1) Q(i, j, l*)
i 1 j 1
for idling emission rate during periods when only locomotives without automatic idle controls are idling where
3 USEPA (1998). Locomotive Emission Standards -- Regulatory Support Document. (Available at www.epa.gov/otaq/regs/nonroad/locomotv/frm/locorsd.pdf).
(l) = weighted average emission factor for throttle setting l
Q(i,j,l) = the base g/hr emission factor of a particular model group/technology class and throttle setting F(i,j,k) = the fraction of locomotives of a particular model group/technology class i = model group index (Switcher, GP-3x, etc.) j = technology tier index (pre-Tier 0, Tier 0, Tier 1, Tier 2) k = automatic idle control status index (with or without) l = throttle setting (idle, N1, . . ., N8) l* = index for idle throttle of locomotives without automatic idle controls.
Thus, for each defined locomotive model distribution, gram per hour emission factors are generated for each throttle setting.
Emission Calculations - Locomotive Movements From the train activity analysis, the following data are available for each segment of track: track length of segment L(i); speed V(i); movement duty cycle D(i) (a vector of fractions of time spent in each throttle setting); number of trains of each type N(j); and number of working locomotives per consist for each train type C(j). For each type of train j, there is a set of throttle-specific emission factors Qj(l) for the "average" locomotive used on that train type. If a particular type of train or consist movement can follow multiple paths within the yard, the activity is allocated to sequences of track segments representing each such path. Total annual emissions qtot(i) for each segment are then calculated as
qtot(i) = D(i,l) Qj (l) . L(i) V (i)
N ( j) C( j) j l
Emission Calculations - Locomotive Idling Locomotive idling is calculated in a similar manner for road power and locomotives in service. For each train type and for service events, activity data provide a number of annual events N(i), duration of idling by locomotives with (Tall(i)) and without (TnZTR(i))automatic idle control, and gram per hour emission rates for the "average" locomotive Qall(i), and the "average" locomotive excluding those with automatic idle controls QnZTR(i). Total annual emissions are calculated as
If a particular type of activity occurs at multiple locations within the yard (e.g., on multiple arrival or departure tracks), then the idling time is allocated to different segments of track as appropriate so that segment-specific emissions are obtained.
CONFIDENTIAL BUSINESS INFORMATION/TRADE SECRET
A-4-6 APP-30
Emission Calculations - Load Testing Load testing emissions are calculated separately for each throttle setting (idle, N1 and N8) using the weighted average emission factors for the load-tested units, the number of load tests of different types, and the duration of testing in each throttle setting for each type of test.
Emission Calculations - Yard Switcher Operations Activity data provide the number and model group information for yard switchers, and the number of operating hours per day. Model-group specific emission factors are multiplied by the duty cycle to generate weighted average gram per hour emissions for idling and for combined emissions from operation in notch 1 through notch 8. Emissions are calculated directly from the number of units, hours per day working, and duty cycle weighted emission factors for both idle and non-idle throttle settings during work shifts.
AERMOD EMISSION INPUT PREPARATION Emissions from both locomotives and from other emission sources in a yard are allocated to multiple individual point or volume sources in AERMOD inputs. In addition to each type of activity's emission rates, the locations of emissions, the release parameters, and other inputs (e.g., building downwash parameters, temporal variation in emissions, etc.) are required by AERMOD. Emission inputs are prepared sequentially for different types of activities and the areas within which they occur. The source elevation for each point or volume source is interpolated from a high resolution terrain file.
Locomotive Movements For each type of locomotive movement, emissions calculated for each track segment are uniformly allocated to a series of evenly spaced volume sources along that track segment. The maximum spacing between sources is specified and the number of sources to be used for each segment is calculated from the segment length. The raw emission rate value in the AERMOD inputs (g/sec) is based directly on the annual emission total for the segment divided by the number of sources on that segment. For locomotive movements, separate day and night release parameters are needed. Therefore, each source is duplicated (but with a different source ID and parameters) in the AERMOD inputs, with temporal profile inputs (EMISFACT HROFDY) that use day time parameters from 0600- 1800 and night time parameters for 1800-0600.
Locomotive Idling and Load Testing Locomotive idling and load testing emissions are allocated to track segments in the same manner as locomotive movements, but as point, rather than volume sources. Each source location may have up to three separate sources identified, with different stack parameters used for idle, notch 1 and notch 8. Building downwash inputs are assigned from a pre-
CONFIDENTIAL BUSINESS INFORMATION/TRADE SECRET
A-4-7 APP-30
prepared set of records for a typical locomotives dimensions and the orientation of the track segment on which the emissions occur.
Yard Switcher Operations Yard switcher operations are allocated to areas within the yard based on the estimated time spent working in each area. As for locomotive movements, yard switcher emissions for a specific area are allocated uniformly to a number of volume sources on defined segments. Day and night operations are handled similarly to train and consist movements, with EMISFACT HROFDY records used to switch day and night volume source release parameters. Depending on their magnitude and distance from yard boundaries, the "working idling" emissions for yard switching may be added to the non- idle emissions from volume sources, or treated as a series of point sources, using stack parameters for the specific model group being used. If treated as point sources, building downwash inputs are prepared as for other locomotive idling and load testing.
APP-37
APPENDIX A-5
PRINCIPLE LOCOMOTIVE ROUTES
CONFIDENTIAL BUSINESS INFORMATION/TRADE SECRET
APP-38
UPRR Stockton Through and Arriving Train Routes [Note - Horizontal Scale Expanded]
Through Trains North and Southbound (Green) Freight Train Northbound Arrivals (Dashed Blue) Freight Train Southbound Arrivals (Solid Blue) Power Moves Northbound Arrivals (Dashed Red) Power Moves Southbound Arrivals (Solid Red) ACE Train Arrivals (Light Blue)
CONFIDENTIAL BUSINESS INFORMATION/TRADE SECRET
APP-39
UPRR Stockton Departing Train Routes and Yard Operations Areas
Freight Train Northbound Departures (Solid Blue) Freight Train Southbound Departures (Dashed Blue) Power Moves Northbound Departures (Solid Red) Power Moves Southbound Departures (Dashed Red) ACE Trains (Light Blue) SP Yard Switch Operations (Green) East Yard South End Switch Operations (Black Dashed) East Yard North End Switch Operations (Black Solid)
APP-40
APPENDIX A-6
IRESON ET AL
RailyardEI-r2.doc 1 APP-41
Development of Detailed Railyard Emissions to Capture Activity, Technology and Operational Changes
Robert G. Ireson
Air Quality Management Consulting, 161 Vista Grande, Greenbrae, CA 94904 [email protected]
M. J. (Jon) Germer and Lanny A. Schmid Union Pacific Railroad Company, 1416 Dodge St., Omaha NE 68179
Railyard operations involve a variety of complex activities, including inbound and outbound train movements, classification (i.e., separating cars from inbound trains for redirection to multiple destinations, and building new trains), and servicing locomotives. Standard locomotive duty cycles provide long-term average activity patterns for locomotive operations, but they are not appropriate for the specialized activities that occur within railyards or at locations such as ports, and emission densities in such areas can be high relative to those of line haul activities. There are significant emission rate differences between locomotive models, and differences in the types of service for which specific models are used. Data for throttle-specific emissions, activity levels, and locomotive models and operating practices can be used to provide more accurate emissions estimates for such operations. Such data are needed to quantify actual emissions changes in these high activity areas. A calculation scheme has been developed to generate detailed emission inventories based on the types of data that are collected for managing rail operations. This scheme allows improved accuracy in emissions estimation, and also provides a more reliable basis for bottom-up tracking of emissions changes over time. Factors that can be addressed include: changes in the distribution of locomotive models and control technology levels (e.g., increasing fractions of Tier 0, 1, and 2 locomotives) for both line haul and local operations; actual in-yard idling duration and reductions associated with auto-start-stop technologies; fuel quality effects; and detailed operating practices for switching and train-building operations. By providing detailed disaggregation of activity and emissions data, the method also makes it possible to quantify and evaluate the effects of specific emission reduction alternatives.
INTRODUCTION
Freight movement by rail is a key component of the U.S. transportation infrastructure. The
combination of rail's low rolling resistance and the fuel-efficient turbocharged diesel engines used in modern locomotives make rail the most efficient mode of transport from both an emissions and economic perspective. Railyards located strategically through the nation's rail network are used to assemble and direct goods movement to their destinations. Railyards may handle dozens of trains per day, each powered by a "consist" of several locomotives. While in railyards, these locomotives are serviced and regrouped into new consists as needed for specific departing trains. In addition to train arrivals and departures and locomotive servicing, so-called "classification" yards separate rail cars in inbound trains into segments with different destinations, and build new trains with a common destination. This work is accomplished by switcher locomotives (typically of lower horsepower than the locomotives used for "line-haul" operations). Some railyards also have major locomotive repair facilities whose activities include load testing of locomotives prior to or after maintenance. Collectively, the locomotive operations associated with these activities can result in relatively high localized emission densities.
The Union Pacific Railroad (UPRR) is the largest railroad in North America, operating throughout the western two-thirds of the United States. It operates a number of railyards throughout its system, including the J. R. Davis Yard in Roseville, California. The Davis Yard is UPRR's largest classification yard in the western U.S. It is approximately one-quarter mile wide and four miles long, and is visited by over 40,000 locomotives per year. The California Air Resources Board (CARB) recently completed a detailed dispersion modeling study to estimate concentrations of diesel particulate matter in the vicinity of the railyard.1 UPRR cooperated closely with CARB in this study, including the identification, retrieval and analysis of data needed to assemble a detailed emission inventory for railyard operations. This effort produced the most detailed emission inventory for railyard operations to-date, including empirically developed train counts, locomotive model distributions, locomotive service and maintenance activities, and dedicated on-site switching operations. The results of this effort have been further adapted to allow UPRR to track the effect of locomotive fleet modernization, freight volume, and operational changes on emissions, and to identify opportunities for further emission reductions at the Davis Yard.
RAILYARD ACTIVITY ESTIMATION
At state and national levels, locomotive emissions have been estimated using locomotive fleet
population data and average locomotive emission factors, expressed in g/bhp-hr, in conjunction with fuel efficiency estimates and fuel consumption. For freight locomotives, the emission factors are typically derived using both a switching duty cycle and a line haul duty cycle, each of which gives the fraction of operating time locomotives spend at different throttle settings, referred to as notch positions.2 These throttle settings (see Table 1) include idle, notches 1 through 8, and dynamic braking (in which the locomotive traction motors are used to generate power which is dissipated through resistor grids). While this approach can provide reasonable estimates for larger regions, neither the overall locomotive fleet composition nor the standard duty cycles accurately reflect the specific activities that occur within an individual railyard. The g/bhp-hr emission factors vary substantially between throttle settings and between locomotive models. Other confounding factors include: speed limits within yards (which preclude the high throttle settings used for line-haul activity outside of yards); locomotive load (consists commonly move within yards with only one locomotive pulling and no trailing cars); and time spent either shut down or idling. Classification activities are carried out with duty cycles that are unique to yard operations and may vary from yard to yard. To develop more accurate emissions estimates, it is necessary to explicitly identify railyard activities at the level of individual locomotives.
Table 1. Locomotive Duty Cycles.
Throttle Position (Percent Time in Notch) Duty Cycle D.B. Idle N1 N2 N3 N4 N5 N6 N7 N8
To accomplish this, UPRR reviewed the types of databases available for its operations to identify
where explicit emission-related activity information could be generated for the Davis Yard. UPRR
RailyardEI-r2.doc 3 APP-43
operates approximately 7000 locomotives over a network spanning 23 states. Large amounts of data are generated and retained by UPRR for management purposes. These include tracking the location and status of capital assets (e.g., locomotives and rail cars), tracking performance of specific activities, and managing operations. These databases can be queried for data records specific to the Davis Yard, but their content does not directly relate to emissions. Where possible, data providing a complete record of emissions-related events (e.g., locomotive arrivals and departures) were identified and retrieved. Where 100 percent data for an activity could not be obtained (e.g., locomotive model number for each arriving locomotive), distributions were developed based on available data. In some cases, data are not available for specific types of emission events (e.g., the duration of idling for individual trains prior to departure). In these cases, UPRR yard personnel were consulted to derive estimates of averages or typical operating practices.
Railyard Operations - Inbound and Outbound Trains
The majority of locomotive activity in a railyard arises from inbound and outbound freight
traffic. Following arrival, consists are decoupled from their trains in receiving areas and are either taken directly to outbound trains, or more commonly, are sent through servicing which can include washing, sanding, oiling, and minor maintenance prior to connecting to outbound trains. Some fraction of trains arriving at a yard simply pass through, possibly stopping briefly for a crew change. UPRR maintains a database that, when properly queried, can produce detailed information regarding both arriving and departing trains. Table 2 lists some of the key parameters that are available in this database. In this study, 12 months of data were obtained for all trains passing through the Davis Yard. The extracted data (over 60,000 records) included at least one record for every arriving and departing train, and each record contained specific information about a single locomotive, as well as other data for the train as a whole. The data were processed using a commercial relational database program and special purpose FORTRAN code to identify individual train arrivals and departures and train and consist characteristics.
Table 2. Selected Train Database Parameters.
Used to Identify Parameter Identification of
Train Events Location in
Railyard Consist
Composition Temporal
Profile Train
Characteristics Train Symbol X X Train Section X
Train Date X Arrival or X X Departure
Originating or Terminating
X X
Direction X Crew Change? X
Arrival & X Departure Times # of Locomotives X
# of Working Locomotives
X
Trailing Tons X Locomotive ID # X
Locomotive Model X
RailyardEI-r2.doc 4 APP-44
The parameters listed in Table 2 were used to calculate the number of trains by time of day arriving or departing from each area of the yard, as well as average composition of their consists (number of locomotives and distribution of locomotive models). The combination of train symbol, train segment, and train date provided a unique identifier for a single arrival or departure, and the individual locomotive models were tabulated to generate model distributions. Where necessary, working horsepower and total horsepower were used to estimate the number of working locomotives in the consist.
Emission calculations associated with inbound and outbound trains included both periods of
movement within the yard boundaries and locomotive idling while consists we connected to their trains. Based on train direction and the location of its arrival or departure, moving emissions were based on calculations of time at different throttle settings based on distance traveled and estimated speed profiles, considering speed limits on different tracks. Yard operators provided estimates for the average duration of such idling for both inbound and outbound trains.
Railyard Operations - Classification
On arrival, inbound trains are "broken" into sections of rail cars destined for different outgoing
trains. Figure 1 shows a schematic diagram of the Davis Yard including a large central "bowl" consisting of a large number of parallel tracks connected by automated switching controls to a single track to the west. Trains are pulled back to the west and then pushed to the "hump," a slightly elevated portion of track just west of the bowl. As cars pass over the hump, they are disconnected and roll by gravity into the appropriate track in the bowl. Dedicated special purpose locomotives, known as "hump sets," are used in this operation. Unlike most locomotives, these units have continuously variable throttles, rather than discrete throttle notch settings, to allow precise control of speed approaching the hump. Switching locomotives, known as "trim sets" are responsible for retrieving the train segments or trains being "built" in the bowl and moving them to the appropriate outbound track. The Davis Yard operates a fixed number of hump sets and trim sets at any given time, with backup sets standing by for shift changes and possible breakdowns.
Figure 1. Schematic of the J. R. Davis Yard.
Emission calculations for hump and trim operations were based on the number of working hump and trim sets at any given time, plus assumed idling times of standby units. For the hump sets, yard operators provided estimates of average pull-back and pushing times, and the duty cycles associated with these operations. For pull-back, based on distance and speed limits, the EPA switcher duty cycle,
excluding notch 7 and 8 was used. Pushing is conducted at the equivalent of notch 2. For the trim sets, speed limits within the Yard preclude any high throttle setting operation, but there is a greater time spent in mid-throttle settings than reflected in the EPA switcher cycle. A revised duty cycle was developed for these units based on the EPA switcher duty cycle, with high throttle fractions (notches 7 and 8) excluded, but with increased notch 1 and notch 4 operating time. These duty cycles are also shown in Table 1.
Railyard Operations - Consist Movement, Service, Repair and Testing
After disconnecting from inbound trains, consists move to one of several servicing locations for
refueling and other maintenance, following designated routes in the yard. Typically, one locomotive in each consist will pull the others, with throttle settings at notch 1 or 2. Based on distance and speed limits, movement times were estimated for each route, and emissions calculated using the number of locomotives following each route.
While being serviced, locomotives may be either idling or shut down. Locomotives must be
idling while oil and other routine checks are performed. In addition, since locomotive engines are water-cooled and do not use antifreeze, they are commonly left idling during cold weather conditions. New idling reduction technologies known as SmartStart and AESS provide computer-controlled engine shut down and restart as necessary, considering temperature, air pressure, battery charge, and other parameters. Yard personnel provided estimates of the average potential duration of idling associated with different servicing events. Databases for service and maintenance activities maintained by UPRR provide details on the number and types of service events at different locations in the yard. As for train activity, these data were processed with a commercial relational database program and special purpose FORTRAN code to characterize and tabulate service events. These results were used in conjunction with data for the number of inbound and outbound consists to estimate total idling emissions for different service event types and locations. Following service, consists are dispatched to outbound trains. The same procedures were followed for estimating idle time, number of locomotives moving to each outbound area of the yard, and the duration of each movement for emission calculations.
In addition to routine service, the databases include service codes indicating periodic inspections
of various types, as well as major maintenance activities requiring load testing of stationary locomotives. Several types of load tests are conducted, including planned maintenance pre- and post-tests, quarterly maintenance tests, and unscheduled maintenance diagnostic and post-repair tests. Depending on the test type and locomotive model, these tests include some period of idling, notch 1 operation, and notch 8 operation. Data are not collected on the exact duration of individual tests, so estimates of average duration for each throttle setting were provided by shop personnel, as shown in Table 1. The number of tests of each type for each locomotive model group were tabulated based on the service codes in the database for each service event.
Trends in Activity and Technology
The initial study was based on data from December 1999 through November 2000. Since that time, UPRR's locomotive fleet modernization program as well as changes in freight volumes have occurred. A subsequent data retrieval for the period from May 2003 through April 2004 was made, and emission calculations updated. A number of significant changes occurred over this 40-month period. The distribution of locomotive models in line-haul operation showed a substantial shift from older, lower horsepower units to new high horsepower units. The average number of locomotives per consist remained the same at about 3, but the higher horsepower allowed an increase in train capacity (trailing tons per train). The decrease in older units also resulted in a decrease in the frequency of major maintenance load testing. In addition to updating activity inputs (number of locomotives by model) for RailyardEI-r2.doc 5
APP-45
emission calculations, calculations were modified to reflect the penetration of new and retrofit technologies in the locomotive fleet, including SmartStart and AESS idling controls and Tier 0 and Tier 1 locomotives. UPRR data identifying the specific technologies installed on individual locomotives were matched with locomotive ID numbers in the train and servicing data retrievals to obtain a specific count of the number of locomotives of each model for which emissions reductions were achieved by these technologies. Historical temperature data for the Roseville area were used to estimate the fraction of time computer controls would require idling when the locomotive would otherwise be shut down.
EMISSION FACTORS
Data Sources
The study of the J. R. Davis Yard focused on diesel exhaust particulate matter emissions. At
present, there is no unified database of emission test results for in-use locomotives. Appendix B of the USEPA's Regulatory Support Document for setting new emission standards for locomotives2 contains a compilation of notch-specific emission factors. These data were supplemented by test data reported by Southwest Research Institute3,4, as well as test data provided by locomotive manufacturers to assemble emission factors for each of 11 locomotive model groups.
There are dozens of specific locomotive model designations, and emissions tests are not
available for all of them. However many models are expected to have nearly identical emission characteristics. Depending on their intended use, locomotives of different models may have different configurations (e.g., number of axles), but share a common diesel engine. For this project, 11 locomotive model groups were defined based on their engine models (manufacturer, horsepower, number of cylinders, and turbo- or super-charging of intake air). Table 3 lists these model groups and some of the typical locomotive models assigned to each group.
Table 3. Locomotive Model Groups
Model Group Engine Family Representative Models Switchers EMD 12-645E GP-15, SW1500
Figure 2 shows particulate matter (PM) emission factors for several of the more common
locomotive model groups at the low to intermediate throttle settings typical of yard operations. As shown in the figure, emission rates generally increase with throttle setting. However, the older 3000 hp GP-4x series shows emissions comparable to (and in some cases, higher than) the newer 4000 to 4500 hp SD-7x and Dash-9 models. Due to the relatively large fraction of time locomotives spend at low throttle settings while in railyards, the relative differences in emission rates between models at these settings can significantly affect emissions estimates if locomotive model distributions change over time.
RailyardEI-r2.doc 6 APP-46
RailyardEI-r2.doc 7 APP-50
Figure 2. Locomotive PM Emission Factors (g/hr).
350.0
300.0
250.0
200.0
150.0
100.0
50.0
0.0 Idle N1 N2 N3 N4
Throttle Position
Switchers GP-4x SD-7x Dash-9
PM
The emission factors used were based on tests using fuel typical of national off-road diesel.
Initial emission estimates were derived by multiplying model-specific g/hr emission rates by the total hours of operation and locomotive model fraction for each activity within the yard. At the Davis Yard, over half of the diesel fuel dispensed to locomotives meets California on-road diesel fuel specifications (so-called "CARB diesel"). To account for the effect of fuel quality on emissions, estimates of the fraction of locally dispensed fuel burned by locomotives in different yard activities were developed. These ranged from 100 percent for hump and trim sets to zero percent for inbound line-haul units prior to refueling. These fractions were multiplied by the fraction of CARB diesel dispensed at the yard and an estimate of 14 percent reduction in PM emissions for locomotives burning CARB diesel to develop fuel effects adjustments for individual activities.
EMISSION TRENDS
Using the procedures described in the preceding sections, emissions estimates were developed
for the December 1999 to November 2000 period, and the May 2003 to April 2004 period. During this period, significant changes in the UPRR locomotive fleet occurred, with the addition of new locomotives and the retirement of older units. Figure 3 shows the locomotive model distributions for all servicing events at the Davis Yard during these two periods. Service events include both the line-haul and local units arriving and departing on trains (which make up the bulk of these events), as well as the hump and trim sets. A significant increase in the relative fraction of high horsepower SD-7x and Dash-9 units is seen, and a corresponding decrease in the fraction of older GP-4x, GP-50, GP-60, Dash-7 and Dash-8 models. In addition to the fleet modernization, tabulations of specific emission control technologies on units serviced at the Davis Yard showed substantial penetration of new and retrofit
RailyardEI-r2.doc 8 APP-48
technologies. Approximately 31 percent of locomotives serviced at the yard were equipped with computer-controlled shut-down and restart technology, resulting in reduced idling times. Also, approximately 27 percent of servicings were for Tier 0 locomotives, and approximately 25 percent were Tier 1 units. Although the Tier 0 and Tier 1 technologies are not expected to substantially reduce PM emissions, their nitrogen oxides emissions are lower. A few prototype Tier 2 units were observed in 2003 - 2004 data, and their reduced PM emissions will show benefits in the future.
Figure 3. Changes in Locomotive Model Distributions.
C60-A
Dash-9
Dash-8
Dash-7
SD-90
SD-7x
GP-60
GP-50
GP-4x
GP-3x
Switchers
0% 10% 20% 30% 40% 50%
Fraction
5/2003 - 4/2004 12/1999 - 11/2000
The freight volume passing through the yard also changed between these periods. Table 4 lists the percent change in the number of arriving and departing trains, locomotives, and trailing tons (a measure of freight volume). The number of trains and locomotives showed little change, however the trailing tons increased by approximately 15 percent, implying that the average train weight (and correspondingly, the required consist horsepower) increased. This is a result of the increased availability of high horsepower units in the UPRR fleet. A higher fraction of trains bypass the yard, either not stopping, or stopping only for crew changes.
Table 4. Percent Change in Yard Activity Levels from 12/1999 - 11/2000 to 5/2003 - 4/2004. Trains Locomotives Trailing Tons
Arrivals -5.2% -3.5% -- Departures -7.0% -7.3% --
Throughs (Bypassing the yard) 8.0% 6.8% -- Total Arrivals and Departures -0.3% -0.9% 15.1%
The newer locomotive fleet also affected the level of load testing activity required. Table 5 lists the percent change in the number of load tests of different types, and the corresponding change in total locomotive testing time at idle, notch 1, and notch 8. The extended 30-minute post-maintenance tests were substantially reduced, and total hours of testing were reduced for the various throttle settings between 12 and 43 percent.
RailyardEI-r2.doc 9 APP-49
Table 5. Percent Change in Load Test Activity from 12/1999 - 11/2000 to 5/2003 - 4/2004. 10-Minute Tests -18.9% 15-Minute Tests 14.6% 30-Minute Tests -43.2%
Total Tests -12.3% Idling Hours -20.6%
Notch 1 Hours -43.2% Notch 8 Hours -12.0%
The combined net result of these changes is shown in Table 6. Between November 2000 and
April 2003, total estimated PM emissions in the yard decreased by approximately 15 percent. Reductions in idling and movement emissions of about 20 percent were calculated, due to the combination of a newer, lower emitting locomotive fleet and the computer-controlled shutdown technologies (both retrofits and standard equipment on newer units). Hump and trim emissions were reduced by about 6 percent, and load testing emissions by about 14 percent.
Table 6. Emissions Changes from 12/1999 - 11/2000 to 5/2003 - 4/2004.
Idling and Movement of Trains 5.2 4.2 -20.3% Idling and Movement of Consists 8.5 6.8 -20.2%
Testing 1.5 1.3 -14.1% Hump and Trim 7.0 6.6 -5.7%
Total 22.3 18.9 -15.3%
CONCLUSIONS
Because of the unique features of each individual railyard, top-down methods (e.g., based only on tons of freight handled or number of arriving locomotives) cannot provide reliable estimates of railyard emissions. Yard-specific data are needed. In-yard activity patterns (and emissions) will vary between yards depending on factors such as: the type of yard (e.g., hump or flat switching classification yards, or intermodal facilities); the presence and capabilities of service tracks or locomotive repair shops; the types of freight handled; the location of the yard in the rail network; and yard configuration. The development of procedures for retrieving and analyzing activity data and locomotive characteristics for a specific railyard is a substantial improvement of alternatives based on top-down estimation. By obtaining disaggregate data for the range of specific activities occurring within railyards, it is possible to reliably estimate historical trends in emissions, as well as to evaluate the potential effects of operational changes and new technologies. Railyard operations cannot be treated in isolation, since these yards are only one component of complex national level systems. Nevertheless, the ability to assess the details of yard operations and their emissions provides an improved basis for environmental management decisions at both local and larger scales.
REFERENCES
1. Hand, R.; Di, P.; Servin, A.; Hunsaker, L.; Suer, C. Roseville Rail Yard Study, California Air Resources Board, Stationary Source Division, Sacramento, CA, October 14, 2004.
2. U. S. Environmental Protection Agency. Locomotive Emission Standards - Regulatory Support Document, U. S. Environmental Protection Agency, Office of Mobile Sources, April 1998.
RailyardEI-r2.doc 10 APP-50
3. Fritz, S. "Emissions Measurements - Locomotives", SwRI Project No. 08-5374-024, Prepared for the U.S. Environmental Protection Agency by Southwest Research Institute, San Antonio, TX, August 1995.
4. Fritz, S. "Diesel Fuel Effects on Locomotive Exhaust Emissions", SwRI Proposal No. 08-23088C, Prepared for the California Air Resources Board by Southwest Research Institute, San Antonio, TX, October 2000.
KEY WORDS
Emission inventories Locomotives Railyards Diesel
ACKNOWLEDGEMENTS
The authors gratefully acknowledge the assistance of numerous UPRR staff who assisted in data
retrieval and interpretation, and in providing information on operating practices, including Deb Schafer, Punky Poff, Rob Cohee, Jim Diel, and Brock Nelson. In addition we acknowledge the contributions of Ron Hand of the California Air Resources Board.
APP-51
APPENDIX A-7
SULFUR ADJUSTMENT CALCULATIONS
APP-52
Appendix A-7 Development of Adjustment Factors for Locomotive DPM Emissions
Based on Sulfur Content
Wong (undated) provides equations for estimating g/bhp-hr emission rates for 4-Stroke (GE) and 2-Stroke (EMD) locomotives. Rather than using these statistically derived estimates for absolute emissions when model- and notch-specific emission factors are available, we used these equations to develop relative emission rate changes for different sulfur levels. The basic form of the equation is
q a S b
Where, q is the predicted g/bhp-hr emission rate of a locomotive at a specific throttle setting and sulfur content; a and b are coefficients specific to a locomotive type (2- or 4-stroke) and throttle notch; and S is the fuel sulfur content in ppm.
Thus, to calculate the emission adjustment factor for a specific fuel sulfur content, it is necessary to calculate the nominal emission rate q0 for the baseline fuel sulfur content S0, and the emission rate qi for the fuel of interest with sulfur content Si. This adjustment factor ki is simply
k 1 (q0 qi) ,
i q0
Where, q0 and qi are calculated using the equation above. Tables 1 and 2 give the values of the a and b coefficients for 4-stroke and 2-stroke locomotives. For throttle settings below notch 3, sulfur content is not expected to affect emission rates. The baseline emission rates from which actual emissions are estimated were derived from emission tests of different locomotive models. Although full documentation of fuels is not available for all of these tests, they are assumed to be representative of actual emissions of the different models running on 3,000 ppm sulfur EPA non-road Diesel fuel. For the purposes of modeling 2005 emissions, these factors are needed to adjust the baseline emission factors to emission factors representative of two fuels - 221 ppm and 2639 ppm. Table 3 shows the resulting correction factors for these two fuels by notch and engine type. To generate locomotive model-, throttle-, tier-, and fuel-specific emission factors, the base case (nominal 3,000 ppm S) emission factors in Table 4 were multiplied by the corresponding correction factors for throttle settings between notch 3 and notch 8.
APP-53
Table 1 Sulfur Correction Coefficients for 4-Stroke Engines
Throttle Setting a b
Notch 8 0.00001308 0.0967
Notch 7 0.00001102 0.0845
Notch 6 0.00000654 0.1037
Notch 5 0.00000548 0.1320
Notch 4 0.00000663 0.1513
Notch 3 0.00000979 0.1565
Table 2 Sulfur Correction Coefficients for 2-Stroke Engines
Throttle Setting a b
Notch 8 0.0000123 0.3563
Notch 7 0.0000096 0.2840
Notch 6 0.0000134 0.2843
Notch 5 0.0000150 0.2572
Notch 4 0.0000125 0.2629
Notch 3 0.0000065 0.2635
APP-54
Table 3 DPM Emission Adjustment Factors for Different Fuel Sulfur Levels
Throttle Setting
4-Stroke (GE) 2-Stroke (EMD) 2,639 ppm S 221 ppm S 2,639 ppm S 221 ppm S
Notch 8 0.9653 0.7326 0.9887 0.9131
Notch 7 0.9662 0.7395 0.9889 0.9147
Notch 6 0.9809 0.8526 0.9851 0.8852
Notch 5 0.9867 0.8974 0.9821 0.8621
Notch 4 0.9860 0.8924 0.9850 0.8844
Notch 3 0.9810 0.8536 0.9917 0.9362
Table 4 Base Case Locomotive Diesel Particulate Matter Emission Factors (g/hr)
Notes: 1. EPA Regulatory Support Document, "Locomotive Emissions Regulation," Appendix B, 12/17/97, as tabulated by ARB and ENVIRON 2. Base emission rates provided by ENVIRON as part of the BNSF analyses for the Railyard MOU (Personal communication from Chris Lindhjem to R.
Ireson, 2006) based on data produced in the AAR/SwRI Exhaust Plume Study (Personal communication from Steve Fritz to C. Lindhjem, 2006). 3. SwRI final report "Emissions Measurments - Locomotives" by Steve Fritz, August 1995. 4. Manufacturers' emissions test data as tabulated by ARB. 5. Base SD-70 emission rates taken from data produced in the AAR/SwRI Exhaust Plume Study (Personal communication from Steve Fritz to R. Ireson,
2006). 6. Average of manufacturer's emissions test data as tabulated by ARB and data from the AAR/SwRI Exhaust Plume Study, tabulated and calculated by
ENVIRON..
APP-55
PRELIMINARY DRAFT - DO NOT CITE OR QUOTE
01/05/07 1 APP-56
OFFROAD Modeling Change Technical Memo
SUBJECT: Changes to the Locomotive Inventory
LEAD: Walter Wong
Summary
The statewide locomotive emission inventory has not been updated since 2002. Using the Booz-Allen Hamilton's (BAH) study (Locomotive Emission Study) published in 1992 as a guideline (summary of inventory methodology can be found in Appendix A), staff updated the locomotive inventory.
The history of locomotive emission inventory updates began in 1992 using the results from the BAH report as the baseline inventory. In 2003, staff began updating the emissions inventory by revising the growth assumptions used in the inventory. The revised growth factors were incorporated into the ARB's 2003 Almanac Emission Inventory. With additional data, staff is proposing further update to the locomotive inventory to incorporate fuel correction factors, add passenger train data and Class III locomotives. Changes from updated locomotive activity data have made a significant impact on the total inventory (see Table 1).
Table 1. Impact of Changes on Statewide Locomotive Inventory
During the 2003 South Coast's State Implementation Plan (SIP) development process, industry consultants approached Air Resources Board (ARB) staff to refine the locomotive emissions inventory. Specifically, their concerns were related to the growth factors and fuel correction factors used in the inventory
PRELIMINARY DRAFT - DO NOT CITE OR QUOTE
01/05/07 2 APP-56
calculations. This document outlines how the locomotive emissions inventory was updated and the subsequent changes made to address industry's concerns.
Locomotive operations can be characterized by the type of service performed. For emission inventory purposes, locomotives are classified into five different service types as defined in BAH's report.
Line-haul/intermodal - Intermodal locomotives generally operate at higher speeds and with higher power than other types and incorporate modern, high-speed engines.
Mixed/bulk - Mixed locomotives are the most common and operate with a wide range of power. They also perform line-haul duties.
Local/Short Haul - Local locomotives perform services that are a mixture of mixed freight and yard service. They operate with lower power and use older horsepower engines.
Yard/Switcher - Yard operations are used in switching locomotives and characterized by stop and start type movements. They operate with smaller engines and have the oldest locomotive engines.
Passenger - Passenger locomotives are generally high speed line haul type operations.
Categories of railroads are further explained by a precise revenue-based definition found in the regulations of the Surface Transportation Board (STB). Rail carriers are grouped into three classes for the purposes of accounting and reporting:
Class I -Carriers with annual operating revenues of $250 million or more
Class II - Carriers with annual operating revenues of less than $250 million but in excess of $20 million
Class III - Carriers with annual operating revenues of less than $20 million or less, and all switching companies regardless of operating revenues.
The threshold figures are adjusted annually for inflation using the base year of 1991.
PRELIMINARY DRAFT - DO NOT CITE OR QUOTE
01/05/07 3 APP-56
The 1987 locomotive inventory as shown in Table 2 is taken from the BAH report prepared for the ARB entitled "Locomotive Emission Study" completed in 1992 (http://www.arb.ca.gov/app/library/libcc.php). Information was gathered from many sources including ARB, the South Coast Air Quality Management District, the California Energy Commission, the Association of American Railroads (AAR), locomotive and large engine manufacturers, and Southwest Research Institute. Railroad companies, such as Southern Pacific, Union Pacific, and Atchison, Topeka and Santa Fe (ATSF), provided emission factors, train operation data, and throttle position profiles for trains operating in their respective territories. Southwest Research Institute provided emission test data.
Table 2. 1987 Locomotive Inventory in Tons Per Day, Statewide, BAH report
The assumed average fuel sulfur content is 2700 parts per million (ppm) obtained from the BAH report.
Current Growth Estimates
Prior to the 2003 South Coast SIP update, growth factors were based on employment data in the railroad industry. Staff believes that the use of historic employment data, which translates to a decline in emissions in future years, may be masking actual positive growth in locomotive operations. It may be assumed that the number of employees is declining due to increased efficiency.
Changes to the Locomotive Inventory
Summary of Growth in Emission Based on BAH Report
Growth is estimated based on train operation type and by several operating characteristics.
Increased Rail Lube and Aerodynamics - this arises from reduction in friction and will help reduce power requirements.
Introduction of New Locomotives - older locomotive units will be replaced by newer models.
Changes in Traffic Level - the increase or decrease in railroad activity
In the BAH report, projected emission estimates for years 2000 and 2010 were based on the factors shown in Tables 3 and 4. A substantial part of the locomotive emission inventory forecast is based upon projections of rail traffic levels. BAH projected future rail traffic level as a function of population and economic growth in the state. BAH also projected growth in emission only to 2010.
Table 3. Changes in Emissions from 1987-2000 (Exhibit 4 p. 11 of the 8/92 Locomotive Emission Study Supplement) (1987 Base Year)
Train Increased Rail Introduction Changes in Cumulative Operation Lube and of New Traffic Net Growth in Type Aerodynamics Locomotive Levels Emissions Intermodal -7.0% -8.0% 17.0% 2.0% Mixed & Bulk -7.0% -8.0% 2.0% -13.0% Local -3.0% -3.0% -2.0% -8.0% Yard 0.0% -1.0% -25.0% -26.0% Passenger -7.0% -8.0% 10.0% -5.0%
Table 4. Changes in Emissions from 2001-2010 (Exhibit 4 p. 11 of the 8/92 Locomotive Emission Study Supplement) (2000 Base Year)
Train Increased Rail Improved Introduction Changes in Cumulative Operation Lube and Dispatching of New Traffic Net Growthin
Type Aerodynamics and Train Locomotive Levels Emissions
BAH added "Improved Dispatching and Train Control" to differentiate these impacts from the "Increased Rail Lubing" which helps to improve fuel efficiency from locomotive engines. Since train control techniques are emerging from the
PRELIMINARY DRAFT - DO NOT CITE OR QUOTE
01/05/07 5 APP-56
signal company research work, these assumed changes will not impact emission until year 2000.
Based on industry's input, staff recommends several changes to the locomotive emissions inventory. These include modifying growth factors, making adjustments to control factors reflecting the U. S. EPA regulations that went into effect in year 2000, incorporating fuel correction factors, adding smaller class III railroad and industrial locomotive, and updating passenger data.
Revised Growth in Emissions
Staff revised the growth factors for locomotives based on new data that better reflect locomotive operations. This includes U.S. industrial production and various railroad statistics available from the AAR.
Based on historic data recently obtained from U.S. industrial productions and the AAR, the changes in traffic levels were revised. A better estimate for changes in traffic levels for locomotives can be made to the line-haul class of railroad, which are the intermodal and mixed and bulk type of locomotives, using industrial production and AAR's data.
Industrial production data is considered to be a surrogate for changes in traffic levels of the line-haul locomotive. It is assumed that railroad activity would increase in order to accommodate the need to move more product. Industrial production is the total output of U.S. factories and mines, and is a key economic indicator released monthly by the Federal Reserve Board. U.S. industrial production historical data from 1920 to 2002 was obtained and analyzed from government sources. Figure 1 shows the historical industrial production trend (Source : http://www.research.stlouisfed.org/fred2/series/INDPRO/3/Max). Statistical analysis was used to derive a polynomial equation to fit the data.
Another surrogate for growth is net ton-miles per engine. Consequently, staff analyzed railroad data from the AAR's Railroad Facts booklet (2001 edition). The booklet contains line-haul railroad statistics including financial status, operation and employment data, and usage profiles. Revenue ton-mile and locomotives in service data from the booklet were used to compute the net ton- miles per engine as shown in Table 5.
As shown in Figure 2, there is a relatively good correlation between net ton-miles per engine growth and industrial production. Because net ton-miles per engine data are compiled by the railroad industry and pertains directly to the railroad segment, staff believes that net ton-miles per engine will better characterize future traffic level changes.
Figure 2. Ton-miles/Engine vs. Industrial Production (index base year = 1987)
1999 1997 1995 1993 1991 1989
Linear (Index Ton- Miles/Engine)
y = 3.9811x - 7806.9 R2 = 0.9415
80
60
40
20
0 1987
Index Ton-Miles/Engine Index Industrial Prod
180
160
140
120
100
PRELIMINARY DRAFT - DO NOT CITE OR QUOTE
01/05/07 8 APP-65
The ton-miles/engine data were projected to calculate the future growth rate of traffic level using a linear equation.
Staff also made changes to the "Increased Rail Lube and Aerodynamics" assumption shown in Tables 3 and 4. Rail lubing does not benefit the idling portion of locomotive activity. Since idling contributes 20% of the weighting in the line-haul duty cycle, staff reduced the rail lubing benefit by 20%. Meanwhile, improved dispatching and train control is assumed only to reduce engine idling. Therefore, staff reduced the improved dispatching benefit by 80%.
The benefit of the introduction of new locomotives to the fleet was decreased from the original BAH assumption. BAH assumed 50% penetration of the new engines by 2000. Literature research suggests that the new engines accounted for only about 34% of the fleet in 2000 (www.railwatch.com, http://utahrails.net/all-time/modern-index.php). These new engines are assumed to be 15% cleaner. Therefore, the benefit from new locomotive engines has been reduced to 5% (34% x 15% = 5% reduction).
Tables 6, 7, and 8 present the revised growth factors to be used to project the baseline (1987) locomotive emissions inventory into the future.
The benefit of new locomotives with cleaner burning engines is accounted for in the control factor from EPA's regulation beginning in 2001, which takes into account introduction of new locomotive engines meeting Tier I and Tier II standards.
Train Increased Rail Improved Changes in Cumulative Annual Operation Lube and Dispatching Traffic Net Growth in Growth Type Aerodynamics and Train Levels Emissions
In Table 8, staff assumes no benefit from aerodynamics and improved train controls. Staff seeks guidance from industry as to their input regarding future benefits.
PRELIMINARY DRAFT - DO NOT CITE OR QUOTE
01/05/07 10 APP-65
Table 9. Revised Growth in Emissions (Base Year 1987)
In December 1997, the U.S. EPA finalized the locomotive emission standard regulation. The regulatory support document lists the control factors used (http://www.epa.gov/otaq/regs/nonroad/locomotv/frm/locorsd.pdf). Staff modified the control factors to incorporate the existing memorandum of understanding (http://www.arb.ca.gov/msprog/offroad/loco/loco.htm) between the South Coast AQMD and the railroads that operate in the region. Previously, one control factor was applied statewide. In the revised emissions inventory starting in 2010, a lower control factor reflecting the introduction of lower emitting locomotive
engines in the SCAB region was applied. Tables 10 and 11 show the revised control factors. Road hauling definition as used by U.S. EPA applies to the line- haul/intermodal, mixed, and local/short haul train type in the emissions inventory.
Table 10. Revised Statewide Control Factors
State State State State State State State State State Road Road Road Switcher Switcher Switcher Passenger Passenger Passenger Hauling Hauling Hauling
Addition of Class III Locomotive and Industrial/Military Locomotive
The annual hours operated by the class III railroads are shown in Table 12. The results were tabulated from ARB Stationary Source Division's (SSD) survey (http://www.arb.ca.gov/regact/carblohc/carblohc.htm) conducted to support regulation with regards to ARB ultra-clean diesel fuel.
Table 12. Short-Haul and Switcher Annual Hours for Class III Railroads
Air Basin Operations Population Annual Hours Operated Mountain Counties SW 2 10214 Mojave Desert L 10 27440 North Coast L 3 5700 North Central Coast L 1 1332
SW 3 3996 Northeast Plateau L 5 9892 South Coast SW 21 75379 South Central Coast L 5 3200 San Diego L 4 5000 San Francisco L 8 31600
SW 4 5059 San Joaquin Valley L 29 68780
SW 19 72248 Sacramento Valley L 6 11400 Total 120 331240
L = local short-haul, SW = switcher
The short-haul and switcher emission rate are derived from BAH report. The report cites studies from testing done at EPA and Southwest Research Institute.
HC 0.38 0.44 CO 1.61 1.45 NOx 12.86 15.82 PM 0.26 0.28 SOx 0.89 0.90 Fuel Rate (lb/hr) 120.00 60.00
PRELIMINARY DRAFT - DO NOT CITE OR QUOTE
01/05/07 14 APP-65
Table 14. Statewide Summary of Industrial Locomotives
Air Basin Number of Avg. HP Avg. Age Locomotives
Mojave Desert 9 1,138 56 Others 11 587 54 San Francisco 11 525 54 San Joaquin Valley 38 1,176 54 South Coast 24 1,290 55 TOTALS 93 1,055 55
Table 15. Statewide Summary of Military Locomotives
Air Basin Number of Avg. HP Avg. Age Locomotives
Mojave Desert 7 900 50 Northeast Plateau 2 1,850 50 Sacramento Valley 1 500 50 San Diego 7 835 50 San Francisco 4 1525 47.5 San Joaquin Valley 2 400 50 South Central Coast 1 500 50 TOTALS 24 930 49.6
The data from the survey provides a reasonable depiction of railroad activities in 2003. To forecast and backcast, an assumption was made to keep the data constant and have no growth. More research is needed to quantify the growth projections of smaller, local railroad activities.
Update to Passenger Trains
ARB's survey of intrastate locomotives included passenger agency trains that operated within the state. Staff attempted to reconcile the survey results by calculating the operation schedules posted by the operating agency to obtain hours of operation and mileage information. The results of the survey and calculated operating hours were comparable. Table 16 lists the calculated annual hours operated and miles traveled used to estimate emissions.
PRELIMINARY DRAFT - DO NOT CITE OR QUOTE
01/05/07 15 APP-65
Table 16. Passenger Trains Annual Miles and Hours
Air Basin Annual Annual Miles Operated Hours Operated
South Coast 3,700,795 92,392 South Central Coast 151,864 4,020 San Diego 914,893 25,278 San Francisco 2,578,862 77,944 San Joaquin Valley 674,824 17,313 Sacramento Valley 635,384 20,058 Total 8,656,621 237,006
The passenger train emission rate is derived from testing done at SWRI on several passenger locomotives.
Table 17. Passenger Train Emission Rate
Emission Rate Passenger Train (g/bhp-hr)
HC 0.50 CO 0.69 Nox 12.83 PM 0.36 Sox 0.90 Fuel Rate (lb/hr) 455.00
Fuel Correction Factors
Aromatics
Previous studies quantifying the effects of lowering aromatic content are listed in Table 18. These studies tested four-stroke heavy-duty diesel engines (HDD). Although staff would have preferred to analyze data from tests performed on various locomotive engines to determine the effects of lower aromatics, these HDD tests are the best available resources to determine the fuel corrections factors due to lower aromatics.
PRELIMINARY DRAFT - DO NOT CITE OR QUOTE
01/05/07 16 APP-65
Table 18. Effect of Lowering Aromatic Volume on PM Emission
For 2-Stroke engines, staff used test data from SWRI's report published in 2000 entitled "Diesel Fuel Effects on Locomotive Exhaust Emissions" to estimate indirectly the potential PM reduction for 2-Stroke engines due to lower aromatics. Table 19 lists the summary of the test results.
Table 19. SWRI 2000 Study Summary Results
Locomotive Engine
Aromatic Changes
(Volume %)
PM Difference (g/bhp-hr)
PM % Difference
4 Stroke 28.35 to 21.84 0.080 37.6% 2 Stroke 28.35 to 21.84 0.056 14.1%
Staff assumes that PM emission reduction from 2-Stroke engine will have a factor of 0.38 (14.1%/37.6%) to the 4-Stroke engine PM emission reduction.
Currently, the baseline locomotive emissions inventory assumes an aromatic total volume percent of 31%. Table 21 describes the changes in PM emission due to changes in total volume percent of aromatics.
Currently, the baseline locomotive emissions inventory assumes an average fuel sulfur content of 2700 ppm. Industry has provided information on the sulfur content of the fuel that is currently being used by intrastate locomotives. Together with industry data and prior locomotive tests, staff believes a fuel correction factor should be incorporated into the model.
Table 24 shows the test data collected by the ARB, U.S. EPA, and others, where locomotive engines were tested on different fuel sulfur levels.
Table 24. Locomotive Engine Test with Different Sulfur Levels
Locomotive Engine
Fuel Properties Sulfur Content
Percent Change
PM
Percent Change
NOX
Percent Change
CO
Percent Change
HC
Source
EMD 12-645E3B 100/3300ppm -0.29 -0.06 0.17 0.07 Fritz, 1991 GE DASH9-40C 330/3150ppm -0.43 -0.07 -0.05 -0.18 Fritz (1995, EPA/SWRI) MK 5000C 330/3150ppm -0.71 -0.03 -0.03 -0.07 Fritz (1995, EPA/SWRI) EMD 16-710G3B, 330/3150ppm -0.38 -0.08 -0.30 -0.01 Fritz (1995, SD70MAC EPA/SWRI) EMD SD70MAC 50/330ppm -0.03 -0.04 0.07 0.01 Fritz (ARB/AAR, 2000) EMD SD70MAC 50/4760ppm -0.16 -0.06 0.08 0.03 Fritz (ARB/AAR, 2000) EMD SD70MAC 330/4760ppm -0.13 -0.03 0.01 0.01 Fritz (ARB/AAR, 2000) GE DASH9-44CW 50/330ppm -0.03 -0.03 -0.01 -0.04 Fritz (ARB/AAR, 2000) GE DASH9-44CW 50/4760ppm -0.39 -0.07 -0.02 0.02 Fritz (ARB/AAR, 2000) GE DASH9-44CW 330/4760ppm -0.38 -0.04 -0.02 0.06 Fritz (ARB/AAR, 2000) GE DASH9-44CW 50/3190ppm -0.27 -0.05 -0.03 0.01 Fritz (ARB/AAR, 2000) GE DASH9-44CW 330/3190ppm -0.25 -0.02 -0.02 0.04 Fritz (ARB/AAR, 2000) GE DASH9-44CW 3190/4760ppm -0.17 -.02 0.00 0.02 Fritz (ARB/AAR, 2000) Average -0.28 -0.05 -0.01 0.00
From the above table, staff concluded that HC and CO emissions are not affected by different sulfur levels in the fuel. From these tests, staff computed the changes in PM emissions associated with changes in sulfur level. Staff corrected the PM emissions to account for the aromatic differences because the test data were not tested at the same aromatic volume percent. Because the locomotive engine testing was performed at various fuel sulfur levels (some at 330 ppm vs. 3190 ppm and some at 50 ppm vs. 3190 ppm), staff cannot assume the average percent change in PM emission is characteristics over the whole range of sulfur levels. From previous studies that staff has analyzed, it is possible to generate estimates of the percent change at various sulfur levels and throttle positions. Locomotive engines have 8 throttle positions plus dynamic braking and idle. During idle, braking, and throttle positions 1 and 2, there are no significant differences in emissions attributable to sulfur level. For the GE 4-
PRELIMINARY DRAFT - DO NOT CITE OR QUOTE
01/05/07 21 APP-65
stroke engine, effect of sulfur on PM for throttle positions 3 to 8 can be defined by using the following equations:
Equations to correct for PM for GE (4-Stroke) engines
*composite is 75% 2 Stroke Engine and 25% 4 Stroke Engine
Data provided by industry show that when operating in California, the three main types of diesel fuel used in locomotive engines consists of CARB diesel, EPA On-Highway diesel fuel, and EPA Off-road or High Sulfur diesel fuel. Four-stroke engines and two-stroke engines show different characteristics with respect to sulfur content. From the BAH report, 4-stroke engines make up about 25%, and 2-stroke engines make up about 75% of the locomotive engine fleet. Combining industry data, 4-stroke/2-stroke engine percent change and fleet makeup, Table 26 shows the percent change in PM emissions by year for the line-haul segment of the fleet.
PRELIMINARY DRAFT - DO NOT CITE OR QUOTE
01/05/07 22 APP-65
Table 26. PM Emission Percent Change of Line-Haul Due to Sulfur, Statewide
Table 27 and Table 28 provide further details of weighted fuel sulfur level by air basin. Weighted sulfur levels vary significantly from one air basin to another.
Table 27. Class I Line Haul Weighted Fuel Sulfur by Air Basin
Interstate Air 1998 2002-2006 2007+ Locomotive Basin Weighted
Sulfur Weighted
Sulfur Weighted
Sulfur ppm ppm ppm Class I Line Haul SCC 1023 467 31 MC 2333 1149 113 MD 2352 1767 180 NEP 2560 1632 166 SC 1985 1472 145 SF 1711 899 88 SJV 1600 868 78 SS 2425 1328 129 SV 2473 1456 147
PRELIMINARY DRAFT - DO NOT CITE OR QUOTE
01/05/07 23 APP-65
Table 28. Intrastate Locomotives Weighted Fuel Sulfur by Air Basin
Intrastate Locomotive Air 1993 1994-2006 2007+ Basin Weighted
Sulfur Weighted
Sulfur Weighted
Sulfur ppm ppm ppm Class I Local/Switcher
SC SJV
346 377
312 278
15 15
MD 330 330 15 BA 468 175 15 SD 475 169 15 SV 475 169 15 SCC 475 169 15 Class III Local/Switcher
The methodology and assumptions used for estimating locomotive emissions consists of several steps taken from the Booz-Allen Hamilton's Locomotive Emission Study report (http://www.arb.ca.gov/app/library/libcc.php). First, emission factor data from various engine manufacturers such as EMD and General Electric (GE) must be gathered to calculate average emission factors for locomotives operated by the railroad companies. Second, train operations data, including throttle position profiles and time spent on various types of operations from different railroad companies needs to be estimated. Finally, the locomotive emission inventory can be calculated using train operations data, emission factors, and throttle position profiles.
Step 1 - Average Emission Factors
Engine emission factors are required for the different locomotive engines manufactured by the major locomotive suppliers EMD or GE. Emission factors are obtained from testing done by either the engine manufacturers or by Southwest Research Institute, a consulting company that has performed many tests on locomotive engines. Table A-1 lists the available emission factors.
Next, the locomotive roster from the largest railroad companies operating in the state were obtained. Table A-2 lists the locomotive roster for railroad companies in 1987.
Table A-2. Locomotive Roster 1987
Type of Service Railroad Company
Engine Manufacturer
Engine Model Horspower Rating
Units Line Haul Local Yard/Switcher
ATSF EMD 16-567BC 1500 211 X ATSF EMD 16-567C 1750 53 X ATSF EMD 16-567D2 2000 71 X X ATSF EMD 16-645E 2000 69 X X ATSF EMD 12-645E3 2300 62 X ATSF EMD 12-645E3B 2300 60 X ATSF EMD 16-645E3 2500 231 X X ATSF EMD 16-645E3 3000 18 X X ATSF EMD 16-645E3B 3000 203 X X ATSF EMD 16-645F3 3500 52 X ATSF EMD 16-645F3B 3600 15 X ATSF EMD 20-645E3 3600 243 X ATSF EMD 16-710G3 3800 20 X ATSF GE GE-12 2350 60 X ATSF GE GE-12 3000 10 X X ATSF GE GE-16 3000 226 X X
PRELIMINARY DRAFT - DO NOT CITE OR QUOTE
01/05/07 A-3 APP-80
ATSF GE GE-16 3600 43 X ATSF GE GE-16 3900 3 X ATSF GE GE-16 4000 20 X Union Pacific EMD 16-645BC 1200 56 X Union Pacific EMD 12-567A 1200 12 X Union Pacific EMD 12-645E 1500 281 X Union Pacific EMD 16-567CE 1500 35 X Union Pacific EMD 16-645E 2000 365 X X Union Pacific EMD 12-645E3C 2300 24 X Union Pacific EMD 16-567D3A 2500 16 X Union Pacific EMD 16-645E3 3000 828 X X Union Pacific EMD 16-645E3B 3000 446 X X Union Pacific EMD 16-645F3 3500 36 X Union Pacific EMD 16-645F3B 3600 60 X Union Pacific EMD 16-710G3 3800 227 X Union Pacific GE GE-12 2300 106 X Union Pacific GE GE-12 3000 57 X X Union Pacific GE GE-16 3000 156 X X Union Pacific GE GE-16 3750 60 X Union Pacific GE GE-16 3800 256 X Southern Pacific EMD 12-567C 1200 11 X Southern Pacific EMD 12-645E 1500 286 X Southern Pacific EMD 16-567BC 1500 37 X Southern Pacific EMD 16-567C 1750 326 X Southern Pacific EMD 16-567D2 2000 145 X Southern Pacific EMD 16-645E 2000 84 X Southern Pacific EMD 12-645E3 2300 12 X Southern Pacific EMD 16-645E3 2500 137 X X Southern Pacific EMD 16-645E3 3000 92 X Southern Pacific EMD 16-645E3B 3000 353 X Southern Pacific EMD 16-645F3 3500 4 X Southern Pacific EMD 20-645E3 3600 425 X Southern Pacific EMD 16-710G3 3800 65 X Southern Pacific GE GE-12 2300 15 X Southern Pacific GE GE-12 3000 107 X Southern Pacific GE GE-16 3600 20 X Southern Pacific GE GE-16 3900 92 X Source : BAH report, 1992
Using the available emission factors and the locomotive rosters, the average emission factors for each class of service can be calculated. Emission factors for models that were not available were assigned an emission factor based on horsepower rating and the number of cylinders from similar engine models.
Step 2 - Throttle Position Profiles and Train Operations Data
The railroad companies provided throttle position profiles. Locomotive engines operate at eight different constant loads and speeds called throttle notches. In
PRELIMINARY DRAFT - DO NOT CITE OR QUOTE
01/05/07 A-4 APP-80
addition, several other settings (idle and dynamic brake) are also common. For line haul and local operations, profiles were obtained from Train Performance Calculation (TPC) data and actual event recorder data, which are summarized in the BAH report.
For line haul operations, the data was modified to account for additional idle time between dispatch. Data supplied by Atchison, Topeka and Santa Fe (ATSF) indicates that the turnaround time for line haul locomotives in yards is approximately eight hours.
For local operations, several assumptions were used to develop throttle profiles. First, ten hours was used as an average hours per assignment. Second, the additional average idle time per day per locomotive was assumed to be ten hours.
The switch engine duty cycle is based upon actual tape data supplied by the ATSF railroad company on a switch engine that operated over a 2-day period. Yard engines are assumed to operate 350 days per year, with 2 weeks off for inspections and maintenance.
Train operations data provided by the railroad companies included :
Line Haul Local Yard/Switcher Train type Average trailing tons Number of units assigned
Number of runs per year Number of runs per year Number of assignments Average horsepower Average horsepower Average horsepower
Average units Average units Origin/destination Origin/destination
Link miles
Step 3 - Calculate Locomotive Emission Inventory
Emission inventories are calculated on a train-by-train basis using train operations data, average emission factor, and throttle position profiles.
Emission Inventory = Emission factor x average horsepower x time in notch per train x number of runs per year
PRELIMINARY DRAFT - DO NOT CITE OR QUOTE
01/05/07 A-5 APP-84
Appendix B
PM Fuel Correction Factor by Air Basin
Interstate Loc Air Basin PM Fuel Correction Factor pre 1993 1993
Notes: 1. Model year distribution provided by Marv Hoagland of UPRR. 2. Idling exhaust emission factors calculated from the EMFAC-WD 2006 model with the EMFAC
output option.
APP-90
Title : San Joaquin County Subarea Annual CYr 2005 Default Title Version : Emfac working draft V2 23 7 60616 Sp: 2 20 8+FCF+IM+Bugs+BER+Accr+IMDlg Run Date : 2006/08/23 08:37:39 Scen Year: 2005 Model year 1997 selected Season : Annual Area : San Joaquin County I/M Stat : Enhanced Interim (2005) Emissions: Tons Per Day *******************************************************************************************************
HHDT DSL Vehicles 338 VMT/1000 56 Trips 1711 Reactive Organic Gas Emissions Run Exh 0 31 Idle Exh 0 01 Start Ex 0 Total Ex 0 32
Diurnal 0 Hot Soak 0 Running 0 Resting 0 Total 0 32 Carbon Monoxide Emissions Run Exh 0 76 Idle Exh 0 03 Start Ex 0 Total Ex 0 8 Oxides of Nitrogen Emissions Run Exh 1 82 Idle Exh 0 07 Start Ex 0 Total Ex 1 89 Carbon Dioxide Emissions (000) Run Exh 0 18 Idle Exh 0 Start Ex 0 Total Ex 0 18 PM10 Emissions Run Exh 0 11 Idle Exh 0 Start Ex 0 Total Ex 0 11
Title : San Joaquin County Subarea Annual CYr 2005 Default Title Version : Emfac working draft V2.23.7.60616 Sp: 2.20.8+FCF+IM+Bugs+BER+Accr+IMDlg +FCF2+Po Run Date : 2006/10/27 14:39:20 Scen Year: 2005 -- Model year 1997 selected Season : Annual Area : San Joaquin ***************************************************************************************** Year: 2005 -- Model Years 1997 to 1997 Inclusive --
Emfac working draft Emission Factors: V2.23.7.60616 Sp: 2.20.8+FCF+IM+Bugs+BER+Accr+IMDlg
Title : San Joaquin County Subarea Annual CYr 2005 Default Title Version : Emfac working draft V2 23 7 60616 Sp: 2 20 8+FCF+IM+Bugs+BER+Accr+IMDl Run Date : 2006/08/23 08:37:52 Scen Year: 2005 Model year 1998 selected Season : Annual Area : San Joaquin County I/M Stat : Enhanced Interim (2005) Emissions: Tons Per Day *******************************************************************************************************
HHDT DSL Vehicles 333 VMT/1000 60 Trips 1684 Reactive Organic Gas Emissions Run Exh 0 31 Idle Exh 0 01 Start Ex 0 Total Ex 0 31
Diurnal 0 Hot Soak 0 Running 0 Resting 0 Total 0 31 Carbon Monoxide Emissions Run Exh 0 76 Idle Exh 0 03 Start Ex 0 Total Ex 0 79 Oxides of Nitrogen Emissions Run Exh 1 92 Idle Exh 0 07 Start Ex 0 Total Ex 2 Carbon Dioxide Emissions (000) Run Exh 0 19 Idle Exh 0 Start Ex 0 Total Ex 0 19 PM10 Emissions Run Exh 0 11 Idle Exh 0 Start Ex 0 Total Ex 0 11
Title : San Joaquin County Subarea Annual CYr 2005 Default Title Version : Emfac working draft V2.23.7.60616 Sp: 2.20.8+FCF+IM+Bugs+BER+Accr+IMDlg +FCF2+Po Run Date : 2006/10/30 09:16:13 Scen Year: 2005 -- Model year 1998 selected Season : Annual Area : San Joaquin ***************************************************************************************** Year: 2005 -- Model Years 1998 to 1998 Inclusive --
Emfac working draft Emission Factors: V2.23.7.60616 Sp: 2.20.8+FCF+IM+Bugs+BER+Accr+IMDlg
Title : San Joaquin County Subarea Annual CYr 2005 Default Title Version : Emfac working draft V2 23 7 60616 Sp: 2 20 8+FCF+IM+Bugs+BER+Accr+IMDl Run Date : 2006/08/23 08:38:04 Scen Year: 2005 Model year 1999 selected Season : Annual Area : San Joaquin County I/M Stat : Enhanced Interim (2005) Emissions: Tons Per Day *******************************************************************************************************
HHDT DSL Vehicles 402 VMT/1000 78 Trips 2032 Reactive Organic Gas Emissions Run Exh 0 37 Idle Exh 0 01 Start Ex 0 Total Ex 0 38
Diurnal 0 Hot Soak 0 Running 0 Resting 0 Total 0 38 Carbon Monoxide Emissions Run Exh 0 91 Idle Exh 0 04 Start Ex 0 Total Ex 0 94 Oxides of Nitrogen Emissions Run Exh 2 46 Idle Exh 0 09 Start Ex 0 Total Ex 2 55 Carbon Dioxide Emissions (000) Run Exh 0 25 Idle Exh 0 Start Ex 0 Total Ex 0 25 PM10 Emissions Run Exh 0 14 Idle Exh 0 Start Ex 0 Total Ex 0 14
Title : San Joaquin County Subarea Annual CYr 2005 Default Title Version : Emfac working draft V2.23.7.60616 Sp: 2.20.S+FCF+IM+Bugs+BER+Accr+IMDlg +FCF2+Po Run Date : 2006/10/27 14:40:15 Scen Year: 2005 -- Model year 1999 selected Season : Annual Area : San Joaquin ***************************************************************************************** Year: 2005 -- Model Years 1999 to 1999 Inclusive --
Emfac working draft Emission Factors: V2.23.7.60616 Sp: 2.20.S+FCF+IM+Bugs+BER+Accr+IMDlg
Title : San Joaquin County Subarea Annual CYr 2005 Default Title Version : Emfac working draft V2 23 7 60616 Sp: 2 20 8+FCF+IM+Bugs+BER+A Run Date : 2006/08/23 08:38:27 Scen Year: 2005 Model year 2000 selected Season : Annual Area : San Joaquin County I/M Stat : Enhanced Interim (2005) Emissions: Tons Per Day ********************************************************************************************
HHDT DSL Vehicles 399 VMT/1000 82 Trips 2019 Reactive Organic Gas Emissions Run Exh 0 35 Idle Exh 0 01 Start Ex 0 Total Ex 0 36
Diurnal 0 Hot Soak 0 Running 0 Resting 0 Total 0 36 Carbon Monoxide Emissions Run Exh 0 87 Idle Exh 0 03 Start Ex 0 Total Ex 0 91 Oxides of Nitrogen Emissions Run Exh 2 57 Idle Exh 0 09 Start Ex 0 Total Ex 2 65 Carbon Dioxide Emissions (000) Run Exh 0 26 Idle Exh 0 Start Ex 0 Total Ex 0 26 PM10 Emissions Run Exh 0 14 Idle Exh 0 Start Ex 0 Total Ex 0 14
Title : San Joaquin County Subarea Annual CYr 2005 Default Title Version : Emfac working draft V2.23.7.60616 Sp: 2.20.S+FCF+IM+Bugs+BER+Accr+IMDlg +FCF2+Po Run Date : 2006/10/27 14:40:50 Scen Year: 2005 -- Model year 2000 selected Season : Annual Area : San Joaquin ***************************************************************************************** Year: 2005 -- Model Years 2000 to 2000 Inclusive --
Emfac working draft Emission Factors: V2.23.7.60616 Sp: 2.20.S+FCF+IM+Bugs+BER+Accr+IMDlg
Title : San Joaquin County Subarea Annual CYr 2005 Default Title Version : Emfac working draft V2 23 7 60616 Sp: 2 20 8+FCF+IM+Bugs+BER+A Run Date : 2006/08/23 08:38:34 Scen Year: 2005 Model year 2005 selected Season : Annual Area : San Joaquin County I/M Stat : Enhanced Interim (2005) Emissions: Tons Per Day *********************************************************************************************
HHDT DSL Vehicles 264 VMT/1000 56 Trips 1335 Reactive Organic Gas Emissions Run Exh 0 05 Idle Exh 0 Start Ex 0 Total Ex 0 06
Diurnal 0 Hot Soak 0 Running 0 Resting 0 Total 0 06 Carbon Monoxide Emissions Run Exh 0 08 Idle Exh 0 02 Start Ex 0 Total Ex 0 1 Oxides of Nitrogen Emissions Run Exh 0 91 Idle Exh 0 06 Start Ex 0 Total Ex 0 97 Carbon Dioxide Emissions (000) Run Exh 0 18 Idle Exh 0 Start Ex 0 Total Ex 0 18 PM10 Emissions Run Exh 0 03 Idle Exh 0 Start Ex 0 Total Ex 0 03
Title : San Joaquin County Subarea Annual CYr 2005 Default Title Version : Emfac working draft V2.23.7.60616 Sp: 2.20.S+FCF+IM+Bugs+BER+Accr+IMDlg +FCF2+Po Run Date : 2006/10/25 10:23:33 Scen Year: 2005 -- Model year 2005 selected Season : Annual Area : San Joaquin ***************************************************************************************** Year: 2005 -- Model Years 2005 to 2005 Inclusive --
Emfac working draft Emission Factors: V2.23.7.60616 Sp: 2.20.S+FCF+IM+Bugs+BER+Accr+IMDlg
Notes: 1. Running exhaust emissions calculated using the EMFAC-WD 2006 model with the BURDEN output option. 2. Running exhaust emission factor calculations assumed an average speed of 15 mph. 3. Idling exhaust emissions factors calculated using the EMFAC-WD 2006 model with the EMFAC output option.
CONFIDENTIAL BUSINESS INFORMATION/TRADE SECRET
APP-102
Title : San Joaquin County Subarea Annual CYr 2005 Default Title Version : Emfac working draft V2 23 7 60616 Sp: 2 20 8+FCF+IM+Bugs+BER+A Run Date : 2006/08/23 09:12:16 Scen Year: 2005 Model year 1985 selected Season : Annual Area : San Joaquin County I/M Stat : Enhanced Interim (2005) Emissions: Tons Per Day ********************************************************************************************
HHDT DSL Vehicles 163 VMT/1000 10 Trips 826 Reactive Organic Gas Emissions Run Exh 0 1 Idle Exh 0 01 Start Ex 0 Total Ex 0 11
Diurnal 0 Hot Soak 0 Running 0 Resting 0 Total 0 11 Carbon Monoxide Emissions Run Exh 0 33 Idle Exh 0 02 Start Ex 0 Total Ex 0 35 Oxides of Nitrogen Emissions Run Exh 0 31 Idle Exh 0 02 Start Ex 0 Total Ex 0 33 Carbon Dioxide Emissions (000) Run Exh 0 03 Idle Exh 0 Start Ex 0 Total Ex 0 03 PM10 Emissions Run Exh 0 05 Idle Exh 0 Start Ex 0 Total Ex 0 05
TireWear 0 BrakeWr 0 Total 0 05 Lead 0 SOx 0 Fuel Consumption (000 gallons) Gasoline 0 Diesel 2 95
APP-103
Title : San Joaquin County Subarea Annual CYr 2005 Default Title Version : Emfac working draft V2.23.7.60616 Sp: 2.20.8+FCF+IM+Bugs+BER+Accr+IMDlg +FCF2+Po Run Date : 2006/10/27 14:38:03 Scen Year: 2005 -- Model year 1985 selected Season : Annual Area : San Joaquin ***************************************************************************************** Year: 2005 -- Model Years 1985 to 1985 Inclusive --
Emfac working draft Emission Factors: V2.23.7.60616 Sp: 2.20.8+FCF+IM+Bugs+BER+Accr+IMDlg
Title : San Joaquin County Subarea Annual CYr 2005 Default Title Version : Emfac working draft V2 23 7 60616 Sp: 2 20 8+FCF+IM+Bugs+BER Run Date : 2006/08/23 09:12:24 Scen Year: 2005 Model year 1990 selected Season : Annual Area : San Joaquin County I/M Stat : Enhanced Interim (2005) Emissions: Tons Per Day
HHDT DSL Vehicles 296 VMT/1000 26 Trips 1496 Reactive Organic Gas Emissions Run Exh 0 25 Idle Exh 0 01 Start Ex 0 Total Ex 0 26
Diurnal 0 Hot Soak 0 Running 0 Resting 0 Total 0 26 Carbon Monoxide Emissions Run Exh 0 84 Idle Exh 0 03 Start Ex 0 Total Ex 0 87 Oxides of Nitrogen Emissions Run Exh 0 82 Idle Exh 0 05 Start Ex 0 Total Ex 0 87 Carbon Dioxide Emissions (000) Run Exh 0 08 Idle Exh 0 Start Ex 0 Total Ex 0 09 PM10 Emissions Run Exh 0 12 Idle Exh 0 Start Ex 0 Total Ex 0 12
Title : San Joaquin County Subarea Annual CYr 2005 Default Title Version : Emfac working draft V2.23.7.60616 Sp: 2.20.8+FCF+IM+Bugs+BER+Accr+IMDlg +FCF2+Po Run Date : 2006/10/27 14:38:49 Scen Year: 2005 -- Model year 1990 selected Season : Annual Area : San Joaquin ***************************************************************************************** Year: 2005 -- Model Years 1990 to 1990 Inclusive --
Emfac working draft Emission Factors: V2.23.7.60616 Sp: 2.20.8+FCF+IM+Bugs+BER+Accr+IMDlg
Title : San Joaquin County Subarea Annual CYr 2005 Default Title Version : Emfac working draft V2 23 7 60616 Sp: 2 20 8+FCF+IM+Bugs+BER+Accr+IMDl Run Date : 2006/08/23 09:12:34 Scen Year: 2005 Model year 1992 selected Season : Annual Area : San Joaquin County I/M Stat : Enhanced Interim (2005) Emissions: Tons Per Day *******************************************************************************************************
MHDT DSL Vehicles 117 VMT/1000 5 Trips 3282 Reactive Organic Gas Emissions Run Exh 0 Idle Exh 0 Start Ex 0 Total Ex 0
Diurnal 0 Hot Soak 0 Running 0 Resting 0 Total 0 Carbon Monoxide Emissions Run Exh 0 05 Idle Exh 0 Start Ex 0 Total Ex 0 05 Oxides of Nitrogen Emissions Run Exh 0 1 Idle Exh 0 Start Ex 0 Total Ex 0 11 Carbon Dioxide Emissions (000) Run Exh 0 01 Idle Exh 0 Start Ex 0 Total Ex 0 01 PM10 Emissions Run Exh 0 01 Idle Exh 0 Start Ex 0 Total Ex 0 01
TireWear 0 BrakeWr 0 Total 0 01 Lead 0 SOx 0 Fuel Consumption (000 gallons) Gasoline 0 Diesel 0 79
APP-107
Title : San Joaquin County Subarea Annual CYr 2005 Default Title Version : Emfac working draft V2.23.7.60616 Sp: 2.20.8+FCF+IM+Bugs+BER+Accr+IMDlg +FCF2+Po Run Date : 2006/10/25 07:48:17 Scen Year: 2005 -- Model year 1992 selected Season : Annual Area : San Joaquin ***************************************************************************************** Year: 2005 -- Model Years 1992 to 1992 Inclusive --
Emfac working draft Emission Factors: V2.23.7.60616 Sp: 2.20.8+FCF+IM+Bugs+BER+Accr+IMDlg
Title : San Joaquin County Subarea Annual CYr 2005 Default Title Version : Emfac working draft V2 23 7 60616 Sp: 2 20 S+FCF+IM+Bugs+BER+Accr+IM Run Date : 2006/0S/23 09:12:40 Scen Year: 2005 Model year 1993 selected Season : Annual Area : San Joaquin County I/M Stat : Enhanced Interim (2005) Emissions: Tons Per Day **********************************************************************************
MHDT DSL Vehicles 130 VMT/1000 6 Trips 3646 Reactive Organic Gas Emissions Run Exh 0 01 Idle Exh 0 Start Ex 0 Total Ex 0 01
Diurnal 0 Hot Soak 0 Running 0 Resting 0 Total 0 01 Carbon Monoxide Emissions Run Exh 0 05 Idle Exh 0 Start Ex 0 Total Ex 0 06 Oxides of Nitrogen Emissions Run Exh 0 12 Idle Exh 0 Start Ex 0 Total Ex 0 12 Carbon Dioxide Emissions (000) Run Exh 0 01 Idle Exh 0 Start Ex 0 Total Ex 0 01 PM10 Emissions Run Exh 0 01 Idle Exh 0 Start Ex 0 Total Ex 0 01
TireWear 0 BrakeWr 0 Total 0 01 Lead 0 SOx 0 Fuel Consumption (000 gallons) Gasoline 0 Diesel 0 93
*******************
APP-109
Title : San Joaquin County Subarea Annual CYr 2005 Default Title Version : Emfac working draft V2.23.7.60616 Sp: 2.20.S+FCF+IM+Bugs+BER+Accr+IMDlg +FCF2+Po Run Date : 2006/10/25 07:4S:23 Scen Year: 2005 -- Model year 1993 selected Season : Annual Area : San Joaquin ***************************************************************************************** Year: 2005 -- Model Years 1993 to 1993 Inclusive --
Emfac working draft Emission Factors: V2.23.7.60616 Sp: 2.20.S+FCF+IM+Bugs+BER+Accr+IMDlg
Title : San Joaquin County Subarea Annual CYr 2005 Default Title Version : Emfac working draft V2 23 7 60616 Sp: 2 20 8+FCF+IM+Bugs+BER+Ac Run Date : 2006/08/23 09:12:49 Scen Year: 2005 Model year 1998 selected Season : Annual Area : San Joaquin County I/M Stat : Enhanced Interim (2005) Emissions: Tons Per Day **********************************************************************************************
MHDT TOT Vehicles 213 VMT/1000 13 Trips 6255 Reactive Organic Gas Emissions Run Exh 0 01 Idle Exh 0 Start Ex 0
Total Ex 0 01
Diurnal 0 Hot Soak 0 Running 0 Resting 0
Total 0 01 Carbon Monoxide Emissions Run Exh 0 07 Idle Exh 0 Start Ex 0 02
Total Ex 0 09 Oxides of Nitrogen Emissions Run Exh 0 18 Idle Exh 0 Start Ex 0
Total Ex 0 19 Carbon Dioxide Emissions (000) Run Exh 0 02 Idle Exh 0 Start Ex 0
Total Ex 0 02 PM10 Emissions Run Exh 0 01 Idle Exh 0 Start Ex 0
Total Ex 0 01
TireWear 0 BrakeWr 0
Total 0 01 Lead 0 SOx 0 Fuel Consumption (000 gallons) Gasoline 0 13 Diesel 1 85
APP-111
Title : San Joaquin County Subarea Annual CYr 2005 Default Title Version : Emfac working draft V2.23.7.60616 Sp: 2.20.8+FCF+IM+Bugs+BER+Accr+IMDlg +FCF2+Po Run Date : 2006/10/25 07:48:28 Scen Year: 2005 -- Model year 1998 selected Season : Annual Area : San Joaquin ***************************************************************************************** Year: 2005 -- Model Years 1998 to 1998 Inclusive --
Emfac working draft Emission Factors: V2.23.7.60616 Sp: 2.20.8+FCF+IM+Bugs+BER+Accr+IMDlg
Title : San Joaquin County Subarea Annual CYr 2005 Default Title Version : Emfac working draft V2 23 7 60616 Sp: 2 20 S+FCF+IM+Bugs+BER+ Run Date : 2006/0S/23 09:12:59 Scen Year: 2005 Model year 2005 selected Season : Annual Area : San Joaquin County I/M Stat : Enhanced Interim (2005) Emissions: Tons Per Day *******************************************************************************************
LHDT1 DSL Vehicles 566 VMT/1000 30 Trips 7120 Reactive Organic Gas Emissions Run Exh 0 01 Idle Exh 0 Start Ex 0 Total Ex 0 01
Diurnal 0 Hot Soak 0 Running 0 Resting 0 Total 0 01 Carbon Monoxide Emissions Run Exh 0 05 Idle Exh 0 Start Ex 0 Total Ex 0 05 Oxides of Nitrogen Emissions Run Exh 0 1S Idle Exh 0 Start Ex 0 Total Ex 0 1S Carbon Dioxide Emissions (000) Run Exh 0 02 Idle Exh 0 Start Ex 0 Total Ex 0 02 PM10 Emissions Run Exh 0 Idle Exh 0 Start Ex 0 Total Ex 0
TireWear 0 BrakeWr 0 Total 0 Lead 0 SOx 0 Fuel Consumption (000 gallons) Gasoline 0 Diesel 1 53
APP-113
Title : San Joaquin County Subarea Annual CYr 2005 Default Title Version : Emfac working draft V2.23.7.60616 Sp: 2.20.S+FCF+IM+Bugs+BER+Accr+IMDlg +FCF2+Po Run Date : 2006/10/25 07:4S:11 Scen Year: 2005 -- Model year 2005 selected Season : Annual Area : San Joaquin ***************************************************************************************** Year: 2005 -- Model Years 2005 to 2005 Inclusive --
Emfac working draft Emission Factors: V2.23.7.60616 Sp: 2.20.S+FCF+IM+Bugs+BER+Accr+IMDlg
Title : San Joaquin County Subarea Annual CYr 2005 Default Title Version : Emfac working draft V2 23 7 60616 Sp: 2 20 8+FCF+IM+Bugs+BER+A Run Date : 2006/08/23 08:38:34 Scen Year: 2005 Model year 2005 selected Season : Annual Area : San Joaquin County I/M Stat : Enhanced Interim (2005) Emissions: Tons Per Day *********************************************************************************************
HHDT DSL Vehicles 264 VMT/1000 56 Trips 1335 Reactive Organic Gas Emissions Run Exh 0 05 Idle Exh 0 Start Ex 0 Total Ex 0 06
Diurnal 0 Hot Soak 0 Running 0 Resting 0 Total 0 06 Carbon Monoxide Emissions Run Exh 0 08 Idle Exh 0 02 Start Ex 0 Total Ex 0 1 Oxides of Nitrogen Emissions Run Exh 0 91 Idle Exh 0 06 Start Ex 0 Total Ex 0 97 Carbon Dioxide Emissions (000) Run Exh 0 18 Idle Exh 0 Start Ex 0 Total Ex 0 18 PM10 Emissions Run Exh 0 03 Idle Exh 0 Start Ex 0 Total Ex 0 03
Title : San Joaquin County Subarea Annual CYr 2005 Default Title Version : Emfac working draft V2.23.7.60616 Sp: 2.20.S+FCF+IM+Bugs+BER+Accr+IMDlg +FCF2+Po Run Date : 2006/10/25 10:23:33 Scen Year: 2005 -- Model year 2005 selected Season : Annual Area : San Joaquin ***************************************************************************************** Year: 2005 -- Model Years 2005 to 2005 Inclusive --
Emfac working draft Emission Factors: V2.23.7.60616 Sp: 2.20.S+FCF+IM+Bugs+BER+Accr+IMDlg
Notes: 1. Emission factors and load factors from CARB s OFFROAD2006 model. 2. Assumes a Diesel fuel sulfur content of 130 ppm. 3. VOC evaporative emissions are negligible.
Fuel MaxHP Class D 175 Construction and Mining Equipment
C/R Pre Hand Port County Air Basin Air Dist. MY Population Activity Consumption ROG Exhaust CO Exhaust NOX Exhaust CO2 Exhaust SO2 Exhaust PM Exhaust N2O Exhaust CH4 Exhaust U P NHH P San Joaquin SJV SJU 2005 1 2.194628 8.004401 3.28275E-05 0.000425416 0.000658338 0.08808409 9.1421E-06 2.13262E-05 0 2.96197E-06
2005 Annual Mon-Sun 2270002045 Cranes D 175 Construction and Mining Equipment U P NHH P San Joaquin SJV SJU 2004 1 2.046133 7.470732 4.68235E-05 0.000409549 0.000665958 0.08212405 8.52352E-06 2.55809E-05 0 4.22481E-06 2005 Annual Mon-Sun 2270002045 Cranes D 175 Construction and Mining Equipment U P NHH P San Joaquin SJV SJU 2003 1 1.88094 6.878171 6.66804E-05 0.00038836 0.00070041 0.07549386 7.83538E-06 3.20173E-05 0 6.01646E-06 2005 Annual Mon-Sun 2270002045 Cranes D 175 Construction and Mining Equipment U P NHH P San Joaquin SJV SJU 2002 0 1.657318 6.083153 0.000115166 0.000352651 0.000843433 0.06651846 6.90384E-06 4.81975E-05 0 1.03912E-05 2005 Annual Mon-Sun 2270002045 Cranes D 175 Construction and Mining Equipment U P NHH P San Joaquin SJV SJU 2001 0 1.587829 5.83152 0.000115656 0.00034789 0.000829365 0.06372947 6.61438E-06 4.9362E-05 0 1.04355E-05 2005 Annual Mon-Sun 2270002045 Cranes D 175 Construction and Mining Equipment U P NHH P San Joaquin SJV SJU 2000 1 1.796177 6.600576 0.00013685 0.000404879 0.000962281 0.07209177 7.48229E-06 5.94423E-05 0 1.23477E-05 2005 Annual Mon-Sun 2270002045 Cranes D 175 Construction and Mining Equipment U P NHH P San Joaquin SJV SJU 1999 1 1.853527 6.815318 0.000147429 0.000429508 0.001017865 0.07439356 7.72119E-06 6.50585E-05 0 1.33023E-05 2005 Annual Mon-Sun 2270002045 Cranes D 175 Construction and Mining Equipment U P NHH P San Joaquin SJV SJU 1998 1 1.776576 6.536201 0.00014726 0.000422893 0.000999434 0.07130504 7.40063E-06 6.59215E-05 0 1.3287E-05 2005 Annual Mon-Sun 2270002045 Cranes D 175 Construction and Mining Equipment U P NHH P San Joaquin SJV SJU 1997 0 1.60354 5.90304 0.000138289 0.000391827 0.000923598 0.06436004 6.67982E-06 6.27176E-05 0 1.24776E-05 2005 Annual Mon-Sun 2270002045 Cranes D 175 Construction and Mining Equipment U P NHH P San Joaquin SJV SJU 1996 0 0.684461 2.521149 6.13208E-05 0.00017157 0.000468353 0.02747166 2.85124E-06 2.56785E-05 0 5.53288E-06 2005 Annual Mon-Sun 2270002045 Cranes D 175 Construction and Mining Equipment U P NHH P San Joaquin SJV SJU 1995 0 0.456092 1.680955 4.23892E-05 0.000117206 0.000319176 0.01830579 1.89993E-06 1.79457E-05 0 3.82471E-06 2005 Annual Mon-Sun 2270002045 Cranes D 175 Construction and Mining Equipment U P NHH P San Joaquin SJV SJU 1994 0 0.337554 1.244805 3.25032E-05 8.88751E-05 0.000241469 0.01354815 1.40614E-06 1.38995E-05 0 2.93271E-06 2005 Annual Mon-Sun 2270002045 Cranes D 175 Construction and Mining Equipment U P NHH P San Joaquin SJV SJU 1993 0 0.189058 0.6975989 1.88378E-05 5.09709E-05 0.000138181 0.007588059 7.87552E-07 8.13089E-06 0 1.6997E-06 2005 Annual Mon-Sun 2270002045 Cranes D 175 Construction and Mining Equipment U P NHH P San Joaquin SJV SJU 1992 0 0.149834 0.5531911 1.54315E-05 4.13419E-05 0.000111841 0.006013766 6.24159E-07 6.71823E-06 0 1.39236E-06 2005 Annual Mon-Sun 2270002045 Cranes D 175 Construction and Mining Equipment U P NHH P San Joaquin SJV SJU 1991 0 0.107055 0.3954802 1.13843E-05 3.02143E-05 8.15732E-05 0.004296776 4.45955E-07 4.99605E-06 0 1.02719E-06 2005 Annual Mon-Sun 2270002045 Cranes D 175 Construction and Mining Equipment U P NHH P San Joaquin SJV SJU 1990 0 0.094447 0.3491062 1.03599E-05 2.72521E-05 7.34338E-05 0.003790725 3.93433E-07 4.58052E-06 0 9.34758E-07 2005 Annual Mon-Sun 2270002045 Cranes D 175 Construction and Mining Equipment U P NHH P San Joaquin SJV SJU 1989 0 0.056687 0.2096554 6.40791E-06 1.67145E-05 4.49559E-05 0.00227519 2.36138E-07 2.85298E-06 0 5.78176E-07
2005 Annual Mon-Sun 2270002045 Cranes D 175 Construction and Mining Equipment U P NHH P San Joaquin SJV SJU 1988 0 0.018896 0.06992591 2.19928E-06 5.69081E-06 1.5279E-05 0.000758397 7.87128E-08 9.85579E-07 0 1.98437E-07
2005 Annual Mon-Sun 2270002045 Cranes D 250 Construction and Mining Equipment U N NHH P San Joaquin SJV SJU 2005 1 4.255011 21.54913 6.81295E-05 0.000392326 0.001757642 0.2384044 2.47436E-05 3.91815E-05 0 6.14722E-06 2005 Annual Mon-Sun 2270002045 Cranes D 250 Construction and Mining Equipment U N NHH P San Joaquin SJV SJU 2004 1 3.967103 20.10126 8.61804E-05 0.000377679 0.001748523 0.2222732 2.30694E-05 3.90058E-05 0 7.77592E-06 2005 Annual Mon-Sun 2270002045 Cranes D 250 Construction and Mining Equipment U N NHH P San Joaquin SJV SJU 2003 1 3.646825 18.49172 0.000110456 0.000358126 0.001800783 0.2043282 2.12069E-05 4.14874E-05 0 9.96624E-06 2005 Annual Mon-Sun 2270002045 Cranes D 250 Construction and Mining Equipment U N NHH P San Joaquin SJV SJU 2002 1 3.213255 16.31318 0.000146644 0.000325187 0.002067845 0.1800358 1.86856E-05 4.81443E-05 0 1.32315E-05 2005 Annual Mon-Sun 2270002045 Cranes D 250 Construction and Mining Equipment U N NHH P San Joaquin SJV SJU 2001 1 3.078529 15.63305 0.00014726 0.000320786 0.002033379 0.1724872 1.79022E-05 4.86121E-05 0 1.3287E-05 2005 Annual Mon-Sun 2270002045 Cranes D 250 Construction and Mining Equipment U N NHH P San Joaquin SJV SJU 2000 1 3.482484 17.68872 0.000174235 0.000373324 0.002359279 0.1951202 2.02512E-05 5.78034E-05 0 1.57209E-05 2005 Annual Mon-Sun 2270002045 Cranes D 250 Construction and Mining Equipment U N NHH P San Joaquin SJV SJU 1999 1 3.593673 18.258 0.000187694 0.000396023 0.002495584 0.2013502 2.08978E-05 6.25514E-05 0 1.69354E-05 2005 Annual Mon-Sun 2270002045 Cranes D 250 Construction and Mining Equipment U N NHH P San Joaquin SJV SJU 1998 1 3.44448 17.50433 0.000187471 0.000389914 0.002450423 0.1929911 2.00302E-05 6.27365E-05 0 1.69152E-05 2005 Annual Mon-Sun 2270002045 Cranes D 250 Construction and Mining Equipment U N NHH P San Joaquin SJV SJU 1997 1 3.108992 15.80331 0.000176043 0.000361262 0.002264506 0.1741939 1.80793E-05 5.9137E-05 0 1.58841E-05 2005 Annual Mon-Sun 2270002045 Cranes D 250 Construction and Mining Equipment U N NHH P San Joaquin SJV SJU 1996 0 1.327053 6.747201 7.80586E-05 0.000158183 0.000989106 0.07435355 7.71703E-06 2.63141E-05 0 7.0431E-06 2005 Annual Mon-Sun 2270002045 Cranes D 250 Construction and Mining Equipment U N NHH P San Joaquin SJV SJU 1995 0 0.884284 4.549594 0.000114729 0.000317223 0.000863868 0.0495456 5.14226E-06 4.85711E-05 0 1.03518E-05 2005 Annual Mon-Sun 2270002045 Cranes D 250 Construction and Mining Equipment U N NHH P San Joaquin SJV SJU 1994 0 0.65446 3.369134 8.79716E-05 0.000240545 0.00065355 0.03666881 3.8058E-06 3.76198E-05 0 7.93754E-06 2005 Annual Mon-Sun 2270002045 Cranes D 250 Construction and Mining Equipment U N NHH P San Joaquin SJV SJU 1993 0 0.36655 1.888088 5.09854E-05 0.000137955 0.000373993 0.02053748 2.13155E-06 2.20067E-05 0 4.60033E-06 2005 Annual Mon-Sun 2270002045 Cranes D 250 Construction and Mining Equipment U N NHH P San Joaquin SJV SJU 1992 0 0.290502 1.497241 4.17661E-05 0.000111894 0.000302704 0.01627658 1.68932E-06 1.81832E-05 0 3.76849E-06 2005 Annual Mon-Sun 2270002045 Cranes D 250 Construction and Mining Equipment U N NHH P San Joaquin SJV SJU 1991 0 0.207561 1.07039 3.08122E-05 8.17766E-05 0.000220782 0.01162947 1.207E-06 1.35221E-05 0 2.78013E-06 2005 Annual Mon-Sun 2270002045 Cranes D 250 Construction and Mining Equipment U N NHH P San Joaquin SJV SJU 1990 0 0.183116 0.9448746 2.80396E-05 7.37591E-05 0.000198753 0.0102598 1.06485E-06 1.23974E-05 0 2.52997E-06 2005 Annual Mon-Sun 2270002045 Cranes D 250 Construction and Mining Equipment U N NHH P San Joaquin SJV SJU 1989 0 0.109906 0.5674436 1.73434E-05 4.52388E-05 0.000121676 0.006157924 6.39121E-07 7.72174E-06 0 1.56486E-06
2005 Annual Mon-Sun 2270002045 Cranes D 250 Construction and Mining Equipment U N NHH P San Joaquin SJV SJU 1988 0 0.036635 0.1892581 5.95245E-06 1.54025E-05 4.13534E-05 0.002052642 2.1304E-07 2.66752E-06 0 5.3708E-07
2005 Annual Mon-Sun 2270002066 Tractors/Loaders/Backhoes D 120 Construction and Mining Equipment U P NHH NP San Joaquin SJV SJU 2005 21 52.83642 124.3461 0.000847881 0.007635774 0.01197677 1.365334 0.000147736 0.000591943 0 7.65029E-05 2005 Annual Mon-Sun 2270002066 Tractors/Loaders/Backhoes D 120 Construction and Mining Equipment U P NHH NP San Joaquin SJV SJU 2004 21 52.63005 124.1481 0.001456189 0.008011786 0.01311738 1.360002 0.000147159 0.000844465 0 0.00013139 2005 Annual Mon-Sun 2270002066 Tractors/Loaders/Backhoes D 120 Construction and Mining Equipment U P NHH NP San Joaquin SJV SJU 2003 21 51.94328 123.2769 0.003111349 0.008743813 0.0162726 1.342255 0.000145239 0.001563528 0 0.000280732 2005 Annual Mon-Sun 2270002066 Tractors/Loaders/Backhoes D 120 Construction and Mining Equipment U P NHH NP San Joaquin SJV SJU 2002 20 51.20804 121.6043 0.003185188 0.008817556 0.01636684 1.323256 0.000143183 0.001629696 0 0.000287394 2005 Annual Mon-Sun 2270002066 Tractors/Loaders/Backhoes D 120 Construction and Mining Equipment U P NHH NP San Joaquin SJV SJU 2001 20 50.31062 119.5442 0.003245178 0.00885707 0.01639888 1.300066 0.000140674 0.001687887 0 0.000292807 2005 Annual Mon-Sun 2270002066 Tractors/Loaders/Backhoes D 120 Construction and Mining Equipment U P NHH NP San Joaquin SJV SJU 2000 24 61.50771 146.2368 0.004109012 0.01106553 0.02043847 1.589408 0.000171982 0.002169602 0 0.00037075 2005 Annual Mon-Sun 2270002066 Tractors/Loaders/Backhoes D 120 Construction and Mining Equipment U P NHH NP San Joaquin SJV SJU 1999 24 60.23257 143.2902 0.004162481 0.01106844 0.02039653 1.556458 0.000168416 0.002228484 0 0.000375574 2005 Annual Mon-Sun 2270002066 Tractors/Loaders/Backhoes D 120 Construction and Mining Equipment U P NHH NP San Joaquin SJV SJU 1998 23 58.78019 139.918 0.004197417 0.01102826 0.02027726 1.518926 0.000164355 0.002276103 0 0.000378726 2005 Annual Mon-Sun 2270002066 Tractors/Loaders/Backhoes D 120 Construction and Mining Equipment U P NHH NP San Joaquin SJV SJU 1997 23 57.50322 136.9596 0.004238601 0.01101046 0.02511401 1.485928 0.000160785 0.00212209 0 0.000382442 2005 Annual Mon-Sun 2270002066 Tractors/Loaders/Backhoes D 120 Construction and Mining Equipment U P NHH NP San Joaquin SJV SJU 1996 23 56.77089 135.2955 0.004315304 0.0110892 0.02523983 1.467004 0.000158737 0.002184381 0 0.000389363 2005 Annual Mon-Sun 2270002066 Tractors/Loaders/Backhoes D 120 Construction and Mining Equipment U P NHH NP San Joaquin SJV SJU 1995 18 44.84735 106.9429 0.003512201 0.008933119 0.02029079 1.15889 0.000125398 0.001796155 0 0.0003169 2005 Annual Mon-Sun 2270002066 Tractors/Loaders/Backhoes D 120 Construction and Mining Equipment U P NHH NP San Joaquin SJV SJU 1994 12 30.95396 73.85647 0.002495401 0.006285092 0.01424784 0.7998745 8.65504E-05 0.001288419 0 0.000225156 2005 Annual Mon-Sun 2270002066 Tractors/Loaders/Backhoes D 120 Construction and Mining Equipment U P NHH NP San Joaquin SJV SJU 1993 8 21.19232 50.59505 0.001757236 0.004384765 0.00992101 0.5476264 5.92559E-05 0.000915445 0 0.000158553
2005 Annual Mon-Sun 2270002066 Tractors/Loaders/Backhoes D 120 Construction and Mining Equipment U P NHH NP San Joaquin SJV SJU 1992 8 21.16679 50.56401 0.001803845 0.004461125 0.01007523 0.5469669 5.91845E-05 0.000947644 0 0.000162758
2005 Annual Mon-Sun 2270002066 Tractors/Loaders/Backhoes D 120 Construction and Mining Equipment U P NHH NP San Joaquin SJV SJU 1991 8 19.90047 47.56706 0.001741737 0.004270986 0.009628681 0.5142437 5.56437E-05 0.000922259 0 0.000157154 2005 Annual Mon-Sun 2270002066 Tractors/Loaders/Backhoes D 120 Construction and Mining Equipment U P NHH NP San Joaquin SJV SJU 1990 12 30.7187 73.46871 0.002759288 0.006711248 0.01510414 0.7937954 8.58926E-05 0.001471944 0 0.000248966 2005 Annual Mon-Sun 2270002066 Tractors/Loaders/Backhoes D 120 Construction and Mining Equipment U P NHH NP San Joaquin SJV SJU 1989 7 18.16577 43.47201 0.001673545 0.004038819 0.009074569 0.4694177 5.07933E-05 0.000899027 0 0.000151001 2005 Annual Mon-Sun 2270002066 Tractors/Loaders/Backhoes D 120 Construction and Mining Equipment U P NHH NP San Joaquin SJV SJU 1988 5 12.33014 29.52433 0.001164313 0.002788932 0.006256216 0.3186203 3.44763E-05 0.000629619 0 0.000105054 2005 Annual Mon-Sun 2270002066 Tractors/Loaders/Backhoes D 120 Construction and Mining Equipment U P NHH NP San Joaquin SJV SJU 1987 4 10.63592 25.7886 0.001496278 0.003365593 0.008148599 0.2748404 2.97391E-05 0.000681464 0 0.000135007 2005 Annual Mon-Sun 2270002066 Tractors/Loaders/Backhoes D 120 Construction and Mining Equipment U P NHH NP San Joaquin SJV SJU 1986 4 9.506438 23.06911 0.001369203 0.003058636 0.007394464 0.2456538 2.6581E-05 0.0006273 0 0.000123541 2005 Annual Mon-Sun 2270002066 Tractors/Loaders/Backhoes D 120 Construction and Mining Equipment U P NHH NP San Joaquin SJV SJU 1985 3 8.659329 21.03087 0.001276181 0.00283204 0.006836845 0.2237639 2.42124E-05 0.000587984 0 0.000115148 2005 Annual Mon-Sun 2270002066 Tractors/Loaders/Backhoes D 120 Construction and Mining Equipment U P NHH NP San Joaquin SJV SJU 1984 3 7.341607 17.84528 0.001106554 0.002440038 0.005882333 0.1897128 2.05279E-05 0.000512566 0 9.98426E-05 2005 Annual Mon-Sun 2270002066 Tractors/Loaders/Backhoes D 120 Construction and Mining Equipment U P NHH NP San Joaquin SJV SJU 1983 3 6.494499 15.79928 0.001000615 0.002192962 0.005279572 0.1678229 1.81593E-05 0.00046586 0 9.02839E-05 2005 Annual Mon-Sun 2270002066 Tractors/Loaders/Backhoes D 120 Construction and Mining Equipment U P NHH NP San Joaquin SJV SJU 1982 2 5.74151 13.97902 0.00090382 0.001969174 0.004734607 0.1483651 1.60538E-05 0.000422842 0 8.15502E-05 2005 Annual Mon-Sun 2270002066 Tractors/Loaders/Backhoes D 120 Construction and Mining Equipment U P NHH NP San Joaquin SJV SJU 1981 2 4.894406 11.92639 0.000786853 0.001704616 0.004093314 0.1264753 1.36852E-05 0.000369828 0 7.09965E-05 2005 Annual Mon-Sun 2270002066 Tractors/Loaders/Backhoes D 120 Construction and Mining Equipment U P NHH NP San Joaquin SJV SJU 1980 2 3.953171 9.640799 0.000648768 0.001397784 0.003352378 0.102153 1.10535E-05 0.000306277 0 5.85373E-05 2005 Annual Mon-Sun 2270002066 Tractors/Loaders/Backhoes D 120 Construction and Mining Equipment U P NHH NP San Joaquin SJV SJU 1979 1 3.200188 7.810897 0.000535906 0.001148523 0.002751265 0.08269535 8.94804E-06 0.000254067 0 4.83539E-05 2005 Annual Mon-Sun 2270002066 Tractors/Loaders/Backhoes D 120 Construction and Mining Equipment U P NHH NP San Joaquin SJV SJU 1978 1 2.353078 5.748039 0.000401925 0.00085699 0.002050514 0.0608054 6.57944E-06 0.00019132 0 3.6265E-05 2005 Annual Mon-Sun 2270002066 Tractors/Loaders/Backhoes D 120 Construction and Mining Equipment U P NHH NP San Joaquin SJV SJU 1977 1 1.882463 4.602217 0.000327841 0.000695582 0.001662431 0.04864432 5.26355E-06 0.00015666 0 2.95806E-05 2005 Annual Mon-Sun 2270002066 Tractors/Loaders/Backhoes D 120 Construction and Mining Equipment U P NHH NP San Joaquin SJV SJU 1976 1 1.317723 3.224203 0.0002339 0.000493901 0.001179116 0.03405103 3.68449E-06 0.000112186 0 2.11044E-05 2005 Annual Mon-Sun 2270002066 Tractors/Loaders/Backhoes D 120 Construction and Mining Equipment U P NHH NP San Joaquin SJV SJU 1975 0 0.705924 1.728671 0.000127666 0.000268336 0.000639927 0.01824162 1.97383E-06 6.14512E-05 0 1.15191E-05 2005 Annual Mon-Sun 2270002066 Tractors/Loaders/Backhoes D 120 Construction and Mining Equipment U P NHH NP San Joaquin SJV SJU 1974 0 0.235308 0.5766972 4.33432E-05 9.06941E-05 0.000216062 0.006080542 6.57944E-07 2.09343E-05 0 3.91078E-06 2005 Annual Mon-Sun 2270002066 Tractors/Loaders/Backhoes D 250 Construction and Mining Equipment U N NHH NP San Joaquin SJV SJU 2005 1 1.288692 9.992829 3.06597E-05 0.000181152 0.000813153 0.1105588 1.14747E-05 1.8016E-05 0 2.76637E-06 2005 Annual Mon-Sun 2270002066 Tractors/Loaders/Backhoes D 250 Construction and Mining Equipment U N NHH NP San Joaquin SJV SJU 2004 1 1.283659 9.957986 0.000040021 0.000184772 0.000859685 0.110127 1.14299E-05 1.8846E-05 0 3.61103E-06 2005 Annual Mon-Sun 2270002066 Tractors/Loaders/Backhoes D 250 Construction and Mining Equipment U N NHH NP San Joaquin SJV SJU 2003 1 1.266909 9.834395 5.47531E-05 0.000186632 0.000944245 0.10869 1.12808E-05 2.12167E-05 0 4.94028E-06 2005 Annual Mon-Sun 2270002066 Tractors/Loaders/Backhoes D 250 Construction and Mining Equipment U N NHH NP San Joaquin SJV SJU 2002 0 1.248976 9.706854 8.3366E-05 0.000188201 0.001200508 0.1071515 1.11211E-05 2.72161E-05 0 7.52198E-06 2005 Annual Mon-Sun 2270002066 Tractors/Loaders/Backhoes D 250 Construction and Mining Equipment U N NHH NP San Joaquin SJV SJU 2001 0 1.227088 9.538467 8.49354E-05 0.000189039 0.00120287 0.1052737 1.09262E-05 2.7853E-05 0 7.66358E-06 2005 Annual Mon-Sun 2270002066 Tractors/Loaders/Backhoes D 250 Construction and Mining Equipment U N NHH NP San Joaquin SJV SJU 2000 1 1.500188 11.66345 0.000107543 0.000236169 0.001499189 0.1287033 1.33579E-05 3.54137E-05 0 9.70347E-06 2005 Annual Mon-Sun 2270002066 Tractors/Loaders/Backhoes D 250 Construction and Mining Equipment U N NHH NP San Joaquin SJV SJU 1999 1 1.469088 11.42372 0.000108942 0.000236226 0.001496125 0.1260351 1.3081E-05 3.60131E-05 0 9.82967E-06 2005 Annual Mon-Sun 2270002066 Tractors/Loaders/Backhoes D 250 Construction and Mining Equipment U N NHH NP San Joaquin SJV SJU 1998 1 1.433663 11.15027 0.000109856 0.000235363 0.001487388 0.1229959 1.27656E-05 3.64461E-05 0 9.9121E-06 2005 Annual Mon-Sun 2270002066 Tractors/Loaders/Backhoes D 250 Construction and Mining Equipment U N NHH NP San Joaquin SJV SJU 1997 1 1.402518 10.91002 0.000110933 0.000234978 0.001481823 0.120324 1.24882E-05 3.69275E-05 0 1.00093E-05 2005 Annual Mon-Sun 2270002066 Tractors/Loaders/Backhoes D 250 Construction and Mining Equipment U N NHH NP San Joaquin SJV SJU 1996 1 1.384655 10.77301 0.00011294 0.000236653 0.001489356 0.1187915 1.23292E-05 3.77141E-05 0 1.01904E-05 2005 Annual Mon-Sun 2270002066 Tractors/Loaders/Backhoes D 250 Construction and Mining Equipment U N NHH NP San Joaquin SJV SJU 1995 0 1.093836 8.603083 0.000195426 0.000559612 0.001534724 0.09384177 9.73968E-06 8.00445E-05 0 1.7633E-05 2005 Annual Mon-Sun 2270002066 Tractors/Loaders/Backhoes D 250 Construction and Mining Equipment U N NHH NP San Joaquin SJV SJU 1994 0 0.754976 5.940477 0.000138853 0.000393728 0.00107769 0.06477043 6.72242E-06 5.74156E-05 0 1.25285E-05 2005 Annual Mon-Sun 2270002066 Tractors/Loaders/Backhoes D 250 Construction and Mining Equipment U N NHH NP San Joaquin SJV SJU 1993 0 0.516886 4.068829 9.77814E-05 0.000274681 0.000750433 0.04434435 4.60243E-06 4.07933E-05 0 8.82266E-06
APP-119
CY Season AvgDays Code 2005 Annual Mon-Sun
Equipment 2270002066 Tractors/Loaders/Backhoes
Fuel MaxHP Class D 250 Construction and Mining Equipment
C/R Pre Hand Port County Air Basin Air Dist. MY Population Activity Consumption ROG Exhaust CO Exhaust NOX Exhaust CO2 Exhaust SO2 Exhaust PM Exhaust N2O Exhaust CH4 Exhaust U N NHH NP San Joaquin SJV SJU 1992 0 0.516264 4.065677 0.000100377 0.000279464 0.000762119 0.04429097 4.59689E-06 4.22268E-05 0 9.05688E-06
2005 Annual Mon-Sun 2270002066 Tractors/Loaders/Backhoes D 250 Construction and Mining Equipment U N NHH NP San Joaquin SJV SJU 1991 0 0.485377 3.824084 9.69234E-05 0.000267553 0.00072836 0.04164121 4.32187E-06 4.10944E-05 0 8.74524E-062005 Annual Mon-Sun 2270002066 Tractors/Loaders/Backhoes D 250 Construction and Mining Equipment U N NHH NP San Joaquin SJV SJU 1990 0 0.749236 5.90545 0.000153551 0.000420421 0.001142579 0.06427805 6.67131E-06 6.55857E-05 0 1.38546E-05
2005 Annual Mon-Sun 2270002066 Tractors/Loaders/Backhoes D 250 Construction and Mining Equipment U N NHH NP San Joaquin SJV SJU 1989 0 0.443067 3.493737 9.31325E-05 0.000253008 0.000686478 0.03801138 3.94514E-06 4.00571E-05 0 8.40319E-062005 Annual Mon-Sun 2270002066 Tractors/Loaders/Backhoes D 250 Construction and Mining Equipment U N NHH NP San Joaquin SJV SJU 1988 0 0.300735 2.372413 6.4795E-05 0.00017471 0.000473285 0.02580047 2.67779E-06 2.80526E-05 0 5.84635E-062005 Annual Mon-Sun 2270002066 Tractors/Loaders/Backhoes D 250 Construction and Mining Equipment U N NHH NP San Joaquin SJV SJU 1987 0 0.259413 2.065674 7.40434E-05 0.000238381 0.000557896 0.02225537 2.30985E-06 3.61281E-05 0 6.68082E-062005 Annual Mon-Sun 2270002066 Tractors/Loaders/Backhoes D 250 Construction and Mining Equipment U N NHH NP San Joaquin SJV SJU 1986 0 0.231864 1.847409 6.77551E-05 0.000216637 0.000506249 0.01989197 2.06456E-06 3.32565E-05 0 6.11344E-062005 Annual Mon-Sun 2270002066 Tractors/Loaders/Backhoes D 250 Construction and Mining Equipment U N NHH NP San Joaquin SJV SJU 1985 0 0.211203 1.683789 6.31519E-05 0.000200585 0.000468059 0.01811942 1.88058E-06 3.11721E-05 0 5.6981E-062005 Annual Mon-Sun 2270002066 Tractors/Loaders/Backhoes D 250 Construction and Mining Equipment U N NHH NP San Joaquin SJV SJU 1984 0 0.179064 1.43043 5.85075E-05 0.000177125 0.000402701 0.01536212 1.59441E-06 2.71738E-05 0 5.27904E-062005 Annual Mon-Sun 2270002066 Tractors/Loaders/Backhoes D 250 Construction and Mining Equipment U N NHH NP San Joaquin SJV SJU 1983 0 0.158402 1.266167 5.29064E-05 0.000159192 0.000361426 0.01358956 1.41044E-06 2.46976E-05 0 4.77366E-062005 Annual Mon-Sun 2270002066 Tractors/Loaders/Backhoes D 250 Construction and Mining Equipment U N NHH NP San Joaquin SJV SJU 1982 0 0.140037 1.120062 4.77889E-05 0.00014295 0.000324111 0.01201397 1.24691E-06 2.24169E-05 0 4.31191E-062005 Annual Mon-Sun 2270002066 Tractors/Loaders/Backhoes D 250 Construction and Mining Equipment U N NHH NP San Joaquin SJV SJU 1981 0 0.119376 0.9553999 4.16045E-05 0.000123747 0.000280204 0.01024141 1.06294E-06 1.96064E-05 0 3.75391E-062005 Annual Mon-Sun 2270002066 Tractors/Loaders/Backhoes D 250 Construction and Mining Equipment U N NHH NP San Joaquin SJV SJU 1980 0 0.096419 0.772148 3.43035E-05 0.000101474 0.000229478 0.008271906 8.58528E-07 1.62372E-05 0 3.09515E-062005 Annual Mon-Sun 2270002066 Tractors/Loaders/Backhoes D 250 Construction and Mining Equipment U N NHH NP San Joaquin SJV SJU 1979 0 0.078053 0.6263924 3.01529E-05 8.51326E-05 0.000205689 0.006696306 6.94999E-07 1.34693E-05 0 2.72064E-062005 Annual Mon-Sun 2270002066 Tractors/Loaders/Backhoes D 250 Construction and Mining Equipment U N NHH NP San Joaquin SJV SJU 1978 0 0.057392 0.4608803 2.26146E-05 6.35211E-05 0.000153301 0.004923755 5.11028E-07 1.01427E-05 0 2.04048E-062005 Annual Mon-Sun 2270002066 Tractors/Loaders/Backhoes D 250 Construction and Mining Equipment U N NHH NP San Joaquin SJV SJU 1977 0 0.045914 0.3689424 1.84464E-05 5.15558E-05 0.000124287 0.003939004 4.08823E-07 8.30528E-06 0 1.66439E-062005 Annual Mon-Sun 2270002066 Tractors/Loaders/Backhoes D 250 Construction and Mining Equipment U N NHH NP San Joaquin SJV SJU 1976 0 0.03214 0.2584263 1.31608E-05 3.66063E-05 8.81539E-05 0.002757302 2.86176E-07 5.94746E-06 0 1.18748E-062005 Annual Mon-Sun 2270002066 Tractors/Loaders/Backhoes D 250 Construction and Mining Equipment U N NHH NP San Joaquin SJV SJU 1975 0 0.017218 0.138532 7.18346E-06 1.98876E-05 4.78429E-05 0.001477126 1.53309E-07 3.2578E-06 0 6.48152E-072005 Annual Mon-Sun 2270002066 Tractors/Loaders/Backhoes D 250 Construction and Mining Equipment U N NHH NP San Joaquin SJV SJU 1974 0 0.005739 0.04620709 2.43883E-06 6.72156E-06 1.61535E-05 0.000492376 5.11029E-08 1.10982E-06 0 2.20051E-07
2005 Annual Mon-Sun 2270003020 Forklifts D 120 Industrial Equipment U P NHH NP San Joaquin SJV SJU 2005 1 5.150716 7.318703 5.20808E-05 0.000454515 0.000709732 0.0803431 8.69352E-06 3.59181E-05 0 4.69916E-062005 Annual Mon-Sun 2270003020 Forklifts D 120 Industrial Equipment U P NHH NP San Joaquin SJV SJU 2004 1 5.029932 7.167117 9.13156E-05 0.000477802 0.000774562 0.07845908 8.48966E-06 5.29917E-05 0 8.23926E-062005 Annual Mon-Sun 2270003020 Forklifts D 120 Industrial Equipment U P NHH NP San Joaquin SJV SJU 2003 1 5.095717 7.310581 0.000201217 0.000546221 0.00101035 0.07948521 8.60069E-06 0.0001053 0 1.81555E-052005 Annual Mon-Sun 2270003020 Forklifts D 120 Industrial Equipment U P NHH NP San Joaquin SJV SJU 2002 1 5.718499 8.213609 0.000241372 0.000639056 0.001176686 0.08919966 9.65184E-06 0.000129828 0 2.17786E-052005 Annual Mon-Sun 2270003020 Forklifts D 120 Industrial Equipment U P NHH NP San Joaquin SJV SJU 2001 1 5.631436 8.097967 0.000253024 0.000655007 0.001200973 0.08784165 9.5049E-06 0.000139332 0 2.283E-05
2005 Annual Mon-Sun 2270003020 Forklifts D 120 Industrial Equipment U P NHH NP San Joaquin SJV SJU 2000 1 6.279312 9.04009 0.000299224 0.000758997 0.001386196 0.09794746 1.05984E-05 0.000168163 0 2.69985E-05
2005 Annual Mon-Sun 2270003020 Forklifts D 120 Industrial Equipment U P NHH NP San Joaquin SJV SJU 1999 1 6.088161 8.775064 0.000306685 0.000763655 0.001389622 0.09496579 1.02758E-05 0.000175456 0 2.76717E-052005 Annual Mon-Sun 2270003020 Forklifts D 120 Industrial Equipment U P NHH NP San Joaquin SJV SJU 1998 1 5.947677 8.582513 0.000315795 0.000773156 0.001402127 0.09277447 1.00387E-05 0.000183533 0 2.84937E-052005 Annual Mon-Sun 2270003020 Forklifts D 120 Industrial Equipment U P NHH NP San Joaquin SJV SJU 1997 1 5.684893 8.212811 0.000317315 0.00076492 0.001718235 0.08867546 9.59512E-06 0.000170633 0 2.86308E-052005 Annual Mon-Sun 2270003020 Forklifts D 120 Industrial Equipment U P NHH NP San Joaquin SJV SJU 1996 1 5.569162 8.054917 0.000326012 0.000774744 0.001734945 0.08687024 9.39979E-06 0.000177518 0 2.94156E-052005 Annual Mon-Sun 2270003020 Forklifts D 120 Industrial Equipment U P NHH NP San Joaquin SJV SJU 1995 1 4.839629 7.007844 0.000296478 0.000695326 0.001552593 0.07549065 8.16846E-06 0.000163267 0 2.67507E-052005 Annual Mon-Sun 2270003020 Forklifts D 120 Industrial Equipment U P NHH NP San Joaquin SJV SJU 1994 1 3.911213 5.670019 0.000250248 0.000579773 0.001291051 0.06100882 6.60145E-06 0.000139222 0 2.25794E-052005 Annual Mon-Sun 2270003020 Forklifts D 120 Industrial Equipment U P NHH NP San Joaquin SJV SJU 1993 0 1.077971 1.564517 7.19047E-05 0.000164707 0.000365832 0.01681468 1.81943E-06 4.03761E-05 0 6.48785E-062005 Annual Mon-Sun 2270003020 Forklifts D 120 Industrial Equipment U P NHH NP San Joaquin SJV SJU 1992 0 0.764966 1.111513 5.3108E-05 0.00012037 0.000266707 0.01193228 1.29113E-06 3.00752E-05 0 4.79185E-062005 Annual Mon-Sun 2270003020 Forklifts D 120 Industrial Equipment U P NHH NP San Joaquin SJV SJU 1991 0 0.667375 0.9708257 4.81491E-05 0.000108057 0.000238876 0.01041001 1.12641E-06 2.74797E-05 0 4.34441E-062005 Annual Mon-Sun 2270003020 Forklifts D 120 Industrial Equipment U P NHH NP San Joaquin SJV SJU 1990 0 1.035729 1.508398 7.75436E-05 0.000172422 0.000380336 0.01615576 1.74813E-06 4.45736E-05 0 6.99664E-062005 Annual Mon-Sun 2270003020 Forklifts D 120 Industrial Equipment U P NHH NP San Joaquin SJV SJU 1989 0 0.818524 1.193435 6.35095E-05 0.000139996 0.000308171 0.0127677 1.38153E-06 3.67485E-05 0 5.73036E-062005 Annual Mon-Sun 2270003020 Forklifts D 120 Industrial Equipment U P NHH NP San Joaquin SJV SJU 1988 0 0.716208 1.045452 5.752E-05 0.000125762 0.000276297 0.01117173 1.20884E-06 3.34872E-05 0 5.18994E-062005 Annual Mon-Sun 2270003020 Forklifts D 120 Industrial Equipment U P NHH NP San Joaquin SJV SJU 1987 0 0.579788 0.8610737 7.00129E-05 0.000143687 0.00034074 0.009043789 9.78582E-07 3.43096E-05 0 6.31715E-062005 Annual Mon-Sun 2270003020 Forklifts D 120 Industrial Equipment U P NHH NP San Joaquin SJV SJU 1986 0 0.420631 0.6257008 5.24584E-05 0.000106883 0.000253021 0.00656118 7.09952E-07 2.58436E-05 0 4.73324E-062005 Annual Mon-Sun 2270003020 Forklifts D 120 Industrial Equipment U P NHH NP San Joaquin SJV SJU 1985 0 0.312631 0.4657914 4.02266E-05 8.14015E-05 0.00019238 0.004876553 5.27667E-07 1.99159E-05 0 3.62958E-062005 Annual Mon-Sun 2270003020 Forklifts D 120 Industrial Equipment U P NHH NP San Joaquin SJV SJU 1984 0 0.215999 0.3223329 2.86478E-05 5.75963E-05 0.000135904 0.003369253 3.6457E-07 1.42491E-05 0 2.58484E-062005 Annual Mon-Sun 2270003020 Forklifts D 120 Industrial Equipment U P NHH NP San Joaquin SJV SJU 1983 0 0.113684 0.1699193 1.55277E-05 3.10271E-05 7.31008E-05 0.001773291 1.91879E-07 7.7569E-06 0 1.40104E-062005 Annual Mon-Sun 2270003020 Forklifts D 120 Industrial Equipment U P NHH NP San Joaquin SJV SJU 1982 0 0.037895 0.05672988 5.32587E-06 1.05802E-05 2.4891E-05 0.000591097 6.39596E-08 2.67143E-06 0 4.80545E-072005 Annual Mon-Sun 2270003020 Forklifts D 50 Industrial Equipment U P NHH NP San Joaquin SJV SJU 2005 1 3.280057 2.192719 2.19859E-05 0.000138521 0.000202001 0.02404081 2.86678E-06 1.41307E-05 0 1.98375E-062005 Annual Mon-Sun 2270003020 Forklifts D 50 Industrial Equipment U P NHH NP San Joaquin SJV SJU 2004 1 3.20314 2.155385 4.4948E-05 0.000172341 0.000209596 0.02347706 2.79955E-06 1.76824E-05 0 4.05558E-062005 Annual Mon-Sun 2270003020 Forklifts D 50 Industrial Equipment U P NHH NP San Joaquin SJV SJU 2003 1 3.245034 2.220459 0.000114897 0.000250689 0.000238586 0.02378411 2.83617E-06 2.78397E-05 0 1.0367E-052005 Annual Mon-Sun 2270003020 Forklifts D 50 Industrial Equipment U P NHH NP San Joaquin SJV SJU 2002 1 3.641633 2.503944 0.00014775 0.000316835 0.000276 0.02669093 3.18279E-06 3.44735E-05 0 1.33313E-052005 Annual Mon-Sun 2270003020 Forklifts D 50 Industrial Equipment U P NHH NP San Joaquin SJV SJU 2001 1 3.586192 2.477747 0.000164026 0.000346977 0.000279927 0.02628459 3.13434E-06 3.71308E-05 0 1.47998E-052005 Annual Mon-Sun 2270003020 Forklifts D 50 Industrial Equipment U P NHH NP San Joaquin SJV SJU 2000 1 3.998765 2.776094 0.000203552 0.000425884 0.000321196 0.0293085 3.49493E-06 4.49508E-05 0 1.83662E-052005 Annual Mon-Sun 2270003020 Forklifts D 50 Industrial Equipment U P NHH NP San Joaquin SJV SJU 1999 1 3.877036 2.704475 0.000217383 0.000450721 0.000320207 0.02841631 3.38854E-06 4.70226E-05 0 1.96141E-052005 Annual Mon-Sun 2270003020 Forklifts D 50 Industrial Equipment U P NHH NP San Joaquin SJV SJU 1998 1 3.787572 2.690743 0.000288189 0.000582543 0.000377243 0.02776059 3.31035E-06 5.6975E-05 0 2.60029E-052005 Annual Mon-Sun 2270003020 Forklifts D 50 Industrial Equipment U P NHH NP San Joaquin SJV SJU 1997 1 3.620229 2.586714 0.000298706 0.000599918 0.000368704 0.02653406 3.16409E-06 5.81703E-05 0 2.69517E-052005 Annual Mon-Sun 2270003020 Forklifts D 50 Industrial Equipment U P NHH NP San Joaquin SJV SJU 1996 1 3.546533 2.548609 0.000315401 0.000629942 0.000369162 0.02599391 3.09968E-06 6.06232E-05 0 2.84582E-052005 Annual Mon-Sun 2270003020 Forklifts D 50 Industrial Equipment U P NHH NP San Joaquin SJV SJU 1995 1 3.081953 2.227399 0.000293878 0.000584126 0.000327723 0.02258882 2.69363E-06 5.58424E-05 0 2.65161E-052005 Annual Mon-Sun 2270003020 Forklifts D 50 Industrial Equipment U P NHH NP San Joaquin SJV SJU 1994 1 2.490721 1.810322 0.000253497 0.000501731 0.000270446 0.01825546 2.17689E-06 4.7684E-05 0 2.28726E-052005 Annual Mon-Sun 2270003020 Forklifts D 50 Industrial Equipment U P NHH NP San Joaquin SJV SJU 1993 0 0.68647 0.5017614 7.42751E-05 0.000146458 7.60793E-05 0.005031405 5.99976E-07 1.38462E-05 0 6.70173E-062005 Annual Mon-Sun 2270003020 Forklifts D 50 Industrial Equipment U P NHH NP San Joaquin SJV SJU 1992 0 0.487143 0.358066 5.58367E-05 0.000109733 5.50823E-05 0.003570457 4.25764E-07 1.03253E-05 0 5.03805E-062005 Annual Mon-Sun 2270003020 Forklifts D 50 Industrial Equipment U P NHH NP San Joaquin SJV SJU 1991 0 0.424996 0.3141299 5.14427E-05 0.000100795 4.90095E-05 0.003114959 3.71447E-07 9.44391E-06 0 4.64159E-062005 Annual Mon-Sun 2270003020 Forklifts D 50 Industrial Equipment U P NHH NP San Joaquin SJV SJU 1990 0 0.659569 0.490218 8.4072E-05 0.000164283 7.75408E-05 0.004834238 5.76465E-07 1.53328E-05 0 7.58568E-062005 Annual Mon-Sun 2270003020 Forklifts D 50 Industrial Equipment U P NHH NP San Joaquin SJV SJU 1989 0 0.521249 0.389552 6.97886E-05 0.000136039 6.24499E-05 0.003820438 4.55573E-07 1.26519E-05 0 6.29691E-062005 Annual Mon-Sun 2270003020 Forklifts D 50 Industrial Equipment U P NHH NP San Joaquin SJV SJU 1988 0 0.456093 0.3427294 6.39941E-05 0.000124466 5.56677E-05 0.003342882 3.98626E-07 1.15381E-05 0 5.77408E-062005 Annual Mon-Sun 2270003020 Forklifts D 50 Industrial Equipment U P NHH NP San Joaquin SJV SJU 1987 0 0.369218 0.279408 5.53586E-05 0.000105155 4.64837E-05 0.002706144 3.22697E-07 9.71901E-06 0 4.99492E-062005 Annual Mon-Sun 2270003020 Forklifts D 50 Industrial Equipment U P NHH NP San Joaquin SJV SJU 1986 0 0.267864 0.2038209 4.19198E-05 7.94788E-05 3.43307E-05 0.001963279 2.34114E-07 7.32574E-06 0 3.78235E-062005 Annual Mon-Sun 2270003020 Forklifts D 50 Industrial Equipment U P NHH NP San Joaquin SJV SJU 1985 0 0.199088 0.1523158 3.24629E-05 6.1443E-05 2.59674E-05 0.001459194 1.74003E-07 5.64897E-06 0 2.92908E-06
2005 Annual Mon-Sun 2270003020 Forklifts D 50 Industrial Equipment U P NHH NP San Joaquin SJV SJU 1984 0 0.137552 0.105808 2.33315E-05 4.40897E-05 1.82529E-05 0.001008171 1.20221E-07 4.04399E-06 0 2.10517E-062005 Annual Mon-Sun 2270003020 Forklifts D 50 Industrial Equipment U P NHH NP San Joaquin SJV SJU 1983 0 0.072396 0.05598931 1.27548E-05 2.40673E-05 9.7709E-06 0.000530616 6.3274E-08 2.20266E-06 0 1.15084E-062005 Annual Mon-Sun 2270003020 Forklifts D 50 Industrial Equipment U P NHH NP San Joaquin SJV SJU 1982 0 0.024132 0.0187634 4.40994E-06 8.30981E-06 3.31167E-06 0.000176872 2.10913E-08 7.58967E-07 0 3.97902E-07
2005 Annual Mon-Sun 2270003040 Other General Industrial Equipmen D 120 Industrial Equipment U N NHH NP San Joaquin SJV SJU 2005 1 3.036863 8.572254 5.99162E-05 0.000529826 0.000828898 0.09411284 1.01835E-05 4.15329E-05 0 5.40614E-062005 Annual Mon-Sun 2270003040 Other General Industrial Equipmen D 120 Industrial Equipment U N NHH NP San Joaquin SJV SJU 2004 1 3.03056 8.576696 0.000105584 0.000563994 0.000918094 0.09391753 1.01623E-05 6.12547E-05 0 9.52666E-062005 Annual Mon-Sun 2270003040 Other General Industrial Equipmen D 120 Industrial Equipment U N NHH NP San Joaquin SJV SJU 2003 1 2.994957 8.531324 0.000226524 0.000623686 0.001156553 0.09281416 1.0043E-05 0.00011664 0 2.04389E-052005 Annual Mon-Sun 2270003040 Other General Industrial Equipmen D 120 Industrial Equipment U N NHH NP San Joaquin SJV SJU 2002 1 2.954822 8.42476 0.000236137 0.000636521 0.001175882 0.09157038 9.90836E-06 0.000124552 0 2.13063E-052005 Annual Mon-Sun 2270003040 Other General Industrial Equipmen D 120 Industrial Equipment U N NHH NP San Joaquin SJV SJU 2001 1 2.906122 8.293538 0.000244686 0.000646874 0.001190754 0.09006114 9.74506E-06 0.000131817 0 2.20776E-052005 Annual Mon-Sun 2270003040 Other General Industrial Equipmen D 120 Industrial Equipment U N NHH NP San Joaquin SJV SJU 2000 1 3.372694 9.633912 0.000298407 0.000774918 0.001421681 0.1045203 1.13096E-05 0.000163795 0 2.69248E-052005 Annual Mon-Sun 2270003040 Other General Industrial Equipmen D 120 Industrial Equipment U N NHH NP San Joaquin SJV SJU 1999 1 3.306452 9.453377 0.0003067 0.000783413 0.001432729 0.1024674 1.10875E-05 0.00017118 0 2.7673E-052005 Annual Mon-Sun 2270003040 Other General Industrial Equipmen D 120 Industrial Equipment U N NHH NP San Joaquin SJV SJU 1998 1 3.228275 9.238346 0.000313268 0.000788045 0.001436905 0.1000447 1.08253E-05 0.000177485 0 2.82656E-052005 Annual Mon-Sun 2270003040 Other General Industrial Equipmen D 120 Industrial Equipment U N NHH NP San Joaquin SJV SJU 1997 1 3.162095 9.057262 0.000320382 0.000794569 0.001795539 0.09799379 1.06034E-05 0.00016787 0 2.89075E-052005 Annual Mon-Sun 2270003040 Other General Industrial Equipmen D 120 Industrial Equipment U N NHH NP San Joaquin SJV SJU 1996 1 3.137023 8.99369 0.00033127 0.000810769 0.001827097 0.09721684 1.05193E-05 0.000175717 0 2.989E-052005 Annual Mon-Sun 2270003040 Other General Industrial Equipmen D 120 Industrial Equipment U N NHH NP San Joaquin SJV SJU 1995 1 2.734734 7.847529 0.000300495 0.000726411 0.001632713 0.08474981 9.17034E-06 0.000161184 0 2.71132E-052005 Annual Mon-Sun 2270003040 Other General Industrial Equipmen D 120 Industrial Equipment U N NHH NP San Joaquin SJV SJU 1994 0 1.757671 5.048391 0.000200658 0.000479487 0.001075038 0.05447051 5.89398E-06 0.000108739 0 1.81051E-052005 Annual Mon-Sun 2270003040 Other General Industrial Equipmen D 120 Industrial Equipment U N NHH NP San Joaquin SJV SJU 1993 0 1.071558 3.080547 0.000126918 0.000300003 0.000671036 0.03320774 3.59324E-06 6.94272E-05 0 1.14516E-052005 Annual Mon-Sun 2270003040 Other General Industrial Equipmen D 120 Industrial Equipment U N NHH NP San Joaquin SJV SJU 1992 0 1.076445 3.097425 0.000132104 0.000309092 0.00068981 0.0333592 3.60963E-06 7.28932E-05 0 1.19196E-05
APP-120
CY Season AvgDays Code 2005 Annual Mon-Sun
Equipment 2270003040 Other General Industrial Equipmen
Fuel MaxHP Class D 120 Industrial Equipment
C/R Pre Hand Port County Air Basin Air Dist. MY Population Activity Consumption ROG Exhaust CO Exhaust NOX Exhaust CO2 Exhaust SO2 Exhaust PM Exhaust N2O Exhaust CH4 Exhaust U N NHH NP San Joaquin SJV SJU 1991 0 1.010994 2.911749 0.0001284 0.000297549 0.000662627 0.03133087 3.39015E-06 7.14189E-05 0 1.15853E-05
2005 Annual Mon-Sun 2270003040 Other General Industrial Equipmen D 120 Industrial Equipment U N NHH NP San Joaquin SJV SJU 1990 0 1.795694 5.176466 0.000235746 0.000541377 0.001203148 0.05564883 6.02148E-06 0.000132105 0 2.1271E-05
2005 Annual Mon-Sun 2270003040 Other General Industrial Equipmen D 120 Industrial Equipment U N NHH NP San Joaquin SJV SJU 1989 0 1.061901 3.063945 0.000143957 0.000327765 0.000726996 0.03290849 3.56086E-06 8.12287E-05 0 1.2989E-05 2005 Annual Mon-Sun 2270003040 Other General Industrial Equipmen D 120 Industrial Equipment U N NHH NP San Joaquin SJV SJU 1988 0 0.720772 2.081565 0.000100797 0.000227642 0.000503975 0.02233685 2.41696E-06 5.72432E-05 0 9.09474E-06 2005 Annual Mon-Sun 2270003040 Other General Industrial Equipmen D 120 Industrial Equipment U N NHH NP San Joaquin SJV SJU 1987 0 0.621735 1.823184 0.00013032 0.000276251 0.0006601 0.01926767 2.08486E-06 6.23177E-05 0 1.17586E-05 2005 Annual Mon-Sun 2270003040 Other General Industrial Equipmen D 120 Industrial Equipment U N NHH NP San Joaquin SJV SJU 1986 0 0.55571 1.631651 0.00011994 0.000252399 0.000602089 0.01722154 1.86346E-06 5.76788E-05 0 1.0822E-05 2005 Annual Mon-Sun 2270003040 Other General Industrial Equipmen D 120 Industrial Equipment U N NHH NP San Joaquin SJV SJU 1985 0 0.506192 1.488149 0.000112403 0.000234904 0.000559448 0.01568695 1.69741E-06 5.43416E-05 0 1.0142E-05 2005 Annual Mon-Sun 2270003040 Other General Industrial Equipmen D 120 Industrial Equipment U N NHH NP San Joaquin SJV SJU 1984 0 0.429163 1.263297 9.79697E-05 0.000203393 0.000483651 0.01329981 1.4391E-06 4.76004E-05 0 8.83965E-06 2005 Annual Mon-Sun 2270003040 Other General Industrial Equipmen D 120 Industrial Equipment U N NHH NP San Joaquin SJV SJU 1983 0 0.379643 1.118951 8.90286E-05 0.000183671 0.000436102 0.0117652 1.27305E-06 4.34599E-05 0 8.03291E-06 2005 Annual Mon-Sun 2270003040 Other General Industrial Equipmen D 120 Industrial Equipment U N NHH NP San Joaquin SJV SJU 1982 0 0.335627 0.9904735 8.07957E-05 0.000165688 0.000392841 0.01040113 1.12545E-06 3.96163E-05 0 7.29007E-06 2005 Annual Mon-Sun 2270003040 Other General Industrial Equipmen D 120 Industrial Equipment U N NHH NP San Joaquin SJV SJU 1981 0 0.286108 0.8454075 7.06559E-05 0.000144066 0.000341104 0.00886653 9.59402E-07 3.479E-05 0 6.37517E-06 2005 Annual Mon-Sun 2270003040 Other General Industrial Equipmen D 120 Industrial Equipment U N NHH NP San Joaquin SJV SJU 1980 0 0.231087 0.6836933 5.85067E-05 0.000118641 0.000280534 0.007161426 7.74901E-07 2.89225E-05 0 5.27897E-06 2005 Annual Mon-Sun 2270003040 Other General Industrial Equipmen D 120 Industrial Equipment U N NHH NP San Joaquin SJV SJU 1979 0 0.187071 0.5541662 4.85271E-05 9.78892E-05 0.000231168 0.00579735 6.27302E-07 2.40796E-05 0 4.37852E-06 2005 Annual Mon-Sun 2270003040 Other General Industrial Equipmen D 120 Industrial Equipment U N NHH NP San Joaquin SJV SJU 1978 0 0.137552 0.4079896 3.65379E-05 7.33348E-05 0.000172969 0.004262757 4.61251E-07 1.81954E-05 0 3.29676E-06 2005 Annual Mon-Sun 2270003040 Other General Industrial Equipmen D 120 Industrial Equipment U N NHH NP San Joaquin SJV SJU 1977 0 0.110042 0.3268033 2.99153E-05 5.97538E-05 0.000140769 0.003410206 3.69001E-07 1.49482E-05 0 2.69921E-06 2005 Annual Mon-Sun 2270003040 Other General Industrial Equipmen D 120 Industrial Equipment U N NHH NP San Joaquin SJV SJU 1976 0 0.077029 0.2290504 2.14202E-05 4.25879E-05 0.000100214 0.002387144 2.58301E-07 1.0738E-05 0 1.93271E-06 2005 Annual Mon-Sun 2270003040 Other General Industrial Equipmen D 120 Industrial Equipment U N NHH NP San Joaquin SJV SJU 1975 0 0.041266 0.1228599 1.1732E-05 2.32222E-05 5.45835E-05 0.001278827 1.38375E-07 5.89946E-06 0 1.05856E-06 2005 Annual Mon-Sun 2270003040 Other General Industrial Equipmen D 120 Industrial Equipment U N NHH NP San Joaquin SJV SJU 1974 0 0.013755 0.04100475 3.99628E-06 7.87647E-06 1.84937E-05 0.000426276 4.61251E-08 2.01547E-06 0 3.60578E-07
2005 Annual Mon-Sun 2270006005 Generator Sets D 750 Light Commercial Equipment U N NHH P San Joaquin SJV SJU 1998 0 2.86E-01 7.04E+00 5.73E-05 1.32E-04 8.45E-04 7.78E-02 7.21E-06 1.91E-05 0.00E+00 5.17E-06
APP-121
APP-122
APPENDIX E
EMISSION FACTOR DERIVATION AND OFFROAD2006 OUTPUT FOR AUXILIARY GENERATOR SETS
APP-123
CONFIDENTIAL BUSINESS INFORMATION/TRADE SECRET
Emission Factors for Auxiliary Generator Sets Stockton Rail Yard, Stockton, CA
Equipment Type
Model Year
Fuel Type
Load Factor
Exhaust & Crankcase Emissions (g/hp-hr) VOC Evaporative Emissions ROG CO NOx DPM SOx Part 1 (g/hr) Part 2 (g/yr)
Aux. Gen Set 1998 Diesel 0.25 0.42 0.97 6.17 0.14 0.05 - -
Notes: 1. Emission factors from OFFROAD2006 model. 2. Load factor was estimated at 25% due to the nature of the operations. 3. VOC evaporative emissions are negligible.
Fuel MaxHP Class D 175 Construction and Mining Equipment
C/R Pre Hand Port County Air Basin Air Dist. MY Population Activity Consumption ROG Exhaust CO Exhaust NOX Exhaust CO2 Exhaust SO2 Exhaust PM Exhaust N2O Exhaust CH4 Exhaust U P NHH P San Joaquin SJV SJU 2005 1 2.194628 8.004401 3.28275E-05 0.000425416 0.000658338 0.08808409 9.1421E-06 2.13262E-05 0 2.96197E-06
2005 Annual Mon-Sun 2270002045 Cranes D 175 Construction and Mining Equipment U P NHH P San Joaquin SJV SJU 2004 1 2.046133 7.470732 4.68235E-05 0.000409549 0.000665958 0.08212405 8.52352E-06 2.55809E-05 0 4.22481E-06 2005 Annual Mon-Sun 2270002045 Cranes D 175 Construction and Mining Equipment U P NHH P San Joaquin SJV SJU 2003 1 1.88094 6.878171 6.66804E-05 0.00038836 0.00070041 0.07549386 7.83538E-06 3.20173E-05 0 6.01646E-06 2005 Annual Mon-Sun 2270002045 Cranes D 175 Construction and Mining Equipment U P NHH P San Joaquin SJV SJU 2002 0 1.657318 6.083153 0.000115166 0.000352651 0.000843433 0.06651846 6.90384E-06 4.81975E-05 0 1.03912E-05 2005 Annual Mon-Sun 2270002045 Cranes D 175 Construction and Mining Equipment U P NHH P San Joaquin SJV SJU 2001 0 1.587829 5.83152 0.000115656 0.00034789 0.000829365 0.06372947 6.61438E-06 4.9362E-05 0 1.04355E-05 2005 Annual Mon-Sun 2270002045 Cranes D 175 Construction and Mining Equipment U P NHH P San Joaquin SJV SJU 2000 1 1.796177 6.600576 0.00013685 0.000404879 0.000962281 0.07209177 7.48229E-06 5.94423E-05 0 1.23477E-05 2005 Annual Mon-Sun 2270002045 Cranes D 175 Construction and Mining Equipment U P NHH P San Joaquin SJV SJU 1999 1 1.853527 6.815318 0.000147429 0.000429508 0.001017865 0.07439356 7.72119E-06 6.50585E-05 0 1.33023E-05 2005 Annual Mon-Sun 2270002045 Cranes D 175 Construction and Mining Equipment U P NHH P San Joaquin SJV SJU 1998 1 1.776576 6.536201 0.00014726 0.000422893 0.000999434 0.07130504 7.40063E-06 6.59215E-05 0 1.3287E-05 2005 Annual Mon-Sun 2270002045 Cranes D 175 Construction and Mining Equipment U P NHH P San Joaquin SJV SJU 1997 0 1.60354 5.90304 0.000138289 0.000391827 0.000923598 0.06436004 6.67982E-06 6.27176E-05 0 1.24776E-05 2005 Annual Mon-Sun 2270002045 Cranes D 175 Construction and Mining Equipment U P NHH P San Joaquin SJV SJU 1996 0 0.684461 2.521149 6.13208E-05 0.00017157 0.000468353 0.02747166 2.85124E-06 2.56785E-05 0 5.53288E-06 2005 Annual Mon-Sun 2270002045 Cranes D 175 Construction and Mining Equipment U P NHH P San Joaquin SJV SJU 1995 0 0.456092 1.680955 4.23892E-05 0.000117206 0.000319176 0.01830579 1.89993E-06 1.79457E-05 0 3.82471E-06 2005 Annual Mon-Sun 2270002045 Cranes D 175 Construction and Mining Equipment U P NHH P San Joaquin SJV SJU 1994 0 0.337554 1.244805 3.25032E-05 8.88751E-05 0.000241469 0.01354815 1.40614E-06 1.38995E-05 0 2.93271E-06 2005 Annual Mon-Sun 2270002045 Cranes D 175 Construction and Mining Equipment U P NHH P San Joaquin SJV SJU 1993 0 0.189058 0.6975989 1.88378E-05 5.09709E-05 0.000138181 0.007588059 7.87552E-07 8.13089E-06 0 1.6997E-06 2005 Annual Mon-Sun 2270002045 Cranes D 175 Construction and Mining Equipment U P NHH P San Joaquin SJV SJU 1992 0 0.149834 0.5531911 1.54315E-05 4.13419E-05 0.000111841 0.006013766 6.24159E-07 6.71823E-06 0 1.39236E-06 2005 Annual Mon-Sun 2270002045 Cranes D 175 Construction and Mining Equipment U P NHH P San Joaquin SJV SJU 1991 0 0.107055 0.3954802 1.13843E-05 3.02143E-05 8.15732E-05 0.004296776 4.45955E-07 4.99605E-06 0 1.02719E-06 2005 Annual Mon-Sun 2270002045 Cranes D 175 Construction and Mining Equipment U P NHH P San Joaquin SJV SJU 1990 0 0.094447 0.3491062 1.03599E-05 2.72521E-05 7.34338E-05 0.003790725 3.93433E-07 4.58052E-06 0 9.34758E-07 2005 Annual Mon-Sun 2270002045 Cranes D 175 Construction and Mining Equipment U P NHH P San Joaquin SJV SJU 1989 0 0.056687 0.2096554 6.40791E-06 1.67145E-05 4.49559E-05 0.00227519 2.36138E-07 2.85298E-06 0 5.78176E-07
2005 Annual Mon-Sun 2270002045 Cranes D 175 Construction and Mining Equipment U P NHH P San Joaquin SJV SJU 1988 0 0.018896 0.06992591 2.19928E-06 5.69081E-06 1.5279E-05 0.000758397 7.87128E-08 9.85579E-07 0 1.98437E-07
2005 Annual Mon-Sun 2270002045 Cranes D 250 Construction and Mining Equipment U N NHH P San Joaquin SJV SJU 2005 1 4.255011 21.54913 6.81295E-05 0.000392326 0.001757642 0.2384044 2.47436E-05 3.91815E-05 0 6.14722E-06 2005 Annual Mon-Sun 2270002045 Cranes D 250 Construction and Mining Equipment U N NHH P San Joaquin SJV SJU 2004 1 3.967103 20.10126 8.61804E-05 0.000377679 0.001748523 0.2222732 2.30694E-05 3.90058E-05 0 7.77592E-06 2005 Annual Mon-Sun 2270002045 Cranes D 250 Construction and Mining Equipment U N NHH P San Joaquin SJV SJU 2003 1 3.646825 18.49172 0.000110456 0.000358126 0.001800783 0.2043282 2.12069E-05 4.14874E-05 0 9.96624E-06 2005 Annual Mon-Sun 2270002045 Cranes D 250 Construction and Mining Equipment U N NHH P San Joaquin SJV SJU 2002 1 3.213255 16.31318 0.000146644 0.000325187 0.002067845 0.1800358 1.86856E-05 4.81443E-05 0 1.32315E-05 2005 Annual Mon-Sun 2270002045 Cranes D 250 Construction and Mining Equipment U N NHH P San Joaquin SJV SJU 2001 1 3.078529 15.63305 0.00014726 0.000320786 0.002033379 0.1724872 1.79022E-05 4.86121E-05 0 1.3287E-05 2005 Annual Mon-Sun 2270002045 Cranes D 250 Construction and Mining Equipment U N NHH P San Joaquin SJV SJU 2000 1 3.482484 17.68872 0.000174235 0.000373324 0.002359279 0.1951202 2.02512E-05 5.78034E-05 0 1.57209E-05 2005 Annual Mon-Sun 2270002045 Cranes D 250 Construction and Mining Equipment U N NHH P San Joaquin SJV SJU 1999 1 3.593673 18.258 0.000187694 0.000396023 0.002495584 0.2013502 2.08978E-05 6.25514E-05 0 1.69354E-05 2005 Annual Mon-Sun 2270002045 Cranes D 250 Construction and Mining Equipment U N NHH P San Joaquin SJV SJU 1998 1 3.44448 17.50433 0.000187471 0.000389914 0.002450423 0.1929911 2.00302E-05 6.27365E-05 0 1.69152E-05 2005 Annual Mon-Sun 2270002045 Cranes D 250 Construction and Mining Equipment U N NHH P San Joaquin SJV SJU 1997 1 3.108992 15.80331 0.000176043 0.000361262 0.002264506 0.1741939 1.80793E-05 5.9137E-05 0 1.58841E-05 2005 Annual Mon-Sun 2270002045 Cranes D 250 Construction and Mining Equipment U N NHH P San Joaquin SJV SJU 1996 0 1.327053 6.747201 7.80586E-05 0.000158183 0.000989106 0.07435355 7.71703E-06 2.63141E-05 0 7.0431E-06 2005 Annual Mon-Sun 2270002045 Cranes D 250 Construction and Mining Equipment U N NHH P San Joaquin SJV SJU 1995 0 0.884284 4.549594 0.000114729 0.000317223 0.000863868 0.0495456 5.14226E-06 4.85711E-05 0 1.03518E-05 2005 Annual Mon-Sun 2270002045 Cranes D 250 Construction and Mining Equipment U N NHH P San Joaquin SJV SJU 1994 0 0.65446 3.369134 8.79716E-05 0.000240545 0.00065355 0.03666881 3.8058E-06 3.76198E-05 0 7.93754E-06 2005 Annual Mon-Sun 2270002045 Cranes D 250 Construction and Mining Equipment U N NHH P San Joaquin SJV SJU 1993 0 0.36655 1.888088 5.09854E-05 0.000137955 0.000373993 0.02053748 2.13155E-06 2.20067E-05 0 4.60033E-06 2005 Annual Mon-Sun 2270002045 Cranes D 250 Construction and Mining Equipment U N NHH P San Joaquin SJV SJU 1992 0 0.290502 1.497241 4.17661E-05 0.000111894 0.000302704 0.01627658 1.68932E-06 1.81832E-05 0 3.76849E-06 2005 Annual Mon-Sun 2270002045 Cranes D 250 Construction and Mining Equipment U N NHH P San Joaquin SJV SJU 1991 0 0.207561 1.07039 3.08122E-05 8.17766E-05 0.000220782 0.01162947 1.207E-06 1.35221E-05 0 2.78013E-06 2005 Annual Mon-Sun 2270002045 Cranes D 250 Construction and Mining Equipment U N NHH P San Joaquin SJV SJU 1990 0 0.183116 0.9448746 2.80396E-05 7.37591E-05 0.000198753 0.0102598 1.06485E-06 1.23974E-05 0 2.52997E-06 2005 Annual Mon-Sun 2270002045 Cranes D 250 Construction and Mining Equipment U N NHH P San Joaquin SJV SJU 1989 0 0.109906 0.5674436 1.73434E-05 4.52388E-05 0.000121676 0.006157924 6.39121E-07 7.72174E-06 0 1.56486E-06
2005 Annual Mon-Sun 2270002045 Cranes D 250 Construction and Mining Equipment U N NHH P San Joaquin SJV SJU 1988 0 0.036635 0.1892581 5.95245E-06 1.54025E-05 4.13534E-05 0.002052642 2.1304E-07 2.66752E-06 0 5.3708E-07
2005 Annual Mon-Sun 2270002066 Tractors/Loaders/Backhoes D 120 Construction and Mining Equipment U P NHH NP San Joaquin SJV SJU 2005 21 52.83642 124.3461 0.000847881 0.007635774 0.01197677 1.365334 0.000147736 0.000591943 0 7.65029E-05 2005 Annual Mon-Sun 2270002066 Tractors/Loaders/Backhoes D 120 Construction and Mining Equipment U P NHH NP San Joaquin SJV SJU 2004 21 52.63005 124.1481 0.001456189 0.008011786 0.01311738 1.360002 0.000147159 0.000844465 0 0.00013139 2005 Annual Mon-Sun 2270002066 Tractors/Loaders/Backhoes D 120 Construction and Mining Equipment U P NHH NP San Joaquin SJV SJU 2003 21 51.94328 123.2769 0.003111349 0.008743813 0.0162726 1.342255 0.000145239 0.001563528 0 0.000280732 2005 Annual Mon-Sun 2270002066 Tractors/Loaders/Backhoes D 120 Construction and Mining Equipment U P NHH NP San Joaquin SJV SJU 2002 20 51.20804 121.6043 0.003185188 0.008817556 0.01636684 1.323256 0.000143183 0.001629696 0 0.000287394 2005 Annual Mon-Sun 2270002066 Tractors/Loaders/Backhoes D 120 Construction and Mining Equipment U P NHH NP San Joaquin SJV SJU 2001 20 50.31062 119.5442 0.003245178 0.00885707 0.01639888 1.300066 0.000140674 0.001687887 0 0.000292807 2005 Annual Mon-Sun 2270002066 Tractors/Loaders/Backhoes D 120 Construction and Mining Equipment U P NHH NP San Joaquin SJV SJU 2000 24 61.50771 146.2368 0.004109012 0.01106553 0.02043847 1.589408 0.000171982 0.002169602 0 0.00037075 2005 Annual Mon-Sun 2270002066 Tractors/Loaders/Backhoes D 120 Construction and Mining Equipment U P NHH NP San Joaquin SJV SJU 1999 24 60.23257 143.2902 0.004162481 0.01106844 0.02039653 1.556458 0.000168416 0.002228484 0 0.000375574 2005 Annual Mon-Sun 2270002066 Tractors/Loaders/Backhoes D 120 Construction and Mining Equipment U P NHH NP San Joaquin SJV SJU 1998 23 58.78019 139.918 0.004197417 0.01102826 0.02027726 1.518926 0.000164355 0.002276103 0 0.000378726 2005 Annual Mon-Sun 2270002066 Tractors/Loaders/Backhoes D 120 Construction and Mining Equipment U P NHH NP San Joaquin SJV SJU 1997 23 57.50322 136.9596 0.004238601 0.01101046 0.02511401 1.485928 0.000160785 0.00212209 0 0.000382442 2005 Annual Mon-Sun 2270002066 Tractors/Loaders/Backhoes D 120 Construction and Mining Equipment U P NHH NP San Joaquin SJV SJU 1996 23 56.77089 135.2955 0.004315304 0.0110892 0.02523983 1.467004 0.000158737 0.002184381 0 0.000389363 2005 Annual Mon-Sun 2270002066 Tractors/Loaders/Backhoes D 120 Construction and Mining Equipment U P NHH NP San Joaquin SJV SJU 1995 18 44.84735 106.9429 0.003512201 0.008933119 0.02029079 1.15889 0.000125398 0.001796155 0 0.0003169 2005 Annual Mon-Sun 2270002066 Tractors/Loaders/Backhoes D 120 Construction and Mining Equipment U P NHH NP San Joaquin SJV SJU 1994 12 30.95396 73.85647 0.002495401 0.006285092 0.01424784 0.7998745 8.65504E-05 0.001288419 0 0.000225156 2005 Annual Mon-Sun 2270002066 Tractors/Loaders/Backhoes D 120 Construction and Mining Equipment U P NHH NP San Joaquin SJV SJU 1993 8 21.19232 50.59505 0.001757236 0.004384765 0.00992101 0.5476264 5.92559E-05 0.000915445 0 0.000158553
2005 Annual Mon-Sun 2270002066 Tractors/Loaders/Backhoes D 120 Construction and Mining Equipment U P NHH NP San Joaquin SJV SJU 1992 8 21.16679 50.56401 0.001803845 0.004461125 0.01007523 0.5469669 5.91845E-05 0.000947644 0 0.000162758
2005 Annual Mon-Sun 2270002066 Tractors/Loaders/Backhoes D 120 Construction and Mining Equipment U P NHH NP San Joaquin SJV SJU 1991 8 19.90047 47.56706 0.001741737 0.004270986 0.009628681 0.5142437 5.56437E-05 0.000922259 0 0.000157154 2005 Annual Mon-Sun 2270002066 Tractors/Loaders/Backhoes D 120 Construction and Mining Equipment U P NHH NP San Joaquin SJV SJU 1990 12 30.7187 73.46871 0.002759288 0.006711248 0.01510414 0.7937954 8.58926E-05 0.001471944 0 0.000248966 2005 Annual Mon-Sun 2270002066 Tractors/Loaders/Backhoes D 120 Construction and Mining Equipment U P NHH NP San Joaquin SJV SJU 1989 7 18.16577 43.47201 0.001673545 0.004038819 0.009074569 0.4694177 5.07933E-05 0.000899027 0 0.000151001 2005 Annual Mon-Sun 2270002066 Tractors/Loaders/Backhoes D 120 Construction and Mining Equipment U P NHH NP San Joaquin SJV SJU 1988 5 12.33014 29.52433 0.001164313 0.002788932 0.006256216 0.3186203 3.44763E-05 0.000629619 0 0.000105054 2005 Annual Mon-Sun 2270002066 Tractors/Loaders/Backhoes D 120 Construction and Mining Equipment U P NHH NP San Joaquin SJV SJU 1987 4 10.63592 25.7886 0.001496278 0.003365593 0.008148599 0.2748404 2.97391E-05 0.000681464 0 0.000135007 2005 Annual Mon-Sun 2270002066 Tractors/Loaders/Backhoes D 120 Construction and Mining Equipment U P NHH NP San Joaquin SJV SJU 1986 4 9.506438 23.06911 0.001369203 0.003058636 0.007394464 0.2456538 2.6581E-05 0.0006273 0 0.000123541 2005 Annual Mon-Sun 2270002066 Tractors/Loaders/Backhoes D 120 Construction and Mining Equipment U P NHH NP San Joaquin SJV SJU 1985 3 8.659329 21.03087 0.001276181 0.00283204 0.006836845 0.2237639 2.42124E-05 0.000587984 0 0.000115148 2005 Annual Mon-Sun 2270002066 Tractors/Loaders/Backhoes D 120 Construction and Mining Equipment U P NHH NP San Joaquin SJV SJU 1984 3 7.341607 17.84528 0.001106554 0.002440038 0.005882333 0.1897128 2.05279E-05 0.000512566 0 9.98426E-05 2005 Annual Mon-Sun 2270002066 Tractors/Loaders/Backhoes D 120 Construction and Mining Equipment U P NHH NP San Joaquin SJV SJU 1983 3 6.494499 15.79928 0.001000615 0.002192962 0.005279572 0.1678229 1.81593E-05 0.00046586 0 9.02839E-05 2005 Annual Mon-Sun 2270002066 Tractors/Loaders/Backhoes D 120 Construction and Mining Equipment U P NHH NP San Joaquin SJV SJU 1982 2 5.74151 13.97902 0.00090382 0.001969174 0.004734607 0.1483651 1.60538E-05 0.000422842 0 8.15502E-05 2005 Annual Mon-Sun 2270002066 Tractors/Loaders/Backhoes D 120 Construction and Mining Equipment U P NHH NP San Joaquin SJV SJU 1981 2 4.894406 11.92639 0.000786853 0.001704616 0.004093314 0.1264753 1.36852E-05 0.000369828 0 7.09965E-05 2005 Annual Mon-Sun 2270002066 Tractors/Loaders/Backhoes D 120 Construction and Mining Equipment U P NHH NP San Joaquin SJV SJU 1980 2 3.953171 9.640799 0.000648768 0.001397784 0.003352378 0.102153 1.10535E-05 0.000306277 0 5.85373E-05 2005 Annual Mon-Sun 2270002066 Tractors/Loaders/Backhoes D 120 Construction and Mining Equipment U P NHH NP San Joaquin SJV SJU 1979 1 3.200188 7.810897 0.000535906 0.001148523 0.002751265 0.08269535 8.94804E-06 0.000254067 0 4.83539E-05 2005 Annual Mon-Sun 2270002066 Tractors/Loaders/Backhoes D 120 Construction and Mining Equipment U P NHH NP San Joaquin SJV SJU 1978 1 2.353078 5.748039 0.000401925 0.00085699 0.002050514 0.0608054 6.57944E-06 0.00019132 0 3.6265E-05 2005 Annual Mon-Sun 2270002066 Tractors/Loaders/Backhoes D 120 Construction and Mining Equipment U P NHH NP San Joaquin SJV SJU 1977 1 1.882463 4.602217 0.000327841 0.000695582 0.001662431 0.04864432 5.26355E-06 0.00015666 0 2.95806E-05 2005 Annual Mon-Sun 2270002066 Tractors/Loaders/Backhoes D 120 Construction and Mining Equipment U P NHH NP San Joaquin SJV SJU 1976 1 1.317723 3.224203 0.0002339 0.000493901 0.001179116 0.03405103 3.68449E-06 0.000112186 0 2.11044E-05 2005 Annual Mon-Sun 2270002066 Tractors/Loaders/Backhoes D 120 Construction and Mining Equipment U P NHH NP San Joaquin SJV SJU 1975 0 0.705924 1.728671 0.000127666 0.000268336 0.000639927 0.01824162 1.97383E-06 6.14512E-05 0 1.15191E-05 2005 Annual Mon-Sun 2270002066 Tractors/Loaders/Backhoes D 120 Construction and Mining Equipment U P NHH NP San Joaquin SJV SJU 1974 0 0.235308 0.5766972 4.33432E-05 9.06941E-05 0.000216062 0.006080542 6.57944E-07 2.09343E-05 0 3.91078E-06 2005 Annual Mon-Sun 2270002066 Tractors/Loaders/Backhoes D 250 Construction and Mining Equipment U N NHH NP San Joaquin SJV SJU 2005 1 1.288692 9.992829 3.06597E-05 0.000181152 0.000813153 0.1105588 1.14747E-05 1.8016E-05 0 2.76637E-06 2005 Annual Mon-Sun 2270002066 Tractors/Loaders/Backhoes D 250 Construction and Mining Equipment U N NHH NP San Joaquin SJV SJU 2004 1 1.283659 9.957986 0.000040021 0.000184772 0.000859685 0.110127 1.14299E-05 1.8846E-05 0 3.61103E-06 2005 Annual Mon-Sun 2270002066 Tractors/Loaders/Backhoes D 250 Construction and Mining Equipment U N NHH NP San Joaquin SJV SJU 2003 1 1.266909 9.834395 5.47531E-05 0.000186632 0.000944245 0.10869 1.12808E-05 2.12167E-05 0 4.94028E-06 2005 Annual Mon-Sun 2270002066 Tractors/Loaders/Backhoes D 250 Construction and Mining Equipment U N NHH NP San Joaquin SJV SJU 2002 0 1.248976 9.706854 8.3366E-05 0.000188201 0.001200508 0.1071515 1.11211E-05 2.72161E-05 0 7.52198E-06 2005 Annual Mon-Sun 2270002066 Tractors/Loaders/Backhoes D 250 Construction and Mining Equipment U N NHH NP San Joaquin SJV SJU 2001 0 1.227088 9.538467 8.49354E-05 0.000189039 0.00120287 0.1052737 1.09262E-05 2.7853E-05 0 7.66358E-06 2005 Annual Mon-Sun 2270002066 Tractors/Loaders/Backhoes D 250 Construction and Mining Equipment U N NHH NP San Joaquin SJV SJU 2000 1 1.500188 11.66345 0.000107543 0.000236169 0.001499189 0.1287033 1.33579E-05 3.54137E-05 0 9.70347E-06 2005 Annual Mon-Sun 2270002066 Tractors/Loaders/Backhoes D 250 Construction and Mining Equipment U N NHH NP San Joaquin SJV SJU 1999 1 1.469088 11.42372 0.000108942 0.000236226 0.001496125 0.1260351 1.3081E-05 3.60131E-05 0 9.82967E-06 2005 Annual Mon-Sun 2270002066 Tractors/Loaders/Backhoes D 250 Construction and Mining Equipment U N NHH NP San Joaquin SJV SJU 1998 1 1.433663 11.15027 0.000109856 0.000235363 0.001487388 0.1229959 1.27656E-05 3.64461E-05 0 9.9121E-06 2005 Annual Mon-Sun 2270002066 Tractors/Loaders/Backhoes D 250 Construction and Mining Equipment U N NHH NP San Joaquin SJV SJU 1997 1 1.402518 10.91002 0.000110933 0.000234978 0.001481823 0.120324 1.24882E-05 3.69275E-05 0 1.00093E-05 2005 Annual Mon-Sun 2270002066 Tractors/Loaders/Backhoes D 250 Construction and Mining Equipment U N NHH NP San Joaquin SJV SJU 1996 1 1.384655 10.77301 0.00011294 0.000236653 0.001489356 0.1187915 1.23292E-05 3.77141E-05 0 1.01904E-05 2005 Annual Mon-Sun 2270002066 Tractors/Loaders/Backhoes D 250 Construction and Mining Equipment U N NHH NP San Joaquin SJV SJU 1995 0 1.093836 8.603083 0.000195426 0.000559612 0.001534724 0.09384177 9.73968E-06 8.00445E-05 0 1.7633E-05 2005 Annual Mon-Sun 2270002066 Tractors/Loaders/Backhoes D 250 Construction and Mining Equipment U N NHH NP San Joaquin SJV SJU 1994 0 0.754976 5.940477 0.000138853 0.000393728 0.00107769 0.06477043 6.72242E-06 5.74156E-05 0 1.25285E-05 2005 Annual Mon-Sun 2270002066 Tractors/Loaders/Backhoes D 250 Construction and Mining Equipment U N NHH NP San Joaquin SJV SJU 1993 0 0.516886 4.068829 9.77814E-05 0.000274681 0.000750433 0.04434435 4.60243E-06 4.07933E-05 0 8.82266E-06
APP-125
CY Season AvgDays Code 2005 Annual Mon-Sun
Equipment 2270002066 Tractors/Loaders/Backhoes
Fuel MaxHP Class D 250 Construction and Mining Equipment
C/R Pre Hand Port County Air Basin Air Dist. MY Population Activity Consumption ROG Exhaust CO Exhaust NOX Exhaust CO2 Exhaust SO2 Exhaust PM Exhaust N2O Exhaust CH4 Exhaust U N NHH NP San Joaquin SJV SJU 1992 0 0.516264 4.065677 0.000100377 0.000279464 0.000762119 0.04429097 4.59689E-06 4.22268E-05 0 9.05688E-06
2005 Annual Mon-Sun 2270002066 Tractors/Loaders/Backhoes D 250 Construction and Mining Equipment U N NHH NP San Joaquin SJV SJU 1991 0 0.485377 3.824084 9.69234E-05 0.000267553 0.00072836 0.04164121 4.32187E-06 4.10944E-05 0 8.74524E-062005 Annual Mon-Sun 2270002066 Tractors/Loaders/Backhoes D 250 Construction and Mining Equipment U N NHH NP San Joaquin SJV SJU 1990 0 0.749236 5.90545 0.000153551 0.000420421 0.001142579 0.06427805 6.67131E-06 6.55857E-05 0 1.38546E-05
2005 Annual Mon-Sun 2270002066 Tractors/Loaders/Backhoes D 250 Construction and Mining Equipment U N NHH NP San Joaquin SJV SJU 1989 0 0.443067 3.493737 9.31325E-05 0.000253008 0.000686478 0.03801138 3.94514E-06 4.00571E-05 0 8.40319E-062005 Annual Mon-Sun 2270002066 Tractors/Loaders/Backhoes D 250 Construction and Mining Equipment U N NHH NP San Joaquin SJV SJU 1988 0 0.300735 2.372413 6.4795E-05 0.00017471 0.000473285 0.02580047 2.67779E-06 2.80526E-05 0 5.84635E-062005 Annual Mon-Sun 2270002066 Tractors/Loaders/Backhoes D 250 Construction and Mining Equipment U N NHH NP San Joaquin SJV SJU 1987 0 0.259413 2.065674 7.40434E-05 0.000238381 0.000557896 0.02225537 2.30985E-06 3.61281E-05 0 6.68082E-062005 Annual Mon-Sun 2270002066 Tractors/Loaders/Backhoes D 250 Construction and Mining Equipment U N NHH NP San Joaquin SJV SJU 1986 0 0.231864 1.847409 6.77551E-05 0.000216637 0.000506249 0.01989197 2.06456E-06 3.32565E-05 0 6.11344E-062005 Annual Mon-Sun 2270002066 Tractors/Loaders/Backhoes D 250 Construction and Mining Equipment U N NHH NP San Joaquin SJV SJU 1985 0 0.211203 1.683789 6.31519E-05 0.000200585 0.000468059 0.01811942 1.88058E-06 3.11721E-05 0 5.6981E-062005 Annual Mon-Sun 2270002066 Tractors/Loaders/Backhoes D 250 Construction and Mining Equipment U N NHH NP San Joaquin SJV SJU 1984 0 0.179064 1.43043 5.85075E-05 0.000177125 0.000402701 0.01536212 1.59441E-06 2.71738E-05 0 5.27904E-062005 Annual Mon-Sun 2270002066 Tractors/Loaders/Backhoes D 250 Construction and Mining Equipment U N NHH NP San Joaquin SJV SJU 1983 0 0.158402 1.266167 5.29064E-05 0.000159192 0.000361426 0.01358956 1.41044E-06 2.46976E-05 0 4.77366E-062005 Annual Mon-Sun 2270002066 Tractors/Loaders/Backhoes D 250 Construction and Mining Equipment U N NHH NP San Joaquin SJV SJU 1982 0 0.140037 1.120062 4.77889E-05 0.00014295 0.000324111 0.01201397 1.24691E-06 2.24169E-05 0 4.31191E-062005 Annual Mon-Sun 2270002066 Tractors/Loaders/Backhoes D 250 Construction and Mining Equipment U N NHH NP San Joaquin SJV SJU 1981 0 0.119376 0.9553999 4.16045E-05 0.000123747 0.000280204 0.01024141 1.06294E-06 1.96064E-05 0 3.75391E-062005 Annual Mon-Sun 2270002066 Tractors/Loaders/Backhoes D 250 Construction and Mining Equipment U N NHH NP San Joaquin SJV SJU 1980 0 0.096419 0.772148 3.43035E-05 0.000101474 0.000229478 0.008271906 8.58528E-07 1.62372E-05 0 3.09515E-062005 Annual Mon-Sun 2270002066 Tractors/Loaders/Backhoes D 250 Construction and Mining Equipment U N NHH NP San Joaquin SJV SJU 1979 0 0.078053 0.6263924 3.01529E-05 8.51326E-05 0.000205689 0.006696306 6.94999E-07 1.34693E-05 0 2.72064E-062005 Annual Mon-Sun 2270002066 Tractors/Loaders/Backhoes D 250 Construction and Mining Equipment U N NHH NP San Joaquin SJV SJU 1978 0 0.057392 0.4608803 2.26146E-05 6.35211E-05 0.000153301 0.004923755 5.11028E-07 1.01427E-05 0 2.04048E-062005 Annual Mon-Sun 2270002066 Tractors/Loaders/Backhoes D 250 Construction and Mining Equipment U N NHH NP San Joaquin SJV SJU 1977 0 0.045914 0.3689424 1.84464E-05 5.15558E-05 0.000124287 0.003939004 4.08823E-07 8.30528E-06 0 1.66439E-062005 Annual Mon-Sun 2270002066 Tractors/Loaders/Backhoes D 250 Construction and Mining Equipment U N NHH NP San Joaquin SJV SJU 1976 0 0.03214 0.2584263 1.31608E-05 3.66063E-05 8.81539E-05 0.002757302 2.86176E-07 5.94746E-06 0 1.18748E-062005 Annual Mon-Sun 2270002066 Tractors/Loaders/Backhoes D 250 Construction and Mining Equipment U N NHH NP San Joaquin SJV SJU 1975 0 0.017218 0.138532 7.18346E-06 1.98876E-05 4.78429E-05 0.001477126 1.53309E-07 3.2578E-06 0 6.48152E-072005 Annual Mon-Sun 2270002066 Tractors/Loaders/Backhoes D 250 Construction and Mining Equipment U N NHH NP San Joaquin SJV SJU 1974 0 0.005739 0.04620709 2.43883E-06 6.72156E-06 1.61535E-05 0.000492376 5.11029E-08 1.10982E-06 0 2.20051E-07
2005 Annual Mon-Sun 2270003020 Forklifts D 120 Industrial Equipment U P NHH NP San Joaquin SJV SJU 2005 1 5.150716 7.318703 5.20808E-05 0.000454515 0.000709732 0.0803431 8.69352E-06 3.59181E-05 0 4.69916E-062005 Annual Mon-Sun 2270003020 Forklifts D 120 Industrial Equipment U P NHH NP San Joaquin SJV SJU 2004 1 5.029932 7.167117 9.13156E-05 0.000477802 0.000774562 0.07845908 8.48966E-06 5.29917E-05 0 8.23926E-062005 Annual Mon-Sun 2270003020 Forklifts D 120 Industrial Equipment U P NHH NP San Joaquin SJV SJU 2003 1 5.095717 7.310581 0.000201217 0.000546221 0.00101035 0.07948521 8.60069E-06 0.0001053 0 1.81555E-052005 Annual Mon-Sun 2270003020 Forklifts D 120 Industrial Equipment U P NHH NP San Joaquin SJV SJU 2002 1 5.718499 8.213609 0.000241372 0.000639056 0.001176686 0.08919966 9.65184E-06 0.000129828 0 2.17786E-052005 Annual Mon-Sun 2270003020 Forklifts D 120 Industrial Equipment U P NHH NP San Joaquin SJV SJU 2001 1 5.631436 8.097967 0.000253024 0.000655007 0.001200973 0.08784165 9.5049E-06 0.000139332 0 2.283E-05
2005 Annual Mon-Sun 2270003020 Forklifts D 120 Industrial Equipment U P NHH NP San Joaquin SJV SJU 2000 1 6.279312 9.04009 0.000299224 0.000758997 0.001386196 0.09794746 1.05984E-05 0.000168163 0 2.69985E-05
2005 Annual Mon-Sun 2270003020 Forklifts D 120 Industrial Equipment U P NHH NP San Joaquin SJV SJU 1999 1 6.088161 8.775064 0.000306685 0.000763655 0.001389622 0.09496579 1.02758E-05 0.000175456 0 2.76717E-052005 Annual Mon-Sun 2270003020 Forklifts D 120 Industrial Equipment U P NHH NP San Joaquin SJV SJU 1998 1 5.947677 8.582513 0.000315795 0.000773156 0.001402127 0.09277447 1.00387E-05 0.000183533 0 2.84937E-052005 Annual Mon-Sun 2270003020 Forklifts D 120 Industrial Equipment U P NHH NP San Joaquin SJV SJU 1997 1 5.684893 8.212811 0.000317315 0.00076492 0.001718235 0.08867546 9.59512E-06 0.000170633 0 2.86308E-052005 Annual Mon-Sun 2270003020 Forklifts D 120 Industrial Equipment U P NHH NP San Joaquin SJV SJU 1996 1 5.569162 8.054917 0.000326012 0.000774744 0.001734945 0.08687024 9.39979E-06 0.000177518 0 2.94156E-052005 Annual Mon-Sun 2270003020 Forklifts D 120 Industrial Equipment U P NHH NP San Joaquin SJV SJU 1995 1 4.839629 7.007844 0.000296478 0.000695326 0.001552593 0.07549065 8.16846E-06 0.000163267 0 2.67507E-052005 Annual Mon-Sun 2270003020 Forklifts D 120 Industrial Equipment U P NHH NP San Joaquin SJV SJU 1994 1 3.911213 5.670019 0.000250248 0.000579773 0.001291051 0.06100882 6.60145E-06 0.000139222 0 2.25794E-052005 Annual Mon-Sun 2270003020 Forklifts D 120 Industrial Equipment U P NHH NP San Joaquin SJV SJU 1993 0 1.077971 1.564517 7.19047E-05 0.000164707 0.000365832 0.01681468 1.81943E-06 4.03761E-05 0 6.48785E-062005 Annual Mon-Sun 2270003020 Forklifts D 120 Industrial Equipment U P NHH NP San Joaquin SJV SJU 1992 0 0.764966 1.111513 5.3108E-05 0.00012037 0.000266707 0.01193228 1.29113E-06 3.00752E-05 0 4.79185E-062005 Annual Mon-Sun 2270003020 Forklifts D 120 Industrial Equipment U P NHH NP San Joaquin SJV SJU 1991 0 0.667375 0.9708257 4.81491E-05 0.000108057 0.000238876 0.01041001 1.12641E-06 2.74797E-05 0 4.34441E-062005 Annual Mon-Sun 2270003020 Forklifts D 120 Industrial Equipment U P NHH NP San Joaquin SJV SJU 1990 0 1.035729 1.508398 7.75436E-05 0.000172422 0.000380336 0.01615576 1.74813E-06 4.45736E-05 0 6.99664E-062005 Annual Mon-Sun 2270003020 Forklifts D 120 Industrial Equipment U P NHH NP San Joaquin SJV SJU 1989 0 0.818524 1.193435 6.35095E-05 0.000139996 0.000308171 0.0127677 1.38153E-06 3.67485E-05 0 5.73036E-062005 Annual Mon-Sun 2270003020 Forklifts D 120 Industrial Equipment U P NHH NP San Joaquin SJV SJU 1988 0 0.716208 1.045452 5.752E-05 0.000125762 0.000276297 0.01117173 1.20884E-06 3.34872E-05 0 5.18994E-062005 Annual Mon-Sun 2270003020 Forklifts D 120 Industrial Equipment U P NHH NP San Joaquin SJV SJU 1987 0 0.579788 0.8610737 7.00129E-05 0.000143687 0.00034074 0.009043789 9.78582E-07 3.43096E-05 0 6.31715E-062005 Annual Mon-Sun 2270003020 Forklifts D 120 Industrial Equipment U P NHH NP San Joaquin SJV SJU 1986 0 0.420631 0.6257008 5.24584E-05 0.000106883 0.000253021 0.00656118 7.09952E-07 2.58436E-05 0 4.73324E-062005 Annual Mon-Sun 2270003020 Forklifts D 120 Industrial Equipment U P NHH NP San Joaquin SJV SJU 1985 0 0.312631 0.4657914 4.02266E-05 8.14015E-05 0.00019238 0.004876553 5.27667E-07 1.99159E-05 0 3.62958E-062005 Annual Mon-Sun 2270003020 Forklifts D 120 Industrial Equipment U P NHH NP San Joaquin SJV SJU 1984 0 0.215999 0.3223329 2.86478E-05 5.75963E-05 0.000135904 0.003369253 3.6457E-07 1.42491E-05 0 2.58484E-062005 Annual Mon-Sun 2270003020 Forklifts D 120 Industrial Equipment U P NHH NP San Joaquin SJV SJU 1983 0 0.113684 0.1699193 1.55277E-05 3.10271E-05 7.31008E-05 0.001773291 1.91879E-07 7.7569E-06 0 1.40104E-062005 Annual Mon-Sun 2270003020 Forklifts D 120 Industrial Equipment U P NHH NP San Joaquin SJV SJU 1982 0 0.037895 0.05672988 5.32587E-06 1.05802E-05 2.4891E-05 0.000591097 6.39596E-08 2.67143E-06 0 4.80545E-072005 Annual Mon-Sun 2270003020 Forklifts D 50 Industrial Equipment U P NHH NP San Joaquin SJV SJU 2005 1 3.280057 2.192719 2.19859E-05 0.000138521 0.000202001 0.02404081 2.86678E-06 1.41307E-05 0 1.98375E-062005 Annual Mon-Sun 2270003020 Forklifts D 50 Industrial Equipment U P NHH NP San Joaquin SJV SJU 2004 1 3.20314 2.155385 4.4948E-05 0.000172341 0.000209596 0.02347706 2.79955E-06 1.76824E-05 0 4.05558E-062005 Annual Mon-Sun 2270003020 Forklifts D 50 Industrial Equipment U P NHH NP San Joaquin SJV SJU 2003 1 3.245034 2.220459 0.000114897 0.000250689 0.000238586 0.02378411 2.83617E-06 2.78397E-05 0 1.0367E-052005 Annual Mon-Sun 2270003020 Forklifts D 50 Industrial Equipment U P NHH NP San Joaquin SJV SJU 2002 1 3.641633 2.503944 0.00014775 0.000316835 0.000276 0.02669093 3.18279E-06 3.44735E-05 0 1.33313E-052005 Annual Mon-Sun 2270003020 Forklifts D 50 Industrial Equipment U P NHH NP San Joaquin SJV SJU 2001 1 3.586192 2.477747 0.000164026 0.000346977 0.000279927 0.02628459 3.13434E-06 3.71308E-05 0 1.47998E-052005 Annual Mon-Sun 2270003020 Forklifts D 50 Industrial Equipment U P NHH NP San Joaquin SJV SJU 2000 1 3.998765 2.776094 0.000203552 0.000425884 0.000321196 0.0293085 3.49493E-06 4.49508E-05 0 1.83662E-052005 Annual Mon-Sun 2270003020 Forklifts D 50 Industrial Equipment U P NHH NP San Joaquin SJV SJU 1999 1 3.877036 2.704475 0.000217383 0.000450721 0.000320207 0.02841631 3.38854E-06 4.70226E-05 0 1.96141E-052005 Annual Mon-Sun 2270003020 Forklifts D 50 Industrial Equipment U P NHH NP San Joaquin SJV SJU 1998 1 3.787572 2.690743 0.000288189 0.000582543 0.000377243 0.02776059 3.31035E-06 5.6975E-05 0 2.60029E-052005 Annual Mon-Sun 2270003020 Forklifts D 50 Industrial Equipment U P NHH NP San Joaquin SJV SJU 1997 1 3.620229 2.586714 0.000298706 0.000599918 0.000368704 0.02653406 3.16409E-06 5.81703E-05 0 2.69517E-052005 Annual Mon-Sun 2270003020 Forklifts D 50 Industrial Equipment U P NHH NP San Joaquin SJV SJU 1996 1 3.546533 2.548609 0.000315401 0.000629942 0.000369162 0.02599391 3.09968E-06 6.06232E-05 0 2.84582E-052005 Annual Mon-Sun 2270003020 Forklifts D 50 Industrial Equipment U P NHH NP San Joaquin SJV SJU 1995 1 3.081953 2.227399 0.000293878 0.000584126 0.000327723 0.02258882 2.69363E-06 5.58424E-05 0 2.65161E-052005 Annual Mon-Sun 2270003020 Forklifts D 50 Industrial Equipment U P NHH NP San Joaquin SJV SJU 1994 1 2.490721 1.810322 0.000253497 0.000501731 0.000270446 0.01825546 2.17689E-06 4.7684E-05 0 2.28726E-052005 Annual Mon-Sun 2270003020 Forklifts D 50 Industrial Equipment U P NHH NP San Joaquin SJV SJU 1993 0 0.68647 0.5017614 7.42751E-05 0.000146458 7.60793E-05 0.005031405 5.99976E-07 1.38462E-05 0 6.70173E-062005 Annual Mon-Sun 2270003020 Forklifts D 50 Industrial Equipment U P NHH NP San Joaquin SJV SJU 1992 0 0.487143 0.358066 5.58367E-05 0.000109733 5.50823E-05 0.003570457 4.25764E-07 1.03253E-05 0 5.03805E-062005 Annual Mon-Sun 2270003020 Forklifts D 50 Industrial Equipment U P NHH NP San Joaquin SJV SJU 1991 0 0.424996 0.3141299 5.14427E-05 0.000100795 4.90095E-05 0.003114959 3.71447E-07 9.44391E-06 0 4.64159E-062005 Annual Mon-Sun 2270003020 Forklifts D 50 Industrial Equipment U P NHH NP San Joaquin SJV SJU 1990 0 0.659569 0.490218 8.4072E-05 0.000164283 7.75408E-05 0.004834238 5.76465E-07 1.53328E-05 0 7.58568E-062005 Annual Mon-Sun 2270003020 Forklifts D 50 Industrial Equipment U P NHH NP San Joaquin SJV SJU 1989 0 0.521249 0.389552 6.97886E-05 0.000136039 6.24499E-05 0.003820438 4.55573E-07 1.26519E-05 0 6.29691E-062005 Annual Mon-Sun 2270003020 Forklifts D 50 Industrial Equipment U P NHH NP San Joaquin SJV SJU 1988 0 0.456093 0.3427294 6.39941E-05 0.000124466 5.56677E-05 0.003342882 3.98626E-07 1.15381E-05 0 5.77408E-062005 Annual Mon-Sun 2270003020 Forklifts D 50 Industrial Equipment U P NHH NP San Joaquin SJV SJU 1987 0 0.369218 0.279408 5.53586E-05 0.000105155 4.64837E-05 0.002706144 3.22697E-07 9.71901E-06 0 4.99492E-062005 Annual Mon-Sun 2270003020 Forklifts D 50 Industrial Equipment U P NHH NP San Joaquin SJV SJU 1986 0 0.267864 0.2038209 4.19198E-05 7.94788E-05 3.43307E-05 0.001963279 2.34114E-07 7.32574E-06 0 3.78235E-062005 Annual Mon-Sun 2270003020 Forklifts D 50 Industrial Equipment U P NHH NP San Joaquin SJV SJU 1985 0 0.199088 0.1523158 3.24629E-05 6.1443E-05 2.59674E-05 0.001459194 1.74003E-07 5.64897E-06 0 2.92908E-06
2005 Annual Mon-Sun 2270003020 Forklifts D 50 Industrial Equipment U P NHH NP San Joaquin SJV SJU 1984 0 0.137552 0.105808 2.33315E-05 4.40897E-05 1.82529E-05 0.001008171 1.20221E-07 4.04399E-06 0 2.10517E-062005 Annual Mon-Sun 2270003020 Forklifts D 50 Industrial Equipment U P NHH NP San Joaquin SJV SJU 1983 0 0.072396 0.05598931 1.27548E-05 2.40673E-05 9.7709E-06 0.000530616 6.3274E-08 2.20266E-06 0 1.15084E-062005 Annual Mon-Sun 2270003020 Forklifts D 50 Industrial Equipment U P NHH NP San Joaquin SJV SJU 1982 0 0.024132 0.0187634 4.40994E-06 8.30981E-06 3.31167E-06 0.000176872 2.10913E-08 7.58967E-07 0 3.97902E-07
2005 Annual Mon-Sun 2270003040 Other General Industrial Equipmen D 120 Industrial Equipment U N NHH NP San Joaquin SJV SJU 2005 1 3.036863 8.572254 5.99162E-05 0.000529826 0.000828898 0.09411284 1.01835E-05 4.15329E-05 0 5.40614E-062005 Annual Mon-Sun 2270003040 Other General Industrial Equipmen D 120 Industrial Equipment U N NHH NP San Joaquin SJV SJU 2004 1 3.03056 8.576696 0.000105584 0.000563994 0.000918094 0.09391753 1.01623E-05 6.12547E-05 0 9.52666E-062005 Annual Mon-Sun 2270003040 Other General Industrial Equipmen D 120 Industrial Equipment U N NHH NP San Joaquin SJV SJU 2003 1 2.994957 8.531324 0.000226524 0.000623686 0.001156553 0.09281416 1.0043E-05 0.00011664 0 2.04389E-052005 Annual Mon-Sun 2270003040 Other General Industrial Equipmen D 120 Industrial Equipment U N NHH NP San Joaquin SJV SJU 2002 1 2.954822 8.42476 0.000236137 0.000636521 0.001175882 0.09157038 9.90836E-06 0.000124552 0 2.13063E-052005 Annual Mon-Sun 2270003040 Other General Industrial Equipmen D 120 Industrial Equipment U N NHH NP San Joaquin SJV SJU 2001 1 2.906122 8.293538 0.000244686 0.000646874 0.001190754 0.09006114 9.74506E-06 0.000131817 0 2.20776E-052005 Annual Mon-Sun 2270003040 Other General Industrial Equipmen D 120 Industrial Equipment U N NHH NP San Joaquin SJV SJU 2000 1 3.372694 9.633912 0.000298407 0.000774918 0.001421681 0.1045203 1.13096E-05 0.000163795 0 2.69248E-052005 Annual Mon-Sun 2270003040 Other General Industrial Equipmen D 120 Industrial Equipment U N NHH NP San Joaquin SJV SJU 1999 1 3.306452 9.453377 0.0003067 0.000783413 0.001432729 0.1024674 1.10875E-05 0.00017118 0 2.7673E-052005 Annual Mon-Sun 2270003040 Other General Industrial Equipmen D 120 Industrial Equipment U N NHH NP San Joaquin SJV SJU 1998 1 3.228275 9.238346 0.000313268 0.000788045 0.001436905 0.1000447 1.08253E-05 0.000177485 0 2.82656E-052005 Annual Mon-Sun 2270003040 Other General Industrial Equipmen D 120 Industrial Equipment U N NHH NP San Joaquin SJV SJU 1997 1 3.162095 9.057262 0.000320382 0.000794569 0.001795539 0.09799379 1.06034E-05 0.00016787 0 2.89075E-052005 Annual Mon-Sun 2270003040 Other General Industrial Equipmen D 120 Industrial Equipment U N NHH NP San Joaquin SJV SJU 1996 1 3.137023 8.99369 0.00033127 0.000810769 0.001827097 0.09721684 1.05193E-05 0.000175717 0 2.989E-052005 Annual Mon-Sun 2270003040 Other General Industrial Equipmen D 120 Industrial Equipment U N NHH NP San Joaquin SJV SJU 1995 1 2.734734 7.847529 0.000300495 0.000726411 0.001632713 0.08474981 9.17034E-06 0.000161184 0 2.71132E-052005 Annual Mon-Sun 2270003040 Other General Industrial Equipmen D 120 Industrial Equipment U N NHH NP San Joaquin SJV SJU 1994 0 1.757671 5.048391 0.000200658 0.000479487 0.001075038 0.05447051 5.89398E-06 0.000108739 0 1.81051E-052005 Annual Mon-Sun 2270003040 Other General Industrial Equipmen D 120 Industrial Equipment U N NHH NP San Joaquin SJV SJU 1993 0 1.071558 3.080547 0.000126918 0.000300003 0.000671036 0.03320774 3.59324E-06 6.94272E-05 0 1.14516E-052005 Annual Mon-Sun 2270003040 Other General Industrial Equipmen D 120 Industrial Equipment U N NHH NP San Joaquin SJV SJU 1992 0 1.076445 3.097425 0.000132104 0.000309092 0.00068981 0.0333592 3.60963E-06 7.28932E-05 0 1.19196E-05
APP-126
CY Season AvgDays Code 2005 Annual Mon-Sun
Equipment 2270003040 Other General Industrial Equipmen
Fuel MaxHP Class D 120 Industrial Equipment
C/R Pre Hand Port County Air Basin Air Dist. MY Population Activity Consumption ROG Exhaust CO Exhaust NOX Exhaust CO2 Exhaust SO2 Exhaust PM Exhaust N2O Exhaust CH4 Exhaust U N NHH NP San Joaquin SJV SJU 1991 0 1.010994 2.911749 0.0001284 0.000297549 0.000662627 0.03133087 3.39015E-06 7.14189E-05 0 1.15853E-05
2005 Annual Mon-Sun 2270003040 Other General Industrial Equipmen D 120 Industrial Equipment U N NHH NP San Joaquin SJV SJU 1990 0 1.795694 5.176466 0.000235746 0.000541377 0.001203148 0.05564883 6.02148E-06 0.000132105 0 2.1271E-05
2005 Annual Mon-Sun 2270003040 Other General Industrial Equipmen D 120 Industrial Equipment U N NHH NP San Joaquin SJV SJU 1989 0 1.061901 3.063945 0.000143957 0.000327765 0.000726996 0.03290849 3.56086E-06 8.12287E-05 0 1.2989E-05 2005 Annual Mon-Sun 2270003040 Other General Industrial Equipmen D 120 Industrial Equipment U N NHH NP San Joaquin SJV SJU 1988 0 0.720772 2.081565 0.000100797 0.000227642 0.000503975 0.02233685 2.41696E-06 5.72432E-05 0 9.09474E-06 2005 Annual Mon-Sun 2270003040 Other General Industrial Equipmen D 120 Industrial Equipment U N NHH NP San Joaquin SJV SJU 1987 0 0.621735 1.823184 0.00013032 0.000276251 0.0006601 0.01926767 2.08486E-06 6.23177E-05 0 1.17586E-05 2005 Annual Mon-Sun 2270003040 Other General Industrial Equipmen D 120 Industrial Equipment U N NHH NP San Joaquin SJV SJU 1986 0 0.55571 1.631651 0.00011994 0.000252399 0.000602089 0.01722154 1.86346E-06 5.76788E-05 0 1.0822E-05 2005 Annual Mon-Sun 2270003040 Other General Industrial Equipmen D 120 Industrial Equipment U N NHH NP San Joaquin SJV SJU 1985 0 0.506192 1.488149 0.000112403 0.000234904 0.000559448 0.01568695 1.69741E-06 5.43416E-05 0 1.0142E-05 2005 Annual Mon-Sun 2270003040 Other General Industrial Equipmen D 120 Industrial Equipment U N NHH NP San Joaquin SJV SJU 1984 0 0.429163 1.263297 9.79697E-05 0.000203393 0.000483651 0.01329981 1.4391E-06 4.76004E-05 0 8.83965E-06 2005 Annual Mon-Sun 2270003040 Other General Industrial Equipmen D 120 Industrial Equipment U N NHH NP San Joaquin SJV SJU 1983 0 0.379643 1.118951 8.90286E-05 0.000183671 0.000436102 0.0117652 1.27305E-06 4.34599E-05 0 8.03291E-06 2005 Annual Mon-Sun 2270003040 Other General Industrial Equipmen D 120 Industrial Equipment U N NHH NP San Joaquin SJV SJU 1982 0 0.335627 0.9904735 8.07957E-05 0.000165688 0.000392841 0.01040113 1.12545E-06 3.96163E-05 0 7.29007E-06 2005 Annual Mon-Sun 2270003040 Other General Industrial Equipmen D 120 Industrial Equipment U N NHH NP San Joaquin SJV SJU 1981 0 0.286108 0.8454075 7.06559E-05 0.000144066 0.000341104 0.00886653 9.59402E-07 3.479E-05 0 6.37517E-06 2005 Annual Mon-Sun 2270003040 Other General Industrial Equipmen D 120 Industrial Equipment U N NHH NP San Joaquin SJV SJU 1980 0 0.231087 0.6836933 5.85067E-05 0.000118641 0.000280534 0.007161426 7.74901E-07 2.89225E-05 0 5.27897E-06 2005 Annual Mon-Sun 2270003040 Other General Industrial Equipmen D 120 Industrial Equipment U N NHH NP San Joaquin SJV SJU 1979 0 0.187071 0.5541662 4.85271E-05 9.78892E-05 0.000231168 0.00579735 6.27302E-07 2.40796E-05 0 4.37852E-06 2005 Annual Mon-Sun 2270003040 Other General Industrial Equipmen D 120 Industrial Equipment U N NHH NP San Joaquin SJV SJU 1978 0 0.137552 0.4079896 3.65379E-05 7.33348E-05 0.000172969 0.004262757 4.61251E-07 1.81954E-05 0 3.29676E-06 2005 Annual Mon-Sun 2270003040 Other General Industrial Equipmen D 120 Industrial Equipment U N NHH NP San Joaquin SJV SJU 1977 0 0.110042 0.3268033 2.99153E-05 5.97538E-05 0.000140769 0.003410206 3.69001E-07 1.49482E-05 0 2.69921E-06 2005 Annual Mon-Sun 2270003040 Other General Industrial Equipmen D 120 Industrial Equipment U N NHH NP San Joaquin SJV SJU 1976 0 0.077029 0.2290504 2.14202E-05 4.25879E-05 0.000100214 0.002387144 2.58301E-07 1.0738E-05 0 1.93271E-06 2005 Annual Mon-Sun 2270003040 Other General Industrial Equipmen D 120 Industrial Equipment U N NHH NP San Joaquin SJV SJU 1975 0 0.041266 0.1228599 1.1732E-05 2.32222E-05 5.45835E-05 0.001278827 1.38375E-07 5.89946E-06 0 1.05856E-06 2005 Annual Mon-Sun 2270003040 Other General Industrial Equipmen D 120 Industrial Equipment U N NHH NP San Joaquin SJV SJU 1974 0 0.013755 0.04100475 3.99628E-06 7.87647E-06 1.84937E-05 0.000426276 4.61251E-08 2.01547E-06 0 3.60578E-07
2005 Annual Mon-Sun 2270006005 Generator Sets D 750 Light Commercial Equipment U N NHH P San Joaquin SJV SJU 1998 0 2.86E-01 7.04E+00 5.73E-05 1.32E-04 8.45E-04 7.78E-02 7.21E-06 1.91E-05 0.00E+00 5.17E-06
APP-127
APP-128
APPENDIX F
DETAILED EMISSION CALCULATIONS
APP-129
CONFIDENTIAL BUSINESS INFORMATION/TRADE SECRET
Summary of Diesel Particulate Matter Emissions Stockton Rail Yard, Stockton, CA
Source
DPM Emissions (tpy)
Locomotives 6.472 On-Road Diesel Fuel Trucks 0.007 HHD Diesel-Fueled Trucks 0.174 Heavy Equipment 0.099 Aux. Generator Set 0.068
Total 6.819
CONFIDENTIAL BUSINESS INFORMATION/TRADE SECRET
APP-130
Emissions from Locomotives Stockton Rail Yard, Stockton, CA
Activity
DPM Emissions (tpy)
Through trains 0.381 Freight trains 1.276 ACE trains 0.418 Power moves 0.005 Yard operations 3.578 Service and Shop Idling 0.782 Load tests 0.032
Total 6.472
APP-131
CONFIDENTIAL BUSINESS INFORMATION/TRADE SECRET
Emissions from Heavy-Heavy Duty Diesel-Fueled Trucks Stockton Rail Yard, Stockton, CA
Running Exhaust Emissions
Number of VMT per VMT per Emission Factors (g/mi) Emissions (tpy) Truck Trips Trip Year ROG CO NOx DPM SOx ROG CO NOx DPM SOx
Notes: 1. Number of vehicle trips is equal to 8 vehicles at 1 round trip (in and out of yard) per day. 2. VMT per trip and idling per day estimated based on personal observation and discussions with UPRR staff. 3. Running exhaust emission factors calculated from EMFAC-WD 2006 with the BURDEN output option. 4. Idling exhaust emissions factors calculated using the EMFAC-WD 2006 model with the EMFAC output option. 5. Traveling exhaust emission factor calculations assumed an average speed of 15 mph.
CONFIDENTIAL BUSINESS INFORMATION/TRADE SECRET
APP-132
CONFIDENTIAL BUSINESS INFORMATION/TRADE SECRET
Emissions from On-Road Diesel-Fueled Trucks Stockton Rail Yard, Stockton, CA
Running Exhaust Emissions
Equipment Model Vehicle Annual Emission Factors (g/mi) Emissions (tpy) Type Make Model Year Class VMT ROG CO NOx DPM SOx ROG CO NOx DPM SOx
Equipment Model Vehicle Idling Emission Factors (g/hr) Emissions (tpy) Type Make Model Year Class (min/day) (hr/yr) ROG CO NOx DPM SOx ROG CO NOx DPM SOx
Notes: 1. Annual VMT estimated by UPRR personnel based on total vehicle mileage and the amount of time spent in the Yard. 2. Idling time (min/day) estimated by UPRR personnel. 3. Running exhaust emissions calculated using the EMFAC-WD 2006 model with the BURDEN output option. 4. Idling exhaust emissions factors calculated using the EMFAC-WD 2006 model with the EMFAC output option. 5. Traveling exhaust emission factor calculations assumed an average speed of 15 mph.
CONFIDENTIAL BUSINESS INFORMATION/TRADE SECRET
APP-133
CONFIDENTIAL BUSINESS INFORMATION/TRADE SECRET
Summary of Emissions from Heavy Equipment Stockton Rail Yard, Stockton, CA
Notes: 1. Hours of operation estimated by UP personnel. 2. Emission factors and load factors from CARB s OFFROAD2006 model. 3. Assumes a Diesel fuel sulfur content of 130 ppm. 4. VOC evaporative emissions are negligible.
CONFIDENTIAL BUSINESS INFORMATION/TRADE SECRET
CONFIDENTIAL BUSINESS INFORMATION/TRADE SECRET
CONFIDENTIAL BUSINESS INFORMATION/TRADE SECRET
APP-134
Particulate Matter Emissions from the Sand Tower Stockton Rail Yard, Stockton, CA
Pollutant
2005 Sand Throughput
(ton/yr)
Pneumatic Transfer Emission Factor
(lb/ton)
Gravity Transfer Emission Factor
(lb/ton)
Process Emissions (tpy) Pneumatic Transfer
Gravity Transfer
Total
PM10 312.00 0.00034 0.00099 0.0001 0.0002 0.0002
Notes: 1. Sand throughput is based on the SJVAPCD Permit throughput limit of 26 tons per month. 2. Pneumatic transfer emission factor from AP-42, Table 11.12-2, 6/06. Factor for controlled pneumatic
cement unloading to elevated storage silo was used. The unit is equipped with a fabric filter. 3. Gravity transfer emission factor from AP-42, Table 11.12-2, 6/06. Factor for sand transfer was used. 4. There are no TAC emissions from this source.
CONFIDENTIAL BUSINESS INFORMATION/TRADE SECRET
CONFIDENTIAL BUSINESS INFORMATION/TRADE SECRET
APP-135
Emissions from Primary Clarifier and Oil/Water Separator Stockton Rail Yard, Stockton, CA
1. Emission rates are from the Air Emissions Inventory and Regulatory Analysis Report for Stockton Yard, Trinity Consultants, July 2003.
2. Emission rates from USEPA s Water8 Program and are based on the 2000 wastewater flow rate of 2,200,000 gallons per year.
3. Emissions (lb/yr) were calculated multiplying the emission rate by the ratio of the 2000 wastewater flow rate and the 2005 wastewater flow rate.
lb/yr = Emissions (g/sec) x (3600 sec/hr) x (8760 hr/yr) x (1 lb/ 453.59 g) x (2,200,000 gal/yr / 1,562,030 gal/yr)
4. The 2005 wastewater flow rate was provided by Mr. Jim Diel of Union Pacific.
APP-136
CONFIDENTIAL BUSINESS INFORMATION/TRADE SECRET
Emissions from Auxiliary Generator Sets Stockton Rail Yard, Stockton, CA
Model Fuel Rating No.of Operating Schedule Load Exhaust & Crankcase Emissions (g/hp-hr) VOC Evaporative Emissions Emissions (tpy) Equipment Type Year Type (hp) Units (hr/day) (hr/yr) Factor ROG CO NOx DPM SOx Part 1 (g/hr) Part 2 (g/yr) ROG CO NOx DPM SOx
Notes: 1. The units are located on the ACE passenger trains and are used to provide comfort cooling. 2. There are a total of 3 units, but only 1 unit is operated overnight to provide cooling for cleaning and maintenance crews. The other 2 trains are connected to landside power, so the gensets are not operated. 3. The unit is operated from 8:00 p.m. - 5:00 a.m. from Sunday through Friday. 4. Load factor was estimated at 25% due to the nature of the operations. 5. VOC evaporative emissions are negligible.
CONFIDENTIAL BUSINESS INFORMATION/TRADE SECRET
APP-137
CONFIDENTIAL BUSINESS INFORMATION/TRADE SECRET
Equipment Specifications and Emissions from Storage Tanks Stockton Rail Yard, Stockton, CA
Tank No.
Tank
Location
Material Stored
Tank
Capacity
Tank
Dimensions
Shell Color
Shell
Condition
Annual Throughput
(gal/yr)
VOC Emissions
(lb/yr)
Permitted?
Citation AST-1 Repair Track Area Wastewater 2,000 10 x 6 (V) White Good NA NA Exempt Rule 2020 - 6.6.5 TNKG-0019 Repair Track Area Diesel 250 8 x 3 x 2 (H) White Good NA NA Exempt Rule 2020 -6.6.4 TNKG-0019 Repair Track Area Gasoline 250 8 x 3 x 2 (H) White Good NA NA Exempt Rule 2020 -6.6.4 TNKO-0294 WWTP Sludge 7,000 16 x 8 White Good 8,000 Neg. NA NA TNKS-0056 WWTP Industrial Stormwater 88,000 34 x 20 (V) White Good 1,562,030 Neg. NA NA TNKD-9010 WWTP Industrial Stormwater 357,300 32 x 42 (v) White Good 1,562,030 Neg. NA NA TNKO-0295 WWTP Recovered Oil 10,000 15 x 10.5 (V) White Good NA NA Exempt Rule 2020 - 6.6.5 TNKO-0296 Diesel Shop Empty 20,000 33.5 x 10 (H) White Good NA NA NA NA TNKO-0297 Diesel Shop Empty 20,000 33.5 x 10 (H) White Good NA NA NA NA ACE Repair Track Area Used Oil 200 Unknown Unk. Good NA NA Exempt Rule 2020 - 6.6.4
Notes: 1. TNKO-0294 stores sludge and other solids from WWTP operations; therefore, emissions from this tank are assumed to be negligible. 2. TNKS-0056 and TNKD-9010 store industrial stormwater and are located downstream of the primary clarifier at the WWTP. The primary clarifier has an
organics removal efficiency of 99%; therefore, emissions from these tanks are assumed to be negligible.
CONFIDENTIAL BUSINESS INFORMATION/TRADE SECRET
CONFIDENTIAL BUSINESS INFORMATION/TRADE SECRET
CONFIDENTIAL BUSINESS INFORMATION/TRADE SECRET
APP-138
Equipment Specifications for Heaters Stockton Rail Yard, Stockton, CA
Location
Heater Type
Fuel Type
Rating (MMBtu/hr)
Permitted?
Citation Yard Office Space Heater Natural Gas 0.065 Exempt Rule 2020 - 6.1.1 Yard Office Space Heater Natural Gas 0.065 Exempt Rule 2020 - 6.1.1 Yard Office Space Heater Natural Gas 0.065 Exempt Rule 2020 - 6.1.1 Yard Office Water Heater Natural Gas 0.035 Exempt Rule 2020 - 6.1.1 Signal Shop Space Heater Propane 0.125 Exempt Rule 2020 - 6.1.1 Engineering Office Space Heater Natural Gas 0.05 Exempt Rule 2020 - 6.1.1 Engineering Office Space Heater Natural Gas 0.05 Exempt Rule 2020 - 6.1.1 Engineering Office Space Heater Natural Gas 0.05 Exempt Rule 2020 - 6.1.1 Engineering Office Space Heater Natural Gas 0.05 Exempt Rule 2020 - 6.1.1 Engineering Office Space Heater Natural Gas 0.05 Exempt Rule 2020 - 6.1.1 Engineering Office Space Heater Natural Gas 0.05 Exempt Rule 2020 - 6.1.1
Notes: 1. Heaters with a rating of 5.0 MMBtu or less and are fired exclusively with natural gas or
propane are exempt from SJVAPCD permitting requirements per Rule 2020, Section 6.1.1.
CONFIDENTIAL BUSINESS INFORMATION/TRADE SECRET
CONFIDENTIAL BUSINESS INFORMATION/TRADE SECRET
APP-139
Equipment Specifications for Welders Stockton Rail Yard, Stockton, CA
Location
Make
Fuel Type
Rating (hp)
Permitted?
Citation One Spot Car Dept Bobcat 225G Gasoline 16 Exempt Rule 2020-6.1.2 and 6.10 One Spot Car Dept Unknown Gasoline 15 Exempt Rule 2020-6.1.2 and 6.10 One Spot Car Dept Unknown Gasoline 15 Exempt Rule 2020-6.1.2 and 6.10 One Spot Car Dept Unknown Gasoline 12.5 Exempt Rule 2020-6.1.2 and 6.10 One Spot Car Dept Unknown Gasoline 12.5 Exempt Rule 2020-6.1.2 and 6.10 One Spot Car Dept Unknown Gasoline 12.5 Exempt Rule 2020-6.1.2 and 6.10 One Spot Car Dept Unknown Gasoline 12.5 Exempt Rule 2020-6.1.2 and 6.10 One Spot Car Dept Unknown Gasoline 12.5 Exempt Rule 2020-6.1.2 and 6.10 Boom Truck Miller Bobcat 250D Diesel 20 Exempt Rule 2020-6.1.2 and 6.11 Boom Truck Miller 3 Air Pak Diesel 40 Exempt Rule 2020-6.1.2 and 6.12 Boom Truck Miller Big Blue 400D Diesel 35 Exempt Rule 2020-6.1.2 and 6.13 Locomotive Maint. Truck Weldmark 225 Gasoline 20 Exempt Rule 2020-6.1.2 and 6.14 Bridge Maintenance Miller Bobcat 225 Gasoline 16 Exempt Rule 2020-6.1.2 and 6.15 Bridge Maintenance Miller Bobcat 225 Gasoline 16 Exempt Rule 2020-6.1.2 and 6.16 Bridge Maintenance Lincoln WP225 G7 Gasoline 20 Exempt Rule 2020-6.1.2 and 6.17 WWTP - Repair Truck Unknown Gasoline 16 Exempt Rule 2020-6.1.2 and 6.17
Notes: 1. Welding equipment and operations are exempt from SJVAPCD permitting requirements per Rule 2020,
Section 6.10. 2. Internal combustion engines rated at 50 hp or less are exempt from SJVAPCD permitting requirements per
Rule 2020, Section 6.1.2.
CONFIDENTIAL BUSINESS INFORMATION/TRADE SECRET
Equipment Specifications for Portable Steam Cleaners Stockton Rail Yard, Stockton, CA
Location
Make
Emission
Unit
Fuel Type
Rating
(MMBtu/hr or hp)
2005 Hours of Operation
(hr/yr)
Permitted?
Citation Locomotive Maintenance Unknown Pump Electric 11 48 Exempt Electric motor.
North Star Pump Gasoline 13 20 Exempt Rule 2020 - 6.1.2. Heater Diesel 0.24 20 Exempt Rule 2020 - 3.6
Notes: 1. Internal combustion engines rated at 50 hp or less are exempt from SJVAPCD permitting requirements per Rule 2020, Section 6.1.2. 2. Units are "low emitting units" per Rule 2020, Section 3.6.
CONFIDENTIAL BUSINESS INFORMATION/TRADE SECRET
APP-140
CONFIDENTIAL BUSINESS INFORMATION/TRADE SECRET
APP-141
Equipment Specifications for Miscellaneous Combustion Devices Stockton Rail Yard, Stockton, CA
Location
Equipment Type
Make
Fuel Type
Rating
(hp)
Permitted?
Citation MoW Repair Compound Hydraulic Power Pack Unknown Gasoline 18 Exempt Rule 2020-6.1.2 MoW Repair Compound Pressure Washer Stanley Gasoline 18 Exempt Rule 2020-6.1.2 One Spot Car Department Air Compressor Unknown Gasoline 5 Exempt Rule 2020-6.1.2 Locomotive Repair Pressure Washer Power Ease Diesel 10 Exempt Rule 2020-6.1.2 Locomotive Repair Pressure Washer Power Ease Diesel 10 Exempt Rule 2020-6.1.2 Bridge Maintenance Hydraulic Jack Unknown Gasoline 5.5 Exempt Rule 2020-6.1.2 Maintenance Crew Air Compressor Unknown Gasoline 5 Exempt Rule 2020-6.1.2
Notes: 1. Internal combustion engines rated at 50 hp or less are exempt from SJVAPCD permitting requirements per
Rule 2020, Section 6.1.2.
CONFIDENTIAL BUSINESS INFORMATION/TRADE SECRET
APP-142
APPENDIX G
DETAILED RISK SCREENING CALCULATIONS
CONFIDENTIAL BUSINESS INFORMATION/TRADE SECRET
CONFIDENTIAL BUSINESS INFORMATION/TRADE SECRET
APP-143
Summary of Risk Index Values Stockton Rail Yard, Stockton, CA
SOURCE TREATMENT AND ASSUMPTIONS FOR AIR DISPERSION MODELING FOR NON-LOCOMOTIVE SOURCES
CONFIDENTIAL BUSINESS INFORMATION/TRADE SECRET
APP-147
Appendix H
Source Treatment and Assumptions for Air Dispersion Modeling for Non-Locomotive Sources
As shown in Figure 3 emissions were allocated spatially throughout the Yard in the areas where each source type operates or is most likely to operate. Emissions from heavy equipment were simulated as a series of volume sources along their corresponding travel routes and work areas. Emission sources are first allocated to the areas of the yard where their activity occurs, and are then allocated uniformly to a series of sources within the defined areas. Idling of elevated cargo handling equipment (Century crane) were simulated as a series of point sources within the areas where these events occur.
Assumptions used spatially to allocate emissions for each source group are shown in the Table below. See Figure 3 for the source locations. See Appendix A-4 for assumptions regarding the spatial allocation of locomotive emissions.
CONFIDENTIAL BUSINESS INFORMATION/TRADE SECRET
Source Treatment and Assumptions for Air Dispersion Modeling for Non-Locomotive Sources Stockton Rail Yard
Source
Source Treatment
Assumptions for Spatial Allocation of Emissions
Heavy Equipment (idling and traveling) Volume Backhoes - Emissions from backhoe operations were distributed across the Yard. Trackmobile, Clark Forklift, Pettibone Crane - allocated all emissions to the areas in and around the RIP Track. Century Crane - allocated all emissions equally between the SP Yard and the East Yard. JBC Forklift - emissions from forklift operations were allocated to the area in and around the Signal Shop.
APP-148
APP-149
APPENDIX I
SEASONAL AND DIURNAL ACTIVITY PROFILES
APP-150
Appendix I
Development of Temporal Activity Profiles for the UPRR StocktonYard
Locomotive activity can vary by time of day and season. For each yard, the number of trains arriving and departing from the yard in each month and each hour of the day was tabulated and used to develop temporal activity profiles for modeling. The number of locomotives released from service facilities in each month was also tabulated. The AERMOD EMISFACT SEASHR option was used to adjust emission rates by season and hour of the day, and the EMISFACT SEASON option was used where only seasonal adjustments were applied. Where hour of day adjustments (but not seasonal) were applied, the EMISFACT HROFDY option was used.
Time of day profiles for train idling activity were developed assuming that departure events involved locomotive idling during the hour of departure and the two preceding hours, and that arrival events involved locomotive idling during the hour of arrival and the two hours following. Thus, the hourly activity adjustment factor for hour i is given by
1 i 2
3 NA( j) 1 3
i
j i 24
(NA( j) j 1
ND( j) j i 2 ,
ND( j))
where NA(j) and ND(j) are respectively the number of arriving and departing trains in hour j. These factors were applied to both idling on arriving and departing trains and idling in the service area (if applicable).
Similarly, time of day profiles for road power movements in the yard (arrivals, departures, and power moves) were developed without including arrivals in preceding hours and departures in subsequent hours. In this case, the hourly activity adjustment factor for hour i is given by
NA(i) 24
(NA( j)
ND(i) .
j 1
ND( j))
Seasonal adjustment factors are calculated as the sum of trains arriving and departing in each three month season, divided by the total number of arrivals and departures for the year. The hourly adjustment factors for each season are simply the product of the seasonal adjustment factor and the 24 hourly adjustment factors.
For yards with heavy duty truck and cargo handling activities related to rail traffic, seasonal train activity adjustments were applied, but not hour of day adjustments. Temporal profiles for yard switching operations were based on hourly (but not seasonal) factors developed from the operating shifts for the individual yard switching jobs. In some cases, locomotive load testing diurnal profiles were developed based on the specific times of day when load testing is conducted.
Table I-1 lists the hourly activity factors derived for train movements and train idling at the UPRR Stockton Yard. Table I-2 lists the hourly activity factors derived from operating shift information for yard switching operations. Separate temporal profiles are listed for day and night
moving emissions as different volume source parameters are used for day and night. Table I-3 lists the seasonal activity factors for UPRR train and service activity.
APP-151
Table I-1. Hourly Activity Factors for Train Activity at the UPRR Stockton Yard
Table I-3. Seasonal Activity Factors for the UPRR Stockton Yard
Activity Type Winter Spring Summer UPRR Trains 0.876 1.045 1.037 UPRR Service 0.689 1.073 1.131
Fall 1.042 1.107
APP-153
APPENDIX J
SELECTION OF POPULATION FOR THE URBAN OPTION INPUT IN AERMOD AIR DISPERSION MODELING ANALYSIS
CONFIDENTIAL BUSINESS INFORMATION/TRADE SECRET
APP-154
Appendix J
Selection of Population for the Urban Option Input in AERMOD Air Dispersion Modeling Analysis
Urban heat islands and the thermal domes generated by them extend over an entire urbanized area1. Hot spots within the urban heat island are associated with roads and roofs, which surround each Union Pacific (UP) rail yard in high density. Following guidance cited by the ARB ("For urban areas adjacent to or near other urban areas, or part of urban corridors, the user should attempt to identify that part of the urban area that will contribute to the urban heat island plume affecting the source."), it is the entire metropolitan area that contributes to the urban heat island plume affecting the rail yard. For metropolitan areas containing substantial amounts of open water, the area of water should not be included.
To simulate the effect of the urban heat island on turbulence in the boundary layer, especially at night, when the effect is substantial, AERMOD adjusts the height of the nighttime urban boundary layer for the heat flux emitted into the boundary layer by the urban surface, which is warmer than surrounding rural areas2,3. The difference between the urban and rural boundary layer temperatures is proportional to the maximum temperature difference of 12 Celsius degrees observed in a study of several Canadian cities, and directly related to the logarithm of the ratio of the urban population to a reference population of 2,000,000 (i.e., Montreal, the Canadian city with the maximum urban-rural temperature difference)4.
The adjusted height of the nocturnal urban boundary layer is proportional to the one- fourth power of the ratio of the population of the city of interest to the reference population, based on the observation that the convective boundary layer depth is proportional to the square root of the city size, and city size is roughly proportional to the square root of its population, assuming constant population density5. Regardless of wind direction during any specific hour used by AERMOD, it is the entire metropolitan area, minus bodies of water, which moves additional heat flux into the atmosphere and affects its dispersive properties, not just the 400 km2 area of the air dispersion modeling domain that surrounds the each rail yard, which was chosen purely for modeling convenience.
Continuing to follow the guidance cited by the ARB ("If this approach results in the identification of clearly defined MSAs, then census data may be used as above to determine the appropriate population for input to AERMOD"), the population of each Metropolitan Statistical Area is being used in the modeling run for each rail yard.
1 USEPA. Thermally-Sensed Image of Houston, http://www.epa.gov/heatisland/pilot/houston_thermal.htm, included in Heat Island Effect website, http://www.epa.gov/heatisland/about/index.html, accessed November 8, 2006. 2 USEPA. AERMOD: Description of Model Formulation, Section 5.8 - Adjustments for the Urban Boundary Layer, pages 66-67, EPA-454/R-03-004, September 2004, accessed at http://www.epa.gov/scram001/7thconf/aermod/aermod_mfd.pdf on November 9, 3 Oke, T.R. City Size and the Urban Heat Island, Atmospheric Environment, Volume 7, pp. 769-779, 1973. 4 Ibid for References 3 and 4. 5 Ibid.
The accompanying shape files include census boundaries as polygons and the corresponding residential populations from the 2000 U.S. Census. Separate shape files are included at the tract, block group, and block levels. The primary ID for each polygon begins with ssccctttttt, where ss is the FIPS state code (06 for California), cc is the county code, and tttttt is the tract code. The primary IDs for block groups have a single additional digit which is the block group number within each tract. Those for blocks have four additional digits identifying the block number. The population for each polygon are included as both the secondary ID and as attribute 1. Polygon coordinates are UTM zone 10 (Oakland and Stockton) or 11 (southern California yards), NAD83, in meters. The files contain entire tracts, block groups, or blocks that are completely contained within a specified area. For all yards except Stockton, the area included extends 10 kilometers beyond the 20 x 20 kilometer modeling domains. For Stockton, this area was extended to 20 kilometers beyond the modeling domain boundaries to avoid excluding some very large blocks. In merging the population data1 with the corresponding boundaries2, it was noted that at all locations, there are defined census areas (primarily blocks, but in some cases block groups and tracts) for which there are no population records listed in the population files. Overlaying these boundaries on georeferenced aerial photos indicates that these are areas that likely have no residential populations (e.g., industrial areas and parks). The defined areas without population data have been excluded from these files. Areas with an identified population of zero have been included. It was also observed that some blocks, block groups and tracts with residential populations cover both residential areas and significant portions of the rail yards themselves. For this reason, any analysis of population exposures based on dispersion modeling should exclude receptors that are within the yard boundaries or within 20 meters of any modeled emission source locations. To facilitate the exclusion of non-representative receptors, separate shape files have been generated that define the area within 20 meters of the yard boundaries for each yard. These files are also included with the accompanying population files. It should also be noted that the spatial extent of individual polygons can vary widely, even within the same type. For example, single blocks may be as small as 20 meters or as large as 10,000 meters or more in length. To estimate populations contained within specific areas, it may prove most useful to generate populations on a regular grid (e.g., 250 x 250 m cells) rather than attempting to process irregularly shaped polygons.
1 Population data were extracted from the Census 2000 Summary File l DVD, issued by the U.S. Department of Commerce, September 2001. 2 Boundaries were extracted from ESRI shapefiles (*.shp) created from the U.S. Census TIGER Line Files downloaded from ESRI (http://arcdata.esri.com/data/tiger2000/tiger_download.cfm).


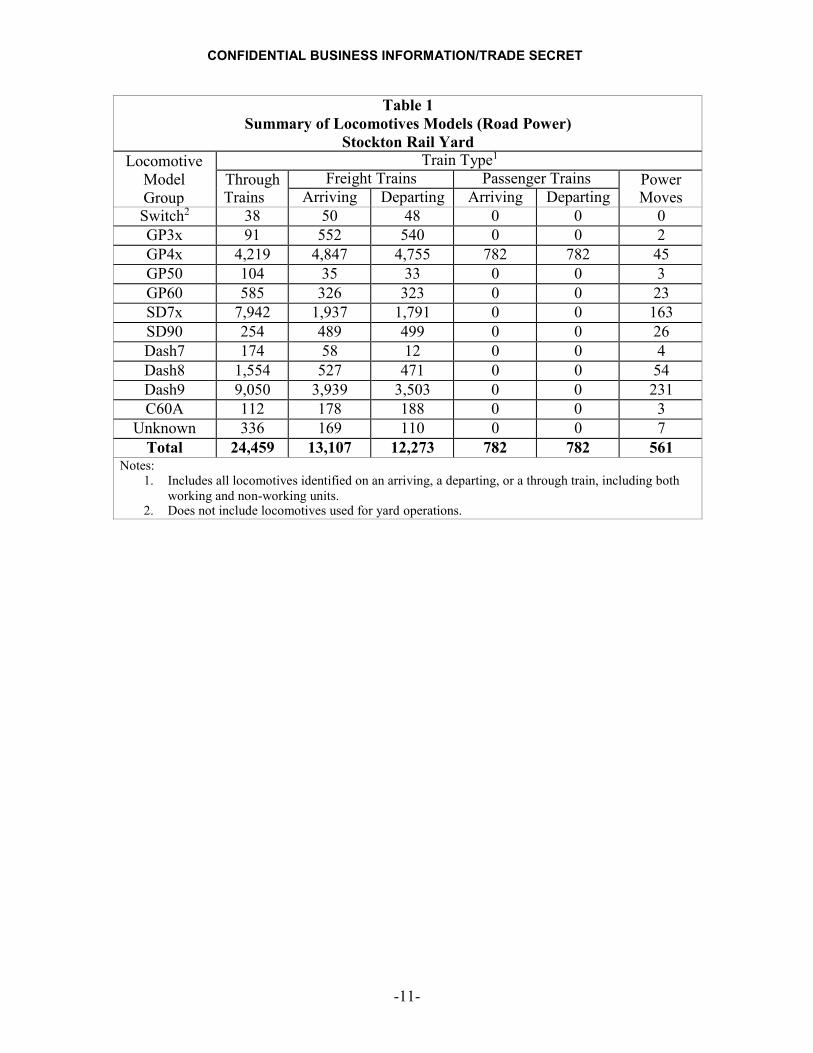


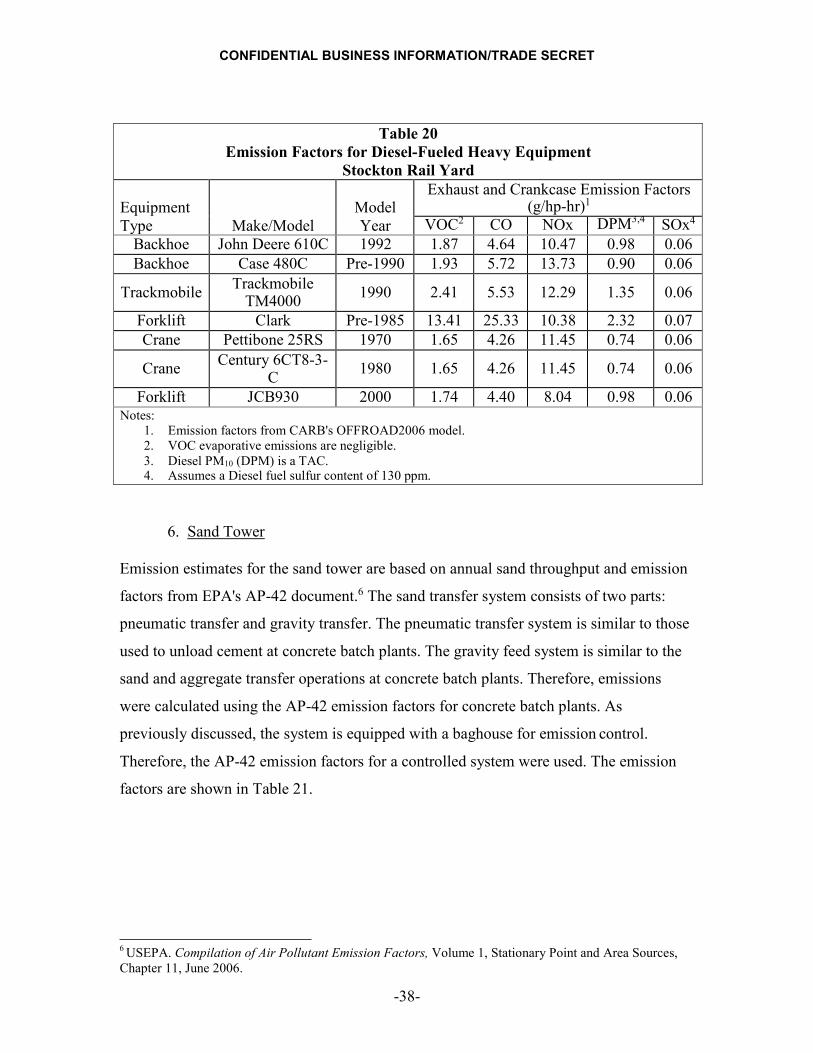


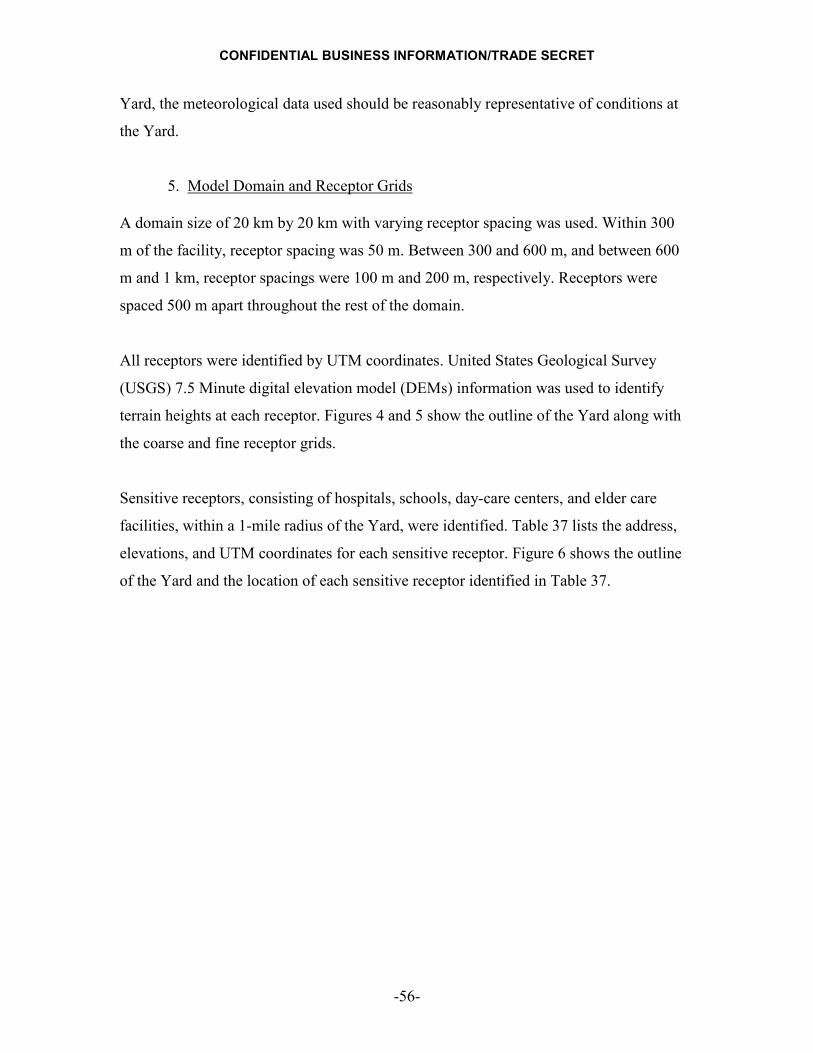


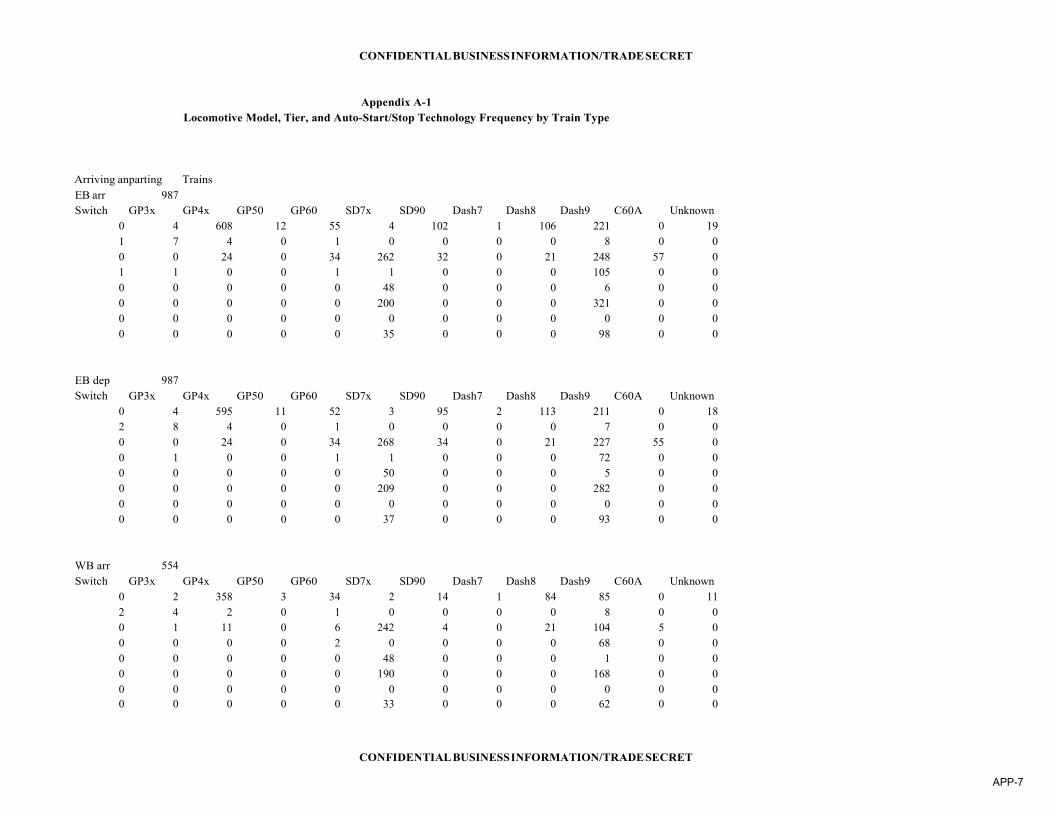


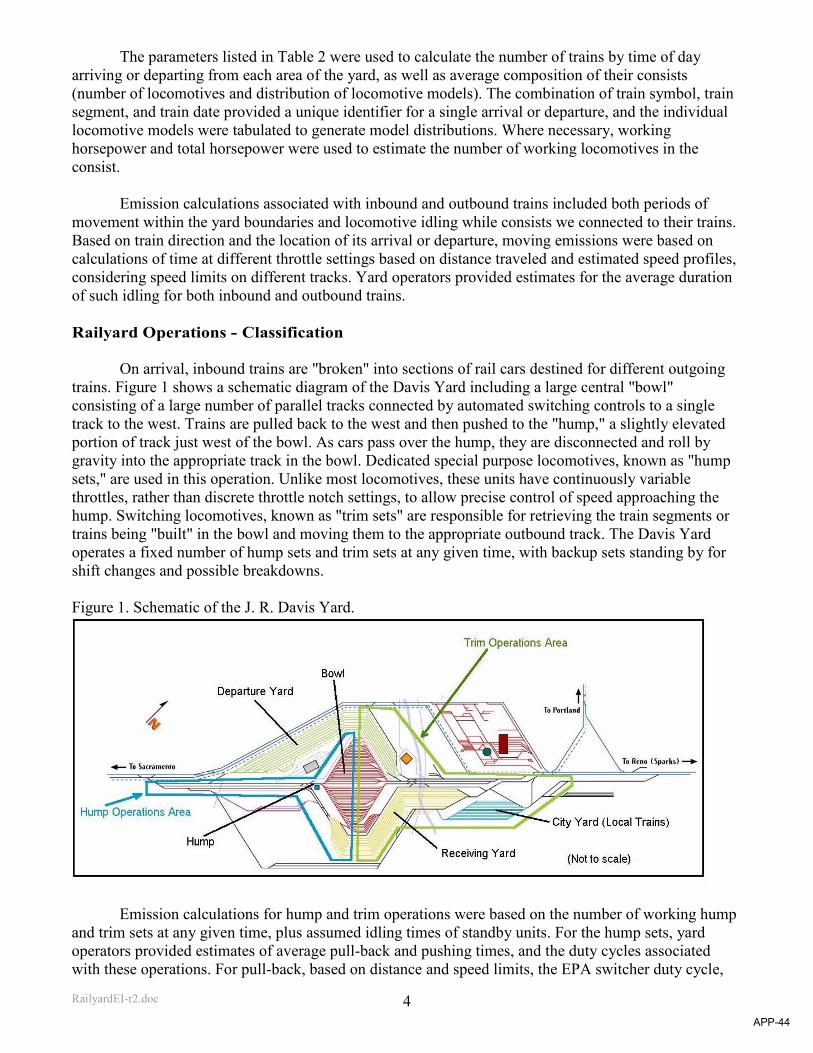


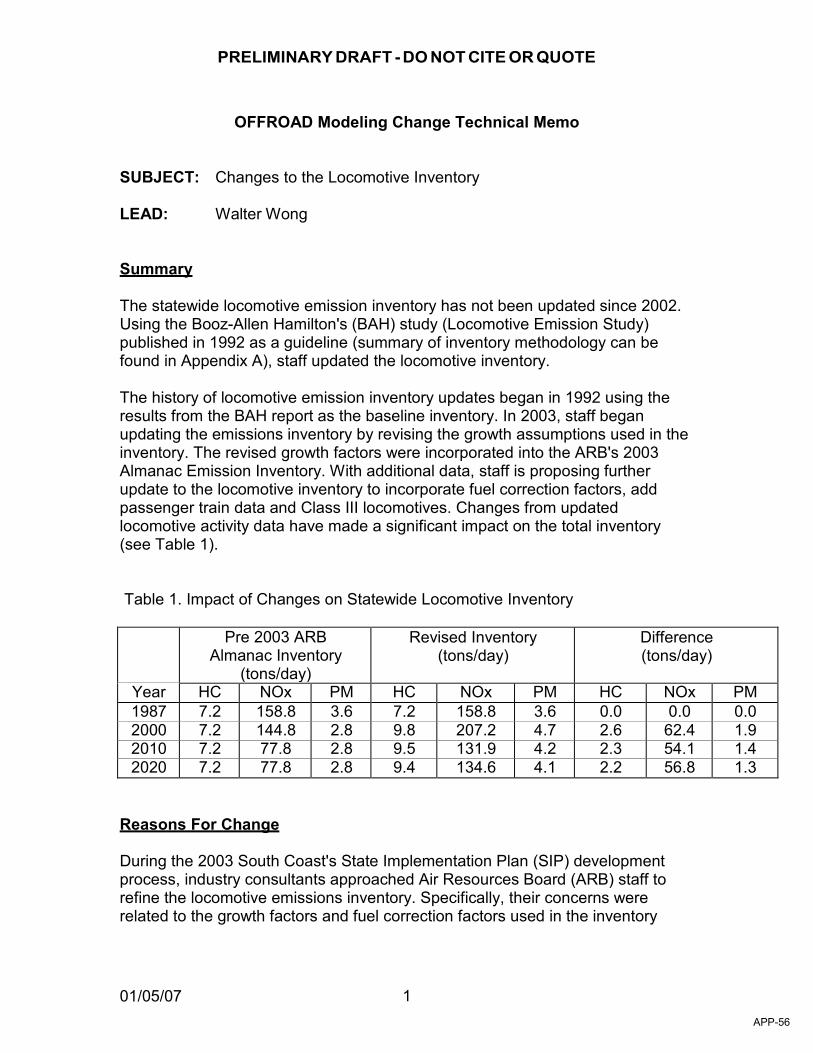


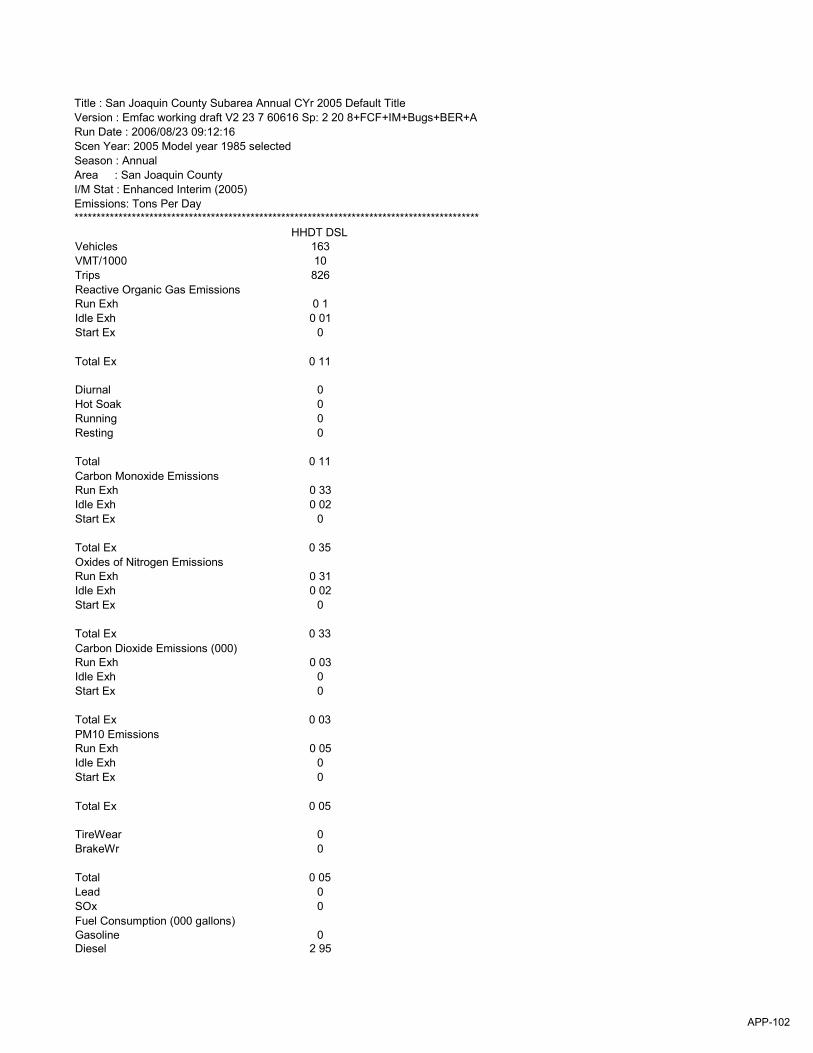


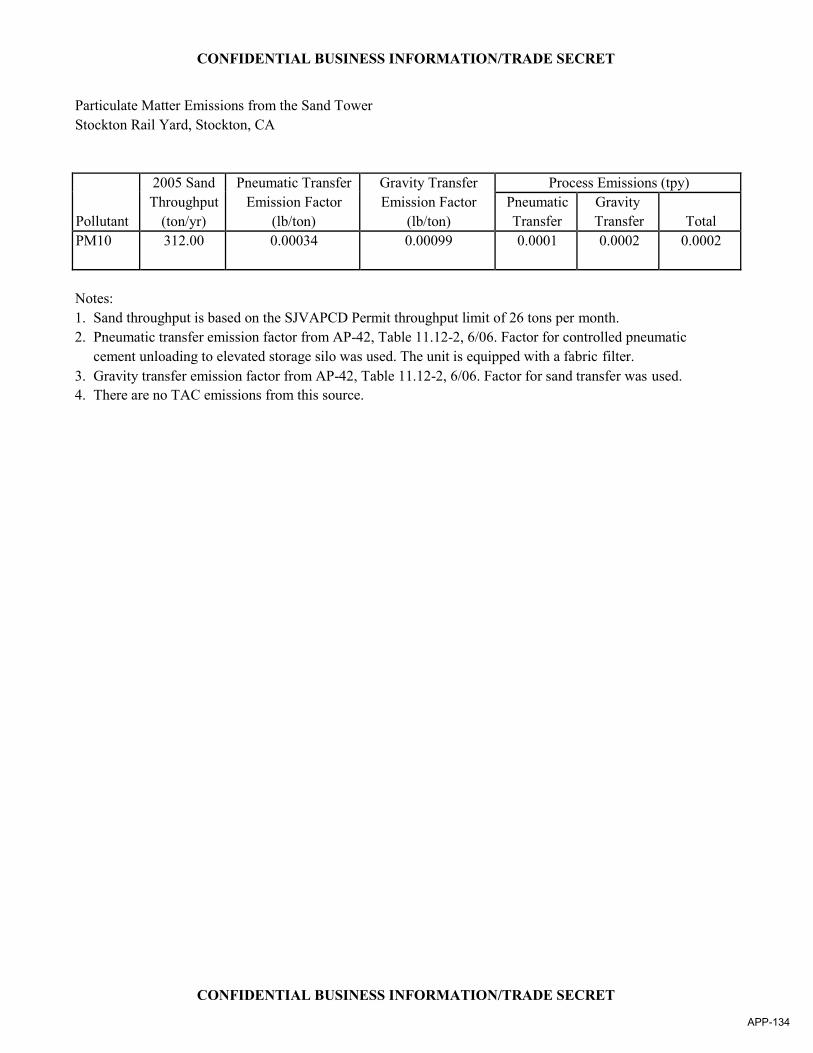


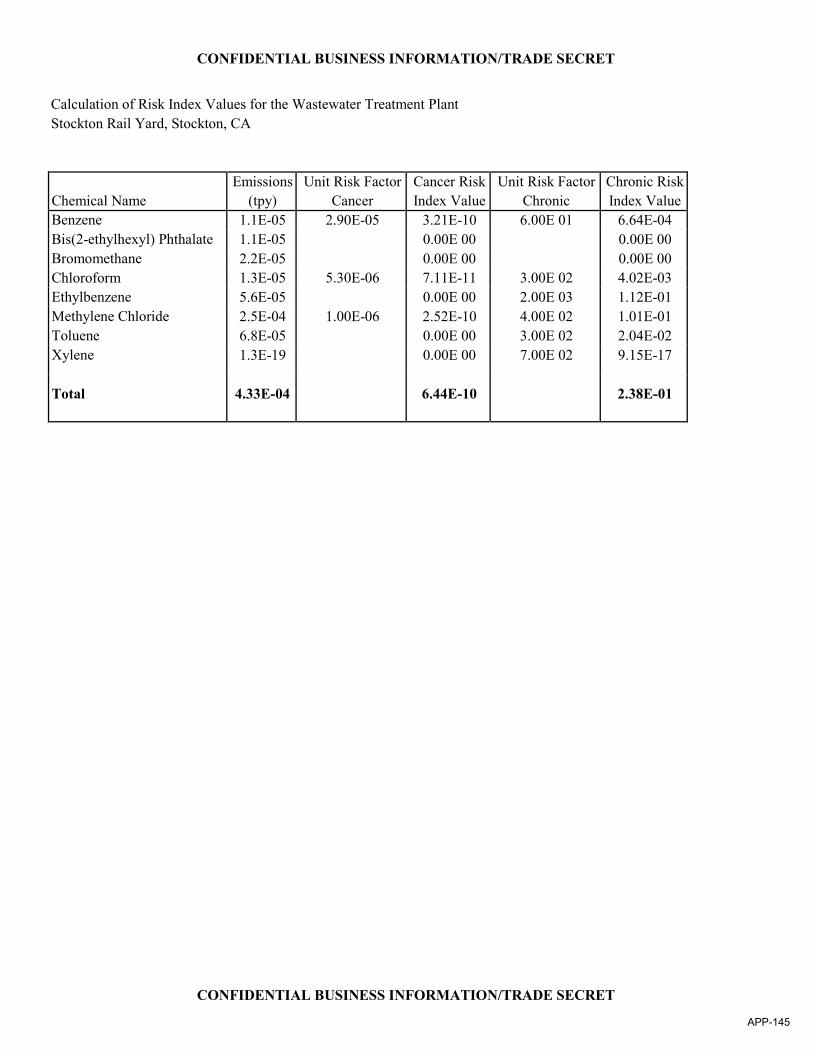


![Air Contaminant _54.12_ [Preamb]](https://static.documents.pub/doc/80x56/5695cf481a28ab9b028d6988/air-contaminant-5412-preamb.jpg)


