Journal of Physics: Conference Series OPEN ACCESS Gaseous contaminant detector in compressed air systems using photoacoustic spectroscopy To cite this article: Lopes N et al 2010 J. Phys.: Conf. Ser. 214 012059 View the article online for updates and enhancements. You may also like Peer review statement - Conference photograph - Motivation to adapt to climate change Kristina Blennow - Recent citations Finite Element Simulation of Photoacoustic Pressure in a Resonant Photoacoustic Cell Using Lossy Boundary Conditions L. Duggen et al - This content was downloaded from IP address 211.244.60.89 on 18/11/2021 at 08:51
Transcript
Journal of Physics Conference Series
OPEN ACCESS
Gaseous contaminant detector in compressed airsystems using photoacoustic spectroscopyTo cite this article Lopes N et al 2010 J Phys Conf Ser 214 012059
View the article online for updates and enhancements
You may also likePeer review statement-
Conference photograph-
Motivation to adapt to climate changeKristina Blennow
-
Recent citationsFinite Element Simulation of PhotoacousticPressure in a Resonant Photoacoustic CellUsing Lossy Boundary ConditionsL Duggen et al
-
This content was downloaded from IP address 2112446089 on 18112021 at 0851
Gaseous contaminant detector in compressed air systems
2MCI NanoSYD Alsion2 University of southern Denmark 6400 Soslashnderborg
email nlpajdk
Abstract A photoacoustic (PA) setup is presented based on diode laser excitation in the
infrared (5 mW 1728 nm)The sensor being developed is designed to detect spurious amounts
of gaseous contaminants like oil vapour in a highly perturbing environment (high flow high
pressure) via excitation of molecular vibrations of C-H bonds An acoustic oscillator is driven
at resonance to amplify the photoacoustic signal The measurement cell is designed for
optimum quality factor (Q) and setup constant [Cn(ωn)]
1 Introduction
Laser photoacoustic (PA) spectroscopy is a technique for detection of gaseous contaminants having
attractive features like small cell size stability ease of optical alignment and inexpensive
microphones High sensitivities in gas detection have been reported using infrared lasers such as CO
and CO2 lasers to detect contaminants in the ppb (parts per billion) range due to their high output
power and tunability to strong fundamental vibration transitions [1]
There exist two types of photoacoustic cells resonant and non resonant Though non resonant cells
are smaller than resonant cells a resonant cell is used in the setup due to the following advantages
The photoacoustic signal can be elevated with the resonance of the PA cell and has a higher signal
to noise ratio (SNR) compared to the non resonant cell Sample gas can be flowed continuously
through the cell as long as the inlet and outlet of the gas is at a place where the standing acoustic
wave has a node [2]
An important requirement in many industries is clean compressed air which satisfies ISO 8573 with
specifications of class 1 demanding an equivalent of a maximum residual hydro-carbon
contamination of less than 0005 mgm3[3] Today air quality is ensured by scheduled maintenance
of filter units and laboratory analysis This project aims at developing a platform for detection of oil
contaminants in compressed air the main requirements of such a sensor being sensitivity
applicability to a strongly perturbed system reliability and robustness The availability of diode
lasers has sped up the development of compact gas detection systems This work presents the
implementation of a diode infrared laser in a compact setup for the detection of gaseous
hydrocarbons
15th International Conference on Photoacoustic and Photothermal Phenomena (ICPPP15) IOP PublishingJournal of Physics Conference Series 214 (2010) 012059 doi1010881742-65962141012059
ccopy 2010 IOP Publishing Ltd 1
2 Photoacoustic spectroscopy
In this technique a modulated light source preferably a laser passes through a cell containing a sample
gas The absorbed energy of the laser heats the gas resulting in an expansion This in turn produces an
acoustic and thermal wave which is detected with sensitive microphones The amplitude of the
photoacoustic signal (S) for a cell with high Q is given by
( )n n LS C W (1)
Where ( ) ( 1)n n n n cell nC LF Q V (2)
Where Cn(120596n) is called the setup constant σ is the adiabatic index of the gas L is the length of cell Fn
is the normalized overlap integral of the resonant eigenmode with the laser field Qn is the acoustic
quality factor of the cell α is the absorption coefficient of the gas WL is the power of the laser Vcell is
the volume of the photoacoustic cell ωn is the resonant frequency The cell constant is not only
dependent on the frequency dimensions of the resonator and quality factor but also the spatial
overlap of the laser beam with the standing acoustic wave [1]
3 Experimental setup
Depending on the carbon hydrogen bonds there are four groups of hydrocarbons paraffinrsquos olefins
cyclo paraffinrsquos and aromatics As can be observed in Figure (1) strong C-H absorption bands can be
observed for oils at a wavelength region of 2300 ndash 2500 nm and higher Compact cheap laser sources
with sufficient power in this region are readily not available The availability of a cheaper compact
high power laser at 1728 nm has resulted in the selection of this wavelength
Figure 1 Infrared spectra of oil [4]
The schematic of the experimental setup is shown in Figure 2 The optical source used in the setup is
a 5 mW 1728 nm room temperature DFB laser from Nanoplus The divergence of the laser diode is
corrected by using an aspheric lens The cell is of resonant type operating with its first longitudinal
mode at around 245 kHz An electret microphone (Knowles EK-23028-C36) is mounted flush in
the wall of the resonator at the anti-node of the acoustic wave
The laser is modulated with a sinusoidal waveform generated by the lock-in amplifier in order to
generate a photoacoustic signal The cell was used with gaseous hydrocarbon contamination like n-
15th International Conference on Photoacoustic and Photothermal Phenomena (ICPPP15) IOP PublishingJournal of Physics Conference Series 214 (2010) 012059 doi1010881742-65962141012059
2
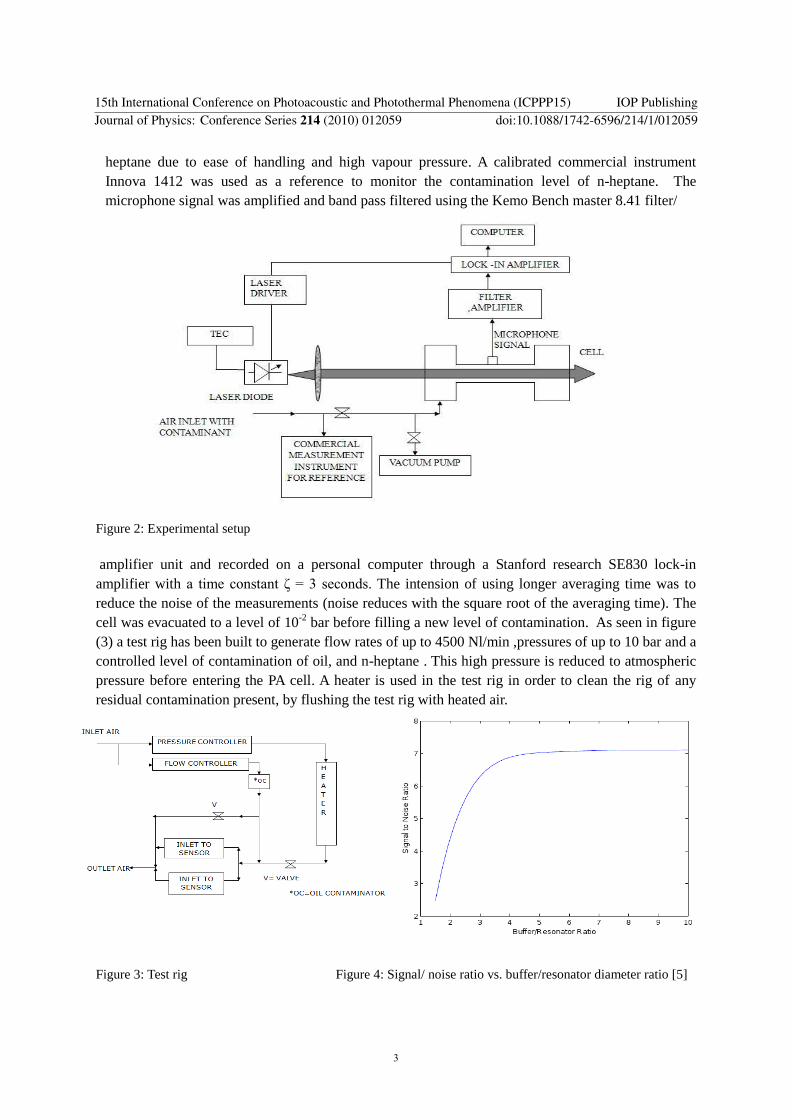
heptane due to ease of handling and high vapour pressure A calibrated commercial instrument
Innova 1412 was used as a reference to monitor the contamination level of n-heptane The
microphone signal was amplified and band pass filtered using the Kemo Bench master 841 filter
Figure 2 Experimental setup
amplifier unit and recorded on a personal computer through a Stanford research SE830 lock-in
amplifier with a time constant ζ = 3 seconds The intension of using longer averaging time was to
reduce the noise of the measurements (noise reduces with the square root of the averaging time) The
cell was evacuated to a level of 10-2
bar before filling a new level of contamination As seen in figure
(3) a test rig has been built to generate flow rates of up to 4500 Nlmin pressures of up to 10 bar and a
controlled level of contamination of oil and n-heptane This high pressure is reduced to atmospheric
pressure before entering the PA cell A heater is used in the test rig in order to clean the rig of any
residual contamination present by flushing the test rig with heated air
Figure 3 Test rig Figure 4 Signal noise ratio vs bufferresonator diameter ratio [5]
15th International Conference on Photoacoustic and Photothermal Phenomena (ICPPP15) IOP PublishingJournal of Physics Conference Series 214 (2010) 012059 doi1010881742-65962141012059
3
0 2 4 6 8 10 120
05
1
15
2
25
Contamination(mgm3)
Sign
al (m
V)
PA signal vs contamination
fit
4 Results
The laser used in the experiments operates at a wavelength of 1728 nm where several C-H absorption
bands are observed These absorption lines are free from interference of water vapour [4] The design
of the cell is a critical parameter in determining the sensitivity of the setup Though it is expected that
no signal is generated when no contaminant gas molecules are present background noise that is
coherent with the photoacoustic signal is present due to heating at the windows by the laser light this
being the limiting factor for sensitivity Numerical modelling shows that an optimization of the cell
geometry can increase the signal to noise ratio As seen in Figure 4 above the signal to noise ratio
increases by increasing the diameter of the buffer inserted on either side of the resonator
The resonator is made from aluminum with a length of 63 mm and inner diameter of 15 mm Buffers
which acts as acoustic (λ4) notch filters with a diameter of 39 mm and lengths of 315 mm are
added on either side of the resonator to help reduce window noise The cell is designed for a quality
factor (Q) of 125 and a setup constant (Cn (ωn)) of 1662 Pa cmW
The concentration of n-heptane was varied and the magnitude of the PA signal was measured by the
lock in amplifier as observed in Figure 5 The solid line shows a linear fit of the data
Figure 5 Plot of PA signal (mV) vs Contamination level of n-heptane (mgm3)
5 Future work and conclusions
The experiments demonstrate the use of the photoacoustic setup as a compact detector for the
monitoring of gaseous hydrocarbon contaminants The laser wavelength is selected to achieve a good
balance between strong absorption lines size and cost The mechanical noise due to a chopper used in
some setups to modulate the laser source is avoided by instead using the modulation of the injection
current to generate a photoacoustic signal In the above setup the modulation frequency is set to the
resonance frequency of the cell this resonance frequency fluctuates due to variations of temperature
and gas composition Thus it is necessary to perform scans of the modulation frequency across a small
range around the resonance frequency The background signal due to the absorbance of the windows
and the cell walls by the laser light also poses the limiting value of sensitivity Future developments to
improve sensitivity include use of optical microphones (Sensitivity 5VPa) to avoid electromagnetic
interference and the use of a 300 mW 1728 nm semiconductor laser with the intention of increasing
the sensitivity
15th International Conference on Photoacoustic and Photothermal Phenomena (ICPPP15) IOP PublishingJournal of Physics Conference Series 214 (2010) 012059 doi1010881742-65962141012059
4
Acknowledgement
Financial support from the Danish National Advanced Technology foundation (HTF) is gratefully
acknowledged
Lars Duggen (SDU) for providing simulations on various cell designs
We thank FYuyang for his input on this project
References
[1] AMiklosPHess and ZBozoki 2001 RevSciInstrum721937
[2] LYHaoZRenQShi JLWuYZhengJJZheng and QSZhu 2002 RevSciInstrum73(2)404
[3] wwwisoorg International organization for standardization (ISO 8573)
[4] FYuyang 2008 Phd thesisSDU SoslashnderborgAalborg University PAJ Systemteknik Denmark
[5]Lars Duggen (University of southern Denmark)
15th International Conference on Photoacoustic and Photothermal Phenomena (ICPPP15) IOP PublishingJournal of Physics Conference Series 214 (2010) 012059 doi1010881742-65962141012059
5
Gaseous contaminant detector in compressed air systems
2MCI NanoSYD Alsion2 University of southern Denmark 6400 Soslashnderborg
email nlpajdk
Abstract A photoacoustic (PA) setup is presented based on diode laser excitation in the
infrared (5 mW 1728 nm)The sensor being developed is designed to detect spurious amounts
of gaseous contaminants like oil vapour in a highly perturbing environment (high flow high
pressure) via excitation of molecular vibrations of C-H bonds An acoustic oscillator is driven
at resonance to amplify the photoacoustic signal The measurement cell is designed for
optimum quality factor (Q) and setup constant [Cn(ωn)]
1 Introduction
Laser photoacoustic (PA) spectroscopy is a technique for detection of gaseous contaminants having
attractive features like small cell size stability ease of optical alignment and inexpensive
microphones High sensitivities in gas detection have been reported using infrared lasers such as CO
and CO2 lasers to detect contaminants in the ppb (parts per billion) range due to their high output
power and tunability to strong fundamental vibration transitions [1]
There exist two types of photoacoustic cells resonant and non resonant Though non resonant cells
are smaller than resonant cells a resonant cell is used in the setup due to the following advantages
The photoacoustic signal can be elevated with the resonance of the PA cell and has a higher signal
to noise ratio (SNR) compared to the non resonant cell Sample gas can be flowed continuously
through the cell as long as the inlet and outlet of the gas is at a place where the standing acoustic
wave has a node [2]
An important requirement in many industries is clean compressed air which satisfies ISO 8573 with
specifications of class 1 demanding an equivalent of a maximum residual hydro-carbon
contamination of less than 0005 mgm3[3] Today air quality is ensured by scheduled maintenance
of filter units and laboratory analysis This project aims at developing a platform for detection of oil
contaminants in compressed air the main requirements of such a sensor being sensitivity
applicability to a strongly perturbed system reliability and robustness The availability of diode
lasers has sped up the development of compact gas detection systems This work presents the
implementation of a diode infrared laser in a compact setup for the detection of gaseous
hydrocarbons
15th International Conference on Photoacoustic and Photothermal Phenomena (ICPPP15) IOP PublishingJournal of Physics Conference Series 214 (2010) 012059 doi1010881742-65962141012059
ccopy 2010 IOP Publishing Ltd 1
2 Photoacoustic spectroscopy
In this technique a modulated light source preferably a laser passes through a cell containing a sample
gas The absorbed energy of the laser heats the gas resulting in an expansion This in turn produces an
acoustic and thermal wave which is detected with sensitive microphones The amplitude of the
photoacoustic signal (S) for a cell with high Q is given by
( )n n LS C W (1)
Where ( ) ( 1)n n n n cell nC LF Q V (2)
Where Cn(120596n) is called the setup constant σ is the adiabatic index of the gas L is the length of cell Fn
is the normalized overlap integral of the resonant eigenmode with the laser field Qn is the acoustic
quality factor of the cell α is the absorption coefficient of the gas WL is the power of the laser Vcell is
the volume of the photoacoustic cell ωn is the resonant frequency The cell constant is not only
dependent on the frequency dimensions of the resonator and quality factor but also the spatial
overlap of the laser beam with the standing acoustic wave [1]
3 Experimental setup
Depending on the carbon hydrogen bonds there are four groups of hydrocarbons paraffinrsquos olefins
cyclo paraffinrsquos and aromatics As can be observed in Figure (1) strong C-H absorption bands can be
observed for oils at a wavelength region of 2300 ndash 2500 nm and higher Compact cheap laser sources
with sufficient power in this region are readily not available The availability of a cheaper compact
high power laser at 1728 nm has resulted in the selection of this wavelength
Figure 1 Infrared spectra of oil [4]
The schematic of the experimental setup is shown in Figure 2 The optical source used in the setup is
a 5 mW 1728 nm room temperature DFB laser from Nanoplus The divergence of the laser diode is
corrected by using an aspheric lens The cell is of resonant type operating with its first longitudinal
mode at around 245 kHz An electret microphone (Knowles EK-23028-C36) is mounted flush in
the wall of the resonator at the anti-node of the acoustic wave
The laser is modulated with a sinusoidal waveform generated by the lock-in amplifier in order to
generate a photoacoustic signal The cell was used with gaseous hydrocarbon contamination like n-
15th International Conference on Photoacoustic and Photothermal Phenomena (ICPPP15) IOP PublishingJournal of Physics Conference Series 214 (2010) 012059 doi1010881742-65962141012059
2
heptane due to ease of handling and high vapour pressure A calibrated commercial instrument
Innova 1412 was used as a reference to monitor the contamination level of n-heptane The
microphone signal was amplified and band pass filtered using the Kemo Bench master 841 filter
Figure 2 Experimental setup
amplifier unit and recorded on a personal computer through a Stanford research SE830 lock-in
amplifier with a time constant ζ = 3 seconds The intension of using longer averaging time was to
reduce the noise of the measurements (noise reduces with the square root of the averaging time) The
cell was evacuated to a level of 10-2
bar before filling a new level of contamination As seen in figure
(3) a test rig has been built to generate flow rates of up to 4500 Nlmin pressures of up to 10 bar and a
controlled level of contamination of oil and n-heptane This high pressure is reduced to atmospheric
pressure before entering the PA cell A heater is used in the test rig in order to clean the rig of any
residual contamination present by flushing the test rig with heated air
Figure 3 Test rig Figure 4 Signal noise ratio vs bufferresonator diameter ratio [5]
15th International Conference on Photoacoustic and Photothermal Phenomena (ICPPP15) IOP PublishingJournal of Physics Conference Series 214 (2010) 012059 doi1010881742-65962141012059
3
0 2 4 6 8 10 120
05
1
15
2
25
Contamination(mgm3)
Sign
al (m
V)
PA signal vs contamination
fit
4 Results
The laser used in the experiments operates at a wavelength of 1728 nm where several C-H absorption
bands are observed These absorption lines are free from interference of water vapour [4] The design
of the cell is a critical parameter in determining the sensitivity of the setup Though it is expected that
no signal is generated when no contaminant gas molecules are present background noise that is
coherent with the photoacoustic signal is present due to heating at the windows by the laser light this
being the limiting factor for sensitivity Numerical modelling shows that an optimization of the cell
geometry can increase the signal to noise ratio As seen in Figure 4 above the signal to noise ratio
increases by increasing the diameter of the buffer inserted on either side of the resonator
The resonator is made from aluminum with a length of 63 mm and inner diameter of 15 mm Buffers
which acts as acoustic (λ4) notch filters with a diameter of 39 mm and lengths of 315 mm are
added on either side of the resonator to help reduce window noise The cell is designed for a quality
factor (Q) of 125 and a setup constant (Cn (ωn)) of 1662 Pa cmW
The concentration of n-heptane was varied and the magnitude of the PA signal was measured by the
lock in amplifier as observed in Figure 5 The solid line shows a linear fit of the data
Figure 5 Plot of PA signal (mV) vs Contamination level of n-heptane (mgm3)
5 Future work and conclusions
The experiments demonstrate the use of the photoacoustic setup as a compact detector for the
monitoring of gaseous hydrocarbon contaminants The laser wavelength is selected to achieve a good
balance between strong absorption lines size and cost The mechanical noise due to a chopper used in
some setups to modulate the laser source is avoided by instead using the modulation of the injection
current to generate a photoacoustic signal In the above setup the modulation frequency is set to the
resonance frequency of the cell this resonance frequency fluctuates due to variations of temperature
and gas composition Thus it is necessary to perform scans of the modulation frequency across a small
range around the resonance frequency The background signal due to the absorbance of the windows
and the cell walls by the laser light also poses the limiting value of sensitivity Future developments to
improve sensitivity include use of optical microphones (Sensitivity 5VPa) to avoid electromagnetic
interference and the use of a 300 mW 1728 nm semiconductor laser with the intention of increasing
the sensitivity
15th International Conference on Photoacoustic and Photothermal Phenomena (ICPPP15) IOP PublishingJournal of Physics Conference Series 214 (2010) 012059 doi1010881742-65962141012059
4
Acknowledgement
Financial support from the Danish National Advanced Technology foundation (HTF) is gratefully
acknowledged
Lars Duggen (SDU) for providing simulations on various cell designs
We thank FYuyang for his input on this project
References
[1] AMiklosPHess and ZBozoki 2001 RevSciInstrum721937
[2] LYHaoZRenQShi JLWuYZhengJJZheng and QSZhu 2002 RevSciInstrum73(2)404
[3] wwwisoorg International organization for standardization (ISO 8573)
[4] FYuyang 2008 Phd thesisSDU SoslashnderborgAalborg University PAJ Systemteknik Denmark
[5]Lars Duggen (University of southern Denmark)
15th International Conference on Photoacoustic and Photothermal Phenomena (ICPPP15) IOP PublishingJournal of Physics Conference Series 214 (2010) 012059 doi1010881742-65962141012059
5
Acknowledgement
Financial support from the Danish National Advanced Technology foundation (HTF) is gratefully
acknowledged
Lars Duggen (SDU) for providing simulations on various cell designs
We thank FYuyang for his input on this project
References
[1] AMiklosPHess and ZBozoki 2001 RevSciInstrum721937
[2] LYHaoZRenQShi JLWuYZhengJJZheng and QSZhu 2002 RevSciInstrum73(2)404
[3] wwwisoorg International organization for standardization (ISO 8573)
[4] FYuyang 2008 Phd thesisSDU SoslashnderborgAalborg University PAJ Systemteknik Denmark
[5]Lars Duggen (University of southern Denmark)
15th International Conference on Photoacoustic and Photothermal Phenomena (ICPPP15) IOP PublishingJournal of Physics Conference Series 214 (2010) 012059 doi1010881742-65962141012059


![Compressed gaseous fuel measuring systems for vehicles ...fault exceeding the applicable fault limit value [OIML V 1:2013, 5.14] 3.1.13 durability ability of the measuring instrument](https://static.documents.pub/doc/80x56/60c189919f6154633d311b2d/compressed-gaseous-fuel-measuring-systems-for-vehicles-fault-exceeding-the-applicable.jpg)


