24
Air pollution in Integrated Assessment Models Update on the Shared Socio Economic Pathways Shilpa Rao HTAP meeting, Feb17-19, Potsdam

Air pollution in Integrated Assessment Models
Update on the Shared Socio Economic Pathways
Shilpa RaoHTAP meeting, Feb17-19, Potsdam

Integrated Assessment models
• Integrated assessment models generally include both physical and social science models that consider demographic, political, and economic variables that affect greenhouse gas emission scenarios in addition to the physical climate system
• IAMs are not predictive models• Usually consist of a set of models that are linked to
model different variables• In the context of climate change, have a long-term
perspective of 100 years• Provide key inputs to GCMs and climate modelers for
assessing climate impacts
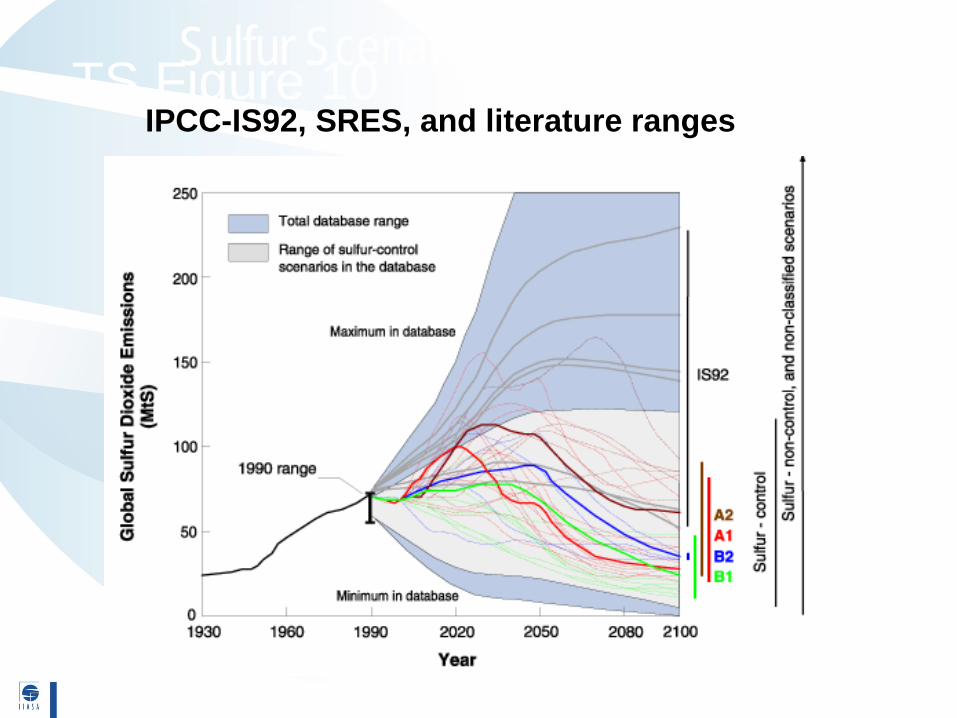
TS Figure 10Sulfur Scenarios from 1990sIPCC-IS92, SRES, and literature ranges

Representative Concentration Pathway (RCP)• First attempt by IAMs to provide trajectories
of a set of pollutants in addition to GHGs • Developed with consultation with climate
modelers• Resulted in 4 sets of air pollutant trajectories
based on pre defined radiative forcing levels.• Synchronized base year inventories• No attempt to harmonize assumptions on air
pollution control
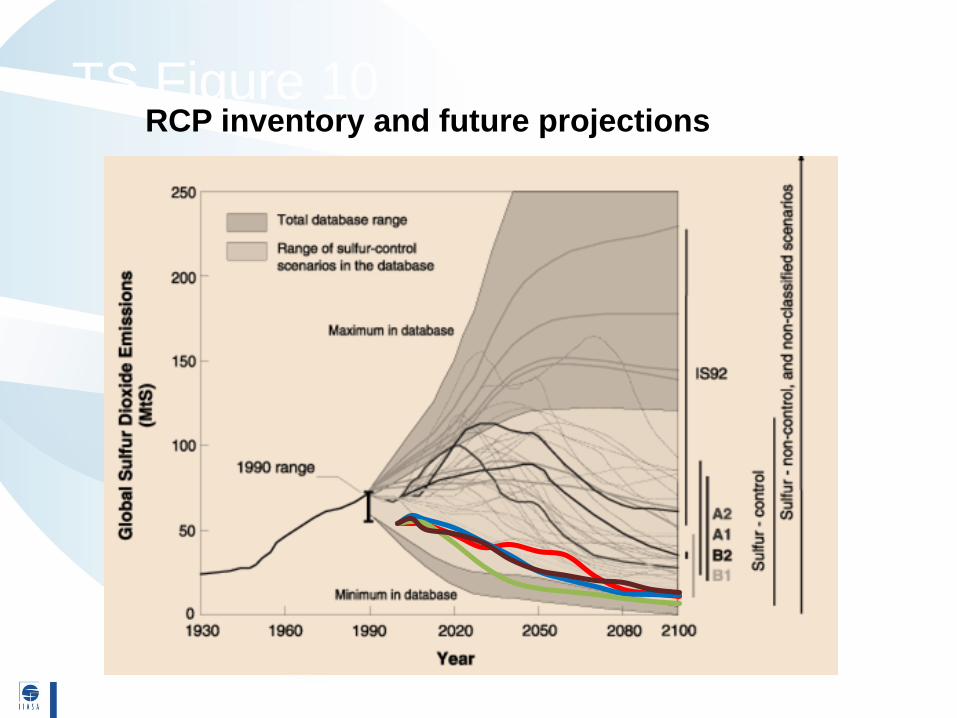
TS Figure 10RCP inventory and future projections

0.0001
0.001
0.01
0.1
1900 1920 1940 1960 1980 2000 2020 2040 2060 2080 2100
BC to
Car
bon
Ratio
OECD
REF
ASIA
MAF
LAC
WORLD
AIM - RCP 6.0
MiniCAM - RCP 4.5
IMAGE - RCP3-PD (2.6)
MESSAGE - RCP 8.5
0
0.02
0.04
0.06
0.08
0.1
0.12
1900 1920 1940 1960 1980 2000 2020 2040 2060 2080 2100
Sulfu
r to
Carb
on R
atio OECD
REF
ASIA
MAF
LAC
WORLD
AIM - RCP 6.0
MiniCAM - RCP 4.5
IMAGE - RCP3-PD (2.6)
MESSAGE - RCP 8.5
Improvements continue in the RCPsSulfur to Carbon Ratio1900-2100
BC to Carbon Ratio1900-2100
Climate PolicyCCS!
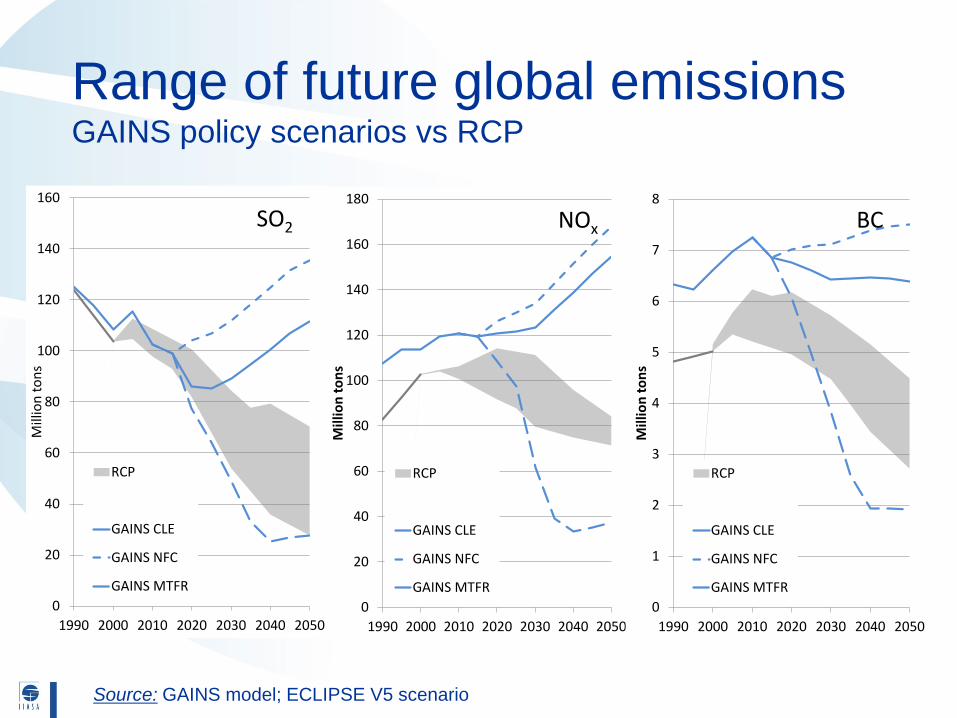
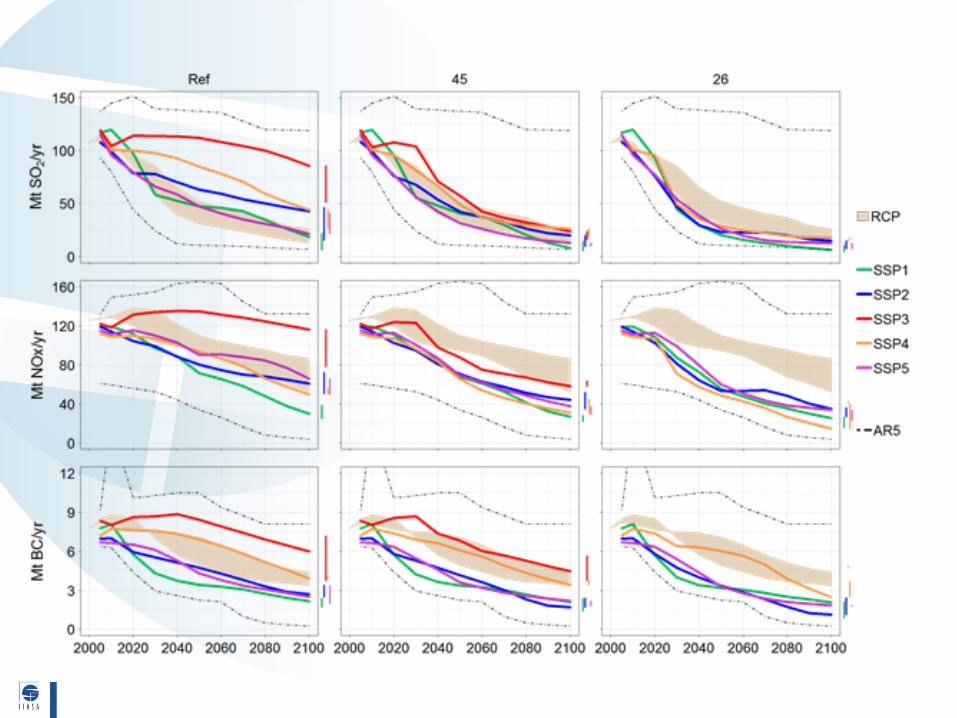
Range of future global emissionsGAINS policy scenarios vs RCP
0
20
40
60
80
100
120
140
160
1990 2000 2010 2020 2030 2040 2050
Mill
ion
tons
RCP
GAINS CLE
GAINS NFC
GAINS MTFR
SO2
0
20
40
60
80
100
120
140
160
180
1990 2000 2010 2020 2030 2040 2050
Mill
ion
tons
RCP
GAINS CLE
GAINS NFC
GAINS MTFR
NOx
0
1
2
3
4
5
6
7
8
1990 2000 2010 2020 2030 2040 2050M
illio
n to
ns
RCP
GAINS CLE
GAINS NFC
GAINS MTFR
BC
Source: GAINS model; ECLIPSE V5 scenario
Other Examples
• Global Energy Assessment• PEGASOS (Pan-European Gas-Aerosol-Climate
Interaction Study)• West, J.J., et al., Co-benefits of mitigating global
greenhouse gas emissions for future air quality and human health. Nature Clim. Change, 2013. 3(10): p. 885-889.
• Chuwah, C. and T.v.V. van Noije, Detlef P.; Hazeleger, Wilco; Strunk, Achim; Deetman, Sebastiaan; Beltran, Angelica Mendoza; van Vliet, Jasper, Atmospheric Environment. 2013. 79: p. 787-801
• ..

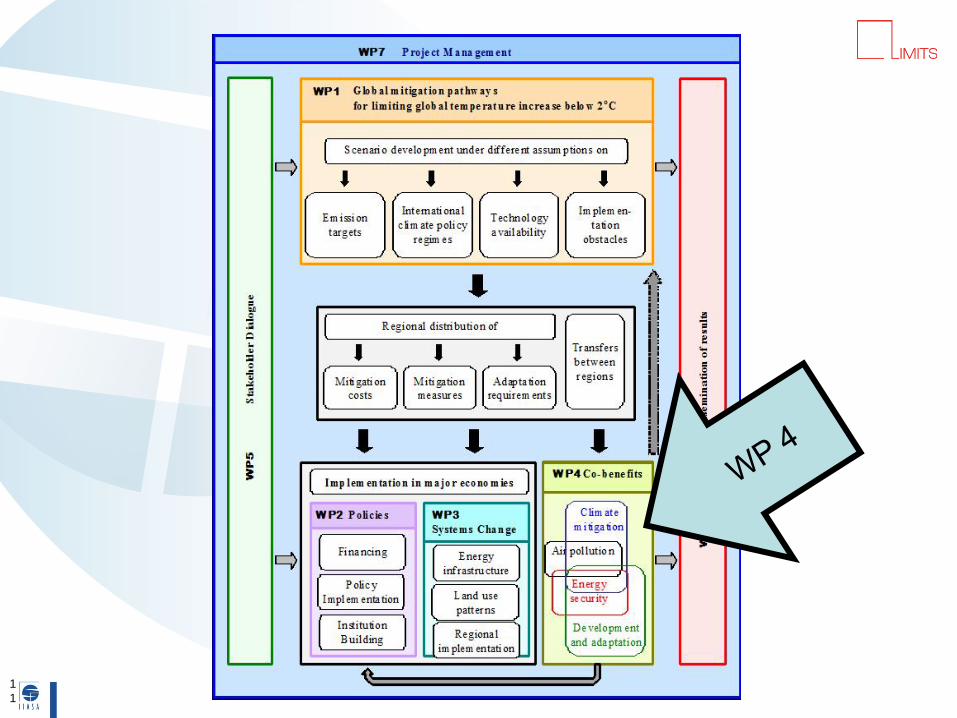
First International Model Comparison onClimate-Air Pollution-Energy Security LINKAGES
Institution Model
FEEM, Italy WITCH
ERI, China IPAC
PIK, Germany ReMIND
ECN, Netherlands TIAM-ECN
IIM, India GCAM, Markal
PBL, Netherlands IMAGE
PNNL, US GCAM
IIASA, Austria MESSAGE
JRC, EU FASST
11
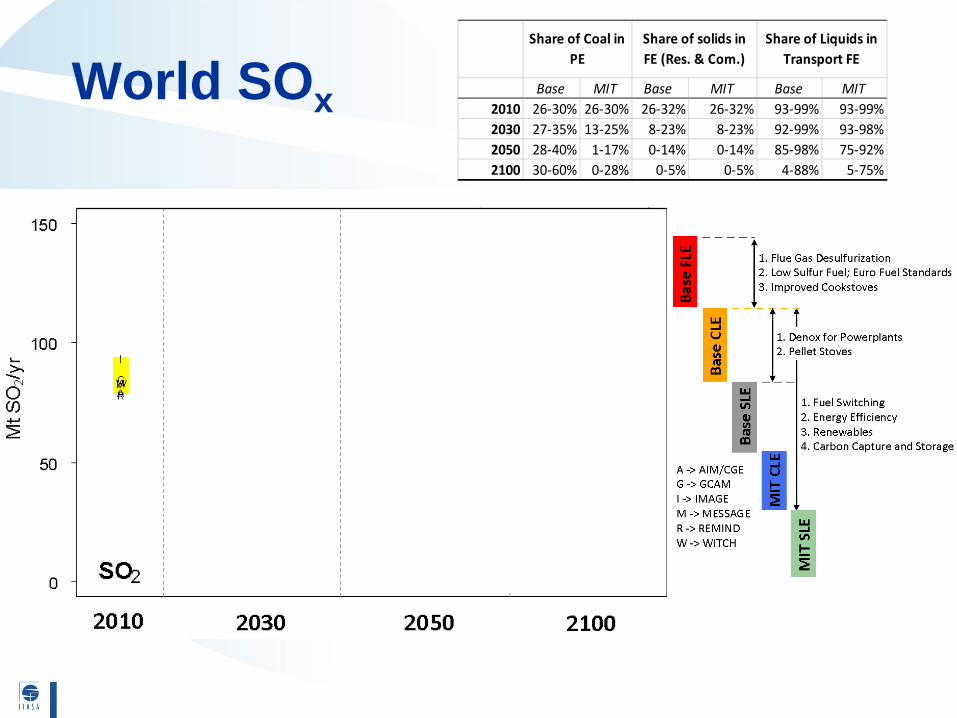
World SOx Base MIT Base MIT Base MIT2010 26-30% 26-30% 26-32% 26-32% 93-99% 93-99%2030 27-35% 13-25% 8-23% 8-23% 92-99% 93-98%2050 28-40% 1-17% 0-14% 0-14% 85-98% 75-92%2100 30-60% 0-28% 0-5% 0-5% 4-88% 5-75%
Share of Coal in PE
Share of solids in FE (Res. & Com.)
Share of Liquids in Transport FE
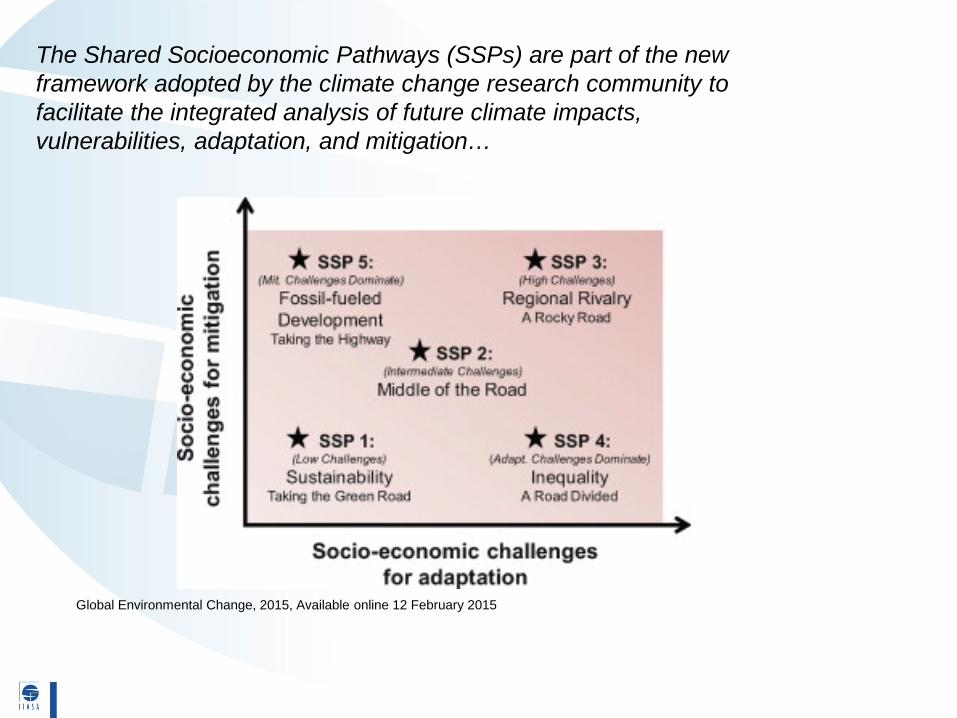
The Shared Socioeconomic Pathways (SSPs) are part of the new framework adopted by the climate change research community to facilitate the integrated analysis of future climate impacts, vulnerabilities, adaptation, and mitigation…
Global Environmental Change, 2015, Available online 12 February 2015
Create a set of consistent qualitative and quantitative storylines for pollution in the future that reflect our current understanding of how pollution has evolved so far historically and the possible directions it could take in the future.
• Pollution is increasingly a concern all over the world
• Legislations increased in many developing countries and emission declines happening at lower income levels than before
• Compliance and enforcement remains a problem.
• The actual outcomes in terms of pollution will r critically depend on energy demand, access to energy and a number of other policies.
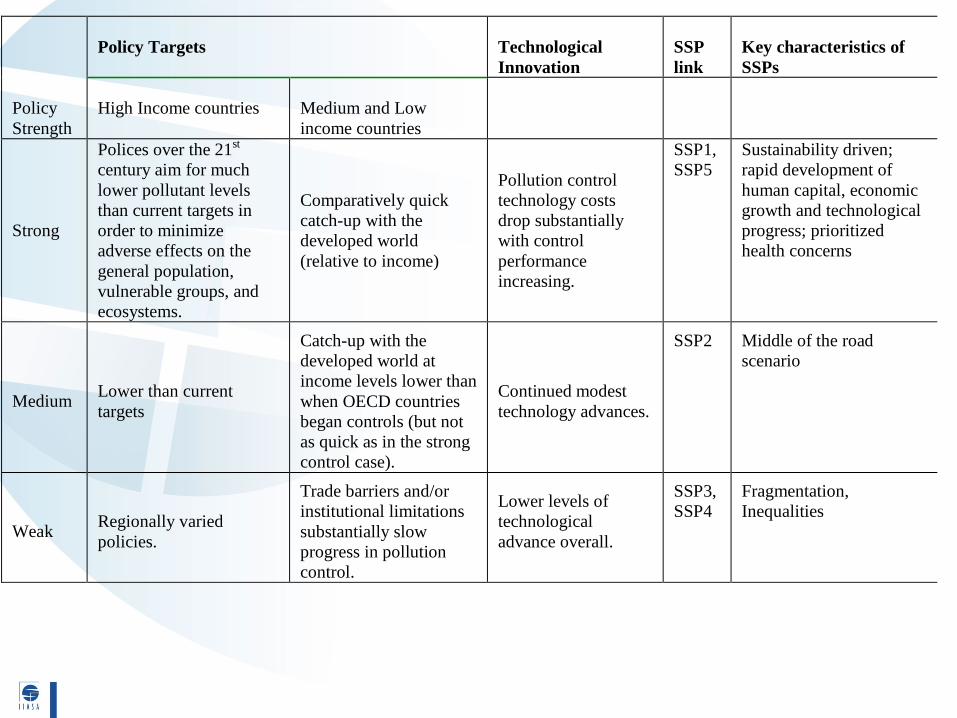
Policy Targets Technological Innovation
SSP link
Key characteristics of SSPs
Policy Strength
High Income countries Medium and Low income countries
Strong
Polices over the 21st century aim for much lower pollutant levels than current targets in order to minimize adverse effects on the general population, vulnerable groups, and ecosystems.
Comparatively quick catch-up with the developed world (relative to income)
Pollution control technology costs drop substantially with control performance increasing.
SSP1, SSP5
Sustainability driven; rapid development of human capital, economic growth and technological progress; prioritized health concerns
Medium Lower than current targets
Catch-up with the developed world at income levels lower than when OECD countries began controls (but not as quick as in the strong control case).
Continued modest technology advances.
SSP2 Middle of the road scenario
Weak Regionally varied policies.
Trade barriers and/or institutional limitations substantially slow progress in pollution control.
Lower levels of technological advance overall.
SSP3, SSP4
Fragmentation, Inequalities

Level of ambitionSpeed and Effectiveness of Control
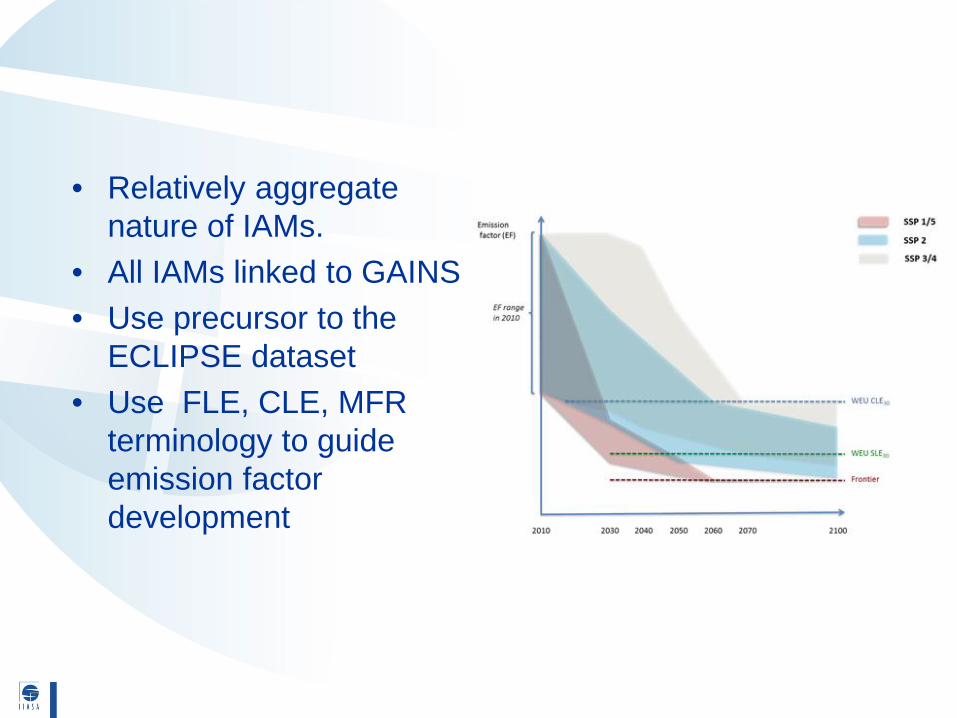
• Relatively aggregate nature of IAMs.
• All IAMs linked to GAINS• Use precursor to the
ECLIPSE dataset• Use FLE, CLE, MFR
terminology to guide emission factor development


Thank you!


