AIRE 2 project 4.7 - Green Connections SJU/LC/0149 - Phase 2 report Document information Project title Green Connections Project N° AIRE 2 project 4.7 Green Connections Project Manager LFV- Gunnar Olsson Deliverable Name D2 Deliverable ID D2-00-01 Edition 00.01.00 Please complete the advanced properties of the document Abstract This document is the final project report for AIRE Green Connection project.
Transcript
AIRE 2 project 4.7 - Green Connections
SJU/LC/0149 - Phase 2 report
Document information
Project title Green Connections
Project N° AIRE 2 project 4.7 Green Connections
Project Manager LFV- Gunnar Olsson
Deliverable Name D2
Deliverable ID D2-00-01
Edition 00.01.00
Please complete the advanced properties of the document
Abstract
This document is the final project report for AIRE Green Connection project.
00.00.10
2 of 85
Authoring & Approval
Prepared By
Name & company Position / Title Date
Gunnar Olsson / LFV Project Manager 25/05/2012
Patrick Manzi/LFV 25/05/2012
Reviewed By
Name & company Position / Title Date
Patrick Manzi/LFV 26/06/2012
Gunnar Olsson/LFV 26/06/2012
Lars Rappich/LFV 26/06/2012
Joel Klooster/GE 26/06/2012
Joachim Hochwarth/GE 26/06/2012
Susanne Rundström/Swedavia 26/06/2012
Lilia Agvald/Swedavia 26/06/2012
Peter Larsson/SAS 26/06/2012
Eric Thomas/Rockwell Collins France 26/06/2012
Caroline Constantinople/ Rockwell Collins France
26/06/2012
Approved By
Name & company Position / Title Date
Patrick Manzi/LFV 26/06/2012
Gunnar Olsson/LFV 26/06/2012
Lars Rappich/LFV 26/06/2012
Joel Klooster/GE 26/06/2012
Joachim Hochwarth/GE 26/06/2012
Susanne Rundström/Swedavia 26/06/2012
Lilia Agvald/Swedavia 26/06/2012
Peter Larsson/SAS 26/06/2012
Eric Thomas/Rockwell Collins France 26/06/2012
Caroline Constantinople/ Rockwell Collins France
26/06/2012
Document History
Edition Date Status Author Justification
00.00.10 2012-05-25 First release version
GC Members Release to SJU for feedback.
01.00.00 2012-06-27 Final delivery
GC Members Final revision of document reflecting the comments received from SJU.
3.5 PREPARATIONS FOR TRIAL EXECUTION ................................................................................................ 30 3.5.1 OMA –Operational Instruction for Controllers ........................................................................ 30 3.5.2 Briefing with controllers ............................................................................................................. 30 3.5.3 Briefing with pilots ...................................................................................................................... 30
3.6 SYSTEMS AND TOOLS ........................................................................................................................... 31
4.1 DIFFERENCE BETWEEN CONVENTIONAL ILS AND RNP-AR ................................................................ 32 4.2 RNP-AR REQUIREMENTS .................................................................................................................... 33 4.3 RNP-AR IMPLEMENTATION PROCESS – FROM A FIRST IDEA TO A PUBLISHED PROCEDURE .............. 33
5.1 GOT- ARN – GATE TO GATE VALIDATION ............................................................................................ 38
00.00.10
4 of 85
5.1.1 ATM handling of trial .................................................................................................................. 38 5.1.2 Airspace User handling of trial ................................................................................................. 45
8.1 RNP PROCEDURE ................................................................................................................................ 70 8.1.1 Permanent implementation of RNP Procedure ..................................................................... 70 8.1.2 Airspace users of procedure..................................................................................................... 70 8.1.3 Design and implementation of procedure to RWY26 from HMR ........................................ 70
8.2 IMPLEMENTATION OF IMPROVED DATA FOR FLIGHT PLANNING ............................................................ 70 8.3 IMPLEMENTATION OF 4DT DATA ........................................................................................................... 70 8.4 CITY PAIR OPTIMIZATION ...................................................................................................................... 71
9 CONCLUSIONS AND RECOMMENDATIONS .................................................................................... 73
9.1.1 Environmental impact ................................................................................................................ 73 9.1.2 ATC experience from RNP-AR operations ............................................................................. 74 9.1.3 4DT and Flight planning ............................................................................................................ 76 9.1.4 Gate to Gate operations ............................................................................................................ 76
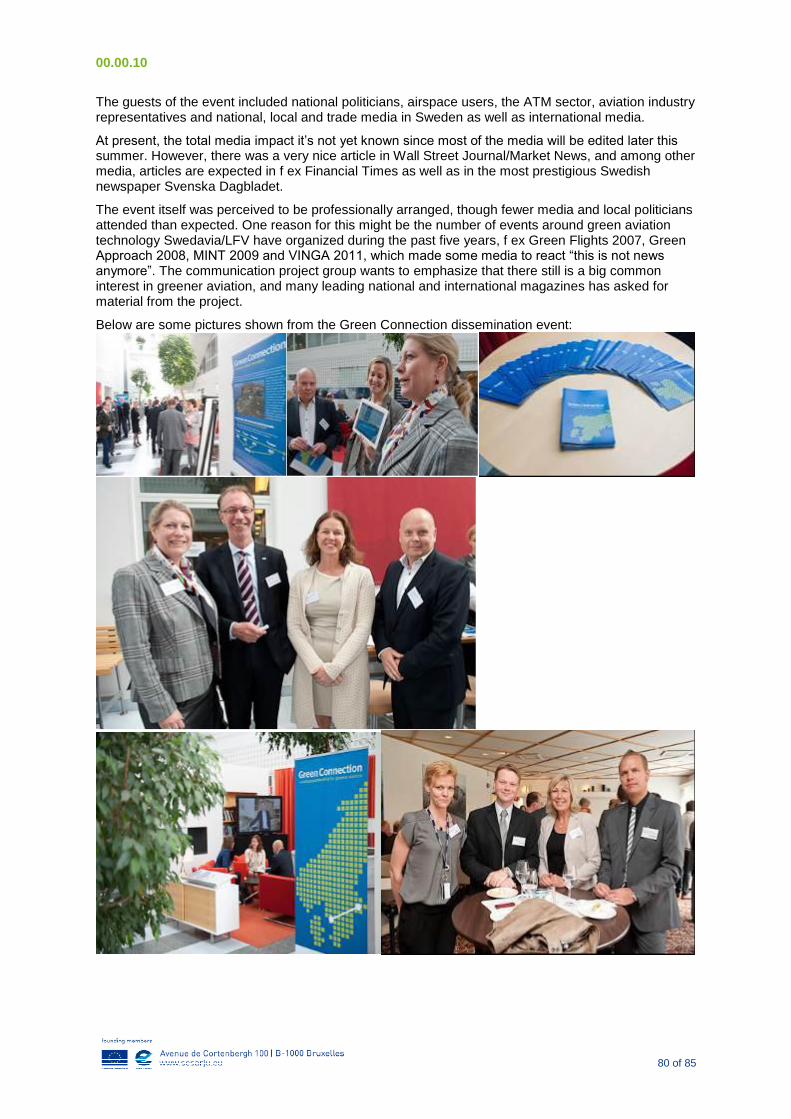
10 COMMUNICATION AND DISSEMINATION EVENT ....................................................................... 79
10.1 COMMUNICATION STRATEGY ................................................................................................................ 79 10.2 GREEN CONNECTION EVENT ................................................................................................................ 79 10.3 OTHER CHANNELS OF COMMUNICATION .............................................................................................. 82
11 FINAL WORD ......................................................................................................................................... 83
APPENDIX 1. DETAILED DESCRIPTION OF FUEL BURN ANALYSIS AND RESULTS ............. 85
APPENDIX 2. COMMUNICATION AND DISSEMINATION MATERIAL ............................................ 86
00.00.10
5 of 85
List of figures
Figure 1 Graphic description of gate to gate flights .............................................................................. 13 Figure 2 Graphic description of 75 "other" flights via RNP-AR approach ............................................. 14 Figure 3 Project overall Gantt chart with main milestones .................................................................... 17 Figure 4 SAS Delta Burn Arrival depiction ............................................................................................ 18 Figure 5 Delta Burn Arrival - further information ................................................................................... 19 Figure 6: RC's SBT Overall Process Description .................................................................................. 20 Figure 7 Example of ACARS trajectory broadcast ................................................................................ 22 Figure 8 Example of GE’s PBTM generated trajectory ......................................................................... 23 Figure 9 Example of Radar plots records ............................................................................................. 23 Figure 10: Example of Time Conformance Monitoring "box and whiskers" graph ............................... 24 Figure 11: Example of Time Stability Monitoring graph ........................................................................ 24 Figure 12: Example of Geometric Conformance Monitoring "box and whiskers" graph ....................... 25 Figure 13 Predicted and actually flown trajectory ................................................................................. 25 Figure 14: "Google Earth"-based Illustration ......................................................................................... 26 Figure 15 PBTM GUI ............................................................................................................................. 27 Figure 16 Data Flow in the FPPD ......................................................................................................... 27 Figure 17 Predicted 4DT of the SAS ESGGESSA10 Company Route with the ELTOK1H STAR into
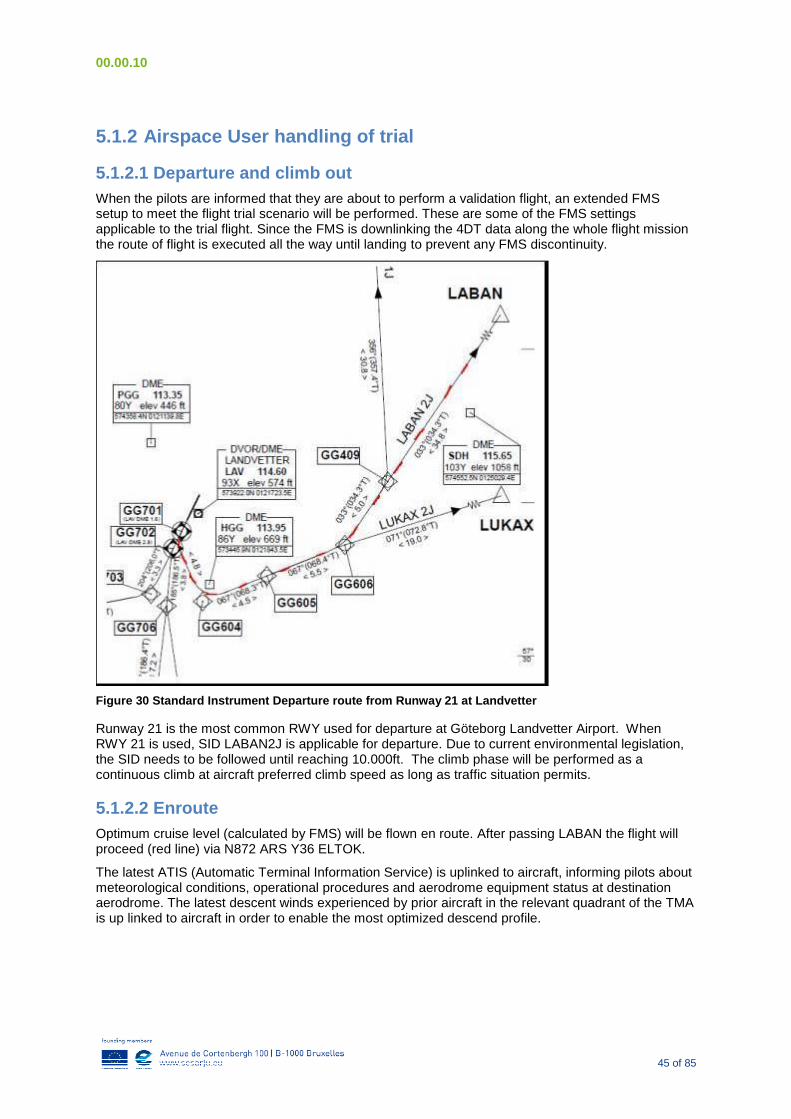
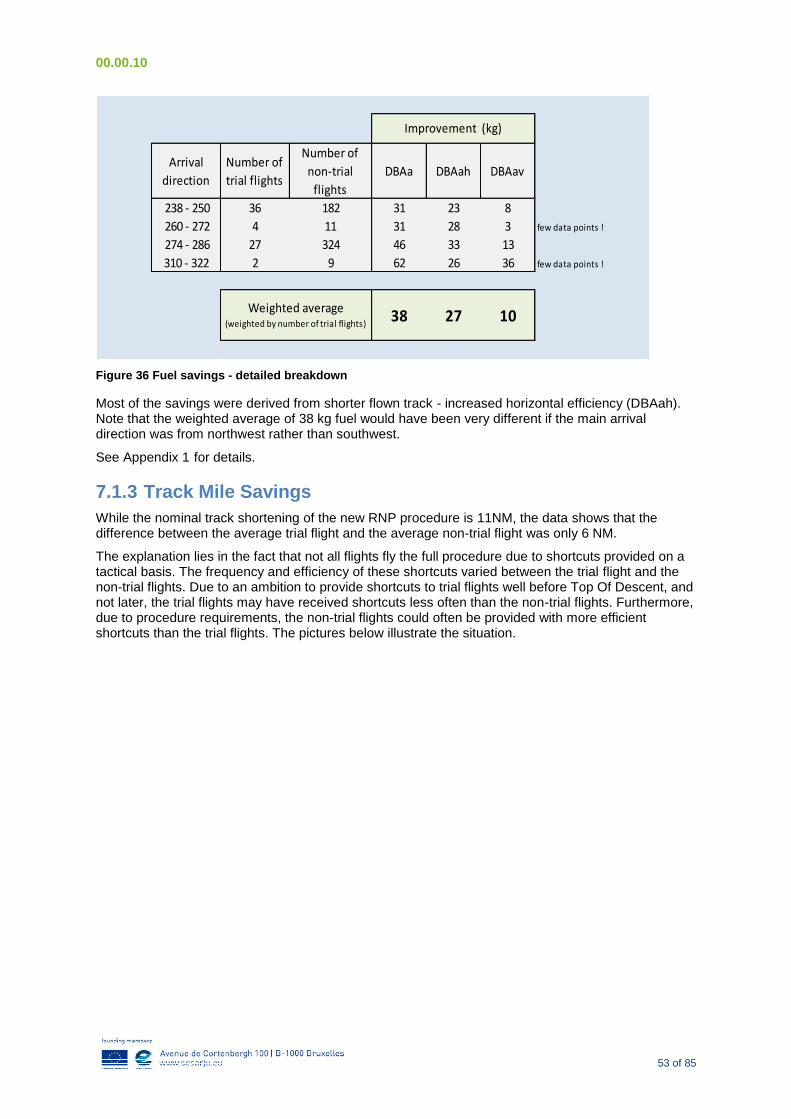
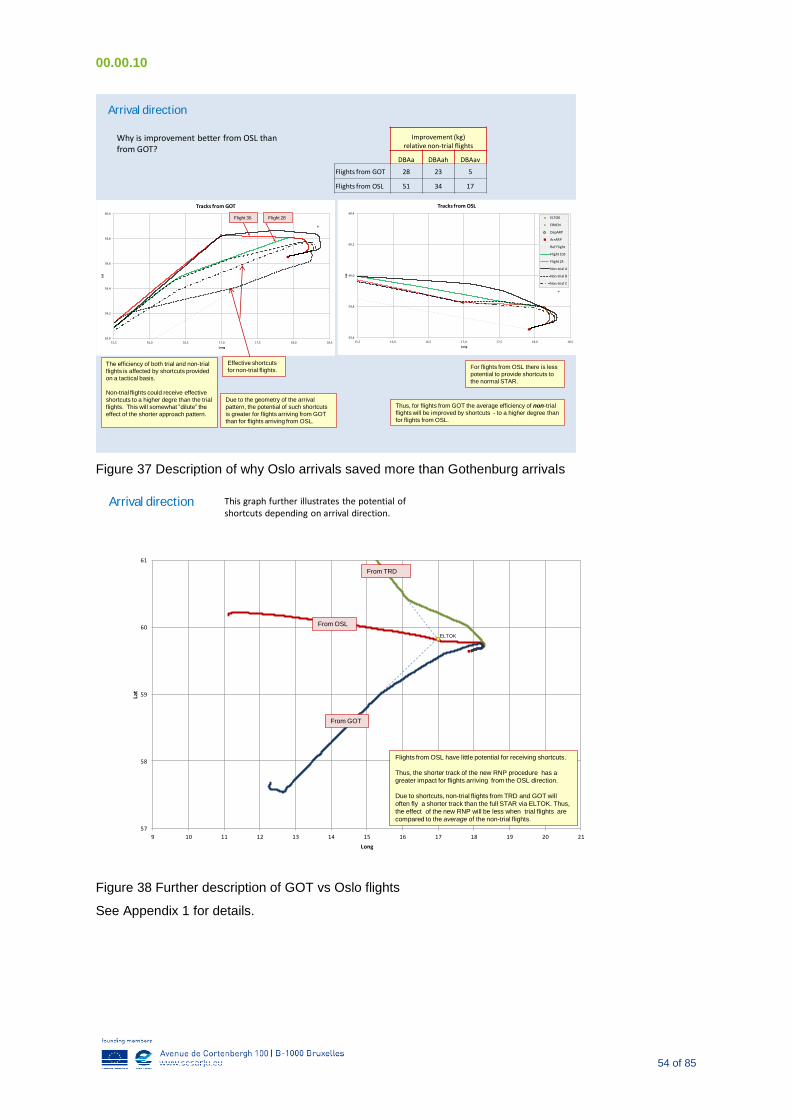
ESSA.............................................................................................................................................. 29 Figure 18 Schedule/Aircraft/Flight Plan Input Data ............................................................................... 30 Figure 19 Performance Input Data ........................................................................................................ 30 Figure 20 PBN Implementation - Airspace Concept - Ref. [2] .............................................................. 32 Figure 21 Navaid specification Ref. [2] ................................................................................................. 32 Figure 22 RNP-AR RF Leg description Ref. [1] .................................................................................... 33 Figure 23 Initial pre-design of RNP procedure...................................................................................... 34 Figure 24 Initial detail design of procedure with 300 deg go-around procedure................................... 35 Figure 25 Final design of RNP-AR approach procedure with map in background ............................... 36 Figure 26 AIP chart of final design of RNP-AR approach procedure ................................................... 37 Figure 27 Graphic description of gate to gate flights ............................................................................ 38 Figure 28 A Green Connection Flight - from gate to gate ..................................................................... 39 Figure 29 Test Leader log used during Green Connection Trials ......................................................... 44 Figure 30 Standard Instrument Departure route from Runway 21 at Landvetter ................................. 45 Figure 31 en-route chart showing Green Connection flight's route between Gothenburg and
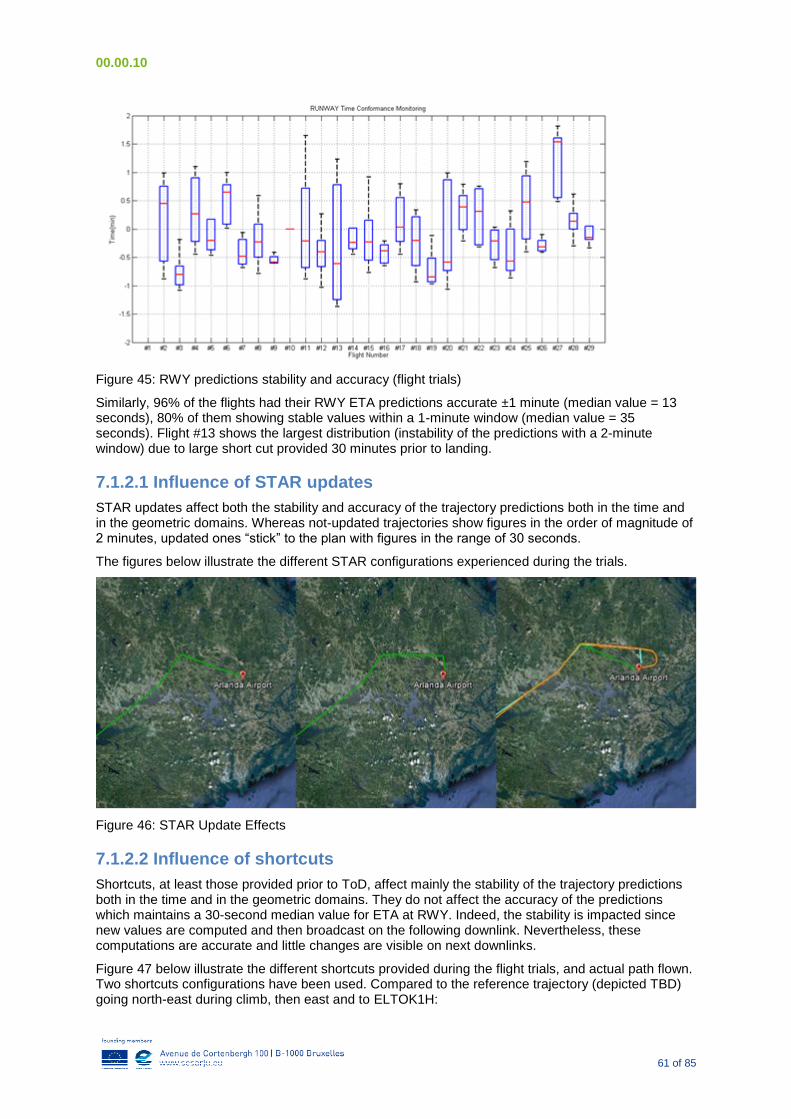
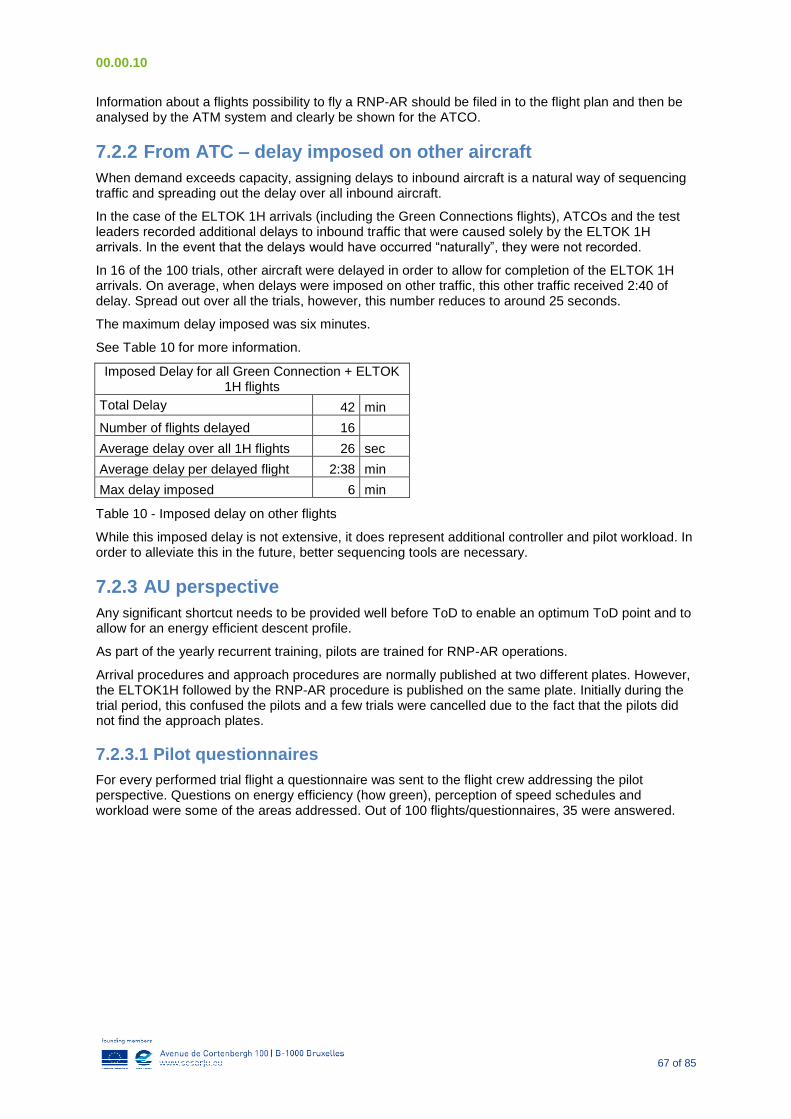
Stockholm ...................................................................................................................................... 46 Figure 32 Possible shortcuts from en-route to the terminal area .......................................................... 46 Figure 33 Final design of RNP-AR Arrival to Runway 26 ..................................................................... 47 Figure 34 Graphic description of 75 "other" flights via RNP-AR approach ........................................... 47 Figure 35 Fuel savings on gate to gate trials ........................................................................................ 52 Figure 36 Fuel savings - detailed breakdown ....................................................................................... 53 Figure 37 Description of why Oslo arrivals saved more than Gothenburg arrivals ............................... 54 Figure 38 Further description of GOT vs Oslo flights ........................................................................... 54 Figure 39: Typical Time Conformance Monitoring graph (flight trial) .................................................... 57 Figure 40: Typical Time Conformance Monitoring graph (PBTM predictions) ...................................... 57 Figure 41: Typical Geometric Conformance Monitoring graph (flight trials) ......................................... 59 Figure 42: Typical Geometric Conformance Monitoring graph (PBTM simulation) .............................. 59 Figure 43: Typical Time Stability Monitoring graph (flight trial) ............................................................. 60 Figure 44: ToD predictions stability and accuracy (flight trials) ............................................................ 60 Figure 45: RWY predictions stability and accuracy (flight trials) ........................................................... 61 Figure 46: STAR Update Effects ........................................................................................................... 61 Figure 47: Shortcuts: trajectories generated (green), actual path flown (orange) ................................ 62 Figure 48 AMAN Horizon including short haul airports ......................................................................... 72
List of tables
Table 1 Acronyms used in this report ................................................................................................... 12 Table 2 Description to pilots - Green Connection flow chart ................................................................. 31 Table 3 GOT-ARN pictorial description ................................................................................................. 39
00.00.10
6 of 85
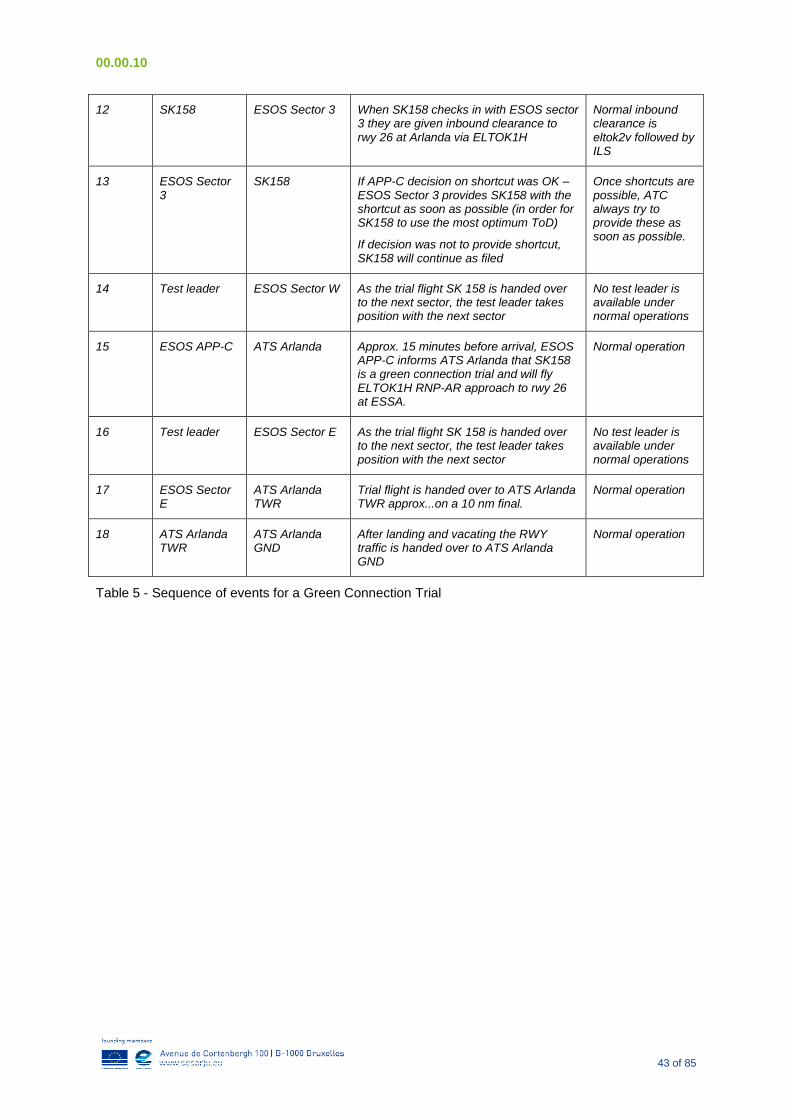
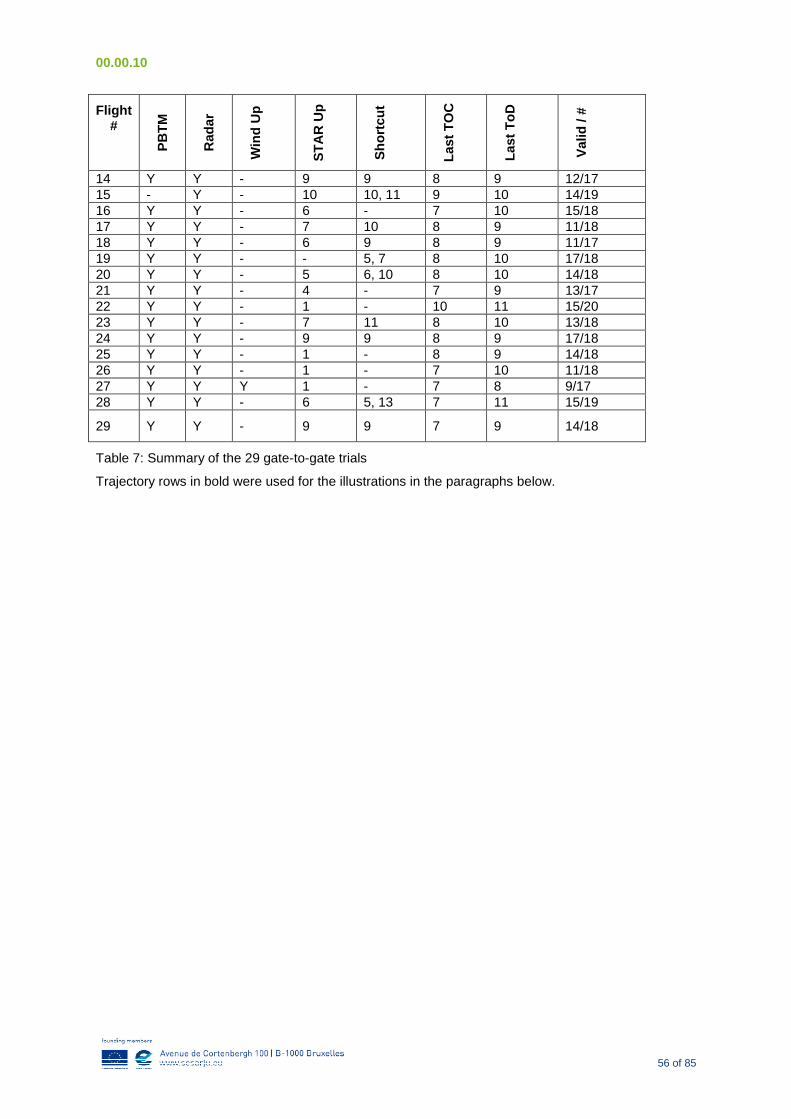
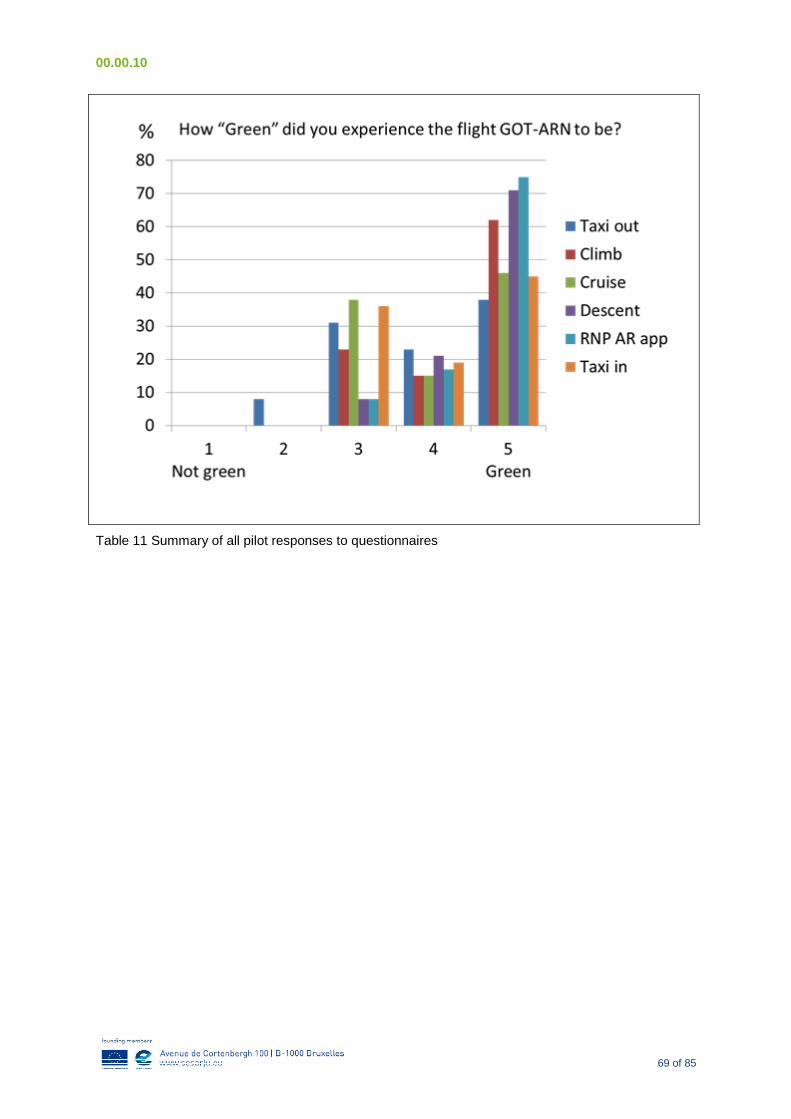
Table 4 ATM Actors involved in Gate to Gate trial ................................................................................ 41 Table 5 - Sequence of events for a Green Connection Trial ................................................................ 43 Table 6 Pictorial description of "validation" flights ................................................................................. 47 Table 7: Summary of the 29 gate-to-gate trials..................................................................................... 56 Table 8 PBTM predictions over time ..................................................................................................... 58 Table 9 Gate to Gate KPI values .......................................................................................................... 63 Table 10 - Imposed delay on other flights ............................................................................................. 67 Table 11 Summary of all pilot responses to questionnaires ................................................................. 69
00.00.10
7 of 85
Executive summary
Within the scope of the AIRE sponsored project known as Green Connection, 100 flight trials were successfully carried out with SAS Boeing 737 New Generation aircraft. 29 of these trials were full gate to gate trials between Göteborg Landvetter Airport and Stockholm Arlanda Airport.
In preparation for these trials, a new arrival procedure was created based on RNP-AR technology from the western entry point to the Stockholm Terminal Manoeuvring Area to the most commonly used runway at Stockholm Arlanda Airport. This approach procedure results in track mile savings of 11 NM compared to the currently implemented P-RNAV procedure and circumnavigates noise sensitive areas north of Stockholm Arlanda Airport.
A detailed analysis of the savings has shown that on average, Green Connection gate to gate flights between Landvetter and Arlanda saved 28 kg of fuel compared to baseline flights. This corresponds to a savings of approximately 1.5% of the overall fuel burned on these flights. RNP flights originating from Oslo Gardermoen Airport saved on average 51 kg of fuel corresponding to 2.7% of the overall fuel burned on these flights.
As part of Green Connection, a study into flight planning data and trajectory accuracy and stability took place.
Based on 29 gate-to-gate flights, statistics with all different cases generated by trials configurations, the Shared Business Trajectory allowed the project to get accuracy and stability figures for the downlinked 4D trajectory predictions. It appears these predictions are very accurate both in the time and the geometric domains (in the order of 10 seconds and fractions of nautical miles) provided correct information (STAR, shortcuts) is provided as early as possible. The Preferred Business Trajectory Manger, PBTM predictions also show accurate and stable figures both in the time and in the geometric domains (on the order of 2 minutes and 2 nautical miles) even a month prior to take-off provided the take-off time is correct.
The direct result of the project is that the RNP AR approach procedure is now permanently implemented for all certified airlines to use during pertinent traffic situations. Recommendations regarding flight planning and trajectory information will be communicated to relevant SESAR projects for further development.
00.00.10
8 of 85
1 Introduction
1.1 Scope
The Green Connections project is focused on the improvement of Air Traffic Management through existing and widespread technology that is not fully used today. Green Connections allows for a reduction of track miles by implementing an RNP-AR approach from the west entry point into Stockholm Arlanda Airport.
Green Connections flights have validated various concept elements of the SESAR Master Plan including the business trajectory cycle, Performance Based Navigation (PBN) and datalink communication.
Green Connections flights have featured datalink communications with the aircraft for delivering departure clearance and information exchange. Green Connections aircraft flew a continuous climb departure with free speed during climb, after the aircraft had passed 2000 ft. When it was possible, aircraft received direct routing to a point in the Stockholm terminal area. Continuous Descent Arrivals from the aircraft’s Top of Descent were then executed.
In the Stockholm terminal area, aircraft flew the newly designed RNP approach procedure to Stockholm Arlanda Airport’s Runway 26. This procedure reduces the flown distance by approximately 11 NM compared to today’s shortest published P-RNAV-STAR arrival with ILS approach. The resultant fuel savings when comparing with baseline traffic were shown to be 38 kg of fuel and a CO2
reduction of 120 kg.
During the entire flight mission, Green Connection flights transmitted their FMS predicted trajectory data to ground via datalink. This trajectory was compared to the actual trajectory flown.
100 flights trials were performed during the timeframe of the Green Connection project. 25 trial flights were full gate to gate trials from Göteborg Landvetter Airport to Stockholm Arlanda Airport.
75 trials flight were carried out from cruise altitude to Runway 26 via the curved RNP-AR approach that was developed as part of the project. These results were analysed and compared to data from hundreds of comparable flights (from the same direction and to the same RWY) in order to provide baseline data for the quantification of benefits.
The overall intention, when starting the project, was that the approach procedure that has been developed as part of Green Connection would be fully implemented and operational post Green Connection. The RNP AR approach procedure is now permanently implemented and open for all certified airlines to use during pertinent traffic situations.
1.2 Purpose of the document
This document is the Phase 2 (final) delivery of Green Connection, addressing the project progress, results and recommendation for future implementation.
1.3 Intended readership
This document is intended for the SESAR programme and the AIRE programme.
1.4 Background
The European Commission (EC) and the US Federal Aviation Administration (FAA) signed a cooperative agreement establishing the Atlantic Interoperability Initiative to Reduce Emissions (AIRE) in June 2007. AIRE is part of SESAR and NextGen efforts to hasten environmental improvements. The SJU is responsible for its management from a European perspective.
AIRE aims to improve energy efficiency, lower aircraft noise, and enhance ATM interoperability through the acceleration of the development and implementation of environmentally friendly procedures for all phases of flight (gate-to-gate), and the validation of continuous improvements with trials and demonstrations.
00.00.10
9 of 85
AIRE has a close link with some SESAR projects and the lessons learned from the first trial period and the best practices should be integrated in the SESAR work programme.
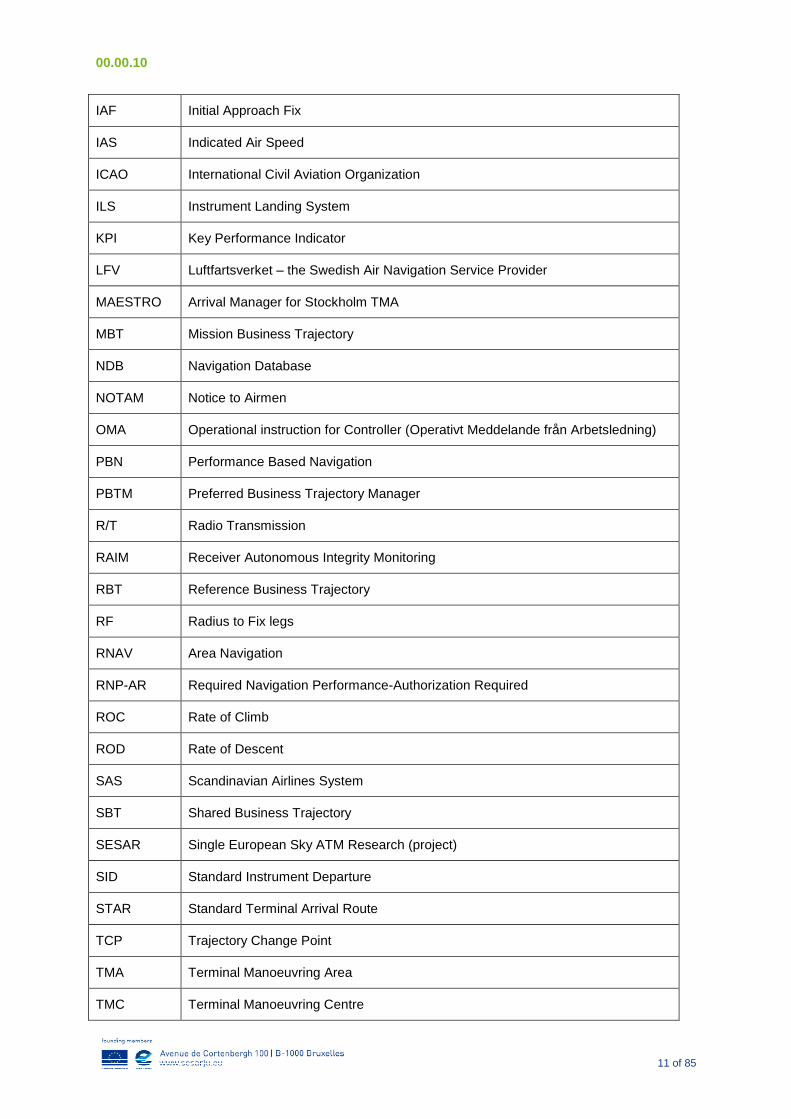
1.5 Acronyms and Terminology
Acronym Definition
4DT Four Dimensional Trajectory
ACARS Airline communication addressing and reporting system
ACC Area Control Centre
ADD Aircraft Derived Data
AEDT Aviation Environmental Design Tool
AGC AIRE Green Connections
AIP Aeronautical Information Publication
AIRE Atlantic Interoperability Initiative to Reduce Emissions
AMAN Arrival Manager
AOC Airline Operations Center
API Application Programming Interface
APP-C Approach Coordinator
ARINC Aeronautical Radio, Incorporated
ARP Aerodrome Reference Point
ATC Air Traffic Control
ATCC Air Traffic Control Centre
ATCO Air Traffic Control Officer
ATIS Automatic Terminal Information Service
ATM Air Traffic Management
ATN Aeronautical Telecommunication System
ATS Air Traffic Service
AU Airspace User
CAA Civil Aviation Authority
CCD Continuous Climb Departure
00.00.10
10 of 85
CDA Continuous Descent Arrival
CDO Continuous Descent Operations
CIES Common Information Exchange Server
CTO Controlled Time Over
DBA Delta Burn Arrival
DBD Delta Burn Departure
DMAN Departure Manager
EFMA ICAO Airport Code for Mariehamn Airport
EGCC ICAO Airport Code for Manchester Airport
EGPH ICAO Airport Code for Edinburgh Airport
EIDW ICAO Airport Code for Dublin International Airport
ENBR ICAO Airport Code for Bergen Flesland Airport
ENGM ICAO Airport Code for Oslo Gardermoen Airport
ENVA ICAO Airport Code for Trondheim Airport
ESGG ICAO Airport Code for Göteborg Landvetter Airport
ESSA ICAO Airport Code for Stockholm Arlanda Airport
ESSB ICAO Airport Code for Stockholm Bromma Airport
ESSD ICAO Airport Code for Borlänge Airport
ESSV Visby Airport
ETA Estimated Time of Arrival
FAA Federal Aviation Administration
FDR Flight Data Recorder
FFS Full Flight Simulator
FMC Flight Management Computer
FMS Flight Management System
FPM Flight Plan Management
FPPD Flight Plan Prediction Driver
GC Green Connection
GUI Graphical User Interface
00.00.10
11 of 85
IAF Initial Approach Fix
IAS Indicated Air Speed
ICAO International Civil Aviation Organization
ILS Instrument Landing System
KPI Key Performance Indicator
LFV Luftfartsverket – the Swedish Air Navigation Service Provider
MAESTRO Arrival Manager for Stockholm TMA
MBT Mission Business Trajectory
NDB Navigation Database
NOTAM Notice to Airmen
OMA Operational instruction for Controller (Operativt Meddelande från Arbetsledning)
The SESAR Joint Undertaking (SESAR JU) has been managing the AIRE programme since 2008 by means of collaborative contracts for projects involving one or more ANSPs, airlines and other ATM stakeholders.
AIRE initially focused in optimising oceanic operations, but has been extended to include all phases of flight. AIRE projects are structured through a validation plan organised around one or several ATM domains – surface, terminal and oceanic/en route operations and “gate-to- gate”. Within each domain, a given project envisages several specific operational areas where trials can be conducted to improve fuel and airspace usage, reduce CO2 emissions, and sometimes noise. It is envisaged that programme will continue in 2012/2013.
In July 2010, 18 projects involving 40 airlines, airports, ANSPs and industry partners were selected for the 2010/2011 cycle of the AIRE programme, in which surface, terminal, oceanic and gate-to-gate operations were tackled. AIRE Green Connection qualifies into the gate-to-gate category where all phases of flights are addressed.
2.2 Project objectives
The main objectives of the Green Connection project are to reduce the environmental impact of operation by utilizing modern procedures (CCD, CDA) and latest available technology (clearance, wind update and STAR uplinked via datalink). The list below indicates how Green Connection will achieve the reduction in environmental impact.
Reduce CO2 emissions by designing a lateral and vertical optimized arrival procedure (RNP-AR) to Stockholm Arlanda RWY 26.
Reduce noise exposure over sensitive areas by designing a lateral and vertical optimized arrival procedure (RNP-AR) to Stockholm Arlanda RWY 26.
Reduce fuel burn/costs for operators by designing a lateral and vertical optimized arrival procedure (RNP-AR) to Stockholm Arlanda RWY 26.
Reduce flight time for operators by optimum STAR design in TMA and by ATC providing shortcuts during the flight mission.
Use of datalink for extended communication between ATC and AU that provides flight crew with the most up to date meteorological information and terminal information which results in increased predictability for other ATM stakeholders.
4DT exercise will perform flight path conformance monitoring and trajectory stability analysis. This exercise will also be extended to include an analysis of the business trajectory cycle from an initial flight plan to the actual flown trajectory.
2.3 Validation setup
The 100 flight trials are defined in two categories:
1. Full gate to gate validations: 25
Gate to gate flights between Göteborg Landvetter Airport and Stockholm Arlanda Airport where every flight segment are validated.
Figure 1 Graphic description of gate to gate flights
00.00.10
14 of 85
2. Arrival in to Stockholm Arlanda Airport: 75
Arriving flights from the west entry TMA point into Stockholm Arlanda Airport are validated from ToD until landing.
Figure 2 Graphic description of 75 "other" flights via RNP-AR approach
2.4 The Green Connection Consortium
The Green Connection project is driven as a consortium involving LFV (consortium leader), Swedavia, SAS, Rockwell Collins France and General Electric (GE) Aviation Systems. Each partner is briefly presented below.
2.4.1 LFV:
The public enterprise, LFV is responsible for air navigation services in Sweden. LFV had sales of around SEK 2.5 billion during 2011 and reports results after financial entries of SEK 85 million. LFV employs over 1300 employees at two control centres, 34 towers and the headquarters in Norrköping.
LFV’s mission is to provide safe, efficient and environmentally sound air navigation services for civilian and military aviation. LFV also works to achieve transportation policy goals.
LFV carries out an active environmental work – through direct contributions in LFV’s own operations and indirectly by creating opportunities for our customers to lower their environmental impact. Working towards reduced energy usage, CO2 emissions and an increased use of renewable energy sources is ToDay a necessity from an economic perspective and for LFV to be an attractive partner and supplier.
LFV works to offer “Green Approaches” to those airports where LFV carries out air traffic control. A Green Approach means simply that the aircraft glides with an even descent profile from a high altitude to the airport with its engines at or near idle. This is commonly referred to as CDO – continuous descent operations. f
During 2011, 58% of approaches to Arlanda were CDO from 5000 ft. and 47% from 10,000 ft. At 11 other towers where LFV carries out operations, 66% of all approaches were CDO from 5000 ft. and 54% from 10,000 ft.
2.4.2 Swedavia:
Swedavia is a limited liability company encompassing 10 of Sweden’s most important airports. Swedavia is responsible for all airport infrastructures at the 10 main airports. This includes the infrastructure and services needed for aircraft to land and depart from an airport and load/unload its cargo and passengers. This infrastructure includes also a SID/STAR-system, RWYs and terminals that has been environmentally approved by a court. The service includes all administration necessary when an aircraft visits one of these airports. Swedavia is responsible for Ground Handling at the smaller regional airports and gives license for Ground Handling companies to serve at the two larger airports Stockholm Arlanda and Gothenburg Landvetter. In order to provide the above mentioned services Swedavia employs approximately 2 500 people.
00.00.10
15 of 85
2.4.3 Scandinavian Airlines, SAS:
SAS home market is the Nordic Region and in 2011 the SAS group flew 27 million passengers to 128 destinations. SAS participates as a consortia partner within the Green Connection project and view this project as an important part in its environmental work. One of SAS environmental targets is to reduce its total flight emissions by 20% 2015. SAS has a long experience in working with ATM, Air Traffic Management related challenges. SAS received 2008 ”Leadership in Technology award” for its work around establishing Green Approaches by the Airline Business magazine. SAS and LFV received Ecologistics Award 2008 for the same reason. SAS has earlier participated in several similar projects such as Cassis, NUP2+ and has a strong representation in several SESAR-project, IATA- and AEA forums.
SAS ambition with the Green Connection project is to demonstrate advantages with Green flights, prove environmental benefits for noise and emissions and accelerate implementation of RNP-approaches within its route network.
2.4.4 Rockwell Collins France, RCF
Rockwell Collins France (RCF) is a French electronic company of Rockwell Collins, Inc., and located in Toulouse-Blagnac since 1978. The RCF customer base includes European and US aircraft manufacturers, integrators and airlines, as well as French and foreign Ministries of Defence.
RCF is centre of Excellence for the development of airborne datalink communication systems which are more and more used for Air Traffic Management and Airlines Operations, including:
Airline communication addressing and reporting system (ACARS)
Aeronautical Telecommunication System (ATN)
Airline Operational Communication (AOC) applications
VHF datalink (VDL)
Advanced airborne datalink R&D (LDACS, AMACS…)
Advanced secure airborne servers and communication routers
In the midst of the information age, aircraft operators are looking for ways to extend their business information systems to their aircraft in order to provide greater customer service and improve operational efficiency. RCF is responsible for system and software development for:
CAIN (first certified I2S system for Lufthansa Condor)
FlySmart by Airbus system (airborne server mechanism hosting various types of Airbus and airline specific applications)
Various hosted maintenance applications
RCF has been a full partner in several European Community projects, including INTENT, NUP/NUP2+, Flysafe, MOWGLY, CASSIS and others.
2.4.5 General Electric Aviation Systems, GEAS:
GE Aviation Systems provides Flight Management Systems for a number of civil and military aircraft, including Airbus A319, A320, A330, and A340; all Boeing 737-300 through 737-900; and Ilyushin IL-96M/T. GE leads the world in airborne Required Time of Arrival (RTA) technology and has recently enhanced this leading position by improving the RTA functionality for our B737 FMS focusing on descent and arrival operations. The Boeing 737 FMS is also the only FMS that has been certified for RNP 0.1 operations. GE has extensive experience in conducting 4D Trajectory Based Operations flight trials, working with Scandinavian Airlines and LFV within the NUP2+, CASSIS, CASSIS II, and MINT programs leveraging the Required Time of Arrival and 4D Trajectory prediction and downlink capabilities in GE’s FMS.
GE remains heavily involved in ATM research and development; in policy-driving initiatives (such as JPDO NextGen), in European and USA government funded research initiatives, and in-service technology demonstrations. Our work in the EC’s AFAS, INTENT, AFMS, OPITIMAL, NUP2+, CASSIS and REACT programs as well as projects with NASA in the USA have emphasized the use
00.00.10
16 of 85
of advanced Flight Management Systems to enhance ATM. Four-D trajectory-based operations, RTA and enhanced, predictable guidance are on-going key areas of development. We are continuously improving our commercial FMS product to support precision navigation and trajectory-based ATM applications.
For the successful completion of the project GE Aviation will use expertise from both their FMS and ATM program teams. The team has expertise in the following areas:
Flight Plan Management and Optimization
Required Navigation Performance
Required Time of Arrival
4 Dimensional Trajectory Generation
Lateral and Vertical Navigation / Guidance
Air-Ground Trajectory Synchronization
2.5 Project progress
January 2010 – Project initiation
The initiative to the project Green Connection was made in January 2010. The high level objectives and concepts were elaborated during the spring of 2010 in collaboration with the other Green Connections partners as a result of the yearly AIRE call for tender.
After SJU acceptance, the project was officially launched in November 2010 with an original plan to deliver the project’s results in February 2012.
November 2010 – Pre validation activities commence
The pre validation activities started in November 2010. At this point, the first version of the RNP-AR approach procedure design to Stockholm Arlanda Runway 26 was finalized and tested in a full flight simulator, ready to be sent for approval by the Swedish Civil Aviation Authority in February of 2011.
Early 2011
The risk of not gaining approval from the local County Administrative Board and the Swedish Civil aviation authority for publishing and operating the RNP-AR procedure that was under design by the project was identified as the single most critical risk in the project management plan – PMP that was delivered in project phase 1 by the end of January 2011.
In parallel with the procedure design and implementation, other pre validation activities like preparing system tools for performing trajectory analysis and setting up the required infrastructure for the data exchange when collecting and analysing flight data result, progressed uninterrupted by external facts.
February 2011
In February 2011 an incident took place at Stockholm Arlanda Airport when an arriving aircraft performed a go around and a loss of separation occurred. The plane performing the missed approach turned left instead of following the published missed approach procedure of a right turn to heading 300 degrees and climbing to 1500ft. This aircraft lost separation to a departing aircraft from Arlanda.
This incident did not cause any accident but resulted in an investigation ordered by the Civil Aviation Authority. The investigation looked into the cause of incident and to proposed actions to prevent similar incidents in the future. The investigation recommended to redesign the missed approach segment to read straight ahead climbing to 1500ft.
At this time, the RNP-AR procedure developed by Green Connection had been submitted and was awaiting approval from the Swedish Civil Aviation Department (CAD). However, the incident and the investigation described above resulted in the procedure being redrawn to accommodate the new missed approach procedure
September, 2011
00.00.10
17 of 85
The newly designed procedure was approved by the CAD in September, 2011.
December 15, 2011
Following the AIRAC cycle the RNP-AR procedure was published on December 15th. This
was also the date when Green Connection performed the first validation flight.
December, 2011->April, 2012
Between December 15th 2011 and April 26
th 2012, 100 trail flights have been performed. The
validation results of these flights have been collected, analysed, illustrated and concluded in this report as well as presented during the dissemination event in Stockholm Arlanda May 11
th
2012.
February, 2012
Flight data are collected and analysed in parallel with on-going flight trials.
May 11th
2012
A project dissemination event was hosted at Stockholm where the audience was invited to actually fly the RNP-AR procedure themselves in the full flight simulators at Oxford Aviation Academy. During the lunch seminar, the project progress and initial findings were presented by the project.
May 31st
2012
The project is concluded and reported to SJU
Figure 3 Project overall Gantt chart with main milestones
00.00.10
18 of 85
3 Pre validation activities
3.1 PBN implementation
Since the PBN design and implementation activity constitutes a big part of the project efforts, experiences from this activity are exclusively covered under Chapter 4.
3.2 Preparations for measuring fuel and emission
SAS has a Fuel Management Information System, which is a database with a large number of fuel related parameters for performed flights. In connection with this project it was necessary to further develop the information gathered and the available analysis methods.
A number of automated analyses of B737 flight recorder data were developed within the frame of the project. Second-by-second data from each performed flight was used to calculate measures like taxi fuel used for departures and arrivals, Delta Burn Departure (DBD), Delta Burn Arrival (DBA), total ground and air distances, ground and air distances for departure and arrival, average climb and descent speeds, etc.
The DBD and DBA metrics proved to be most useful for measuring the efficiency of departures and arrivals. In summary, the DBD is a measure of the departure efficiency. Additional fuel burn of an actual flight is compared to the theoretically most efficient departure with this aircraft type under the given conditions. DBA is the equivalent measure of arrival efficiency. Both DBD and DBA are constructed in almost identical way. Below follows a more detailed description of DBA.
3.2.1 DBA description
The SAS Delta Burn Arrival Analysis compares the actual fuel burn from a point at, or slightly outside, the Top of Descent (ToD) with the theoretical fuel burn of a theoretical reference flight which makes an optimum descent straight into the Aerodrome Reference Point (ARP). Thus, the reference flight is assumed to land on an often non-existing runway.
Track of the actual flight
Point wherethe comparisonbegins
Airport (with AerodromeReference Point, ARP)
TOD
Track of theoreticalreference flight.
”Delta Burn Arrival airborne” (DBAa) is the difference between the fuel burn of the actual flight and the burn of the reference flight.
The fuel burn of the reference flight is calculated with Boeing Performance Software (BPS) for an aircraft with same grossweight and cruise flight level as the actual flight and with same wind, temperatureand QNH as for the actual flight.
Data for the actual flight is taken from the aircraft’s on-board data recording system.
Fuel burn is calculated as the integrated Fuel Flow.
Grossweight, cruise flight level, wind, temperature and air pressure data are picked up to be used in the BPS calculation for the reference flight.
Number of seconds with engine and airframe anti-icesystems is recorded and used to correct the analysis for variations in bleed usage due to icing conditions.
Figure 4 SAS Delta Burn Arrival depiction
The Delta Burn Arrival of the actual flight is made up of two components:
A horizontal component which is due to the longer track of the actual flight,
and
00.00.10
19 of 85
A vertical component which is caused by deviations from an optimum descent along the actual track. This component will include effects of e.g. miscalculation of ToD, level offs and speed deviations.
”Delta Burn Arrival airborne horizontal ” (DBAah) is the differencebetween the fuel burn of the reference flight and another theoreticalreference flight flying an optimum vertical profile along the track of the actual flight.Thus, DBAah is the difference between two theoretical flights , bothcalculated with BPS, but using grossweight, wind, temp etc from the actual flight.
”Delta Burn Arrival airborne vertical” (DBAav) is the differencebetween the fuel burn of the actual flight and the fuel burn of the reference flight flying along the track of the actual flight.
DBAa = DBAah + DBAav
In this analysis, a correction for the variation in fuel efficiencybetween different tailnumbers is applied to the calculated DBAaand DBAav.Values thus corrected are denoted ”Corrected for tailnumber”. The magnitude of this correction varies from -30 to +30 kg.
Figure 5 Delta Burn Arrival - further information
Note: DBA values are typically higher for arrivals to opposite runways than for straight in arrivals. Since Green connection traffic is entering the TMA from west and follows a downwind to runway 26 all DBA values will thus be relatively high numbers.
3.2.2 Trial flights and baseline
Two types of trials flights were to be analysed:
1. Gate to Gate flights from ESGG to ESSA runway 26. These trial flights were to be compared with all other B737 traffic using the same departure and arrival runway on this citypair during the same time period.
2. RNP-approach trial flights from anywhere via ELTOK TMA entry point to runway 26 ESSA. These trial flights were to be compared with all other corresponding B737 traffic during the same time period.
Flights were only included for measurement in the material if they had completed the trial. Some flights were cancelled due to typically tactical radar vectoring at a late stage. These flights were deleted altogether from the material and were not considered, neither as a trial flight or a baseline flight.
It was discussed whether various traffic densities should influence the result. Considering that runway 26 is only used in low and medium traffic densities this was deemed to be a small problem. Also, since only 100 trial flights were to be made, any division into different traffic densities would be impossible to achieve with enough data to draw conclusions from. Even though the data is corrected for individual aircraft differences, temperature, wind, engine type, engine- and airfoil ice usage etc. there is still a scatter in data.
3.3 Preparations for conformance monitoring and trajectory stability analysis
3.3.1 Overview
Rockwell Collins SBT suite provides a series of graphical outputs enabling the analysis of conformance and trajectory stability, both in the time and in the geometric domains.
“Box and whiskers” graphs depict min and max values, as well as 75% percentiles and median values. These are used to assess conformance of predicted trajectories over time, by comparing the broadcast predictions with actual radar plots records. Graphs are also used to assess the stability of
00.00.10
20 of 85
the predictions over time, by comparing dispersions of 4D trajectory points (position and ETA) with respect to a reference trajectory. Points of interest such as Top of Climb, Top of Descent as well as those defining the approach path are highlighted. “Google Earth”-based depictions are also used to assess the geometric behaviour of the trajectory information being broadcast along the flight.
The software suite was developed using MathWorks™ MatLab as a tool for performing the conformance monitoring and trajectory stability analysis.
Basically, the tool:
1. Parses the different files containing consecutive 4D trajectory broadcasts (ACARS reports and GE’s PBTM simulations) on the one hand, and radar plot reports when associated to 4D trajectory broadcast on the other hand.
2. Computes and records relevant information from the different reports such as, time differences, relative distances, cumulated distances, etc… after spatial or time associations between the different time-tagged positions related to a single flight.
3. Generates outputs for trend analysis based on “box and whiskers” plots and graphs, as well as figures based on Google Earth™ and statistics summary spread sheets.
An overall depiction of the processes is provided Figure 6.
Figure 6: RC's SBT Overall Process Description
3.3.2 Inputs
The different inputs for the tool are the following:
a) Consecutive 4D trajectory broadcasts periodically (3 minutes) transmitted through ACARS along the flight
The data are collected at CIES level, processed and sent in batch by LFV to RCF
00.00.10
21 of 85
Each batch contains a series of flights, a file per ACARS transmission. An example is provided
b) Consecutive 4D trajectories generated by GE Aviation’s PBTM tool for the flight
Data generated by GE Aviation are sent to RCF
A file contains all consecutive 4DT profiles for a flight. An example is provided Time,Callsign,MsgID,Type,TurnDirection,TurnRadius,Coordinate,Altitude,ETA Sun Oct 30 00:00:00 2011,SK152,4DT F01A,0,,,N57664E012281,53,095000 Sun Oct 30 00:00:00 2011,SK152,4DT F01A,0,,,N57696E012310,156,095046 Sun Oct 30 00:00:00 2011,SK152,4DT F01A,C,,,N57748E012417,500,095155 Sun Oct 30 00:00:00 2011,SK152,4DT F01A,1,R,353,N57781E012484,739,095234 Sun Oct 30 00:00:00 2011,SK152,4DT F01A,1,,,N58169E013294,2513,095837 Sun Oct 30 00:00:00 2011,SK152,4DT F01A,1,,,N58170E013296,2517,095838 Sun Oct 30 00:00:00 2011,SK152,4DT F01A,B,,,N58260E013496,2820,095952 Sun Oct 30 00:00:00 2011,SK152,4DT F01A,8,,,N58391E013790,3300,100138 Sun Oct 30 00:00:00 2011,SK152,4DT F01A,1,,,N58599E014264,3300,100429 Sun Oct 30 00:00:00 2011,SK152,4DT F01A,9,,,N58926E015027,3300,100901 Sun Oct 30 00:00:00 2011,SK152,4DT F01A,1,,,N59200E015687,2516,101309 Sun Oct 30 00:00:00 2011,SK152,4DT F01A,1,,,N59412E016211,1888,101646 Sun Oct 30 00:00:00 2011,SK152,4DT F01A,1,,,N59587E016648,1365,102002 Sun Oct 30 00:00:00 2011,SK152,4DT F01A,1,L,893,N59824E016989,829,102344 Sun Oct 30 00:00:00 2011,SK152,4DT F01A,C,,,N59764E017319,500,102609 Sun Oct 30 00:00:00 2011,SK152,4DT F01A,1,,,N59651E017918,14,103234
Figure 8 Example of GE’s PBTM generated trajectory
c) Radar plots reported by up to 6 radars and periodically (approx. 5 seconds) recorded along the flight.
Data generated by LFV are sent to RCF
00.00.10
22 of 85
A file contains all radar plots by all radars for a flight. An example is provided
Time,Callsign,MsgID,Type,TurnDirection,TurnRadius,Coordinate,Altitude,ETA Sun Oct 30 00:00:00 2011,SK152,4DT F01A,0,,,N57664E012281,53,095000 Sun Oct 30 00:00:00 2011,SK152,4DT F01A,0,,,N57696E012310,156,095046 Sun Oct 30 00:00:00 2011,SK152,4DT F01A,C,,,N57748E012417,500,095155 Sun Oct 30 00:00:00 2011,SK152,4DT F01A,1,R,353,N57781E012484,739,095234 Sun Oct 30 00:00:00 2011,SK152,4DT F01A,1,,,N58169E013294,2513,095837 Sun Oct 30 00:00:00 2011,SK152,4DT F01A,1,,,N58170E013296,2517,095838 Sun Oct 30 00:00:00 2011,SK152,4DT F01A,B,,,N58260E013496,2820,095952 Sun Oct 30 00:00:00 2011,SK152,4DT F01A,8,,,N58391E013790,3300,100138 Sun Oct 30 00:00:00 2011,SK152,4DT F01A,1,,,N58599E014264,3300,100429 Sun Oct 30 00:00:00 2011,SK152,4DT F01A,9,,,N58926E015027,3300,100901 Sun Oct 30 00:00:00 2011,SK152,4DT F01A,1,,,N59200E015687,2516,101309 Sun Oct 30 00:00:00 2011,SK152,4DT F01A,1,,,N59412E016211,1888,101646 Sun Oct 30 00:00:00 2011,SK152,4DT F01A,1,,,N59587E016648,1365,102002 Sun Oct 30 00:00:00 2011,SK152,4DT F01A,1,L,893,N59824E016989,829,102344 Sun Oct 30 00:00:00 2011,SK152,4DT F01A,C,,,N59764E017319,500,102609 Sun Oct 30 00:00:00 2011,SK152,4DT F01A,1,,,N59651E017918,14,103234
00.00.10
23 of 85
Figure 8 Example of GE’s PBTM generated trajectory
Conformance monitoring analysis related features are based on computations performed on 4D data transmitted through ACARS and associated radar plots.
Trajectory stability analysis related features are based on computations performed on 4D data transmitted through ACARS, as well as on 4D trajectory files generated by GE Aviation’s PBTM tool.
3.3.3 Outputs
The different outputs from the tool are the following:
1. Cross track (distance between radar plots and 4D trajectory legs) distributions: these are used to analyse geometrical conformance of actual flight with respect to the consecutive estimated trajectories.
2. Time interval (time difference between predicted ETA and actual overfly time) distributions: these are used to analyse time conformance of actual flight with respect to the consecutive estimated trajectories.
3. Time interval (time difference between predicted ETA along the flight) as a function of cumulated distance: these are used to analyse stability in the time domain as well as the stability in the geometric domain of consecutive estimated trajectories.
4. Google Earth™ format files for visual 3D depiction of trajectories and radar plots.
5. Statistics from the parser and computation features: these are used to assess the quality of the collected and interpreted data, to summarize the number of flights and associated trajectories being processed, and to provide overall statistics including min, max, mean and median values.
The “Time Conformance Monitoring” figure shows the accuracy of the ETA predictions, comparing predicted ETA with actual time over defined positions. An example is provided Figure 10.
The “Time Stability Monitoring” figures illustrate the evolution of the different predictions over time, and how they stabilise after take-off and especially after top-of-descent. An example is provided Figure 11.
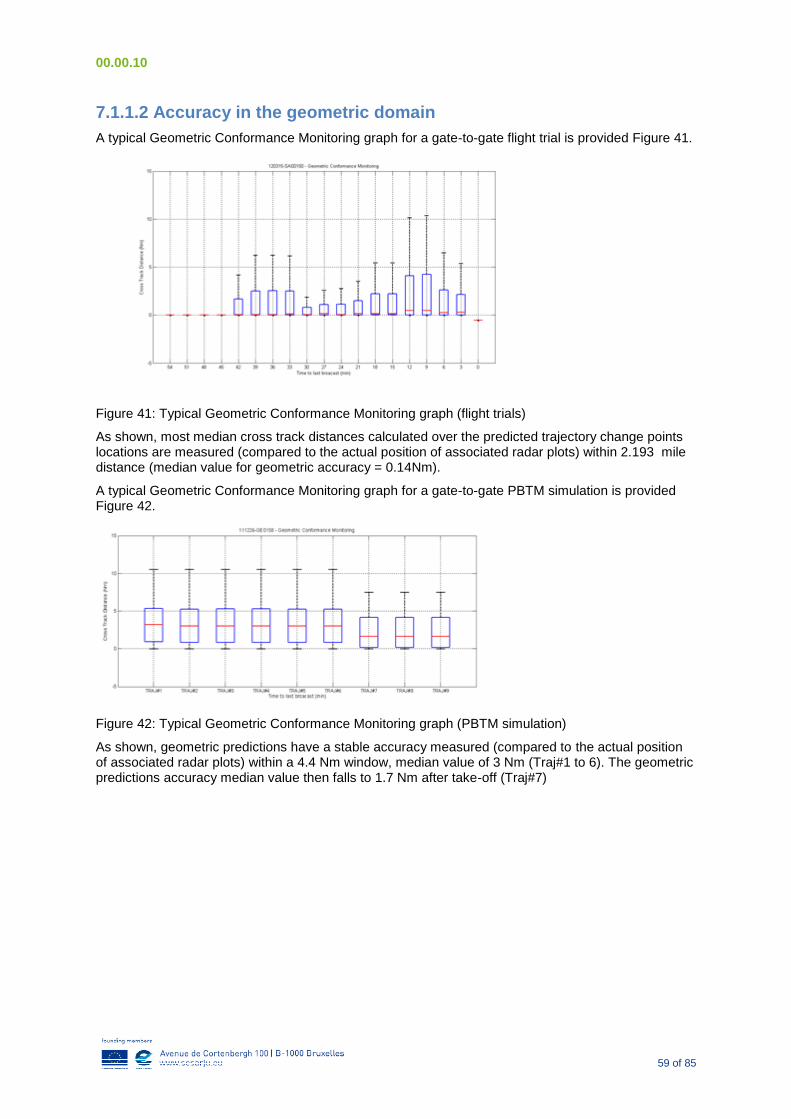
The “Geometric Conformance Monitoring” figure shows an accuracy of the geometry of the path flown, comparing predicted positions with actual radar measurements. An example is provided
The “Google Earth”-based figure shows how the initial trajectory predictions (light green) converge and are actually flown, most “green trajectories” (after a shortcut was provided) being overlaid by magenta radar plots. An example is provided Figure 14.
00.00.10
24 of 85
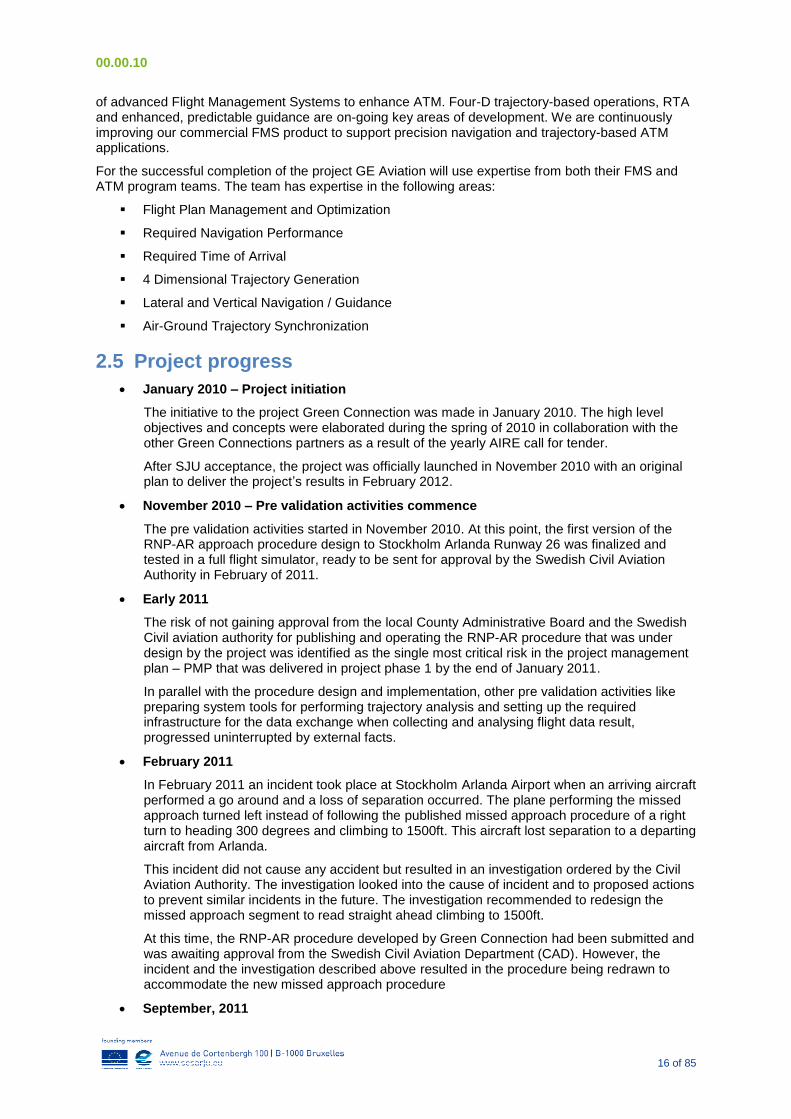
Figure 10: Example of Time Conformance Monitoring "box and whiskers" graph
Figure 10 above shows an example of “box and whiskers” graph. Max and min values of the samples are depicted with black dashes, the height of the blue box corresponds to 75 and 25 percentiles, the median value is depicted with the red bar, The 7-minute offset on first box (when compared to the others) corresponds to the difference between initially predicted take-off time and actual take-off time.
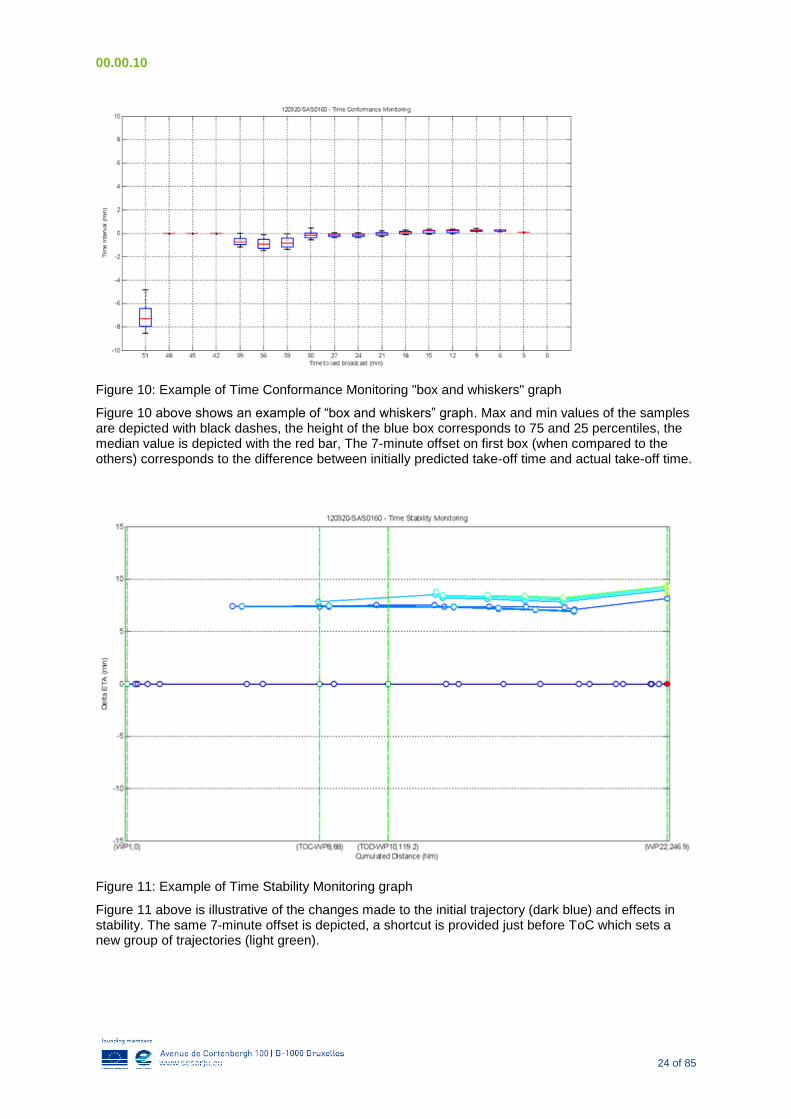
Figure 11: Example of Time Stability Monitoring graph
Figure 11 above is illustrative of the changes made to the initial trajectory (dark blue) and effects in stability. The same 7-minute offset is depicted, a shortcut is provided just before ToC which sets a new group of trajectories (light green).
00.00.10
25 of 85
Figure 12: Example of Geometric Conformance Monitoring "box and whiskers" graph
Figure 12 above show how accurate and stable the predictions were until 18 minutes before landing. In fact, this particular flight trail was cancelled, and the path flown during approach no longer stuck to the predicted trajectories during approach as depicted below.
Figure 13 Predicted and actually flown trajectory
The green lines in the 2 figures above show the predicted trajectory. The flight in example cancelled the approach and flew the “red path” (radar plots) depicted left, instead of sticking to the “orange path” (radar plots of another flight) depicted right.
00.00.10
26 of 85
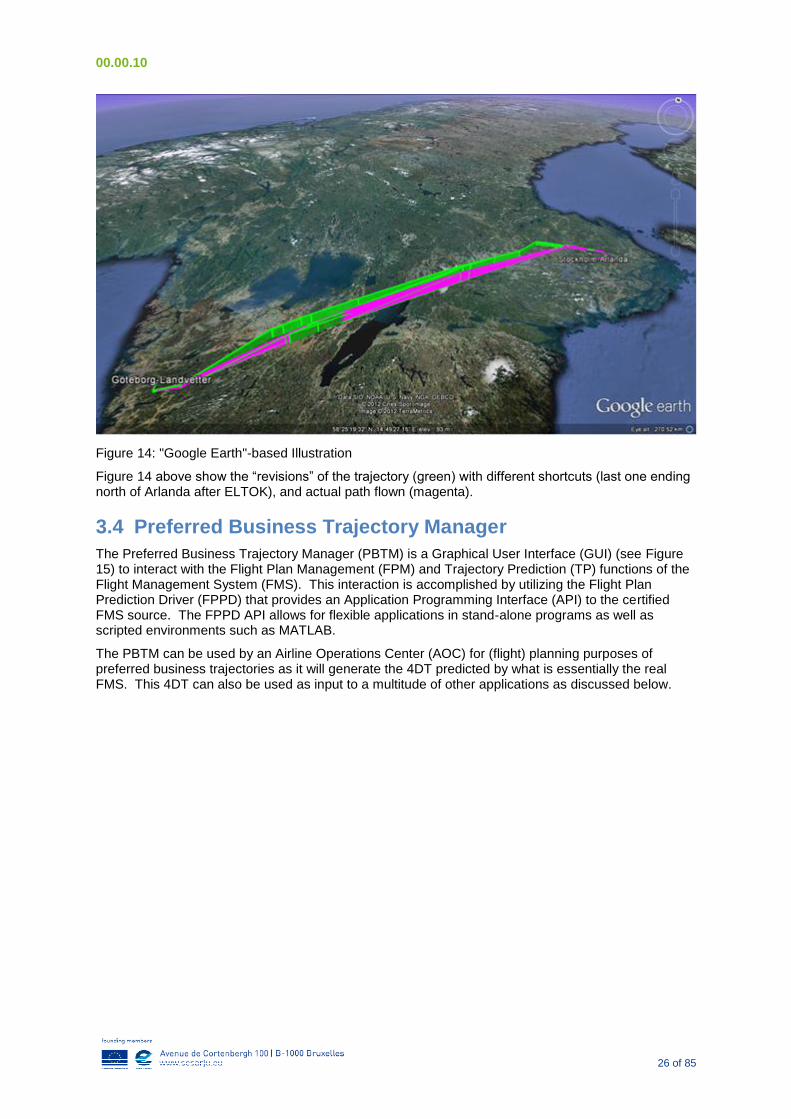
Figure 14: "Google Earth"-based Illustration
Figure 14 above show the “revisions” of the trajectory (green) with different shortcuts (last one ending north of Arlanda after ELTOK), and actual path flown (magenta).
3.4 Preferred Business Trajectory Manager
The Preferred Business Trajectory Manager (PBTM) is a Graphical User Interface (GUI) (see Figure 15) to interact with the Flight Plan Management (FPM) and Trajectory Prediction (TP) functions of the Flight Management System (FMS). This interaction is accomplished by utilizing the Flight Plan Prediction Driver (FPPD) that provides an Application Programming Interface (API) to the certified FMS source. The FPPD API allows for flexible applications in stand-alone programs as well as scripted environments such as MATLAB.
The PBTM can be used by an Airline Operations Center (AOC) for (flight) planning purposes of preferred business trajectories as it will generate the 4DT predicted by what is essentially the real FMS. This 4DT can also be used as input to a multitude of other applications as discussed below.
00.00.10
27 of 85
Figure 15 PBTM GUI
The code baselines implemented in the FPPD, are the Boeing 737 FMCS Update 10.7 (U10.7) as well as U10.8A. Future 737 FMCS releases (e.g. U11) will become available upon certification. Furthermore, the FPPD includes the Airbus Revision 2+ and Release 1A code.
Figure 16 shows the data flow in the FPPD. The inputs are the initial state and flight plan as well as performance data. This information is processed by the FPPD to create a flight plan in a format that can be used by the FPM and TP code (shown as the “FMS Code” in Figure 16) which will then output the predicted 4D trajectory.
FPPD.NET Interface (e.g. MATLAB)
FPPD Inputs
• Initial State
• Flight Plan (Including Altitude/Speed Constraints & RTA)
• Performance Data (e.g. Weight/Cost Index)
• Weather (Wind/Temperature) Data
FMS Code
4D Trajectory
Figure 16 Data Flow in the FPPD
3.4.1 Inputs
This section provides an overview of the most important inputs that need to be specified before the FPPD can perform a trajectory prediction. It will be discussed later which inputs were provided for the prediction of the AGC gate-to-gate flights.
Initial State
The initial state specifies from where the trajectory prediction will begin. By default, a prediction run will begin at the departure airport or specified runway threshold with a flight phase of Preflight.
Position as Latitude/Longitude (= Runway Threshold for Preflight)
00.00.10
28 of 85
Altitude (in feet)
Fuel (in klbs)
GOTO Waypoint (Defaults to the first waypoint in the route for Preflight)
Flight Plan
The flight plan can either be specified by using a pre-packaged company route from the Navigation Database (NDB) or by building a route “from scratch” with the following inputs:
Departure Runway/Procedure (SID)
Airways
En-Route Legs/Waypoints
Arrival Runway/Procedure (STAR)
Approach Procedure
The FPPD also allows for altitude and speed constraints to be imposed on en-route waypoints (any restrictions coded on waypoints of a SID, STAR, or Approach procedure are automatically read from the NDB).
Performance Data
Cost Index
Pin Pattern (this specifies the Airframe & Engine Model)
Cruise Altitude
Zero Fuel Weight
Climb/Cruise/Descent Modes (e.g. “Economy” versus “Selected” speed)
Wind/Temperature Data
The wind/temperature data that can be used by the FPPD is identical to what can be entered into the FMS. The following shows examples for a waypoint-based wind that can be entered at every Cruise waypoint and an altitude-based wind in Descent:
Cruise
DETSO 180°/ 40 indicates a 40 [kts] wind from south at waypoint YVR.
Descent
FL200 090°/ 20KT indicates a 20 [kts] wind from east at Flight Level 200 (= 20,000 [ft]).
Required Time of Arrival (RTA)
The FPPD allows for an RTA to be specified for a single Climb, Cruise, or Descent waypoint.
3.4.2 Outputs
The FPPD will output the predicted trajectory as a series of trajectory change points that fully describe both the lateral and vertical 4D trajectory. The information for these points includes:
Position (Latitude/Longitude)
Turn Information (Arc/Straight)
Altitude
Speed
Time
Weight
The following auxiliary data is contained as well:
•Flight Phase
•Vertical Point Type (e.g. Top of Descent, Speed Change)
The PBDT can also output the predicted trajectory as a KML file to be displayed in Google EarthTM
. Figure 17 shows an example of the SAS ESGGESSA10 Company Route with the ELTOK1H STAR into ESSA.
00.00.10
29 of 85
Figure 17 Predicted 4DT of the SAS ESGGESSA10 Company Route with the ELTOK1H STAR into ESSA
Furthermore, it is possible to use the PBTM to generate inputs for Aviation Environmental Design Tool (AEDT) that the Federal Aviation Administration (FAA) developed for environmental impact studies.
3.4.3 Modifications
This section outlines how the PBTM was modified to accommodate the needs of the gate-to-gate AGC activities.
The PBTM is now capable of processing a Microsoft Excel worksheet template for the input data. This worksheet template was developed to allow for simpler entering of the necessary input data for each event of the gate-to-gate flights.
Figure 18 and Figure 19 show what data is entered for each Entry #. This represents an event for which a trajectory prediction is to be performed. The possible events are as follows:
Timetable
Flight Plan Filed
Flight Planning by Flight Crew
Fuel Release
Final Loadsheet
Takeoff
Wind Uplink
Top of Descent
Touchdown
00.00.10
30 of 85
The schedule, Aircraft Data, and company route are required inputs but Departure and Arrival information is optional. This might be embedded in the Company Route and if not, the FPPD performs the trajectory prediction straight from the departure and to the destination airport.
Figure 18 Schedule/Aircraft/Flight Plan Input Data
The Cruise FL and Cost Index are the only mandatory fields for the performance data. If missing, the Descent PERF LIMITS are assumed to be the default (airline-specific) values and the Meteo Data as well as the Anti-Ice Alts is set to be zero.
Figure 19 Performance Input Data
The PBTM was also modified to now output the predicted trajectory in a format based on the ARINC 702A-1 (5.2.12.2) intent data that gets downlinked via ACARS from the aircraft. This facilitates the task of comparing trajectories.
3.5 Preparations for trial execution
In preparation for the trial execution, a number of activities were carried out to prepare the various actors at the involved air traffic control centres, airlines and towers.
The overall trial scenario was developed in cooperation between the Green Connection partners when the original proposal was developed and submitted for the project. Details about how to execute the trials were decided upon as the project developed.
These preparations are described here:
3.5.1 OMA –Operational Instruction for Controllers For every new or changed procedure that affects the work for ATCOs, an “Operational Instruction for Controllers” is produced. Since the gate to gate validations exercise affected both ATS and ATC ATCO:s from multiple sectors, each affected sector are provided with an “Operational Instruction for Controller” These were communicated via briefing sessions and textual copies.
3.5.2 Briefing with controllers Prior to starting the trials the controllers were given a briefing of the project objectives, outline and detailed presentation of the new “OMA” for Green Connection trials. Seven consecutive briefing sessions were performed at Stockholm ATCC to cover all the controllers that might be involved in the trial. The same procedures were followed at ATS Landvetter, Malmö ATCC and ATS Arlanda (Arlanda Tower).
3.5.3 Briefing with pilots
SAS briefed all their pilots via email an instruction. A general description describing the two different validation categories:
25 “Green Connection” flights ESGG-ESSA via RNP-approach to RWY26. These are Green connection flights made “gate-to-gate” where ATC will do their outmost to provide a Green Flight. We as pilots will in turn, do our outmost to fly them as green as possible. ATC will initiate these flights before pushback in ESGG. See below for intended procedure.
75 flights arriving ESSA via RNP-approach to RWY26. These flights can be requested by pilots and/or offered by ATC. The roadmap 15DEC11-30APR2012 is to make 75 approaches
00.00.10
31 of 85
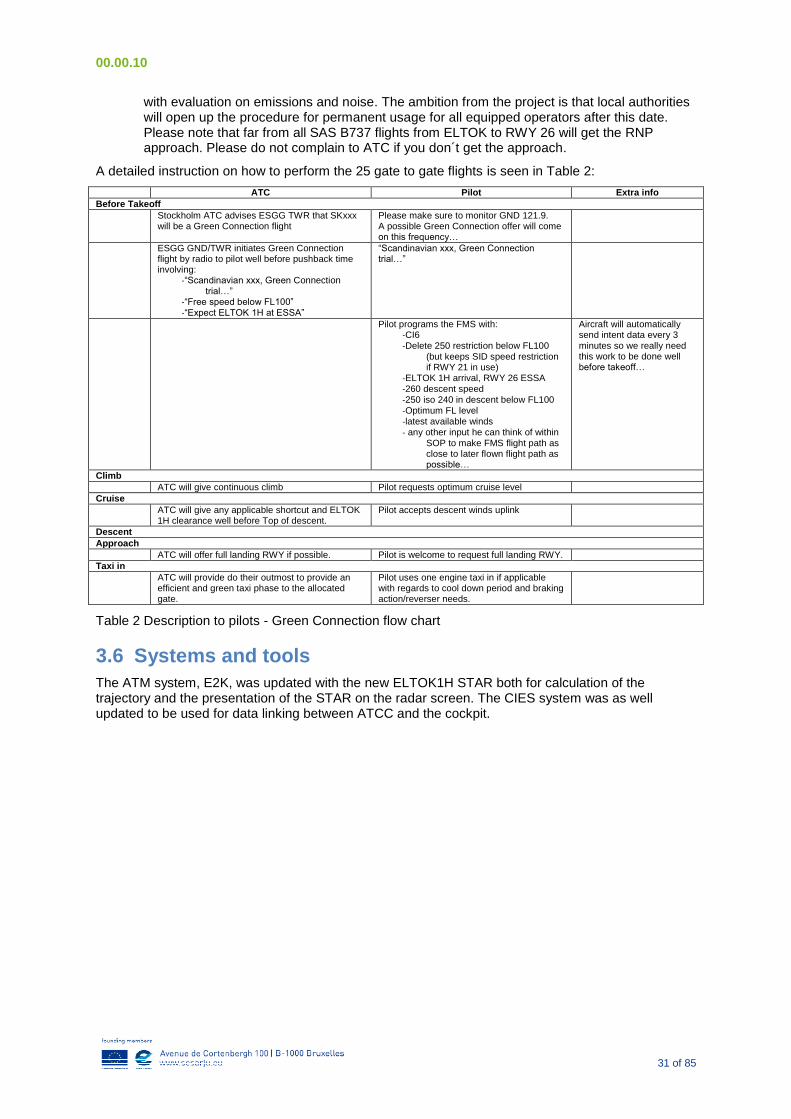
with evaluation on emissions and noise. The ambition from the project is that local authorities will open up the procedure for permanent usage for all equipped operators after this date. Please note that far from all SAS B737 flights from ELTOK to RWY 26 will get the RNP approach. Please do not complain to ATC if you don´t get the approach.
A detailed instruction on how to perform the 25 gate to gate flights is seen in Table 2:
ATC Pilot Extra info
Before Takeoff
Stockholm ATC advises ESGG TWR that SKxxx will be a Green Connection flight
Please make sure to monitor GND 121.9. A possible Green Connection offer will come on this frequency…
ESGG GND/TWR initiates Green Connection flight by radio to pilot well before pushback time involving:
-“Scandinavian xxx, Green Connection trial…”
-“Free speed below FL100” -“Expect ELTOK 1H at ESSA”
“Scandinavian xxx, Green Connection trial…”
Pilot programs the FMS with: -CI6 -Delete 250 restriction below FL100
(but keeps SID speed restriction if RWY 21 in use)
-ELTOK 1H arrival, RWY 26 ESSA -260 descent speed -250 iso 240 in descent below FL100 -Optimum FL level -latest available winds - any other input he can think of within
SOP to make FMS flight path as close to later flown flight path as possible…
Aircraft will automatically send intent data every 3 minutes so we really need this work to be done well before takeoff…
Climb
ATC will give continuous climb Pilot requests optimum cruise level
Cruise
ATC will give any applicable shortcut and ELTOK 1H clearance well before Top of descent.
Pilot accepts descent winds uplink
Descent
Approach
ATC will offer full landing RWY if possible. Pilot is welcome to request full landing RWY.
Taxi in
ATC will provide do their outmost to provide an efficient and green taxi phase to the allocated gate.
Pilot uses one engine taxi in if applicable with regards to cool down period and braking action/reverser needs.
Table 2 Description to pilots - Green Connection flow chart
3.6 Systems and tools
The ATM system, E2K, was updated with the new ELTOK1H STAR both for calculation of the trajectory and the presentation of the STAR on the radar screen. The CIES system was as well updated to be used for data linking between ATCC and the cockpit.
00.00.10
32 of 85
4 PBN implementation
Performance Based Navigation represents a shift from navigation only on ground-based equipment aids to space based navigation aids and aircraft onboard systems. The ICAO PBN manual introduced the Airspace Concept, where the PBN Concept is situated under the NAV part of the Airspace Concept.
The three cornerstones in the NAV part of the Airspace concept are;
Navigation Applications – ATS routes and Instrument Flight Procedures.
NAVAID – Refers to ground and space based navigation aids
Navigation specifications – Technical and operational specifications with identified required functionality of the area navigation equipment. It also identifies how the navigation equipment is expected to operate in the Navaid infrastructure.
Figure 21 Navaid specification Ref. [2]
As described in the picture above, there are two kinds of navigation specifications in the PBN manual which refers to Area Navigation capability, RNAV (Area Navigation) and RNP (Required Navigation Performance).
The difference between them is RNP has additional requirements for on-board systems such as performance monitoring and alerting functions to support the aircrew, which results in higher confidence in track keeping.
The procedure developed and used in Green connection is a RNP-AR APCH.
4.1 Difference between conventional ILS and RNP-AR
The conventional precision landing system ILS (Instrument Landing System) is ground based and consist of a technical system situated at the airport.
The ILS system is designed to guide the aircraft from a fixed altitude and in a straight line with the RWY, approximately 10 nm from the RWY threshold. There is not much flexibility in the design of the procedure based on the criteria stated in the ICAO documentation of procedure design.
00.00.10
33 of 85
RNP-AR approach offers the possible to use RF leg (Radius to Fix, Curved approach) within the approach, which is not possible in an ILS approaches. This gives a greater flexibility in the design of the approach and could e.g. reduce the distance flown to landing compared to an ILS approach.
Figure 22 RNP-AR RF Leg description Ref. [1]
4.2 RNP-AR requirements
The RNP concept has additional requirements compared to RNAV. These requirements refer to the performance required of the area navigation system. The performance consists of three elements, accuracy, integrity and availability. These elements refer to all parts of the area navigation system, and need an approval.
As example the requirement for on-board navigation need additional functionalities as;
Display and indication of both the required and the actual navigation system performance,
Monitoring of the system performance and alerting the flight crew when RNP requirements are not met, and
Cross track deviation displays scaled to RNP, in conjunction with separate monitoring and alerting for navigation integrity.
4.3 RNP-AR implementation process – from a first idea to a published procedure
PBN design and implementation requires involvement from several stakeholders and operational experts. The processes from a first idea to a published procedure described below is an iterative process, especially in stages 2 to 6, until a final design can be agreed upon and further processed. In general, the process involves 9 steps.
1. Idea: A first idea towards a new (or a changed) procedure is processed by one or several stakeholders
2. Pre design: The idea is pre designed to see the potential improvements and to create a discussion material for further assessments.
3. ATM operational assessment: An initial operational assessment is performed involving ATM experts to assess possible effects of introducing the new procedure. New traffic flows and harmony with existing traffic flows are investigated.
4. Environmental assessment: Further assessment on possible environmental impact is performed. Airport neighbours, populated areas near by the airport are considered when designing lateral extension of the new procedure. Noise exposure in airport vicinity and carbon dioxide emissions are calculated. The County Administrative Board is continuously informed of eventual complaints from airport neighbours.
5. Safety assessment: An operational safety assessment is performed with special focus on change in traffic flows, operating procedures and workload for air traffic controller and pilots.
6. AU simulator assessment: The predesign procedure is coded (ARINC), packed into a navigational database and installed into the FMS of a full flight simulator. Tests are performed
00.00.10
34 of 85
under different performance scenarios (e.g. aircraft weight, meteorological condition) to assess the operational effects from AU perspective. Lateral and vertical flight profiles, speeds, fuel consumption and emissions etc.
7. Final design: Once all the operational and environmental aspects are considered a final revision of the procedure is performed and the final design is concluded in an application to the Civil Aviation Authority and the County Administrative Board.
8. Application for approval: The Civil Aviation Authority normally requires a three month calendar time for processing an application. In some cases the applicant are asked to answer additional questions concerning the application. When there have been no complaints from neighbours, The County Administrative Board can be expected to approve a permanent usage of the new procedure.
9. Published procedure: Once the application is approved by the authority it will be published following the AIRAC cycle which means that another two months are required before the procedure can be put into operation.
4.3.1 Design Idea
The idea for RNP-AR development was initially taken by Stockholm Arlanda Airport and Swedavia. This type of procedure had been requested for a number of years by the airspace users to Arlanda as a way to shorten track miles flown between ELTOK and Runway 26 during low traffic periods. This procedure fit well with the airport’s long term handling plan in line with the airport environmental permit to develop environmental efficient arrival routes and departure routes in and out Stockholm Arlanda Airport. The benefits with the RNP procedures are the design flexibility in the lateral plane where noise sensitive areas easily can be avoided compared to a standard ILS approach design.
4.3.2 Pre Design
When developing the RNP-AR approach from the west entry point, ELTOK to ESSA RWY 26, the objective was to develop a procedure that was avoiding noise sensitive areas, lateral efficient (short) and vertical efficient (CDA capable, no level offs) and harmonized with other arriving and departure traffic flows. The first version is depicted in Figure 23 with the magenta line being the existing low traffic closed P-RNAV STAR and the yellow line indicates the RNP-AR under design.
Figure 23 Initial pre-design of RNP procedure
The design work follows predefined design rules for air navigation. ICAO document 9905 [1] is the applicable design document used.
4.3.3 ATM operational assessment
The ATM operational assessment is performed to highlight the air traffic controller point of view and how the new RNP-AR procedure may affect the air traffic controllers’ workload and operating work procedures. The assessment is covering capacity, arriving flow, departures flow, Missed App procedures, workload for controllers etc. The outcome from these assessments generated a revised lateral track for the RNP-AR design to be more harmonized with the other arriving traffic which makes it more useable but slightly longer arrival.
00.00.10
35 of 85
4.3.4 Safety assessment
A dedicated safety engineer is involved and responsible for assessing the safety aspect of a new or a changed ATS procedure. These assessments are normally performed as a meeting with at least one senior delegate representing every relevant ATM role, as procedure designer, terminal air traffic controller, tower air traffic controller, pilots etc.
The main objective with these assessments is to verify that there is no increased safety risk related with operating the new procedure.
4.3.5 Environmental assessment
Swedavia has its own department dealing with information to the airports neighbours. This department is also responsible for dealing with environmental complaints in the airport vicinity. Swedavia has a good relation to the surrounding communities, which are powerful, and is working extensively to inform on airport updates or changes that might affect the surrounding.
Swedavia handles the communication with the County Administrative Board which is supervisory authority for the environmental terms the airport is subject to. When designing the RNP-AR procedure, Swedavia was asked to review the lateral track of the procedure to see if there were any noise sensitive areas affected. The inputs provided by Swedavia generated a revised lateral track for the RNP-AR procedure to avoid noise sensitive areas.
A noise curvature for the final RNP-AR design was calculated and included in the environmental permit application that the airport has filed to the environmental court for a new environmental permit.
4.3.6 Detailed procedure design
Following the various assessments, a detailed design of the procedure was made according to [1].
This design used the same missed approach procedure as the current procedure for ILS approaches which meant that aircraft should turn by 40 degrees to a heading of 300 deg during climb out. Various design rules meant that the procedure became much longer than the initial design (i.e. From the initial design of 3NM final to at least 8NM)
Figure 24 Initial detail design of procedure with 300 deg go-around procedure
00.00.10
36 of 85
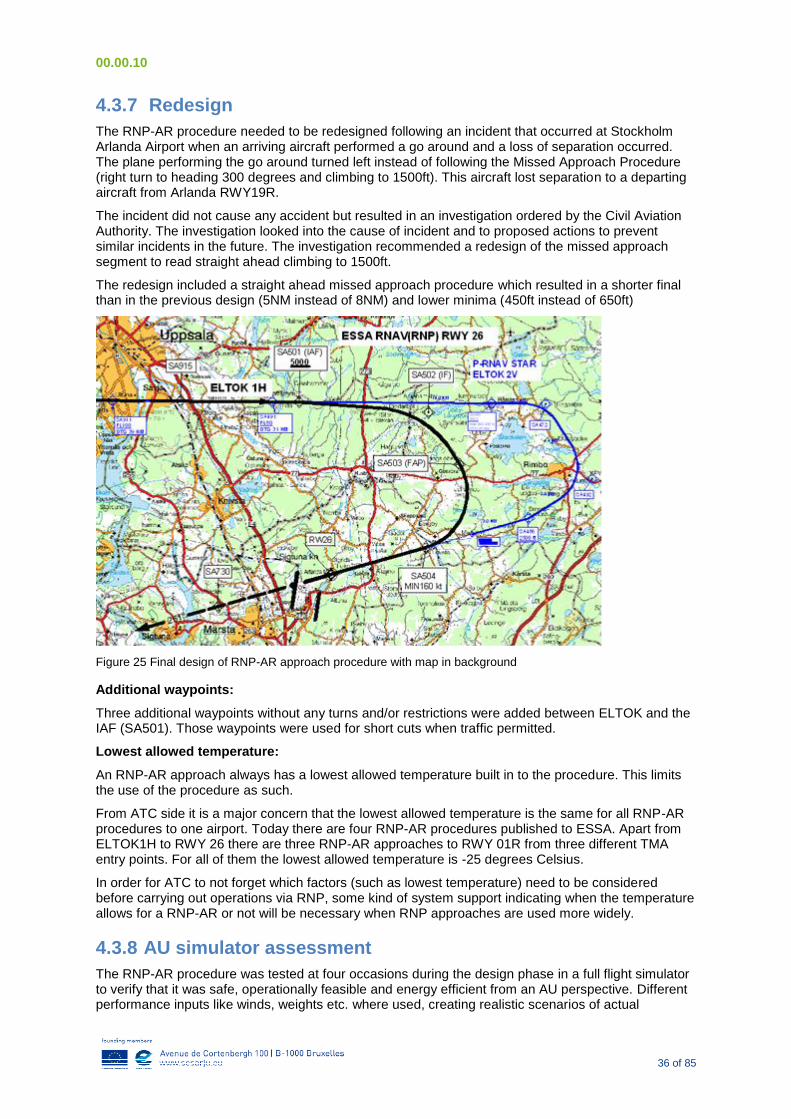
4.3.7 Redesign
The RNP-AR procedure needed to be redesigned following an incident that occurred at Stockholm Arlanda Airport when an arriving aircraft performed a go around and a loss of separation occurred. The plane performing the go around turned left instead of following the Missed Approach Procedure (right turn to heading 300 degrees and climbing to 1500ft). This aircraft lost separation to a departing aircraft from Arlanda RWY19R.
The incident did not cause any accident but resulted in an investigation ordered by the Civil Aviation Authority. The investigation looked into the cause of incident and to proposed actions to prevent similar incidents in the future. The investigation recommended a redesign of the missed approach segment to read straight ahead climbing to 1500ft.
The redesign included a straight ahead missed approach procedure which resulted in a shorter final than in the previous design (5NM instead of 8NM) and lower minima (450ft instead of 650ft)
Figure 25 Final design of RNP-AR approach procedure with map in background
Additional waypoints:
Three additional waypoints without any turns and/or restrictions were added between ELTOK and the IAF (SA501). Those waypoints were used for short cuts when traffic permitted.
Lowest allowed temperature:
An RNP-AR approach always has a lowest allowed temperature built in to the procedure. This limits the use of the procedure as such.
From ATC side it is a major concern that the lowest allowed temperature is the same for all RNP-AR procedures to one airport. Today there are four RNP-AR procedures published to ESSA. Apart from ELTOK1H to RWY 26 there are three RNP-AR approaches to RWY 01R from three different TMA entry points. For all of them the lowest allowed temperature is -25 degrees Celsius.
In order for ATC to not forget which factors (such as lowest temperature) need to be considered before carrying out operations via RNP, some kind of system support indicating when the temperature allows for a RNP-AR or not will be necessary when RNP approaches are used more widely.
4.3.8 AU simulator assessment
The RNP-AR procedure was tested at four occasions during the design phase in a full flight simulator to verify that it was safe, operationally feasible and energy efficient from an AU perspective. Different performance inputs like winds, weights etc. where used, creating realistic scenarios of actual
00.00.10
37 of 85
operation whereas aircraft vertical, lateral and speed behaviour could be assessed. Fuel burn and CO2 emissions are measured from each simulator session and compared with other arrival procedures to see the benefits of the new design.
The PBN implementation stared just a few years ago in Sweden and the experience from operating RNP-AR procedures is still quite limited from all ATM stakeholders’ perspective. The project saw an opportunity to involve the Swedish Civil Aviation Authority early in the implementation process. As a result, the CAA was invited and participated during a FFS session where the procedure was demonstrated. The early involvement increased CAA understanding and facilitated the approval process.
4.3.9 Final design Once each stage (2 to 6) in the implementation process has been processed and all regulating aspects and designing criteria’s have been considered, the final design takes form and can be implemented.
Figure 26 AIP chart of final design of RNP-AR approach procedure
4.3.10Procedure Approval
Before initiating the new procedure, approvals are needed from the Swedish CAA regarding safety of operation and from County Administrative Board regarding noise and environmental impact.
4.3.11Published procedure
Once the approvals are gained from the civil aviation authority, CAA and the county administrative board CAB, the procedure is published following the normal AIRAC Cycle.
00.00.10
38 of 85
5 Validation environment
This section describes the validation environment, the parties involved and the ATM sectors affected. It takes the reader through the validation scenario and reflects the difference from normal operation.
Two categories of flight trials have been performed;
1. Gate to gate validations between Göteborg Landvetter Airport and Stockholm Arlanda Airport where all segments of flight have been validated, and (described in Chapter 5.1)
2. Arrivals into Stockholm Arlanda Airport where the arriving segment from ToD till landing have been validated.(described in Chapter 5.2)
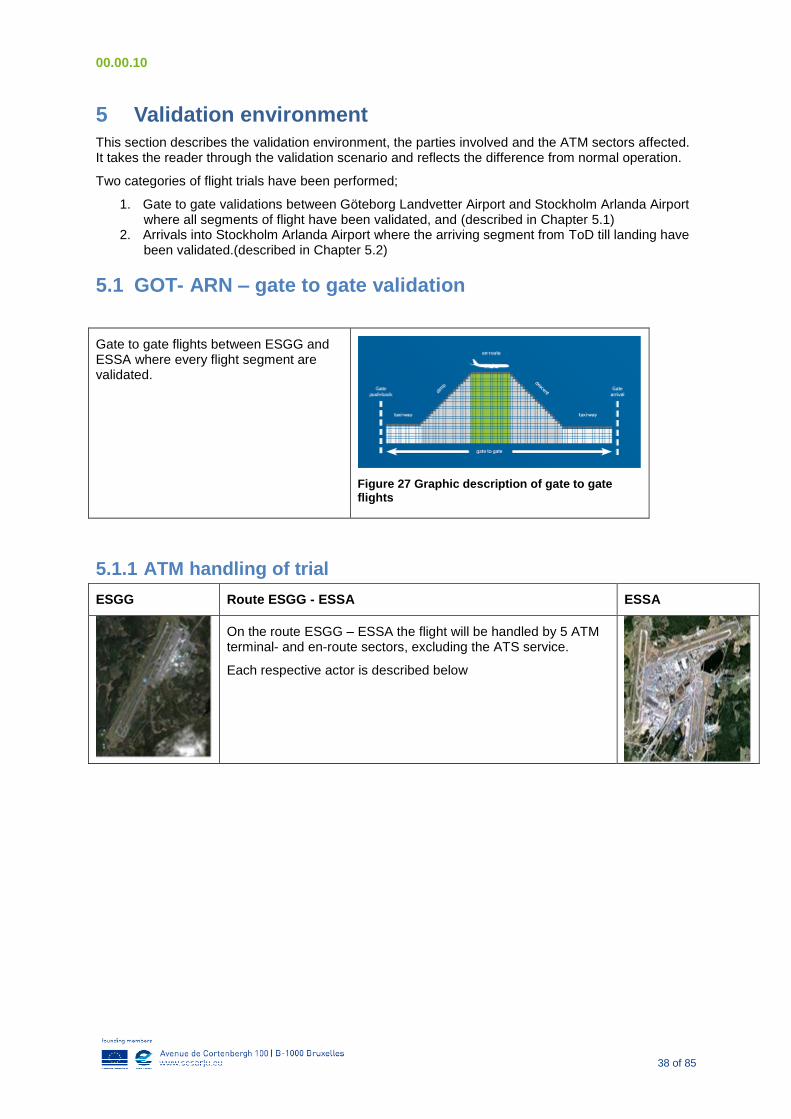
5.1 GOT- ARN – gate to gate validation
Gate to gate flights between ESGG and ESSA where every flight segment are validated.
Figure 27 Graphic description of gate to gate flights
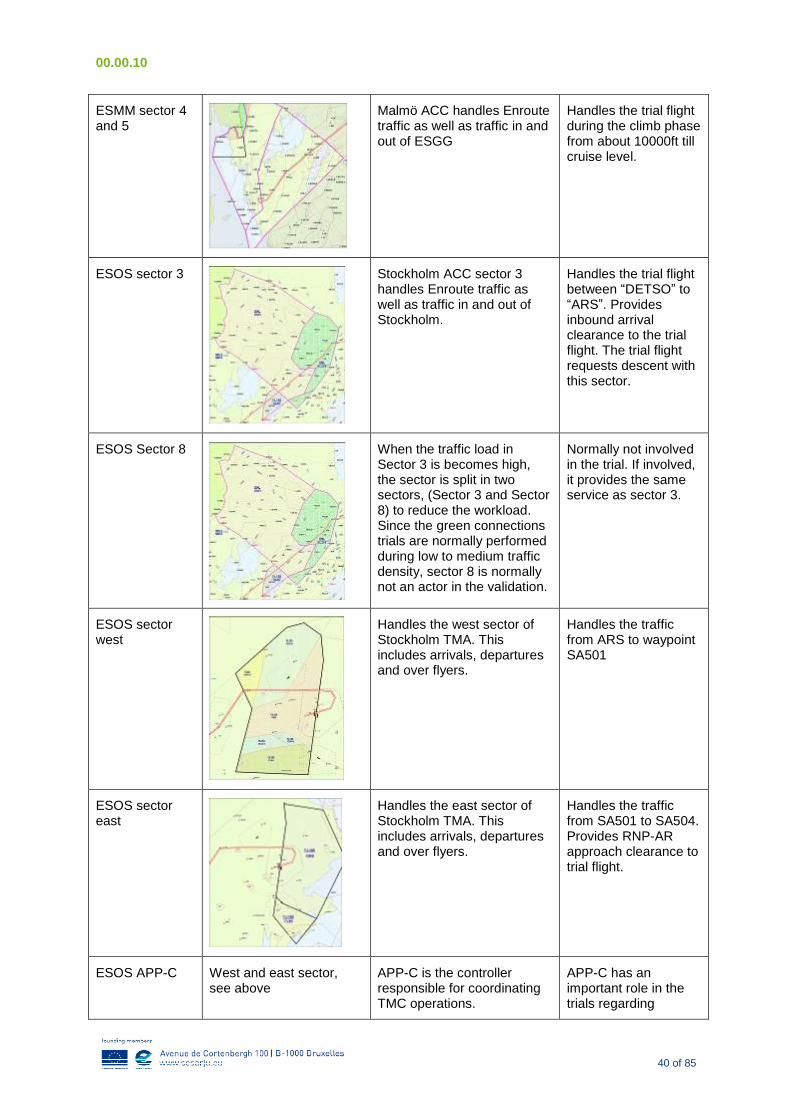
5.1.1 ATM handling of trial
ESGG Route ESGG - ESSA ESSA
On the route ESGG – ESSA the flight will be handled by 5 ATM terminal- and en-route sectors, excluding the ATS service.
Each respective actor is described below
00.00.10
39 of 85
Landvetter airport is operated by Swedavia. In 2010, Landvetter handled 61 000 movements. 25 regional carriers and 10 charter carriers operates to and from Landvetter. The top ten destinations from Landvetter are Stockholm, Copenhagen, Frankfurt, Amsterdam, Helsinki, Munich, London, Antalya, Paris and Brussels.
Figure 28 A Green Connection Flight - from gate to gate
Arlanda airport is operated by Swedavia. In 2009, Arlanda handled 192 500 movements (69 900 being domestic flights). 81 air carriers operates to and from Arlanda. The top ten destinations from Arlanda are Copenhagen, Oslo, London, Luleå, Helsinki, Frankfurt, Umeå, Amsterdam, Göteborg and Paris.
Table 3 GOT-ARN pictorial description
5.1.1.1 ATM actors involved in the trial
Table describes the actors involved in the validation exercise.
Actor Location Description Role within Green Connection
ATS Landvetter
ATS Landvetter performs ground and tower control to air traffic within Landvetter control zone, CTR. The CTR extends vertically from ground level till 2000ft altitude and laterally as the red boarder on the picture to the left.
Upon initiation from test leader, ATS Landvetter informs the pilots via voice that they will perform a trial flight. Provides normal ground and tower service to the trial flight.
ESGG, TMC
Göteborg terminal manoeuvring control. Handles traffic in and out of Göteborg Landvetter Airport and Göteborg Säve airport.
Handles the trial flight during departure (SID= Laban2J) from 2000ft till 10000ft.
00.00.10
40 of 85
ESMM sector 4 and 5
Malmö ACC handles Enroute traffic as well as traffic in and out of ESGG
Handles the trial flight during the climb phase from about 10000ft till cruise level.
ESOS sector 3
Stockholm ACC sector 3 handles Enroute traffic as well as traffic in and out of Stockholm.
Handles the trial flight between “DETSO” to “ARS”. Provides inbound arrival clearance to the trial flight. The trial flight requests descent with this sector.
ESOS Sector 8
When the traffic load in Sector 3 is becomes high, the sector is split in two sectors, (Sector 3 and Sector 8) to reduce the workload. Since the green connections trials are normally performed during low to medium traffic density, sector 8 is normally not an actor in the validation.
Normally not involved in the trial. If involved, it provides the same service as sector 3.
ESOS sector west
Handles the west sector of Stockholm TMA. This includes arrivals, departures and over flyers.
Handles the traffic from ARS to waypoint SA501
ESOS sector east
Handles the east sector of Stockholm TMA. This includes arrivals, departures and over flyers.
Handles the traffic from SA501 to SA504. Provides RNP-AR approach clearance to trial flight.
ESOS APP-C West and east sector, see above
APP-C is the controller responsible for coordinating TMC operations.
APP-C has an important role in the trials regarding
00.00.10
41 of 85
arriving sequence. Together with the test leader he/she decides on initiation of trial, cancel of trials and weather it will be beneficial or not to provide shortcut for the trial flight.
ATS, Arlanda
ATS Arlanda provides ground and tower control to air traffic within Arlanda control zone, CTR. The CTR extends vertically from ground level till 2000ft altitude and laterally as the red boarder on the picture to the left.
Handles the trial flight from SA504 all the way to the allocated gate. Provides landing clearance and taxi clearance.
Table 4 ATM Actors involved in Gate to Gate trial
5.1.1.2 Initiation of flight trials
Before initiating a flight trial, the test leader verifies that the meteorological forecast and the prevailing meteorological conditions enables for a successful trial. The test leader also consults the TS-T to verify that it seems feasible from an operational ATM perspective to mix arriving traffic via RNP-AR approach with ILS approach. ATS Arlanda´s schedule for RWY maintenance are also checked so that there is no known maintenance scheduled. Furthermore, the CFMU flight lists are reviewed to determine that the flight trial is executed in an off-peak traffic schedule.
Once all these parameters are checked and allow for initiation of a flight trial, the test leader initiates the flight trail by calling ATS Landvetter and informs that e.g. SAS158 with IOBT at 0835 UTC is chosen as a Green Connection flight trial. The tower at Landvetter then calls the flight crew to inform that they will perform a Green Connection validation flight. This trigs the flight crew to setup and follow a pre agreed flight scenario.
Malmö ATCC, Stockholm ATCC and Arlanda ATS are also informed in advance that the specific SAS flight is executing a Green Connection validation flight. Each controller participating in the validation environment can refer to a predefined operational description of how to handle the flight.
5.1.1.3 Sequence of actions in the trial
Table 5 describes the sequence of actions in the validation exercise
Step number
Starting actor Receiving actor Description Difference compared to
standard operations
1 Test leader APP-C / TS-T Test leader talks to APP-C about If it’s possible to start trial with e.g. SK158
No such dialog takes place – aircraft are handled as they arrive in the ATCC’s airspace.
2 Test leader Landvetter ATS Test leader call ATS Landvetter and informs that
In normal situation - no such dialog takes place –
00.00.10
42 of 85
3 Landvetter ATS
Flight crew of SK 158
Landvetter ATS radios flight crew and inform that their flight is chosen as a Green Connection validation flight.
Normally the clearance is provided via datalink and no voice communication exists during this phase.
4 Flight Crew SK 158
Flight crew SK 158
Flight crew performs extended FMS setup and prepares for trial.
Normally the FMS setup is done at this stage but speed restrictions below FL100 is not deleted and the actual STAR is normally not entered/executed until clearance are received in a later phase.
5 Flight Crew SK 158
ATC in general Flight crew uses an amended call sign (adding “green connection trial” at the end of the original call sign) reading “Scandinavian 158 green connection trial” This is done do highlight for every ATM actor that this is a validation flight.
Only applicable for validation flights
6 Test leader ESMM Test leader calls ESMM and informs that SK158 with departure time 0835 UTC is a green connection trial flight. It gives the designated controller time to review the OMA (ATM operational description concerning the validation).
No such dialogue normally takes place.
7 Test leader ESOS Sector 3 Approx. 5 minutes after departure test leader takes position next to controller of ESOS sector 3. Test leader supports the controller with validation details and can answer questions on the anything concerning the trials.
No such dialogue normally takes place.
8 Test leader ESOS APP-C Approx. 10 minutes after departure test leader discuss with APP-C on the possibility of providing a shortcut to SA915. Before deciding on the matter, the arrival sequence that Arrival Manger (MAESTRO) calculates is verified.
No such dialogue normally takes place.
9 APP-C ESOS sector W APP-C verifies the possibility on providing shortcut to SA915 with ESOS Sector W, since scheduled departures from rwy 19R may interfere with the direct routing.
10 APP-C Sector 3 APP-C verifies the possibility on providing shortcut to SA915 with ESOS Sector 3,
11 Test leader APP-C Decision on shortcut is taken by APP-C and Test Leader jointly.
No test leader is available under normal operations
00.00.10
43 of 85
12 SK158 ESOS Sector 3 When SK158 checks in with ESOS sector 3 they are given inbound clearance to rwy 26 at Arlanda via ELTOK1H
Normal inbound clearance is eltok2v followed by ILS
13 ESOS Sector 3
SK158 If APP-C decision on shortcut was OK – ESOS Sector 3 provides SK158 with the shortcut as soon as possible (in order for SK158 to use the most optimum ToD)
If decision was not to provide shortcut, SK158 will continue as filed
Once shortcuts are possible, ATC always try to provide these as soon as possible.
14 Test leader ESOS Sector W As the trial flight SK 158 is handed over to the next sector, the test leader takes position with the next sector
No test leader is available under normal operations
15 ESOS APP-C ATS Arlanda Approx. 15 minutes before arrival, ESOS APP-C informs ATS Arlanda that SK158 is a green connection trial and will fly ELTOK1H RNP-AR approach to rwy 26 at ESSA.
Normal operation
16 Test leader ESOS Sector E As the trial flight SK 158 is handed over to the next sector, the test leader takes position with the next sector
No test leader is available under normal operations
17 ESOS Sector E
ATS Arlanda TWR
Trial flight is handed over to ATS Arlanda TWR approx...on a 10 nm final.
Normal operation
18 ATS Arlanda TWR
ATS Arlanda GND
After landing and vacating the RWY traffic is handed over to ATS Arlanda GND
Normal operation
Table 5 - Sequence of events for a Green Connection Trial
00.00.10
44 of 85
5.1.1.4 Test leader log
When organizing the validation exercise a test leader log (Figure 29) was created to be used by the test leader for the recording of flight data from the gate to gate trials.
The test leader log was used to record all necessary data and events that occurred during the flight trial. In addition, it was used by the test leaders as a checklist to ensure that all necessary preparations and actions took place prior to, during and after the validation exercises.
AIRE Green Connections Flight Trials - Test Leader log25 gate to gate ESGG ESSA
DATE:
Test Leader:
SAS OPS, Peter L ´0709-9972624 OMA REF Gunnar Olsson 0768-794583
Landvetter ATS 031-941139 Patrick manzi 070-9227408
Göteborg TMC Lars Rappich 070-4592210
Niclas Wiklander 0709-941145
Malmo ACC ESMM 2011-11-30
Arlanda ATS
Flight Number
ETD (CFMU)
Aircraft Type
Tail Nr.
SSR Code
ESGG RWY IN USE (03/21) / SID
ESSA STAR/RWY IN USE
ACTUAL TOT
SHORTCUTS ON DEPARTURE
(time/to wpt)
Cruise FL
SHORTCUTS ENROUTE (time/to
wpt)
ETA (CFMU)
Wind information(from Grid)
Max Arrival Rate, ARN (Maestro)
SHORTCUT ON STAR (time/to wpt)
Actual landing time
Number of aircraft vectored/total
delay imposed
Controller Questionairre filled out?
Flight Number
Comments
PILOT QUESTIONEER SENT TO
PETER LARSSONSTAR
4DT
PRINTED OUTCIES DATALINK MSG
Figure 29 Test Leader log used during Green Connection Trials
00.00.10
45 of 85
5.1.2 Airspace User handling of trial
5.1.2.1 Departure and climb out
When the pilots are informed that they are about to perform a validation flight, an extended FMS setup to meet the flight trial scenario will be performed. These are some of the FMS settings applicable to the trial flight. Since the FMS is downlinking the 4DT data along the whole flight mission the route of flight is executed all the way until landing to prevent any FMS discontinuity.
Figure 30 Standard Instrument Departure route from Runway 21 at Landvetter
Runway 21 is the most common RWY used for departure at Göteborg Landvetter Airport. When RWY 21 is used, SID LABAN2J is applicable for departure. Due to current environmental legislation, the SID needs to be followed until reaching 10.000ft. The climb phase will be performed as a continuous climb at aircraft preferred climb speed as long as traffic situation permits.
5.1.2.2 Enroute
Optimum cruise level (calculated by FMS) will be flown en route. After passing LABAN the flight will proceed (red line) via N872 ARS Y36 ELTOK.
The latest ATIS (Automatic Terminal Information Service) is uplinked to aircraft, informing pilots about meteorological conditions, operational procedures and aerodrome equipment status at destination aerodrome. The latest descent winds experienced by prior aircraft in the relevant quadrant of the TMA is up linked to aircraft in order to enable the most optimized descend profile.
00.00.10
46 of 85
Figure 31 en-route chart showing Green Connection flight's route between Gothenburg and Stockholm
When aircraft reaches waypoint DETSO an initial assessment is made by ESOS sector 3 and ESOS APP-C to determine whether it is possible (based on current arriving sequence) to provide a shortcut from the current en route position direct to SA915, located along the RNP-AR arrival. If this is feasible, aircraft crew will be informed about this as soon as possible, timely for the aircraft crew to execute the updated route into the aircraft FMS that subsequently recalculates the ToD point, which allows for an optimum vertical profile during descent.
Figure 32 Possible shortcuts from en-route to the terminal area
During descent, an automatic ETA/ELDT progress report will be downlinked from the aircraft to the airline system (HERMES) and forwarded to airport systems (SAFIR) in order for ground handling to provide most efficient ground operations. SAFIR get this report together with other ETA/ELDT reports from E2K and radar systems.
00.00.10
47 of 85
5.1.2.3 Arrival
After passing ELTOK, the newly developed RNP-AR approach will be flown. Flying this approach will generate a track distance savings of 11 NM compared with the existing closed P-RNAV STAR (ELTOK2V) and approx. 8 NM compared with the average traffic being vectored for the ILS approach, resulting in an estimated fuel burn reduction of 40-60kg and a reduction of CO2 emissions of approx. 120-180kg. Concerning altitude and speeds, the only restriction along ELTOK1H is a not below altitude at SA501.
Figure 33 Final design of RNP-AR Arrival to Runway 26
5.2 Arrival ARN Validation
The second category of trials “arrivals into ARN” refers to the 75 trial flights that have been validated from ToD to landing at Stockholm Arlanda Airport. Any SAS 737NG arriving via the west entry point are subject to being a trial flight. Flights from Oslo (ESNO), Bergen (ENBR), Dublin (EIDW), Manchester (EGCC), and Gothenburg (ESGG) represented the vast majority of the flights that were validated.
Arriving flights from the west entry TMA point into Stockholm Arlanda Airport are validated from ToD until landing.
Figure 34 Graphic description of 75 "other" flights via RNP-AR approach
Table 6 Pictorial description of "validation" flights
5.2.1 ATM Handling
The trial flights validating the arrival phase were carried out without test leader. The trials were initiated by APP-C in coordination with sector 3 and sector west controllers.
00.00.10
48 of 85
The target was to offer the RNP-AR arrival into Stockholm Arlanda to aircraft crew as early (far out) as possible. This would allow for most optimum ToD point followed by a continuous descent and the short RNP-AR arrival into Stockholm Arlanda.
5.2.2 Airspace User Handling
SAS pilots were informed via company message that a new arrival procedure into Stockholm Arlanda was implemented and subject for validation. All SAS pilots on the 737NG fleet are trained for RNP-AR operation. No additional briefing was given to pilots participating in the arrival validation.
Since the arrival ARN category affects traffic from more than one departure station, a large number of pilots are subject to participate in the validation and most pilots will only participate once. This makes validation exercise slightly more challenging.
We noticed some difficulties especially in the beginning of the trial period that pilots were not familiar with the new arrival procedure and not used the published approach charts describing the new procedure. A fundamental difference from a normal STAR that are terminated by an ILS approach is that those flight procedures are described at two separate plates (one for the STAR and one for the ILS). However, the new procedure is described at one plate (STAR + RNP-AR procedure on the same plate). This appeared to confuse pilots.
At a few occasions, it was not clear to the pilots that the new STAR was actually being terminated with an RNP-AR approach instead of on ILS approach until a very late stage. A few of these trials were cancelled and vectored for the ILS instead.
00.00.10
49 of 85
6 Analysis description
6.1 Data capture and distribution for analysis
6.1.1 4 dimensional trajectory data:
During the gate to gate trial flights, aircrafts was continuously downlinking its 4DT during the entire flight mission. The data was indexed and stored in CIES. The 4DT data was periodically collected from the CIES system and forwarded to RCF, responsible for performing the 4DT analysis.
6.1.2 PBTM, trajectory simulations:
The trajectory simulations have been processed by GE based on input information from SAS. The produced trajectories have been forwarded to RCF for further stability analysis.
6.1.3 Flight data recorder, FDR data:
All SAS 737NG aircraft are equipped with a Flight Data Recorder, FDR that records and stores all relevant flight information. On regular basis the information from the FDR:s are downloaded to SAS system department for analysis. SAS fuel and efficiency department have performed the fuel and emission analysis.
6.1.4 Radar plots:
For reference, all the performed gate to gate trial flights have been traced via historical radar plots for reference in the vertical and lateral plane. This information has been forwarded to RCF who performs the trajectory stability analysis.
6.2 Fuel and emission analysis
A total of 122 flights were involved in the trial, but 22 of these were not completed as trial flights, which leaves 100 completed flights for analysis. To calculate the savings achieved, the trial flights were compared to reference groups of similar non-trial flights into ARN RWY 26 performed during the same period. The 22 discontinued trial flights were deleted not only from the trial flights but also from the reference groups.
Flight recorder data was missing from 9 of the 100 completed flights. For 22 of the remaining 91 flights having flight recorder data the Delta Burn Arrival (DBA) logic (ref Appendix 1) was unable to calculate the DBA values. Thus, the DBA analysis could be performed on 69 flights. However, other measures based on flight recorder data could be calculated also for the 22 flights without DBA values.
Among the 100 trial flights with completed RNP approach to Stockholm Arlanda Airport RWY 26 there were:
29 Green Connection gate-to-gate flights ESGG-ESSA. Flight recorder data was available for 27 of these and the DBA analysis could be performed for 15 flights.
43 flights from ESGG (including the 29 gate-to-gate flights). Flight recorder data was available for 41 flights and the DBA analysis could be performed for 26 flights.
33 flights from ENGM. Flight recorder data was available for 29 flights and the DBA analysis could be performed for 22 flights.
24 flights arriving via ELTOK from a mix of departure stations other than ESGG and ENGM (ENBN, EIDW, EGPH, EGCC and ENVA)
The analysis soon found that the improvement due to the shorter RNP approach was less for flights from ESGG compared to flights from ENGM and it was realized that arrival direction had an impact on the improvements achieved. Thus, the effect of the RNP approach was finally evaluated with the material split into four groups of arrival directions ranging from SW to NW and trial flights were only compared with non-trial flights arriving from the same direction. Using this methodology, all trial flights with data could be included in the analysis independent of their different departure stations.
00.00.10
50 of 85
The gate-to-gate trials were evaluated on a number of other parameters in addition to the DBA values. These additional parameters were: Total ground and air distance from ESGG RWY 21 to ARN RWY 26, taxi out fuel, Delta Burn Departure (DBD), taxi in fuel and taxi in time.
In the analysis, all fuel savings are expressed in "kilograms of fuel". Savings in CO2 are obtained by multiplying the fuel numbers by 3.15.
More detailed results of the analysis are provided in Appendix 1
6.3 Conformance monitoring and trajectory stability analysis
4D trajectory data transmitted over ACARS were received for 29 gate-to-gate flights.
Radar plots data were received for 31 gate-to-gate flights.
GE Aviation 4D trajectory data from PBTM were received for 27 gate-to-gate flights.
All these data were checked for integrity (typically errors in format) and completeness (missing information). Some shortfalls were identified such as additional null position inserted in the trajectory when flight is vectored, airport reference points included in the list, broadcast while taxing out which induced wrong ETA at destination, and the parsers adapted accordingly (e.g. skipping records).
Ultimately:
29 gate-to-gate flights were processed based on 4D trajectory data transmitted over ACARS, representing a total of 526 4D trajectory broadcasts and over 7500 trajectory change points
25 flights were processed based on Radar plots data associated with ACARS data, representing over 13 000 radar time-tagged plots
27 flights were processed based on GE Aviation 4D trajectory data from PBTM, representing a total of 207 4D trajectories and over 3800 trajectory change points
Over 200 charts, spread-sheets and figures were generated, and used to review findings, rework and adjust the STB tool, assess trends, clusters and patterns, and analyse conformance and stability figures.
6.4 Preferred Business Trajectory Processing
The PBTM was used to generate predicted trajectory data for 27 gate-to-gate flights. This data was provided by SAS through the worksheet template discussed in Chapter 3.4.3.
Due to the nature of some of the events in the business trajectory cycle, not all information necessary to perform a trajectory prediction was available. Specifically the Timetable event can occur several months before the actual flight and thus has some missing data that cannot be known in advance. In these cases/events, some assumptions had to be made.
The SAS flight planning system assumes the worst case scenario for longest route length by using runway 21 and the LABA2J SID for departure out of ESGG. So this information was used if no runway and/or SID was specified. It was also only possible to obtain the assigned departure runway but not the SID. For all flights, this was actually runway 21 so the LABA2J SID was assumed as well.
The Zero Fuel Weight (ZFW) and Fuel weight had to be estimated for the Timetable events of all flights and for most of the Flight Plan Filed events. These estimates were based on SAS’ loadsheet statistics and differed by aircraft type.
The Cruise FL and Cost Index were not known at the Timetable event but those values did not change throughout all of the other events. For this reason, the same numbers were used to generate the predicted trajectory at this particular event.
The PBTM processed all events if data was available although only events up to takeoff were actually of interest. This was done to consider some “what if” scenarios. For instance, the Wind Uplink event always occurs after takeoff. However, wind data is important to the FMS to provide more accurate predictions. The same is the case for the STAR and/or Approach procedure at the arrival airport which is generally not known until after the takeoff event either when the aircraft enters the airspace. For that reason, the predicted trajectories may vary significantly from the actually flown (and downlinked) ones as well.
00.00.10
51 of 85
Making the STAR and/or Approach procedure available to the FMS prior to takeoff may not be feasible but one of the conclusions from the trajectory analysis could be to recommend providing at least the wind data to the FMS earlier.
00.00.10
52 of 85
7 Results
7.1 Quantitative Results
7.1.1 Fuel Savings Gate to gate trials
Gate to gate trials saved 37 kg of fuel with the biggest saving from the RNP-approach itself. Small savings were also obtained in the departure airborne phase and arrival taxi in phase.
0
50
100
150
200
250
300
350
400
Kg
DeltaBurnArrival (airborne) at ARNArrivals RWY 26 (from GOT) only - Corrected for tailnumber
Non-trial flights
Gate to Gate
0
20
40
60
80
100
120
140
Kg
Taxi-in fuel at ARNArrivals RWY 26 only - No correction for tailnumber
Non-trial flights
Gate to Gate
0
20
40
60
80
100
120
140
160
180
Kg
DeltaBurnDeparture at GOTDepartures RWY 21 (to ARN) only - No correction for tailnumber
Non-trial flights
Gate to Gate
0
50
100
150
200
Kg
737 Taxi-out fuel at GOTDepartures RWY 21 (to ARN) only
Non-trial flights
Gate to Gate
- 4 kg+ 1 kg
- 33 kg - 7 kg
Figure 35 Fuel savings on gate to gate trials
See Appendix 1 for details
7.1.2 Fuel Savings RNP-APP trials from any origin
For flights from GOT the effect of the shorter RNP approach was a fuel saving of 28 kg (average) with 23 kg coming from shorter track and 5 kg from more efficient vertical profile (including the speed dimension). This saving corresponds to 1.5 % of the average total fuel burn on the ESGG-ESSA route.
For flights from ENGM the savings were greater: 51 kg per flight totally, with 34 kg coming from the shorter track and 17 kg from the vertical profile. This saving corresponds to 2.7 % of the average total fuel burn on the OSL-ARN route.
The total effect of the shorter RNP approach (all trial flights independent of departure station) is estimated at 38 kg per flight.
The flights were also grouped together depending on arrival direction and the savings ranged from 31kg to 62kg.
00.00.10
53 of 85
Arrival
direction
Number of
trial flights
Number of
non-trial
flights
DBAa DBAah DBAav
238 - 250 36 182 31 23 8
260 - 272 4 11 31 28 3 few data points !
274 - 286 27 324 46 33 13
310 - 322 2 9 62 26 36 few data points !
38 27 10
Improvement (kg)
Weighted average(weighted by number of trial flights)
Figure 36 Fuel savings - detailed breakdown
Most of the savings were derived from shorter flown track - increased horizontal efficiency (DBAah). Note that the weighted average of 38 kg fuel would have been very different if the main arrival direction was from northwest rather than southwest.
See Appendix 1 for details.
7.1.3 Track Mile Savings
While the nominal track shortening of the new RNP procedure is 11NM, the data shows that the difference between the average trial flight and the average non-trial flight was only 6 NM.
The explanation lies in the fact that not all flights fly the full procedure due to shortcuts provided on a tactical basis. The frequency and efficiency of these shortcuts varied between the trial flight and the non-trial flights. Due to an ambition to provide shortcuts to trial flights well before Top Of Descent, and not later, the trial flights may have received shortcuts less often than the non-trial flights. Furthermore, due to procedure requirements, the non-trial flights could often be provided with more efficient shortcuts than the trial flights. The pictures below illustrate the situation.
00.00.10
54 of 85
The efficiency of both trial and non-trial
flights is affected by shortcuts provided
on a tactical basis.
Non-trial flights could receive effective
shortcuts to a higher degre than the trial
flights. This will somewhat ”dilute” the
effect of the shorter approach pattern.
59,6
59,8
60,0
60,2
60,4
15,5 16,0 16,5 17,0 17,5 18,0 18,5La
tLong
Tracks from OSL
ELTOK
ERKEN
DepARP
ArrARP
Ref Flight
Flight 103
Flight 24
Non-trial A
Non-trial B
Non-trial C
59,0
59,2
59,4
59,6
59,8
60,0
15,5 16,0 16,5 17,0 17,5 18,0 18,5
Lat
Long
Tracks from GOT
Flight 35 Flight 28
Arrival direction
Why is improvement better from OSL thanfrom GOT?
Improvement (kg) relative non-trial flights
DBAa DBAah DBAav
Flights from GOT 28 23 5
Flights from OSL 51 34 17
Thus, for flights from GOT the average efficiency of non-trial
flights will be improved by shortcuts - to a higher degree than
for flights from OSL.
Effective shortcuts
for non-trial flights.For flights from OSL there is less
potential to provide shortcuts to
the normal STAR.
Due to the geometry of the arrival
pattern, the potential of such shortcuts
is greater for flights arriving from GOT
than for flights arriving from OSL.
Figure 37 Description of why Oslo arrivals saved more than Gothenburg arrivals
57
58
59
60
61
9 10 11 12 13 14 15 16 17 18 19 20 21
Lat
Long
From GOT
From OSL
From TRD
ELTOK
Arrival direction This graph further illustrates the potential of shortcuts depending on arrival direction.
Flights from OSL have little potential for receiving shortcuts.
Thus, the shorter track of the new RNP procedure has a
greater impact for flights arriving from the OSL direction.
Due to shortcuts, non-trial flights from TRD and GOT will
often fly a shorter track than the full STAR via ELTOK. Thus,
the effect of the new RNP will be less when trial flights are
compared to the average of the non-trial flights.
Figure 38 Further description of GOT vs Oslo flights
See Appendix 1 for details.
00.00.10
55 of 85
7.1.1 Accuracy and stability
7.1.1.1 General
A reference flight plan was defined for the gate-to-gate flights between Göteborg and Stockholm, departing from RW21 and arriving RW26 via the newly released ELTOK1H RNP-AR procedure. That flight plan served as inputs to GE’s PBTM tool, as well as SAS for FMS initiation during the flight trials.
Nevertheless, all flight trials didn’t exactly follow that reference flight plan as some of the flights were granted shortcuts. Also, for some of the flights, the trajectories featuring ELTOK1H STAR were broadcast lately.
This results in several iterations of the 4D trajectories being simulated by the PBTM tool on the one hand, and computed and downlinked by the FMS on the other hand. Hence, statistical analyses were affected and more effort was required to better understand the discrepancies in the figures between predicted and actually flown values.
The following table summarizes for each of the 29 gate-to-gate trial flights:
Which flights were also simulated by GE’s PBTM tool (“PBTM” column)
Which flights were associated with radar plots (“Radar” column)
Which flights received wind updates (“Wind Up” column)
Which downlinked trajectory contains STAR information first (“STAR Up” column)
Which downlinked trajectories were updated due to shortcuts (“Shortcut” column)
Which downlinked trajectory holds last TOC information (“Last TOC” column)
Which downlinked trajectory holds last ToD information (“Last ToD” column)
Number of valid trajectories on total number of downlinked trajectories for that flight (“Valid / #” column)
3 of the 29 flight trials were finally cancelled (#6, #8 and #9). Their relevant data were still processed in order to have enough sample data.
As can be read in the table below, flight #1 was also simulated by the PBTM tool, radar plots were associated, wind updates received, STAR was entered right from the 1
st downlink, the 6
th and 10
th
trajectories downlinks were modified due to shortcuts, hence different from 5th and 9
th downlinks, the
first shortcut received prior to TOC (8th downlink still contains TOC), and second shortcut received
between TOC and ToD (11th downlink still contains ToD). 18 downlinks out of 19 were valid and
processed.
Flight #
PB
TM
Rad
ar
Win
d U
p
ST
AR
Up
Sh
ort
cu
t
Last
TO
C
Last
To
D
Valid
/ #
1 Y Y Y 1 6, 10 8 11 18/19
2 - Y - 1 5, 9 9 10 15/18
3 - Y - 1 5, 10 8 13 17/21
4 Y Y Y 9 10, 12 8 10 9/18
5 - Y - 11 5, 10, 11 7 9 13/16
6 - Y - 1 9 7 11 14/18
7 Y Y - 1 5, 7 7 10 14/16
8 - Y - 1 5, 7 7 8 13/17
9 - Y - 1 - 8 9 15/17
10 Y - - 1 - 6 10 18/19
11 Y Y - - 6, 7, 11, 12
7 12 18/19
12 Y Y - 7 5, 7 6 9 17/18
13 Y Y - 7 12 8 13 15/22
00.00.10
56 of 85
Flight #
PB
TM
Rad
ar
Win
d U
p
ST
AR
Up
Sh
ort
cu
t
Last
TO
C
Last
To
D
Valid
/ #
14 Y Y - 9 9 8 9 12/17
15 - Y - 10 10, 11 9 10 14/19
16 Y Y - 6 - 7 10 15/18
17 Y Y - 7 10 8 9 11/18
18 Y Y - 6 9 8 9 11/17
19 Y Y - - 5, 7 8 10 17/18
20 Y Y - 5 6, 10 8 10 14/18
21 Y Y - 4 - 7 9 13/17
22 Y Y - 1 - 10 11 15/20
23 Y Y - 7 11 8 10 13/18
24 Y Y - 9 9 8 9 17/18
25 Y Y - 1 - 8 9 14/18
26 Y Y - 1 - 7 10 11/18
27 Y Y Y 1 - 7 8 9/17
28 Y Y - 6 5, 13 7 11 15/19
29 Y Y - 9 9 7 9 14/18
Table 7: Summary of the 29 gate-to-gate trials
Trajectory rows in bold were used for the illustrations in the paragraphs below.
00.00.10
57 of 85
Accuracy in the time domain
A typical Time Conformance Monitoring graph for a gate-to-gate flight trial is provided Figure 39.
Figure 39: Typical Time Conformance Monitoring graph (flight trial)
As shown, the first 4 “boxes and whiskers” depict the ETA distributions along the set of trajectory change points defining the trajectory while the aircraft was standing at Göteborg and the FMS keeps updating the ETA. After take-off, the predictions stabilise and ETA predictions over the different trajectory change points (TCP) are measured (compared with actual radar plots time tags) within 15-second windows. Median value for prediction accuracy over each TCP is 9 seconds.
A typical Time Conformance Monitoring graph for a gate-to-gate PBTM simulation is provided Figure 39.
Figure 40: Typical Time Conformance Monitoring graph (PBTM predictions)
As shown, predictions become more and more accurate (compared with actual radar plots time tags) as time to take-off approaches (Traj#1 to Traj#6). Nevertheless, even the predictions based on information provided 1 month before take-off (Traj#1) remain within a 2-minute window and are close to predictions based on information provided 1 day before take-off (Traj#2). An hour prior to take-off (Traj#3) trajectory is refined and accuracy figures drop to 1-minute window. After take-off (Traj#7) figures are updated with correct runway in Arlanda and flight parameters, accuracy drops slightly to less than 1-minute window. Median value for prediction accuracy over each TCP is 39 seconds.
Note that the 19-minute offset is due to difference between predicted take-off time and actual take-off time.
The table below summarises the performance of the PBTM predictions over time.
Time Accuracy Median Value Accuracy Window
1 month before (TRAJ#1) -18.29 minute 1.86 minute
00.00.10
58 of 85
1 day before (TRAJ#2) -18.47 minute 0.55 minute
1 hour before (TRAJ#3) -18.72 minute 1 minute
30 min before Take-Off (TRAJ#4)
-18.70 minute 1 minute
20 min before Take-Off (TRAJ#5)
-18.63 minute 1 minute
2 min before Take-Off (TRAJ#6) -18.63 minute 1 minute
After Take-Off (TRAJ#7) -18.52 minute 0.95 minute
During Cruise (TRAJ#8) -18.52 minute 0.95 minute
Aligned with RWY (TRAJ#9) -18.52 minute 0.95 minute
Table 8 PBTM predictions over time
As can be read, the 4D trajectories can be predicted within 2 minutes a month prior to take-off, provided actual take-off time conforms to the initial time.
00.00.10
59 of 85
7.1.1.2 Accuracy in the geometric domain
A typical Geometric Conformance Monitoring graph for a gate-to-gate flight trial is provided Figure 41.
As shown, most median cross track distances calculated over the predicted trajectory change points locations are measured (compared to the actual position of associated radar plots) within 2.193 mile distance (median value for geometric accuracy = 0.14Nm).
A typical Geometric Conformance Monitoring graph for a gate-to-gate PBTM simulation is provided Figure 42.
As shown, geometric predictions have a stable accuracy measured (compared to the actual position of associated radar plots) within a 4.4 Nm window, median value of 3 Nm (Traj#1 to 6). The geometric predictions accuracy median value then falls to 1.7 Nm after take-off (Traj#7)
00.00.10
60 of 85
7.1.2 Stability in the time domain
A typical Time Stability Monitoring graph for a gate-to-gate flight trial is provided Figure 43.
Figure 43: Typical Time Stability Monitoring graph (flight trial)
As shown, the time predictions stabilise within a 1-minute window.
Looking into global stability (and actual accuracy) of the 29 flight trials, statistic figures were computed on the stability of ETA predictions at ToD and at RWY threshold as depicted Figure 44 and Figure 45.
Figure 44: ToD predictions stability and accuracy (flight trials)
As shown Figure 44, all median values for ToD ETA predictions have a better than 2-minute accuracy (median value = 8.5 seconds), and over 75% of the flights have their ToD predictions stable within a 30-second window. Flights #14, #15 and #16 show the largest distribution (instability of the predictions with a 5-minute window) due to late changes or multiple changes in the definition of the STAR.
00.00.10
61 of 85
Figure 45: RWY predictions stability and accuracy (flight trials)
Similarly, 96% of the flights had their RWY ETA predictions accurate ±1 minute (median value = 13 seconds), 80% of them showing stable values within a 1-minute window (median value = 35 seconds). Flight #13 shows the largest distribution (instability of the predictions with a 2-minute window) due to large short cut provided 30 minutes prior to landing.
7.1.2.1 Influence of STAR updates
STAR updates affect both the stability and accuracy of the trajectory predictions both in the time and in the geometric domains. Whereas not-updated trajectories show figures in the order of magnitude of 2 minutes, updated ones “stick” to the plan with figures in the range of 30 seconds.
The figures below illustrate the different STAR configurations experienced during the trials.
Figure 46: STAR Update Effects
7.1.2.2 Influence of shortcuts
Shortcuts, at least those provided prior to ToD, affect mainly the stability of the trajectory predictions both in the time and in the geometric domains. They do not affect the accuracy of the predictions which maintains a 30-second median value for ETA at RWY. Indeed, the stability is impacted since new values are computed and then broadcast on the following downlink. Nevertheless, these computations are accurate and little changes are visible on next downlinks.
Figure 47 below illustrate the different shortcuts provided during the flight trials, and actual path flown. Two shortcuts configurations have been used. Compared to the reference trajectory (depicted TBD) going north-east during climb, then east and to ELTOK1H:
00.00.10
62 of 85
-One went directly east to ELTOK1H (top figures)
-The other east of ELTOK on ELTOK1H north of Arlanda (bottom figures)
Figure 47: Shortcuts: trajectories generated (green), actual path flown (orange)
7.1.2.3 4DT and flight planning
There was a struggle to carry out a significant statistical analysis based on the fact that there were only 29 gate to gate trials and a number of different trial configurations (trajectory definitions, wind updates, STAR updates, shortcuts provided). However, options taken in developing the STB toolkit using “boxes and whiskers”, graphs and other Google-Earth™ based representations allowed the generation of median and mean values and analyse discrepancies in the data collected and generated.
Based on this analysis, it was seen that trajectory predictions are very accurate in the time and the geometric domains. The trajectory information was accurate to the order of 10 seconds and fractions of nautical miles provided that correct information was provided as early as possible. That information includes the actual STAR and wind information as well as shortcuts.
The PBTM predictions also show accurate and stable figures in the time and in the geometric domains. The PBTM predictions were accurate to the order of 2 minutes and 2 nautical miles up to a month prior to take-off provided the assumed take-off time is correct (otherwise an offset is observed). Figures are refined as the correct STAR and RWY are entered and wind information updated.
Figures versus KPI (D1): Accuracy and stability <30 seconds:
Gate-to-Gate Flights ToD predictions (seconds) Runway predictions (seconds)
Median 8.4 13
00.00.10
63 of 85
Mean 15.6 6.5
Amplitude median 27 21
Amplitude mean 68 42
Table 9 Gate to Gate KPI values
7.1.3 Operational acceptability
Controllers: During and after the trials, the test leader discussed with the controllers involved in the trials to get their perspective of the trials and how this would affects their working situation. In general, the feedback is very positive and currently this works fine in low traffic density. However, system updates on the arrival manager is required to make this work in medium and low traffic density. Additional system support for extended coordination in between sectors and operational status will also be required,
Pilots: All pilots that participated in a trial were provided with a questionnaire in which they were asked to provide their perspective of the trials. The answers of those questionnaires are presented in section 7.2.3.1 In general the pilots are very positive to the trials and the new designed procedure is significantly reducing the environmental impact, cost for operators as well as flight time.
00.00.10
64 of 85
7.2 Qualitative Results
7.2.1 ATM perspective
7.2.1.1 General
During the Green Connection trials ATCOs at Stockholm ATCC generally has had no difficulties to handle traffic flying the short RNP-AR approach as they were mainly carried out in off peak situations.
Prior to the trials at Arlanda a short education of the approach controllers was carried out. Focus was on the differences with a RNP-AR approach versus traffic flying a normal ILS approach. The importance to highlight the specific RNP-AR flight in to the ATM system was underlined.
In the ATM world flights acting, in an ATCOs perspective, in a different way always demands some extra effort and energy. Almost all traffic, until now, flying in to Stockholm/Arlanda are doing ILS approach with about 10-12 Nm final before touch-down. However, an RNP-AR approach that intercepts the final track at about five Nm from the RWY differs significantly. Not only is the normal judgement used by the ATCOs for spacing on final changed. A flight doing a RNP-AR approach like the here described ELTOK1H can furthermore not late in the approach phase, inside about 20 Nm from touchdown, been given a minor adjustment of the lateral path without cancelling the whole RNP-AR approach. In such a situation vectoring for an ILS approach has to be given instead. This prolongs the flight by at least approximately 8-10 Nm on a low altitude. If visual approaches were approved at Arlanda this prolonging could be significantly reduced.
Furthermore it is a well-known fact that ATCOs are more hesitant to interfere (i.e. give vectors for spacing) with flights on closed approaches like P-RNAV and RNP-AR compared to traffic flying on a so called open STAR. ATCOs two most used tools to enable separation and high throughput in to an airport is to use both speed control and radar vectors. When controlling flights on closed STARs, the only remaining tool is speed control. This can put the controller in to a position where he/she can feel tied back. In some situations this can leave traffic being on a closed STAR with an advantage as the ATCOs instead prefers to vector traffic doing an open STAR followed by an ILS approach slightly longer.
One key factor to enable the use of more RNP-AR STARs in the future is that the ATM system in a clear and easy way for the ATCO can show which STARs all the involved flights are flying. Today’s Eurocat system does not clear enough support having a number of different STARs for each entry point. A number of hands on coordination’s have to be done to clearly mark a RNP-AR flight from the rest (doing an ILS). The risk of misunderstanding is obvious.
The AMAN has to be improved since it does not support a large variability of distance flown in the TMA. During the trials three different STARs were used from the entry point ELTOK to RWY 26. ELTOK1H (RNP-AR), ELTOK2V (P-RNAV closed STAR) and ELTOK2T (Conventional open STAR).
The overall possibility to do higher amounts of RNP-AR flights will increase when more AU and aircraft types will be RNP-AR approved.
For ATCOs the monitoring of aircrafts on fixed routes/closed STARs, like a RNP-AR approach, is a major workload when it comes to the separation to other aircrafts. The uncertainness of aircrafts different flight management like descent and speed profile significantly increases the workload compared to traditional radar vectoring.
Down linked ADD (IAS, actual winds, RoD, speed schedule) would increase predictability and decrease workload for controllers.
At some occasions during the trials pilots have encountered an uncertainty whether the by ATC given inbound clearance (ELTOK1H) means a RNP or an ILS approach. The number of misunderstandings decreased after some extra information from SAS was sent out to the pilots. After all it should be looked upon whether the R/T used and the design of the plates for the pilots needs to be further developed.
00.00.10
65 of 85
7.2.1.2 Combining RNP-AR and ILS approaches on final
One of the reasons for ATCOs being hesitant to mix traffic flying a short RNP-AR approach and traffic flying a normal ILS approach is that the traffic joins the final at a significant different distance. Traffic flying the ELTOK1H joins the final at distance app. 5 Nm and traffic being radar vectored typically joins at distance 10 Nm.
When doing the final sequencing within the TMA approach controllers are used to measure distance of traffic from one fixed point. That point is normally located on app. 10 NM final. Apart from the measured distance to that fixed point controllers as well take other factors in consideration like aircraft type, wind and airlines traditional tactical behaviour etc. After the approach controller has done the sequencing of traffic and given headings and speeds to the concerned aircrafts the controller then constantly monitors the situation. A small adjustment on headings and/or speed is then later given when needed.
Although the trials in general was conducted during off-peak at a number of occasions the approach controller ended up in a situation where up to five flights came in for landing at more or less the same time. The controller then found him-/herself having to judge how to sequence the flight doing the RNP-AR approach (short final) with the rest of the traffic doing an ILS approach.
For a controller, apart from the safety aspect, one of the main tasks is to share the delay evenly for all traffic. When all traffic is joining final at more or less the same point the delay sharing is no major concern for an approach controller as this is “normal operation”. With RNP-AR approaches arriving into the traffic flow and with no possibility to make small lateral adjustments for these flights, the controller finds difficulties to make fair delay sharing. As mentioned above the controller could in some situations end up leaving traffic on the RNP-AR approach and give that flight a short approach on the same time that a number of other arriving flights will be vectored behind leaving the total flown track miles for all the concerned flights higher.
To make correct judgement of “distance to go” to touch down for flights on the RNP-AR markings every second Nm from the thresh hold up to distance 16 Nm was done on the radar map. That helped the approach controller to evaluate the traffic situation and do sequencing. Improvements like showing the distance to touch down for traffic being on a closed STAR in the radar label should be beneficial to increase the possibility to mix traffic RNP-AR and ILS traffic in the future.
7.2.1.3 ATM system support
The importance to highlight the specific RNP-AR flight in to the ATM system was underlined. For the flights performing an RNP-AR approach, a new marking into the E2K label was introduced. That marking had to be entered manually by the ACC controller. An overall improvement of the ATM system concerning the need of distinguishing which kind of STAR an aircraft is flying has to be initiated.
7.2.1.4 Coordination in between Approach Control, En-route Control and neighbouring ATCCs
As a flight, with the intention to fly a RNP-AR, preferably needs to receive its inbound clearance well before ToD a need of well working arrangements are necessary in between ATC sectors, different ATCCs and even different countries. Furthermore as the ELTOK1H is about 11 Nm shorter than the RNAV STAR used for other traffic arriving via ELTOK the ToD naturally occurs earlier within ACC airspace.
During the Green Connection trials at least five verbal coordinations had to be done for every RNP-AR flight between Approach, En-route (ACC) and Arlanda Tower. A more developed ATM system should automatically cater for these coordination’s.
7.2.1.5 Effect of aborting an RNP-AR
Approach controllers are continuously monitoring and optimizing the arriving sequence to deliver aircrafts to ATS tower on final approach with a predefined spacing (normally 3 NM). To optimize the arriving sequence it is sometimes necessary to adjust the lateral path to be flown by providing vectors to the arriving aircrafts. If vectors are given to an aircraft flying an RNP-AR approach it can no longer continue on the RNP-AR approach.
00.00.10
66 of 85
Currently, visual approaches are not approved into any runway at Stockholm Arlanda Airport. This means that if an RNP-AR approach is aborted, aircraft will be provided vectors for flying an ILS approach.
Procedure wise, the RNP-AR intercepts the final track at approx. 5 NM from the RWY and when flying an ILS approach the Localizer is intercepted at approx. 10 NM miles from the RWY. This means that if it is necessary to adjust the lateral path for the aircraft arriving on an RNP-AR approach, this will generate additional track miles of at least 8-10 NM miles.
7.2.1.6 Aircraft Derived Data
Downlinked ADD (IAS, actual winds, ROD, ROC, Speed schedule and FMS calculated trajectory) would increase predictability and decrease workload for controllers.
However, as long as only one aircraft (or a few) in an arriving sequence is capable of sharing actual performance data and predicted flight path (4DT), it will not significantly support the controller in managing the arriving sequence. The total system benefits and support for managing arrival sequence are seen first when the majority of aircrafts are capable of sharing their data.
7.2.1.7 Effect of providing shortcut long prior to ToD
ANSPs and ATCOs are consistently striving to provide the best available service to all airspace users. If an airspace user is provided with accurate information on how many track miles remains till touchdown, better descent planning (supported by FMS system) can be performed and more energy efficient operation can be achieved. In reality, during low traffic density it is easier for an ANSP to provide a high service compared with a high traffic density situation. In high traffic density, with Today´s ATM system, it is more likely that controller has to intervene with aircrafts lateral profile and speed in order to optimize the arriving sequence and to maintain a high arrival and departure capacity flow.
Comparing the operation via the P-RNAV STAR and the RNP-AR STAR, the first thing to note is that the RNP-AR arrival is 11 NM shorter than the P-RNAV STAR. However, since both of those arrivals are designed for CDA operations without any limiting altitude/speed restrictions, the significant difference between those two arrivals will be that the aircraft flying the RNP-AR arrival (the shorter approach) will start its descent 11 NM earlier than the aircraft flying the P-RNAV STAR. This means that the reduction in fuel and emissions are generated by a shorter cruise segment for the RNP-AR arrival.
This also means that the inbound clearance and possible shortcuts needs to be provided further out for the RNP-AR arrival compared with the P-RNAV STAR arrival. The arriving sequence, generated by MAESTRO is less stable further out from the airport and decisions of whether or not it would be beneficial to provide shortcut becomes very difficult.
7.2.1.8 RAIM coverage
The RNP-AR procedure is dependent on coverage of GPS. In the Green Connection ATC manually had to collect and print out a RAIM NOTAM. That NOTAM then had to be analysed and kept in mind for every flight doing an ELTOK1H. If there was a beforehand known gap in the coverage ATC should not initiate a RNP-AR approach.
When RNP-AR approaches will be more common at more airports and by more AU this manual handling of the RAIM NOTAM has to be replaced by an automatic routine. The controller shall then be clearly informed via the ATM system whether an RNP-AR is available or not.
7.2.1.9 ATC knowledge of flights availability (or not) to commence a RNP-AR approach
During the trials all the concerned ATCOs had special information that the only airline and aircraft type involved was SAS and Boeing 737NG.
When RNP-AR will be more used to different airports and by different airlines with different aircrafts ATC will need an automatic support clearly showing which flights are able to fly a RNP-AR or not.
00.00.10
67 of 85
Information about a flights possibility to fly a RNP-AR should be filed in to the flight plan and then be analysed by the ATM system and clearly be shown for the ATCO.
7.2.2 From ATC – delay imposed on other aircraft
When demand exceeds capacity, assigning delays to inbound aircraft is a natural way of sequencing traffic and spreading out the delay over all inbound aircraft.
In the case of the ELTOK 1H arrivals (including the Green Connections flights), ATCOs and the test leaders recorded additional delays to inbound traffic that were caused solely by the ELTOK 1H arrivals. In the event that the delays would have occurred “naturally”, they were not recorded.
In 16 of the 100 trials, other aircraft were delayed in order to allow for completion of the ELTOK 1H arrivals. On average, when delays were imposed on other traffic, this other traffic received 2:40 of delay. Spread out over all the trials, however, this number reduces to around 25 seconds.
The maximum delay imposed was six minutes.
See Table 10 for more information.
Imposed Delay for all Green Connection + ELTOK 1H flights
Total Delay 42 min
Number of flights delayed 16 Average delay over all 1H flights 26 sec
Average delay per delayed flight 2:38 min
Max delay imposed 6 min
Table 10 - Imposed delay on other flights
While this imposed delay is not extensive, it does represent additional controller and pilot workload. In order to alleviate this in the future, better sequencing tools are necessary.
7.2.3 AU perspective
Any significant shortcut needs to be provided well before ToD to enable an optimum ToD point and to allow for an energy efficient descent profile.
As part of the yearly recurrent training, pilots are trained for RNP-AR operations.
Arrival procedures and approach procedures are normally published at two different plates. However, the ELTOK1H followed by the RNP-AR procedure is published on the same plate. Initially during the trial period, this confused the pilots and a few trials were cancelled due to the fact that the pilots did not find the approach plates.
7.2.3.1 Pilot questionnaires
For every performed trial flight a questionnaire was sent to the flight crew addressing the pilot perspective. Questions on energy efficiency (how green), perception of speed schedules and workload were some of the areas addressed. Out of 100 flights/questionnaires, 35 were answered.
00.00.10
68 of 85
00.00.10
69 of 85
Table 11 Summary of all pilot responses to questionnaires
00.00.10
70 of 85
8 Implementation Roadmap
8.1 RNP Procedure
8.1.1 Permanent implementation of RNP Procedure
The RNP-AR procedure is currently fully implemented and approved for operation by the Swedish Civil Aviation Authority. Any operator that has RNP-AR approved aircraft and pilots are, according to the CAA allowed to use the procedure.
However, the county administrative board initially only provided a temporary permit for the 100 Green Connections flights. Following the completion of these flights, Swedavia and the administrative board discussed about how the flights have gone and about any complaints from affected citizens regarding noise or other problems. This meeting took place in June 21
st and the discussions were positive. The
county administrative board has now accepted a permanent use of the approach procedure.
This makes the RNP AR procedure fully implemented and fully approved for operations.
8.1.2 Airspace users of procedure
Today approximately 65% of the traffic arriving via ELTOK entry point is RNP AR equipped, however the operator also needs to be RNP AR certified and approved. Currently only SAS is fully approved to fly this procedure, for LFV as an ANSP, it would be beneficial for other airlines to use this procedure. Other airlines who fly via the ELTOK entry point (and have aircraft and crew that can be RNP-AR approved) to Stockholm Arlanda Airport include:
Norwegian
Novair
British Airways
Air France/KLM
TAP Portugal
Iberia
SATA International
TUi Fly
8.1.3 Design and implementation of procedure to RWY26 from HMR
On request from Stockholm Arlanda Airport, the implementation of RNP-AR procedures into Stockholm Arlanda will continue with the main objectives of reducing the environmental impact. The next procedure to be implemented is an RNP-AR from HMR which is the northern TMA entry point to RWY 26. This procedure will also result in track mile savings and help to avoid noise sensitive areas.
8.2 Implementation of Improved data for flight planning
The trajectory predictions generated by General Electric´s PBMT has been analysed and reported in this document. Even though the number of trials is relatively low, some high level conclusions can be drawn from this exercise. More importantly the setup, analysis and results are being delivered to SESAR projects focusing on improving data for flight planning. The validation performed by Green Connection is expected to support their future work.
8.3 Implementation of 4DT data
The 4DT exercise undertaken in Green Connection gate to gate trials, where aircraft continuously downlinked its trajectory every three minutes, has been analysed and reported in this document. The analysis and the results are being delivered to our predefined mirror project SESAR 7.6.2, focusing on Reference Business Trajectory, RBT and Mission Business Trajectory, MBT
00.00.10
71 of 85
8.4 City Pair optimization
Green Connections has investigated city pair operations and optimization. Through the experience gained from the 25 gate to gate flights, the following observations and needs for further implementation are highlighted:
8.4.1 Arrival Manager (AMAN)
Traffic arriving into Stockholm Arlanda is sequenced by an arrival manager (AMAN). MAESTRO (the AMAN currently used in Stockholm) supports the controller in defining and setting up the arrival sequence. MAESTRO considers inbound traffic from about 40 min from touchdown at Stockholm Arlanda Airport to a predefined metering point at the TMA entry point. As the arriving traffic gets closer to the metering fix, the arrival sequence becomes more and more stable.
8.4.2 Experience from GOT-ARN flights
Before aircraft have reached their cruising altitude, and thus their cruising speed, MAESTRO is not able to reliably calculate their position in the arrival sequence. Flights between ESGG and ESSA reach their cruise altitude approximately 25-30 minutes from touchdown and since the descent starts approximately 20-23 minutes before landing there are only 2-7 minutes where MAESTRO is able to reliably and accurately position the aircraft in the arrival sequence. It is common that the controller, based on experience, provide a more accurate estimate for the arriving sequence than the system itself. The controller will then choose to revise the arriving sequence.
When the aircraft has reached its cruising altitude and has entered airspace controlled by the Stockholm ATCC, ATC evaluates the possibility of giving a shortcut to a point on the downwind leg of the RNP-AR STAR. This decision is based on other arriving traffic as well as northbound departures from ESSA and ESSB airports.
Giving a shortcut can provide benefits to ATC and to the airspace user. The airspace user receives a shorter approach with resultant fuel savings. For ATC, when the Green Connection flight arrives at the beginning of a peak, the shortcut can result in better sequencing and a great reduction of delay for many inbound aircraft.
To gain the full lateral and vertical benefit of a shortcut, the shortcut needs to be provided before aircraft’s ToD. If not, the aircraft will be high on its vertical profile and the pilot may need to use speed brakes to increase descent rate and re-assume the correct vertical profile.
The decision on whether to provide shortcut or not needs therefore to be determined at an early stage. At this stage the arrival sequence are still not stable and unscheduled departures may interfere with the arriving traffic.
The shortcut route (TORVA -> SA915) is more likely to interfere with northbound departures than the full route (TORVA – ARS - ELTOK). Accurate departure times are not known to the approach controller until a few minutes before their take off. This information is consequently not known to the controller when determining whether to provide shortcut or not for the arriving aircraft.
Initially during the trial period, shortcuts were provided to Green Connection flights with the assumption that there wouldn’t be an issue with departing or other arriving traffic. In four cases, this resulted in the Green Connection trial being cancelled and the aircraft receiving vectors. As the trial period progressed and more experience was gained, shortcuts were only given when the controllers were absolutely certain that there were no other interfering traffic.
Flights from nearby airports including Borlänge (ESSD), Mariehamn (EFMA) and Visby (ESSV) that are located inside a 40 min circle (see Figure 48) are processed and sequenced at a late stage by MAESTRO. If the arriving sequence is dense, these flights can cause disturbances and additional, late delays on all traffic which arrives after the short haul flight. Having better info about when these aircraft depart would help in overall arrival management, and in the case of Green Connections would help in assigning the RNP-AR arrival procedure and shortcuts.
00.00.10
72 of 85
Figure 48 AMAN Horizon including short haul airports
00.00.10
73 of 85
9 Conclusions and recommendations
This chapter summarises the conclusions made from the validation analysis. For every conclusion, a recommendation is provided on how the conclusion can be capitalized upon or improved upon. Conclusions and recommendations are structured in four sub-areas; savings, ATC experience, 4DT and flight planning and gate to gate operations.
9.1.1 Environmental impact
Ref no. Reference chapter
Conclusion Recommendation Estimated implementation time
CAR101 7.1.1 Flights from ENGM saves on average 52 kg of fuel and 165 kg of CO2 per flight.
Part of this issue can be solved by allowing shortcutting possibilities after the aircraft ToD.
Otherwise, improvements are necessary to the arrival manager and increased knowledge of when aircraft will depart is necessary.
N/A
CAR102 7.1.1 Flights from ESGG saves on average 32 kg of fuel and 100 kg of CO2 per flight.
The fact that fuel savings are less from ESGG (south westerly arrivals) than from ENGM (West north westerly arrivals) is due to the fact that they create more potential conflicts with departing and other traffic.
AMAN developments are ongoing within COOPANS for LFV. However, no significant changes to the AMAN are currently scheduled until at least 2014.
CAR103 7.1.1 The potential savings that the RNP-AR procedures enables are considerable
Swedavia plans to continue implement PBN arrivals into their airports since the positive effects are clearly shown
Ongoing – a new redesign of the TMA will be implemented in 2015 and will include new RNP-AR procedures.
CAR104 - During the period of flight trials (December 2011 to April 2012), not a single complaint has been received (as a result of the new arrival procedure) from the communities surrounding the airport regarding noise exposure
Project results and experience will be reported to the County Administrative Board during the yearly meeting on 2012-06-19. As an outcome of this meeting, a permanent permission to operate the RNP-AR arrival to runway 26 is expected.
Swedavia holds continuous dialog with all surrounding communities
CAR105 4.3.7 IAF in RNP-approach restricts the opportunity to shortcuts relative radar vectored traffic. This results in a range of different savings depending on the
If possible, design the RNP approach with IAF as close as possible to the runway.
This recommendation
See CAR103 – minor changes to the RNP approach may occur within a year or two after
00.00.10
74 of 85
offset angle on downwind leg in the approach.
In addition, the ability to provide shortcuts (and allocation of the RNP-AR STAR) after an aircraft’s top of descent will allow for a wider use of RNP-AR procedures allowing for more shortcuts
touches upon overall problems with RNP traffic handling that more knowledge of overall traffic flows are necessary to be able to assign and execute RNP approaches.
more operational experience is gained. Major changes to the RNP approach will occur in combination with the TMA redesign mentioned in CAR103
CAR106 4 RNP approach design criteria is very strict regarding likelihood of deviating outside 2 x RNP (10-
7). This results in very
shallow turns, extended flight distance and increased fuel/emissions. 2 x RNP in this case was 0.6 NM. At the same time we have aircraft in the TMA following P-RNAV with 2 x RNP corresponding to 2 NM.
Introduce separate design criteria on RNP depending on whether terrain is a factor or not.
This is a longer term (2018+) question involving a more involved dialog with ANSPs, NSAs and ICAO.
CAR107 4.3.9 Passing the FAP aircraft CAT C shall be at max 160 KIAS in Europe. This would result in too early configuration of slats/flaps which constrain vertical efficiency and thus render unnecessary fuel burn/emissions.
Evaluate this requirement: Is it possible to relax this requirement? Also, if the procedure is designed for CAT D aircraft with restriction 185 KIAS – Can CAT C aircraft be allowed to use this speed instead?
See CAR105 – for minor changes, this may be possible in a shorter term. Major changes to the design criteria will impose time scales as described in CAR106.
9.1.2 ATC experience from RNP-AR operations
Ref no. Reference chapter
Conclusion Recommendation Estimated implementation time
CAR201 4.3.7 and
7.1.3
The importance of designing a waypoint that can be used as a “shortcut to point” close to the IAF has been clearly shown. This gives the controller flexibility in managing the arriving sequence.
This will be taken into consideration in future implementation.
As stated in CAR101, some work should be looked into to allow for shortcuts after aircraft top of descent.
See CAR107 – for minor changes, this can be changed following operational experience. For major changes, ICAO and other international bodies will need to be involved.
00.00.10
75 of 85
CAR202 7.2.1.5 If an aircraft cleared for an RNP-AR approach needs to be slightly delayed or vectored due to separation issues the only option for the controller is to vector the aircraft for an ILS approach instead. Under current condition, with no visual approaches allowed, this creates at least 9 additional track miles at low level.
The first recommendation is to raise the question between the ANSP and Stockholm Arlanda Airport whether to permit visual approaches only for runway 26 at Arlanda during certain circumstances.
Ongoing - This question is currently being considered for implementation in the TMA redesign project slated to be implemented at the end of 2015.
CAR203 7.2.1.4 and 7.2.1.9
During the flight trials, a test leader was present supporting the ACC and TMC controllers with information about the possible trial flights and aiding in coordination between sectors. Since a test leader will not be present in day to day operations, this kind of support needs to be provided by new routines or upgrades to ATC systems
Information to ATCOs about which airlines and aircraft types that are eligible for RNP-AR operations needs to be provided and continually updated as new airlines become certified.
Proposed system support that could aid in coordination includes:
Label flags
Runway combinations
RAIM check
Temperature check
Aircraft approval check
Basic information to ATCOs is continuously provided. Information requiring advanced system support will require new COOPANS functionality and will therefore not be available until at least 2014.
CAR204 8.4.1 and 8.4.2
The arrival Manager MAESTRO uses the active STAR as a base for calculating the arrival sequence. Since the new designed RNP-AR arrival is significantly shorter than the existing STARs, this has a large impact on arrival sequence.
The Arrival Manager MAESTRO needs to be implemented with support for different distance STARs flown distance in TMA. In the current configuration only one STAR is used for calculating the sequence and the time necessary to fly between the entry point and the ground. The RNP-AR arrivals will be active in parallel with aircraft using other existing STARs.
See CAR101 – major changes to MAESTRO are not planned in COOPANS until at least 2014.
CAR205 8.4.1 and 8.4.2
The existing arrival manager used for the Stockholm TMA MAESTRO needs to be improved. It is currently being used as a rough instrument to support
LFV is actively involved in several SESAR projects related to arrival management. Experience from Green Connection will be fed back to these
This represents a new conceptual use of the AMAN and will require much longer time to implement. A
00.00.10
76 of 85
the controller with an approximate arrival sequence. However it is common that the controller decides to override the suggested sequence based on manual measuring and experience
projects to lead to improvements to the arrival manager.
first estimate is at least 2018 for implementation.
9.1.3 4DT and Flight planning
Ref no. Reference chapter
Conclusion Recommendation Estimated implementation time
CAR301 7.1.1.1 and 7.1.2.3
The simulated 4 dimensional trajectories shows that it is possible to predict the actual flight path to be flown with an accuracy of ±2 minutes already 1 month prior to departure (under the assumption that push back times are met, all SID and STAR usage is known, convective weather information is known and a more detailed information about aircraft loading is known)
Green Connection 4DT analysis and results are shared with SESAR projects dealing with RBT/MBT for the purpose of supporting their work.
The results from the Green Connection trials can be seen as compliments to the V3 Validation carried out by these projects.
CAR302 7.1.1.1 and 7.1.2.3
A prediction accuracy of ±1 minute can be reached 1 hour before departure.
CAR303 7.1.2.3 After reaching ToC the accuracy of ETA at destination runway stays within ±20 seconds
CAR304 7.1.1.1 The initial phase of the flight mission from pushback to take off is less stable than the rest of the flight mission as there are so many outside factors effecting the progress, like possible de-icing, late passengers, short turn around etc.
This is a well-known issue that is being looked at in a number of efforts including CDM-based operations.
9.1.4 Gate to Gate operations
In general, seen from a Gate to Gate perspective, the project has seen only slight improvements over current operations. In the case of taxi out fuel burned, for example, the participating aircraft burned on average 1kg more fuel than in standard operations.
This is seen as a confirmation that flight operations in Sweden are quite efficient today between Sweden’s two largest airports. This is in part due to Sweden’s traffic situation where many hours of the day are characterized by lower density traffic allowing for direct routing in many situations.
00.00.10
77 of 85
The gate to gate trials were constrained by existing environmental legislation regarding airspace design and use. Easement of these restrictions would lead to even further noise reduction and fuel burn for all traffic.
Ref no. Reference chapter
Conclusion Recommendation Estimated implementation time
CAR401 7.1.1 and 7.1.2
Savings were obtained in arrival taxi in phase due to shorter taxi in times. Green Connection trial flights were encouraged to roll out on the full runway which saved taxi in time in this case
Establish a permanent procedure when the opportunity exists at Stockholm Arlanda for rollout runway 26 and runway 01R (when using taxiway W after landing.)
This can be implemented in a fairly short time via dialog with the ESSA tower.
CAR402 7.1.1 and
7.1.2
Overall gate to gate operations were found to be quite efficient as Green Connection trials saved on average 37 kg of fuel compared to standard operations. Most of this saving (~33kg) came from the use of the RNP approach procedure.
All partners strive to maintain as “green” of operations as possible and to use the RNP-AR procedure as often as possible.
Ongoing – all actors strive continuously to maintain as efficient and environmentally effective operations as possible.
CAR403 5.1.2.1 Current environmental legislations impose strict restrictions on use of arrival and departure routes. These restrictions can lead to longer than optimal routes and aircraft flown at non-optimal speeds.
Work with local airports and authorities to agree on more environmentally friendly ways of handling traffic.
Swedavia works continuously with local authorities and communities to agree on ways to handle traffic more environmentally friendly.
CAR404 - LFV as an ANSP always strives to provide shortcuts to all traffic (trial and non-trial) whenever possible. Due to the operational complexity, it is more likely that ATM is able to provide shortcuts in low traffic density compared to high traffic density. Systematic use of the new arrival procedure in low, medium and high traffic would generate even more added value compared to what has been demonstrated within Green Connection (mostly carried out during low traffic density).
Continue to gain operational experience from RNP AR procedures, initially in low traffic and gradually also in higher traffic volumes.
During the first year of operation (2012), the Swedish Civil Aviation Authority has approved operations in low to medium traffic density. Once ATM experience has proven that the RNP AR procedure is feasible even in high density, a dialogue with CAA will be initiated to operate the
00.00.10
78 of 85
procedure in all levels of traffic intensity.
00.00.10
79 of 85
10 Communication and dissemination event
10.1 Communication strategy The main communication messages from the Green Connection project were based upon following communications platform: Green Connection
Shortens flight paths and as a result reduce fuel consumption and carbon dioxide emissions
Makes it possible to create flight paths that avoid densely populated areas near the airport
Gives the aviation industry even more experience using the latest technology in the best possible way
Is a collaboration between LFV, Swedavia, SAS, General Electric and Rockwell Collins, and is part of a larger EU project, SESAR.
The communications strategy was to always mention SESAR and all parties involved in the project when regarding external communication and distribute all external communication material to all parties involved.
Stockholm Arlanda Airport is involved in a process of applying for a new environmental permit for the airport. Because of this, communication with the region surrounding the airport regarding Green Connection started during spring 2011. Swedavia has had individual meetings with all communities affected by the new RNP-AR approach to runway 26, as well as meetings and an extensive correspondence with the County Administrative Board; presenting the idea, explaining the environmental impact and pointing out the advantages.
The message the project aimed to convey was that Green Connection is another important step forward for the aviation industry to reduce its environmental impact, and to show that together – air traffic management, airport, aircraft manufacturers and airlines – this is possible to achieve.
10.2 Green Connection event A dissemination event was arranged on the 11th of May, 2012 at Oxford Aviation Academy, Stockholm Arlanda. The event was organised and hosted by Swedavia, Stockholm Arlanda Airport, with participation of all of the Green Connection members. The planning of the event started in the fall of 2011, with internal discussions about its context, time of event, target audience and purpose. The project developed
common press material and fact sheets
exhibition material
a video film about the project
a small brochure
Please refer to Appendix 2 for the material that was used during the event.
The dissemination event was divided into three parts;
A visit from the Swedish Minister of Infrastructure who was invited for a demonstration of the project in the Oxford Aviation Academy’s B737NG flight simulator. During this, the media was allowed to interview specialists as well as taking part in flight simulator demonstrations.
A lecture part, where each Green Connection partner, the SJU and the Project Management gave their view on various aspects of the project, the current situation and the future. One strong message was sent to the audience; we need to work in partnership and we need to integrate the best possible technology in daily operations to minimise the environmental footprint of aviation.
Allowing all media and guests to take part of demonstrations in the B737NG flight simulator, as well as try on “fun flights” in a Bell simulator and a SAAB2000 simulator.
00.00.10
80 of 85
The guests of the event included national politicians, airspace users, the ATM sector, aviation industry representatives and national, local and trade media in Sweden as well as international media.
At present, the total media impact it’s not yet known since most of the media will be edited later this summer. However, there was a very nice article in Wall Street Journal/Market News, and among other media, articles are expected in f ex Financial Times as well as in the most prestigious Swedish newspaper Svenska Dagbladet.
The event itself was perceived to be professionally arranged, though fewer media and local politicians attended than expected. One reason for this might be the number of events around green aviation technology Swedavia/LFV have organized during the past five years, f ex Green Flights 2007, Green Approach 2008, MINT 2009 and VINGA 2011, which made some media to react “this is not news anymore”. The communication project group wants to emphasize that there still is a big common interest in greener aviation, and many leading national and international magazines has asked for material from the project.
Below are some pictures shown from the Green Connection dissemination event:
00.00.10
81 of 85
.
00.00.10
82 of 85
10.3 Other channels of communication
Stockholm Arlanda Airport has recently applied for a new environmental permit. In a Swedish permit application process, it is mandatory to hold consultations with all effected municipalities, the County Administrative Board and the Swedish Environmental Protection Agency. Swedavia and LFV have participated in these consultations together, describing the airport's RNP-AR flights. These are very important forums for information, because they may have a significant impact on how environmental authorities agree to approve the use of new procedures in the long term perspective.
Swedavia Stockholm Arlanda Airport has continuously informed the surrounding communities as well as the County Administrative Board about the project.
A film about Green Connection and the RNP-AR approach to runway 26 was made by LFV, SAS and Swedavia together with Oxford Aviation Academy. The film was shown repeatedly during the event and has been made attainable for all Green Connection partners for their respective web sites.
LFV, Swedavia and SAS participated in a meeting at the Swedish Ministry of Enterprise, Energy and Communication about environmental initiatives in the aviation industry. The positive environmental effects of implementing PBN in the framework of the VINGA project and the Green Connection project were presented by LFV.
00.00.10
83 of 85
11 Final word
The project would first and foremost like to thank the AIRE initiative for its support and guidance from the initial project phases to its completion. Thanks in large part to this project and the AIRE sponsoring, Stockholm Arlanda Airport now has a new, environmentally beneficial approach procedure that can be used in daily operations.
The project would also like to thank all of our members for their support and hard work during all phases of Green Connection. It has been a long road, but we have successfully carried out all parts of the project which had been initially intended due in large part to all of the partners’ dedication.
This has been a very good learning experience for all project members, in terms of how to carry out these exercises, RNP operations, about the benefits and accuracy of trajectory information and about how improved information can improve flight planning.
Parts of this work will be directly implemented in our daily handling of air traffic parts will be further matured and defined within the SESAR programme.
Thank you, everyone for your hard work during this GREEN CONNECTION!