Airport Surface Detection Equipment – Model X Early User Involvement Event Final Report Volume I June 2001 Report Reference Number: ACT5302001-2a Prepared by: D. Michael McAnulty, Ph.D., ACT-530 Anton Koros, Federal Data Corporation Alan Poston, AND-202 Federal Aviation Administration William J. Hughes Technical Center NAS Human Factors Branch, ACT-530
Transcript
Airport Surface Detection Equipment – Model X Early User Involvement Event
Final Report
Volume I
June 2001
Report Reference Number: ACT5302001-2a
Prepared by:
D. Michael McAnulty, Ph.D., ACT-530 Anton Koros, Federal Data Corporation
Alan Poston, AND-202
Federal Aviation Administration William J. Hughes Technical Center
NAS Human Factors Branch, ACT-530
ACKNOWLEDGMENT
We gratefully acknowledge the professionalism and dedicated efforts of the seven individuals who participated in the Early User Involvement Event (EUIE) of the Airport Surface Detection Equipment Model X (ASDE-X) prototype. They all worked diligently throughout the EUIE to learn how to operate the system, to perform the readability assessments, to exercise all the usability scripts, and to complete a series of questionnaires. They were committed to reviewing the ASDE-X interface and its functionality in detail to ensure that the visual specifications will support tower controllers in performing their critical tasks.
U1. ASDE-X Hardware Used During the EUIEU ...............................................................................5 U2. ASDE-X Day Color PaletteU........................................................................................................7 U3. ASDE-X Night Color PaletteU .....................................................................................................8 U4. ASDE-X IconsU............................................................................................................................9 U5. Training Script ExampleU ..........................................................................................................10 U6. Usability Script ExampleU..........................................................................................................11 U7. Readability Display ConfigurationU...........................................................................................15 U8. Readability Assessment LayoutU ...............................................................................................16 U9. Target Icon Identification by Window and TypeU .....................................................................22 Table Page
U1. Participant Background Questionnaire ResponsesU .....................................................................3 U2. EUIE ScheduleU ...........................................................................................................................4 U3. Usability Script FunctionsU ........................................................................................................11 U4. Preference Settings for Readability SessionsU ...........................................................................17 U5. Usability Assessment CounterbalancesU ....................................................................................18 U6. Target Icon Identification by Window and TypeU .....................................................................21 U7. Target Icon Identification Across Conditions and LocationsU...................................................22 U8. Data Block Identification Across Conditions and SourcesU ......................................................23 U9. Data Block Identification Across Conditions and LocationsU ...................................................24 U10. Day Palette Readability Questionnaire Items with False RatingsU ..........................................24 U11. Night Palette Readability Questionnaire Items with False RatingsU .......................................26 U12. PSQ1 Items with False RatingsU ..............................................................................................27 U13. PSQ2 Items with False RatingsU ..............................................................................................30 U14. PSQ3 Items with False RatingsU ..............................................................................................30 U15. PSQ4 Items with False RatingsU ..............................................................................................31 U16. Participant Ratings of Input Method UsageU ...........................................................................32 U17. Exit Questionnaire Section II Items with False RatingsU.........................................................34 U18. Exit Questionnaire Section III Items with False RatingsU .......................................................36 U19. Caucus Issues with at Least One High Impact RatingU ...........................................................38 U20. Caucus Issues with at least one Moderate Impact RatingU ......................................................39 U21. Caucus Issues with all Low Impact RatingsU...........................................................................40 U22. Caucus Issues Reclassified as Non-IssuesU..............................................................................41
vi
vii
EXECUTIVE SUMMARY
The Airport Surface Detection Equipment Model X (ASDE-X) system, which is part of the FAA Runway Safety Program, will provide seamless coverage of the airport movement area to promote Air Traffic Control Specialist (ATCS) situational awareness. An ASDE-X Working Group (WG) developed an initial computer-human interface (CHI) for the system based on the ASDE-X requirements document. During March 2001, a research team conducted an Early User Involvement Event (EUIE) to evaluate the ASDE-X computer model. The purpose of this evaluation was to confirm that the Visual Specification for Airport Surveillance Applications (VSASA) requirements demonstrated in the March 2001 version of the model provided ATCSs with an intuitive, efficient, and effective interface in support of their surveillance activities. Six ATCSs and one supervisory ATCS participated in the EUIE, which took place at the William J. Hughes Technical Center. Each had between 17 and 19 years of terminal experience and most of them used ARTS IIIA and D-BRITE equipment at their home facility. Volume I presents the method, results, and conclusions of the ASDE-X EUIE. Volume II contains the training and test materials used during the evaluation.
At the beginning of each week, the research team provided participants with an overview of the system and discussed the purpose of the EUIE. We gave the participants classroom sessions and hands-on training in the use of the ASDE-X system. The EUIE included readability and usability assessments to evaluate the ASDE-X computer model interface and input hardware. The research team conducted readability sessions at the Research Tower Cab. During these sessions, the participants identified target icons and data blocks from the display under four different conditions—simulated daylight using the day palette, dusk using the day palette, dusk using the night palette, and night using the night palette. They identified the display elements from four locations representing 5 and 8 feet along the 0 and 40 degree angles of incidence. The participants completed five usability scripts during the usability sessions. Three scripts systematically covered ASDE-X functions, one investigated alternative monitor locations, and the last investigated alternative hardware input devices. Immediately following each script, the participants completed usability questionnaires focusing on aspects of the interface just exercised.
The ASDE-X EUIE demonstrated that the requirements of the VSASA are clear and realistic, and that the CHI, with minimal modifications, would effectively support controllers in performing their jobs. The participants’ overall assessment of the system was highly positive. They performed well when identifying target icons and data blocks during the readability sessions. Overall, they identified 95% of target icons and 77% of data blocks. The participants rated less than 10% of all questionnaire items as a concern, resulting in the identification of 15 design issues for consideration by the WG. The first two, target icons and user preferences, accounted for more than half of all comments. The participants indicated that the interface was easy to use, required minimal interaction once configured, and would enhance their situation awareness. They reported that both the EUIE classroom and hands-on training were adequate. The EUIE also confirmed the acceptability of the trackball and keypack input hardware options.
1. 0BUIntroduction
The Airport Surface Detection Equipment Model X (ASDE-X) system represents one of the technologies the Federal Aviation Administration (FAA) is pursuing as part of its 1999 Runway Safety Program initiative. The objective of the ASDE-X system is to provide seamless coverage of airport movement areas during periods of reduced visibility and in all weather conditions (FAA, 1999). The ASDE-X technology supports Air Traffic Control Specialist (ATCS) situational awareness of airport activity, thus promoting the safe and efficient movement of aircraft and vehicles on the airport surface.
ASDE-X will integrate data from multiple sensors and provide high resolution, short-range, clutter free, surveillance information about stationary and moving aircraft and vehicles using a common computer-human interface (CHI). In addition, the system will have the capability to distribute information to other users. It consists of three primary components: the ASDE-X Surveillance Sensor and other surveillance sensors, the multi-processor, and the Air Traffic Control Tower (ATCT) display.
An ASDE-X Working Group (WG) is developing a Visual Specification for Airport Surveillance Applications (VSASA) and a prototype CHI for the system based on the ASDE-X requirements document (FAA, 1999). The ASDE-X WG is composed of representatives from the following organizations.
a. Surveillance Division (ARN-300)
b. National Air Traffic Controllers Association (NATCA)
c. Air Traffic Planning and Procedures Branch (ATP-420)
d. Supervisory Committee (SUPCOM)
The Product Team Lead for Terminal Surveillance (AND-440), William J. Hughes Technical Center (WJHTC) Surveillance Branch (ACT-310), WJHTC National Airspace System (NAS) Human Factors Branch (ACT-530), and the Communications, Navigation, and Surveillance Human Factors (AND-202) support the ASDE-X WG. HMI Solutions, LLC supported the prototype development. Representatives from the Professional Airway Systems Specialists (PASS) participated in developing the VSASA.
By February 2001, the ASDE-X WG had developed an initial CHI that was sufficiently mature to warrant review by a representative group of end users. The prototype was a computer model of the proposed CHI and did not necessarily reflect the software or code to be implemented in the final system. At the request of AND-440, a research team from ACT-530, ACT-310, and AND-202 designed and conducted an Early User Involvement Event (EUIE) during March 2001 to investigate the prototype CHI. The ASDE-X WG will use the results of the EUIE to further refine the ASDE-X prototype CHI and visual specifications document.
This report documents the activities and results of the ASDE-X EUIE. It is divided into two volumes. Volume I contains the ASDE-X EUIE Introduction, Method, Results, and Conclusions. Volume II contains the appendixes for Volume I, which includes the EUIE training and test materials.
1
1.1 4BUBackground
Runway incursions in the United States rose to 281 in 1990, an increase of 50% from just 2 years earlier (FAA, 2000b). As a result, in 1991, the National Transportation Safety Board (NTSB) placed runway incursions on its most wanted improvements list and issued recommendation A-91-30 (NTSB, 1991). By 1993, the FAA installed the first of 38 ASDE-3 radar systems at the nation’s busiest airports (NTSB, 2000). The ASDE-3, which is an advanced digital radar system, is capable of penetrating precipitation and fog to provide tower controllers with images of all aircraft and vehicles on the airport surface. The FAA is installing the Airport Movement Area Safety System (AMASS) at the ASDE-3 sites. AMASS is a computer enhancement to the ASDE-3 radar that alerts controllers to a potential collision on the runway.
To minimize runway incursions at other airports, the FAA has undertaken an effort to research and develop a cost-effective alternative to the ASDE-3/AMASS capability for 25 other airports not scheduled to receive that equipment. This low-cost version of the ASDE-3/AMASS system, referred to as ASDE-X, is one of the first new runway safety program technologies aimed at improving ATCS situational awareness by providing tools to supplement their task (FAA, 1999).
1.2 5BUPurpose
The primary purpose of the EUIE was to determine if the March 2001 version of the ASDE-X prototype CHI was intuitive, efficient, and effective in allowing ATCSs to conduct airport surveillance activities. The results should provide a level of confidence that the requirements of the VSASA are clear and realistic and that the prototype CHI, if implemented, will be acceptable to the controllers. The current system demonstrated more than 80 functions identified in the VSASA. However, additional assessments may be needed to investigate both new functions as they are added to the prototype and the changes implemented as a result of the EUIE. A secondary purpose was to assess two proposed ASDE-X input hardware options (keyboard-trackball or keyboard-keypack, which include both a trackball and a numeric keypad with seven hotkeys).
2. 1BUMethod
The research team, composed of human factors specialists (HFSs) from ACT-530 and AND-202 and engineers from ACT-310, conducted the EUIE during the last 2 weeks of March 2001. The EUIE included readability and usability assessments to evaluate the ASDE-X prototype CHI and input hardware.
2.1 6BUParticipants
Seven representative users from different sites participated in the EUIE. They included three ATCSs each week and one supervisory ATCS during the first week. A supervisory ATCS scheduled for the second week was not able to participate. The NATCA and SUPCOM representatives selected the participants for each week from ATCTs where the FAA intends to deploy the ASDE-X. To the extent possible, they selected participants who varied in terms of ATCT experience, type of facility, and level of computer expertise.
2
Table 1 shows that the participants total ATC experience varied considerably, although all had between 17 and 19 years of terminal experience. Most used ARTS IIIA and D-BRITE equipment; however, some had experience on other systems. Their level of computer experience was in the middle of the range, neither beginner nor experienced.
ATC experience in the following (years): Terminal Military
7 3
19 (17–19)
9 (4–11)
Version of ARTS at home facility: IIIA IIE Micro-EARTS
5 1 1
– – –
Tower displays at home facility: D-BRITE ASDE-3
6 2
– –
Other tower equipment: Micro-EARTS TCW Touch Panel Field Lighting Display Early ASDE-X
1 1 1
– – –
Typical distance from ASDE-3 display (feet) 2 4 (3–5)
Typical distance from D-BRITE display (feet) 6 4 (2–6)
Maximum distance from the D-BRITE (feet) 7 10 (4–11)
Right or left handed: Right Left
6 1
– –
General computer experience (1= beginner/5= expert) 7 3 (2.5–4)
2.2 7BUSchedule
We conducted the EUIE during the last 2 weeks of March 2001. Monday and Friday were participant travel days. Tuesday through Thursday included an orientation, classroom training, hands-on training, usability and readability assessments, and a group caucus. Table 2 depicts the schedule for the participants each week. The start times (11:30 a.m.) for Tuesday and Wednesday were based on lighting conditions for the dusk and night assessments. The activities for Thursday of both weeks began at 9:30 a.m. We provided short breaks periodically each day.
3
Table 2. EUIE Schedule
WEEK 1
March 20 March 21 March 22
All--Orientation and P1&2 P3&4 All--Usability Script 4 Classroom Training Usability Hands On
Scripts 1-3
All--HardwareComparision
All--Exit QuestionnaireBreak Break Break
P1&2 P3&4 Day P1&2 Day P3&4 All--CaucusHands On Readability Readability Usability
The EUIE took place at the WJHTC Research Development and Human Factors Laboratory (RDHFL) and Research Tower Cab. The research team conducted the orientation, classroom training, and caucuses in the RDHFL Briefing Room. They provided familiarization training in the RDHFL Multipurpose Room and Experiment Room (ER) 1 and conducted the usability assessments in ERs 1 and 4. The readability assessments took place in the Research Tower Cab. The participants completed the Post-Script Questionnaires (PSQs) in the RDHFL Conference Rooms A and B and the Readability Questionnaire in the Research Tower Cab.
4
2.4 9BUEquipment
The research team prepared three training/usability workstations, one system for use when completing the PSQs, and one readability workstation. All the workstations were composed of PC computers with Linux operating system and ODS Toolbox version 4.0.6.2, the ASDE-X prototype computer model, an input hardware interface specifically designed for the system, and a 20-inch General Digital VuePoint RGB monitor (see Figure 1). The readability workstation input hardware used a keyboard-mouse configuration. The training and usability workstations included a keyboard-trackball during Week 1 and a keyboard-keypack during Week 2.
The ASDE-X WG selected the General Digital monitor because it met the ASDE-X requirements (FAA, 1999) of a minimum 17-inch display that was readable in typical tower cab ambient lighting conditions. Crown (1998) previously evaluated the monitor, which was selected for use in the tower cab for the Standard Terminal Automation Replacement System. We moved the monitors to simulate console and ceiling options. The readability evaluation materials also included one Pallite VIII ring lamp and an International Light Inc. photometer (model IL1400A).
Figure 1. ASDE-X hardware used during the usability assessments.
5
2.5 10BUASDE-X CHI Model
2.5.1 18BUCHI Description
The computer model of the proposed ASDE-X CHI is based on the VSASA document developed by the WG to meet the high level requirements for the system (FAA, 1999). The CHI model presents the “look and feel” of the system to the extent possible. The WG has not developed all the specifications for the final system, and a few of the functions specified were not modeled or were not fully implemented for this evaluation. However, enough (the majority) of the developed specifications are included in the CHI model to enable a useful evaluation of the current design.
The ASDE-X display contains two background areas, an apron area, runways, and taxiways to provide a layout of the airport surface and surrounding areas. The WG used the Dallas-Ft. Worth (DFW) airport as the map in the model. The display also presents moving target icons and their associated data blocks, history trails, and velocity vectors. There are separate icons for aircraft, heavy aircraft, vehicles, unknown targets, coasted targets, and suspended targets. There is also a coast/suspend (C/S) list and a function preview area.
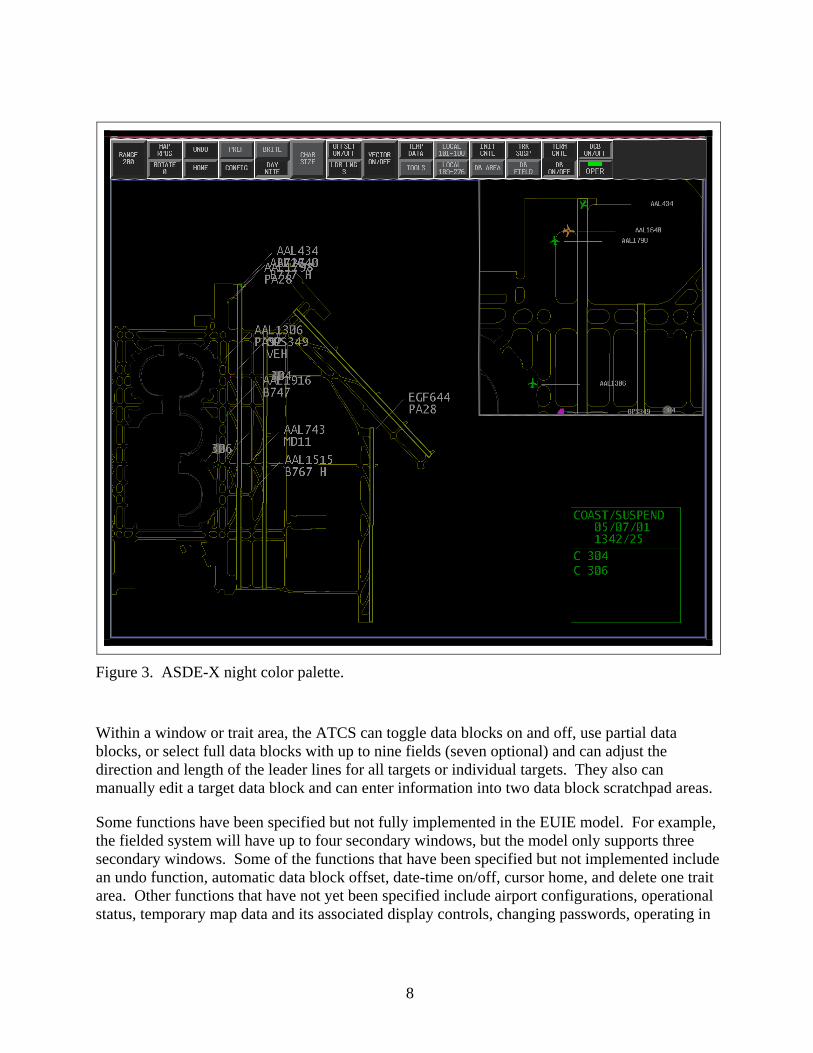
The WG used color on the display to help differentiate the various elements. There are two color palettes, one for daytime use (see Figure 2) and one for nighttime (see Figure 3). The color palettes are intended to optimize their readability under different lighting conditions (e.g., to minimize glare during the day) and to avoid creating a display that distracts controllers (e.g., a bright display at night would affect the controllers’ dark adaptation for observing aircraft on the airport).
The day palette has green backgrounds with dark, filled runways and taxiways, yellow data blocks, and a white C/S list and preview area. The night palette has black backgrounds with yellow, outlined runways and taxiways, white data blocks, and a green C/S list and preview area. The heavy aircraft are orange and the vehicles are magenta on both palettes. The aircraft and unknown targets are white on the day palette and green on the night palette. The coast and suspend targets have yellow numbers on a grey symbol on the day palette and white numbers on a grey symbol on the night palette. All the targets have different shapes and sizes to help distinguish them (see Figure 4). The history trails and velocity vectors match the color of the targets.
The CHI includes numerous functions for adjusting the display characteristics, saving and recalling user preferences, tagging targets, and editing data blocks. The ASDE-X has a Display Control Bar (DCB) to access the functions. It can be placed at the top, bottom, left, or right side of the display or turned off when not in use. The controller uses the trackball to move the cursor over buttons on the main menu and eight submenus to select the functions and adjust their values. Some of the functions can also be accessed using hotkeys on the keyboard or keypad, by multifunction commands, or by using implied function procedures. Once selected, some function values may be entered via the keyboard or keypad.
6
Figure 2. ASDE-X day color palette.
The basic display features include ranging, repositioning, and rotating the map; adjusting the brightness of 10 display elements and the font size of 4 display elements; moving the C/S list and preview area; toggling or adjusting the length of the history trails and velocity vectors; adjusting the cursor speed; toggling the DCB on and off; and returning to a default display setting. Advanced display features include creating and modifying secondary windows and defining and deleting trait areas within windows.
The controllers can save and recall up to 32 individual preference sets representing different airport operational configurations and display settings. They also can access and copy the preferences of other controllers. The controllers can use a list of 176 local aircraft and vehicles to tag unknown targets and can terminate control of a target, suspend a target, and initiate control of a suspended target.
7
Figure 3. ASDE-X night color palette.
Within a window or trait area, the ATCS can toggle data blocks on and off, use partial data blocks, or select full data blocks with up to nine fields (seven optional) and can adjust the direction and length of the leader lines for all targets or individual targets. They also can manually edit a target data block and can enter information into two data block scratchpad areas.
Some functions have been specified but not fully implemented in the EUIE model. For example, the fielded system will have up to four secondary windows, but the model only supports three secondary windows. Some of the functions that have been specified but not implemented include an undo function, automatic data block offset, date-time on/off, cursor home, and delete one trait area. Other functions that have not yet been specified include airport configurations, operational status, temporary map data and its associated display controls, changing passwords, operating in
8
playback mode, and alerting functionality. Buttons were included for all these functions on the DCB during the EUIE, but they were not operational.
Figure 4. ASDE-X icons.
2.5.2 19BUEUIE Traffic Scenarios
The research team developed two traffic scenarios for the EUIE. They based them on recorded traffic on the eastern half of DFW, which includes four runways and their associated taxiways. They deleted some of the recorded traffic because of erratic movement or to reduce congestion. The research team had to assign aircraft call signs and types, so they were not based on actual call signs and types. We created a mixture of traffic types (heavy aircraft, regular aircraft, vehicles, unknowns, and coasted or suspended targets) in the samples, so they did not reflect the actual traffic. They contained more regular and heavy aircraft than other target types, as would be expected in normal airport operations. One of the traffic samples had arrivals and departures on north or northwest headings, and the second had traffic arriving and departing to the south or southeast. We used the south sample for the readability assessments and the north sample for the usability assessments. Both samples ran for approximately 19 minutes and then repeated the scenario.
2.6 11BUMaterials
2.6.1 20BUScripts
The research team developed a hands-on training script (see Volume II, Appendix A) and five usability scripts (see Volume II, Appendix B). These scripts exercised the functionality built into the March 2001 version of the prototype. The hands-on training script introduced the EUIE participants to relevant elements of the ASDE-X interface and provided detailed instructions on how to perform each required function. The scripts identified the objective of the function, indicated the method for executing the function (e.g., trackball and button, trackball and numeric
9
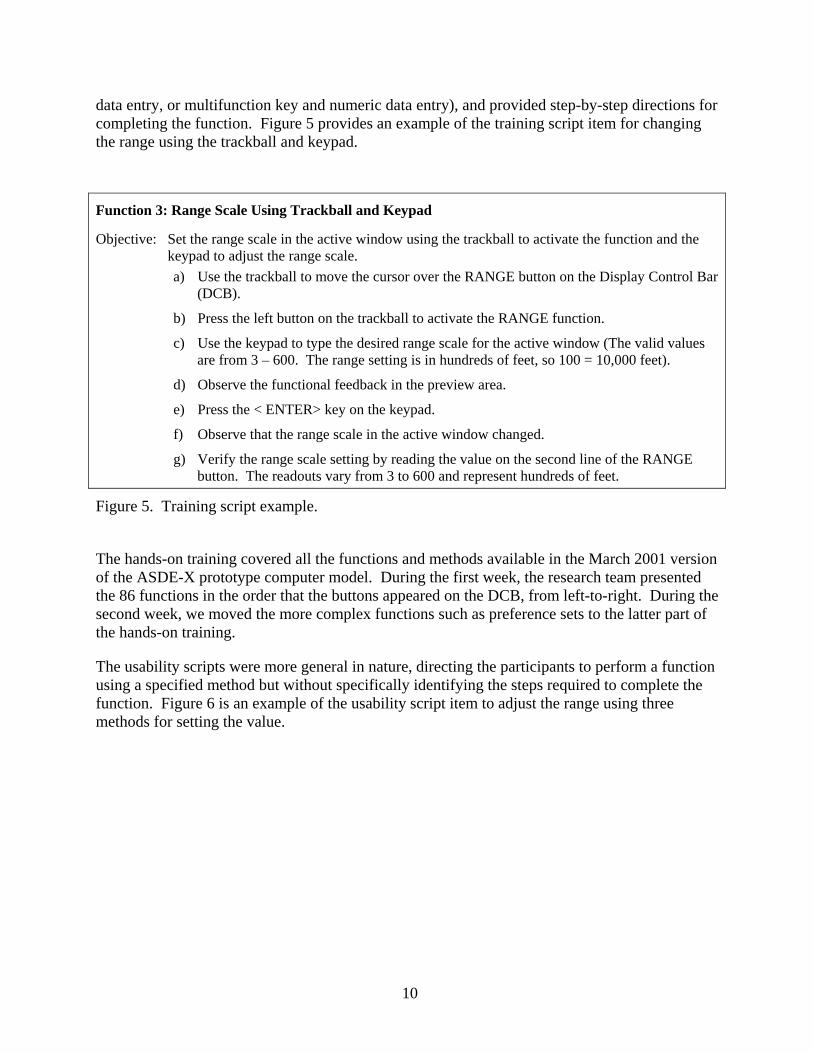
data entry, or multifunction key and numeric data entry), and provided step-by-step directions for completing the function. Figure 5 provides an example of the training script item for changing the range using the trackball and keypad.
Function 3: Range Scale Using Trackball and Keypad
Objective: Set the range scale in the active window using the trackball to activate the function and the keypad to adjust the range scale.
a) Use the trackball to move the cursor over the RANGE button on the Display Control Bar (DCB).
b) Press the left button on the trackball to activate the RANGE function.
c) Use the keypad to type the desired range scale for the active window (The valid values are from 3 – 600. The range setting is in hundreds of feet, so 100 = 10,000 feet).
d) Observe the functional feedback in the preview area.
e) Press the < ENTER> key on the keypad.
f) Observe that the range scale in the active window changed.
g) Verify the range scale setting by reading the value on the second line of the RANGE button. The readouts vary from 3 to 600 and represent hundreds of feet.
Figure 5. Training script example.
The hands-on training covered all the functions and methods available in the March 2001 version of the ASDE-X prototype computer model. During the first week, the research team presented the 86 functions in the order that the buttons appeared on the DCB, from left-to-right. During the second week, we moved the more complex functions such as preference sets to the latter part of the hands-on training.
The usability scripts were more general in nature, directing the participants to perform a function using a specified method but without specifically identifying the steps required to complete the function. Figure 6 is an example of the usability script item to adjust the range using three methods for setting the value.
10
U5. Range Function
Use the Utrackball Uto activate the Range function
Use the UkeyboardU to adjust the range to 60,000 feet (600 on the range button)
Use the Utrackball Uto activate the Range function
Use the Ukeypad Uto adjust the range to 300 feet (3 on the range button)
Use the Utrackball Uto activate the Range function and adjust it so that you can view the entire map (approximately 20,000 feet [200 on the range button]. You may need to reposition the map).
Figure 6. Usability script example.
A researcher was always present to provide assistance if participants had problems performing a function. The participants had a copy of the hands-on training script available for assistance in completing a function, though none of them used it.
The first usability script focused on basic display characteristics including manipulation of map attributes (map range, repositioning, rotating, etc.) and display characteristics (brightness, font size, etc.). The second usability script required participants to invoke additional display capabilities (e.g., adjusting vector lengths and history trails) and creating secondary windows. The third script covered advanced controller functionality including editing data blocks, suspending and initiating control of tracks, and defining trait areas. Table 3 identifies the functions exercised by Scripts 1, 2, and 3. As the participants progressed through the scripts, they set parameters to their preferred settings and saved the settings at the end of each script. They performed many of the functions using different methods of selecting the function and adjusting the value.
The fourth usability script contained a subset of items from Scripts 1, 2, and 3 to evaluate the impact of console versus ceiling display mounting on usability. Those items in Table 3 with a superscript a indicate functions that participants repeated in Script 4. The research team selected a subset of Script 1-3 functions for the hardware comparison (Script 5). These items are identified in Table 3 by a superscript b symbol.
Table 3. Usability Script Functions
Script 1 Script 2 Script 3
Toggling Day/Night Color Palette b Adjusting Cursor Speed a b Map Rotation Map Repositioning a Adjusting Range a b Adjusting Brightness Settings a b Adjusting Character Sizes a Adjusting Leader Line Length Adjusting Leader Line Direction a b
Selecting User Preference Sets a b Home Function Activating Vector Lines a Adjusting Vector Lengths Activating History Trails Adjusting History Trail Lengths Repositioning Preview Area Toggling Track C/S List Repositioning Track C/S List a
Selecting User Preference Sets a b Toggling all Data Blocks on/off Toggling Individual Data blocks Customizing Data Blocks (Partial/Full) Manually Editing a Data Block Local Aircraft/Vehicle List Association a b Suspending a Track a b Initiating Control of a Suspended Track a b Terminating Control of a Track b
11
Saving User Preference Sets a b Toggling the DCB menu on/off a Selecting DCB Location Creating New Windows a Manipulating Map Windows a Deleting Secondary Windows Saving User Preference Sets a b
Defining DB Off Areas Defining Data Block Trait Areas a Showing All Data Block Areas Deleting All Data Block Areas Entering information into the Scratch Pad Creating/Manipulating Map Windows a Saving User Preference Sets a b
a Denotes functions in Script 4 (Monitor Location Comparison) b Denotes functions in Script 5 (Hardware Comparison)
2.6.2 21BUData Collection Forms
The research team developed the following data collection forms based on similar tools used for previous ACT-530 evaluations.
a. Background Questionnaire (see Volume II, Appendix C). The Background Questionnaire collected relevant information such as the participants’ experience in ATC. The participants completed this questionnaire during the orientation session.
b. Post-Script Questionnaires (see Volume II, Appendix D). Usability Scripts 1-4 had accompanying PSQs that participants completed at the conclusion of each period. These contained some common items such as intuitiveness of the functions performed, but they focused primarily on script-specific items. The PSQs asked participants to evaluate the acceptability of each function and method and to indicate the impact of items that were not acceptable. Each PSQ contained between 20 and 31 items.
c. Readability Data Collection Form (see Volume II, Appendix E). We designed the readability component of the EUIE to verify that the combinations of backgrounds, text, graphics, and colors presented in the two palettes were readable in the wide range of lighting conditions (bright day – dusk – dark night) that occur in the tower environment. Crown (1998) had previously evaluated the monitor hardware for use in ATCTs. The Readability Data Collection Form enabled the data collector to characterize the current lighting condition and indicate the brightness and font settings selected by the participants. The form provided space to indicate whether participants accurately identified data blocks and icons in each of three windows from different viewing locations.
d. Readability Questionnaire (see Volume II, Appendix F). This questionnaire contained the same five questions for each of four palette-illuminance conditions. At the conclusion of each lighting condition, the participants used the form to rate the readability of the display when close to the monitor and at extended angles and distances, the readability of the data blocks and target icons, and the discriminability of runways and taxiways. The test coordinator collected the questionnaire from each participant at the conclusion of the readability session.
12
e. Exit Questionnaire (see Volume II, Appendix G). The participants completed the Exit Questionnaire on the last day of the evaluation before the caucus. This questionnaire contained three sections. In the first section, the participants indicated how often they expected to use each of the available methods for selecting or completing a function. Section 2 included 27 items focused on evaluating overall component acceptability. The 29 items in Section 3 collected data about human factors aspects such as labels, fonts, and menu arrangement.
2.7 12BUProcedure
2.7.1 22BUOrientation
The research team conducted an orientation on Tuesday of each week to familiarize the participants with the ASDE-X concept of operations, the goals of the EUIE, the ASDE-X prototype CHI and hardware, and the EUIE components and procedures. They provided a brief demonstration of the prototype user interface, selected functionality, and methods of interacting with the system. They informed the participants that the system they would use was a computer model, not a true prototype of the system and, as such, exhibited inherent limitations. At the conclusion of the orientation session, the participants read and completed the Statement of Confidentiality and Informed Consent (see Volume II, Appendix H) and the Background Questionnaire (see Volume II, Appendix C). The research team randomly assigned code numbers to each participant and kept individual participant data confidential.
2.7.2 23BUClassroom Training
At the conclusion of the orientation session, the research team conducted classroom training to familiarize participants with the ASDE-X CHI and hardware. During the approximately 2-hour session, the team reviewed the user interface in detail and demonstrated selected functionality for the group on the overhead projector. The topics included airport maps, target icons, display color and shape codes, editing data blocks, font size adjustments, brightness adjustments, display clutter reduction, DCB, color display, input devices, C/S list, local aircraft and vehicle list, multiple windows, position indicators, and user preference sets. The team also identified functions that were not included in the prototype but are planned for the fielded system.
2.7.3 24BUHands-On Training
Participants 1, 2, 5, and 6 completed the hands-on training session and usability assessment first, followed by the readability assessment. The remaining participants (3, 4, and 7) performed the readability assessment before the hands-on training and the usability assessment. We designed this procedure to optimize the use of participant time and laboratory facilities. During the training, the participants worked independently using a computer model of the ASDE-X. They followed the hands-on training script, which provided an explanation of the objective of each function and precise instructions on how to execute it. The participants were able to modify display characteristics such as map attributes and windowing, but they could not effect changes in the aircraft traffic. Research team members monitored the training, took notes, and were available to answer questions.
13
2.7.4 25BUReadability
The research team conducted readability sessions on Tuesday and Wednesday of each week in the Research Tower Cab. With the exception of the first session during Week 2, two participants attended each session. During each session, each participant viewed the display under four different conditions—day using the day palette, dusk using the day palette, dusk using the night palette, and night using the night palette. Incident illuminance levels varied depending on the environmental conditions on the day and the time of the test. The time that we conducted the day palette-bright condition sessions was not a factor because the incident illumination levels on the display never exceeded 30 fc and, therefore, needed to be supplemented. During each session, the team conducted the day condition, augmenting the illuminance level to as much as 3,000 fc (cf. Crown, 1998; 1999) using a Pallite VIII ring lamp. The day palette-dusk measurement start times were between 5:30 p.m. and 6:20 p.m. and the night palette-dusk start times were between 6:00 p.m. and 6:40 p.m. Official sunset varied from 6:10 p.m. to 6:18 p.m. The night palette-night condition data collection started between 7:00 p.m. and 7:15 p.m.
14
Day illumination levels ranged from 2,400 to 3,000 fc with a median of 2,900 fc. Dusk levels for the day palette ranged from 0.2 to 30 fc with a median of 1.8 fc. The median illuminance levels for the dusk and night conditions using the night palette were 0.31 and 0.05 fc respectively. The dusk condition ranged from 0.08 to 4.2 fc and the night levels ranged from 0.04 to 1.6 fc.
The display consisted of three windows (see Figure 7) portraying simulated traffic. The left half of the display (i.e., main window) was set at a range of 24,000 ft and provided an overall view of the eastern half of the DFW airport. A second window was located in the upper one-third of the right half of the display. It was set at a range of 5,000 ft and showed the holding area for departures on runway 17R. The third window was located in the lower two-thirds of the right half of the display. It was set at a range of 10,000 ft and showed the runways and taxiways for 17L, 17C, and 17R. The C/S list was located at the top center of the display.
Window 1
Scale: 24,000’
Window 2
Scale: 5,000’
Window 3
Scale: 10,000’
Figure 7. Readability display configuration.
When the ASDE-X was installed in the Research Tower Cab, it was apparent that it would be difficult to discriminate the coast and suspend targets from the background. The research team modified the coast and suspend target icon colors for the readability sessions in an effort to
15
improve discrimination of these targets. For the readability sessions, the coast icon had yellow text on a light gray circle when using the day palette. For the night palette, the icon was a dark grey circle with white text. The suspend targets were depicted as off white boxes with yellow text for the day palette and green boxes with white text for the night palette.
At the beginning of each session, the research team instructed the participants to adjust the vertical height and tilt of the monitor according to their preference for a ceiling-mounted configuration. The participants relocated the monitor using the articulating arm that was mounted to the ceiling. We fixed the horizontal and lateral location of the display to ensure that readability was assessed at the six pre-marked locations (2.5, 5, and 8 feet along the 0 degrees and 40 degrees angle of incidence to the display). We selected 40 degrees because it represented the maximum viewing angle requirement defined by the ASDE-X Subsystem Level Specification (FAA, 2000a). Figure 8 presents the readability test locations and the test equipment arrangement for the readability assessment.
ASDE – X Display5
6
3
40 degrees
4
2
1
2.5 ft
5 ft
8 ft
Pallite lamp (day condition)
Figure 8. Readability assessment layout.
After adjusting the monitor height and tilt, the participants modified the font size (i.e., data blocks and C/S list) and display brightness settings (e.g., fonts, targets, background) according to their preferences. Once the participants were satisfied with the settings, the researcher recorded the settings, measured the illuminance level, and instructed the participant to move to the first test location.
The monitor height ranged from 79 to 84 inches with a median height of 79.5 inches. All Week 1 participants elected to leave the display tilt at 15 degrees tilt, whereas Week 2 participants used it at 25 degrees although they were permitted to adjust it.
Table 4 summarizes the font size and brightness settings selected by the participants for each condition across the readability sessions. The table provides the median and range for each of the
16
variables. Font sizes of 3 and 4 were the most common, though one participant chose 6. None of the participants selected a font size of 1. Brightness settings for runways, taxiways, target icons, and data blocks were higher for the day palette than the night palette. The brightness settings for the background areas, apron, and lists were relatively constant for both palettes. Except for the lists, these settings are consistent with maintaining foreground-background brightness contrast.
Table 4. Preference Settings for Readability Sessions
Variable Bright
Day Palette Dusk
Day Palette Dusk
Night Palette Night
Night Palette Median Range Median Range Median Range Median Range
Font size Data Blocks 3 2-6 3 3-6 4 3-6 4 3-6 C/S list 3 3-6 3 3-5 3 3-6 3 3-6
a Because these elements were black, changing the brightness setting had no effect on their appearance or contrast with other elements.
Next, the researcher asked the participant to verbally identify two icons and one data block per window, as well as one data block from the C/S list. The researcher used a pointer to indicate the selected item and recorded whether the response was accurate or not on the readability form. During Week 1, we directed the participants to move to the next location after missing more than one item. This procedure continued until the participant correctly identified all data blocks and icons at a test location. Data blocks were on at all times. Once the participant had completed the icon and data block identification tasks, they answered the appropriate items in the Readability Questionnaire while the researcher measured the illuminance level. The research team then performed the procedure with the next participant. They repeated this procedure for each condition and participant until all conditions were completed.
The research team revised the procedure during Week 2 following discussions with WG members. We collected data at the first four test locations only and conducted the icon and data block recognition sequentially with the data blocks turned off during the icon identification segment. Only the first four positions were considered necessary because virtually all participants reached 100% accuracy before reaching the 2.5-foot test location. In Week 2, the participants identified the icons first from all four locations and then read the data blocks from these locations.
17
2.7.5 26BUUsability
For Scripts 1 – 3, three of the participants used the display monitor in a console position, and the remaining four used it in the ceiling-mounted position. The participants completed scripts 1 – 3 in ER1 and ER4, with four of them using the day palette and three the night palette. For the fourth usability script, they used the alternative display height but the same palette. During the console-mounted condition, the participants completed the scripts from a standing position; they were seated during the ceiling-mounted condition. The display test locations were based on the assumption that ground controllers would primarily use a console-mounted display while standing, and that local controllers would primarily use a ceiling-mounted version while seated in a high chair. All participants attending Week 1 used the keyboard-trackball to complete Scripts 1 – 4, and those in Week 2 used the keyboard-keypack. A fifth script provided the opportunity to use the alternative device. Table 5 shows the counterbalances. The shaded column for Participant 8 indicates the session that was not performed.
Palette Night Day Day Night Input Interface Keyboard-
Keypack Keyboard- Keypack
Keyboard- Keypack
Keyboard- Keypack
An HFS conducted each usability session. During the sessions, the HFSs observed the participants as they completed the script, answered participant inquiries, and noted relevant observations. The participants proceeded through the scripts at their own pace. They had copies of the training script available for reference if needed; however, none of them referred to it. Each usability script took approximately 25 minutes to complete, although there were substantial variations across participants. Upon completion of the script, the participant proceeded to Conference Room A to complete the associated PSQ while the HFS conducted the next usability session. The ASDE-X prototype was available in the conference room for participants to verify
18
system interactions while completing the PSQ. The research team repeated the procedure until the participants had completed Scripts 1 – 3 and the accompanying PSQs.
The research team conducted the Script 4 usability sessions in ER1 and ER4. The participants completed Script 4 using the display height they had not experienced previously and then completed PSQ 4.
After completing Script 4, the participants performed a final script using the alternative input device (i.e., keypack in Week 1, trackball in Week 2). This script directed them to use the alternative device to perform various functions so that they could consider the differences each entailed. For example, to change the leader-line length with the keyboard-trackball, the participants had to position the cursor in the desired direction along the edge of the monitor and then press the fourth button on the trackball. With the keyboard-keypack, they had to perform an implied function by pressing a number between 1 and 9 (except 5) and then press the ENTER key. The functions in the script focused primarily on adjusting leader-line direction, suspending a track, initiating control of a suspended track, terminating control of a track, and using preference sets. During the Week 1 session, the participants also exercised the hotkeys on the keypack. The participants then completed the Exit Questionnaire. It contained items regarding the different input devices and asked participants rate to how often they would expect to use each device for various functions.
There were some changes to the ASDE-X model for the usability assessments between Week 1 and Week 2. These changes were primarily to correct computer “bugs” observed during Week 1. The changes included:
decreased dwell emphasis timeout (from 1.5 sec to .5 sec),
activation of HOME button (return to default settings),
insertion of a prompt in the Preview Area when implementing leader-line changes,
removal of C/S list highlighting,
automatic default to vector length 10 when toggling vectors on,
returning to the Data Block Area submenu when exiting from the Create Trait Area menu,
activation of the keypack for inputting preferences,
activation of keyboard ENTER for entering password,
default all text entries to capitals, and
automatic clearing of invalid password messages.
The research team implemented two other changes in response to comments provided by Week 1 participants. We increased the selection (pick) area around individual icons from 2 to 5 pixels because the Week 1 participants indicated during the caucus that it was too small. In addition, we reduced the ceiling-mounted condition viewing angle from 75 degrees to 60 degrees. The Week 1 participants commented that the monitor-keyboard configuration was too steep.
19
2.7.6 27BUCaucus
The last activity each week consisted of a caucus conducted by the research team. In preparation for this meeting, the team reviewed participant PSQ, Readability, and Exit Questionnaire responses as well as HF usability and readability session notes. From these materials, they generated a summary of the number of false ratings and their impact (i.e., High, Moderate, Low) and a series of slides (ordered by ratings) identifying potential issues for discussion. The research team then convened the caucus, presented the preliminary summary of the ratings, and proceeded to cover each of the items. They encouraged the participants to provide further explanation regarding each issue and to provide examples when possible. As each issue was addressed, the team attempted to demonstrate the concern using the ASDE-X prototype, which was projected on a second screen. The participants could withdraw issues if they believed it was no longer relevant, related to a software “bug,” or based on an incorrect assumption. In instances where participants provided recommendations for changes, the team collected and clarified them. However, the intent of the caucus was to gain a full understanding of the issues so that we could present them to the WG for consideration.
3. 2BUResults
We present the results of the ASDE-X EUIE in the following sections—overview, readability, usability, exit questionnaire, and caucus. The readability section presents the Readability Questionnaire items that resulted in false ratings and the icon and data block recognition rates from the readability sessions. The usability and exit questionnaire sections identify the items that participants rated as false, their impact ratings, and their comments. The results from the caucus discussions appear in the last section.
3.1 13BUOverview
The participants’ comments and ratings of the ASDE-X CHI were extremely positive. Of 1253 total ratings (179 items x 7 participants), only 114 resulted in false ratings. Of these 114, only 13 were rated as having high impact, 36 as moderate, and 65 as low. The participants reclassified 15 false ratings as ‘non-issues’ during the caucus. Almost half of the remaining issues related to two aspects of the ASDE-X CHI: target icons and user preferences.
Overall, the participants reported that they were satisfied with the interface. Their ratings indicated that the ASDE-X system was easy to use, required minimal interaction once configured, would enhance their situation awareness of traffic in their coverage area, would help them recognize situations requiring control action, and would improve their efficiency. They rated the classroom and hands-on training as adequate, and six indicated that the system was easy to learn. The following were among the positive remarks provided by the participants.
“Functions were well thought out - a nice system was provided.”
“This unit was very well thought out.”
“I'm pleased with this system.”
“I like this feature [data block trait areas] a lot.”
“For what I need the system for the system is ideal.”
“Monitor [hardware] is excellent.”
20
3.2 14BUReadability
The results provide data collected across all four readability conditions (bright-day palette, dusk-day palette, dusk-night palette, and night-night palette). The results include target icon identification, data block identification, and questionnaire response data. The first two subsections reflect objective data collected during the readability sessions. The Readability Questionnaire provides the subjective responses for the various conditions.
3.2.1 28BUTarget Icon Identification
The research team calculated the identification rates for target icons in each window. Table 6 presents the results and the associated sample size and totals. The table identifies the icon type, sample size (n), and the accuracy rates for each window and overall. Because of the identical recognition rate of 100% and the relatively small sample size, the table presents the coast and suspend icon data as a single category. Overall, the participants identified target icons very well, resulting in 95% accuracy over the 486 identifications across lighting conditions, palettes, distances, and angles.
Table 6. Target Icon Identification by Window and Type
Icon n Window 1(n = 159)
Window 2 (n = 162)
Window 3 (n = 165) Total
Coast/Suspend 59 100% 100% 100% 100%
Heavy 129 96% 100% 100% 98%
Aircraft 149 82% 99% 96% 94%
Vehicle 87 85% 94% 100% 93%
Unknown 62 84% 94% 100% 92%
Total 486 89% 98% 99% 95%
There were differences in identification rates between windows and types of targets. Icon identification rates were lower in Window 1 than Windows 2 and 3, with the difference being mostly due to unknown, vehicle, and aircraft icons. Coast, suspend, and heavy targets were identified at or near 100% in all conditions. This is graphically represented in Figure 9, which presents the individual icon identification rates for each window and the total window identification rate. The difference in identification rates between the windows may be indicative of the manner in which the computer model presented the icons at different ranges. For the readability session, the team configured Window 1 to a large-scale map range (24,000 ft) to support an overall view of the airport. We configured the remaining two windows scaled to 5,000 ft and 10,000 ft to observe specific areas of interest. In Window 1, the icon sizes were much smaller than in the other views. The aircraft icons, in particular, were problematic, accounting for the lowest identification rate in Windows 1 and 3. In addition to the size differences at extended ranges, the use of the same color for aircraft and unknown targets may have contributed to confusion between them. The participants’ readability questionnaire ratings and caucus discussions confirmed the difficulty that they experienced identifying icons in Window 1, particularly the aircraft icon.
21
Figure 9. Target icon identification by window and type.
The overall icon identification rate of 95% was characterized by minimal differences in terms of accuracy across lighting conditions, palettes, or viewing locations (see Table 7). The data exhibit only slight differences across lighting conditions and palettes, ranging from a low of 93% to a high of 97%. That is, icon identification was high and approximately equal for both day and night palettes under each illumination condition. The lowest performance was in the day-bright condition. However, this level of illumination would rarely, if ever, be experienced in an actual tower.
Table 7. Target Icon Identification Across Conditions and Locations
Location
n
Bright Day Palette
(n = 115)
Dusk Day Palette
(n = 122)
Dusk Night Palette
(n = 123)
Night Night Palette
(n = 126)
Total
1: 8 feet, 40 degrees 141 94% 94% 95% 97% 95%
2: 8 feet, 0 degrees 153 90% 94% 94% 95% 93%
3: 5 feet, 40 degrees 138 93% 100% 97% 100% 98%
4: 5 feet, 0 degrees 54 100% 100% 94% 92% 96%
Total 486 93% 97% 95% 97% 95%
The range of viewing locations resulted in only a 5% performance difference. Although performance increments would be anticipated as participants adopted a less severe viewing angle or moved closer to the display, this is not evident in the data. This may be a reflection of the data
22
collection procedure during the first week. When a participant could not identify any two elements at a given location, the team directed them to the next viewing location. This procedure underestimated participant performance at less favorable viewing locations (i.e., decreasing the number of samples, potentially to one item). However, we balanced the viewing locations across palette and illuminance conditions, so the likelihood of underestimating performance was equivalent across these factors, thereby minimizing its effect.
3.2.2 29BUData Block Identification
The data block identification data are presented in Table 8. The table identifies the source (i.e., the window or C/S list), sample size (n), and the accuracy rates for each condition and overall. The participants successfully identified 77% of all data blocks requested. Their performance remained very stable regardless of palette or light level, resulting in a range of only 3% across all sources. They performed better in Windows 1 and 3 than in Window 2. Window 2 had the highest concentration of aircraft targets, which may have cluttered the window and made reading the data blocks more difficult. Data block readability in the C/S list was nearer the Window 2 level than Window 1.
Table 8. Data Block Identification Across Conditions and Sources
Source
n
Bright Day Palette
(n = 82)
Dusk Day Palette
(n = 88)
Dusk Night Palette
(n = 84)
Night Night Palette
(n = 87)
Total
Window 1 88 81% 83% 81% 74% 80%
Window 2 86 71% 68% 76% 68% 71%
Window 3 85 80% 83% 90% 86% 85%
Coast/Suspend list 82 70% 75% 67% 86% 74%
Total 341 76% 77% 79% 78% 77%
Participant viewing location did affect data block identification rates (see Table 9). The total identification rate increased as participants moved to more favorable viewing locations, increasing incrementally from 59% to 95%. As anticipated, they performed better when closer to the display and when in front of the display. Performance was lowest at the extreme distances and angle with the day palette under bright illumination. Glare from the Pallite lamp may have affected their performance in that condition.
23
Table 9. Data Block Identification Across Conditions and Locations
The participants completed five items at the conclusion of each readability condition. They completed Items 1-5 using the day palette in the day condition and items 6-10 using the same palette at dusk. Table 10 presents the 4-day condition and one dusk condition items for which the participants provided false ratings. The first column presents the lighting condition. Columns 2 and 3 contain the statements that the participants rated as false and the impact that they assigned. The number 2 in parenthesis in the Impact column indicates that two participants provided a medium impact rating to Item 9 for the same reason. The last column shows the participants’ comments. One participant indicated that the artificial light used during the bright condition resulted in glare on the frame of the monitor. During the caucus, the group reclassified this rating as a ‘non-issue’ because it was a consequence of the testing environment.
Table 10. Day Palette Readability Questionnaire Items with False Ratings
No. Item Impacta Comment 1 Readability of the ASDE-X
display is acceptable when you are close to the monitor.
M Glare of Pallite lamp reflected from frame of monitor.
2 Readability of the ASDE-X display is acceptable to support your task at extended angles and distances.
H Dependent on character size.
M Yellow is very difficult to see immediately upon looking up. It requires more focus time than the color white.
3 Readability of the data blocks is acceptable from your typical working distance. L The small amount of traffic in the scenario may not be a true
representation. H; M
In Window 1, the target icons were difficult to differentiate, even when close. Windows 2 and 3 were easier.
D A Y
4 Differentiation of the target icons is acceptable from your typical working distance. M Unknown and Aircraft icons look very much alike on large-
scale map range or at a distance, since both are white. Consider changing the color of one of the icons.
M (2) Targets of regular aircraft are too small on the large-scale map range.
M In Window 1, it is too difficult to differentiate between target icons and to see the color differences.
D u s k
9 Differentiation of the target icons is acceptable from your typical working distance.
L Difficult to differentiate between unknown and regular aircraft. aImpact: H = High, M = Moderate, L = Low, (#) = Duplicate responses.
24
The day palette data included three false ratings regarding the readability of data blocks and seven regarding the differentiation of target icons. The comments on data blocks addressed three different aspects of the display: character size, text color, and traffic count. For the traffic count comment, the participant indicated that with more traffic it would be more difficult to differentiate between densely packed targets and data blocks. The target icon issues showed substantial agreement among the participants. They expressed difficulty differentiating between target icons because of the small icon size, particularly in Window 1 (the large-scale range). This issue alone accounted for one high and three of the moderate impact ratings. The remaining comments focused on the difficulty in differentiating between unknown and aircraft target icons, especially making color discriminations between small target icons such as in the large-scale map range. The questionnaire ratings were closely aligned with the objective data collected. Both reflected the difficulty in discriminating between targets when using the large-scale map range.
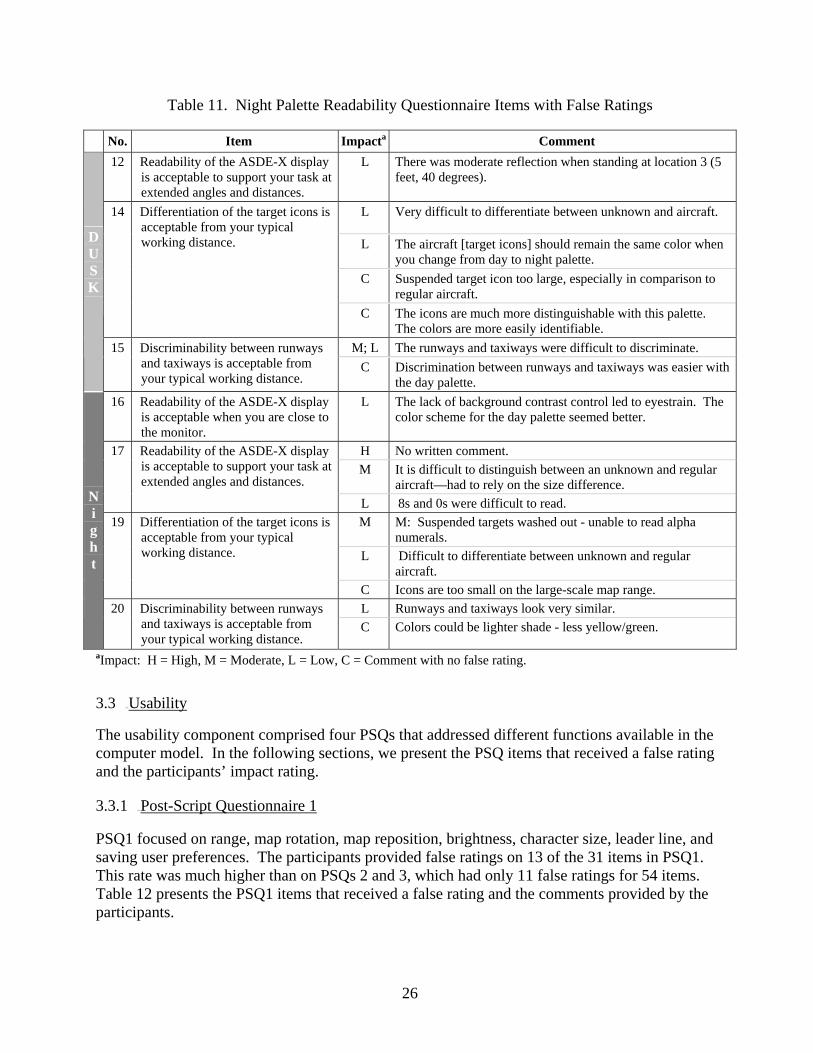
The two night palette conditions resulted in 12 false ratings (see Table 11). Items for which participants indicated there was no impact but provided a remark have a C in the Impact column. Of the false ratings, only one received a high impact rating: readability at extended angles and distances. There were three moderate and eight low impact ratings. The issue that represented the largest consensus, difficulty differentiating between unknown and aircraft target icons, had been previously identified during the day palette condition.
In response to the readability question in Item 17, one participant indicated difficulty differentiating between 8s and 0s in the font used. A review of the readability data indicates that of 40 incidences of misidentification of a number, 8 was misidentified as an alternate number on 17 occasions, 14 of which were with the number 0. On another four occasions, 6 was identified as the number 8. Because 62.5% of all numeric error involved an 8, a review of the font may be warranted.
The participants raised three issues that were unique to the night-palette condition. These included difficulty differentiating between runways and taxiways, the preference for target icons to remain the same color on both day and night palettes, and the occurrence of eyestrain that one individual attributed to the low background contrast. The participant who raised the issue regarding lack of differentiation between taxiways and runways stated it would be of minimal impact because the controller would know the areas. As illustrated in Figure 4, four of the six target icons alternate from white to green as the day and night palette is selected. The heavy aircraft and vehicle icons remain unchanged between the day and night palettes. The participant who reported experiencing eyestrain indicated a preference for the day palette and noted that he would likely use that palette regardless of lighting conditions.
25
Table 11. Night Palette Readability Questionnaire Items with False Ratings
No. Item Impacta Comment
12 Readability of the ASDE-X display is acceptable to support your task at extended angles and distances.
L There was moderate reflection when standing at location 3 (5 feet, 40 degrees).
L Very difficult to differentiate between unknown and aircraft.
L The aircraft [target icons] should remain the same color when you change from day to night palette.
C Suspended target icon too large, especially in comparison to regular aircraft.
14 Differentiation of the target icons is acceptable from your typical working distance.
C The icons are much more distinguishable with this palette. The colors are more easily identifiable.
M; L The runways and taxiways were difficult to discriminate.
D U S K
15 Discriminability between runways and taxiways is acceptable from your typical working distance.
C Discrimination between runways and taxiways was easier with the day palette.
16 Readability of the ASDE-X display is acceptable when you are close to the monitor.
L The lack of background contrast control led to eyestrain. The color scheme for the day palette seemed better.
H No written comment.
M It is difficult to distinguish between an unknown and regular aircraft—had to rely on the size difference.
17 Readability of the ASDE-X display is acceptable to support your task at extended angles and distances.
L 8s and 0s were difficult to read.
M M: Suspended targets washed out - unable to read alpha numerals.
L Difficult to differentiate between unknown and regular aircraft.
19 Differentiation of the target icons is acceptable from your typical working distance.
C Icons are too small on the large-scale map range.
L Runways and taxiways look very similar.
N i g h t
20 Discriminability between runways and taxiways is acceptable from your typical working distance.
C Colors could be lighter shade - less yellow/green.
aImpact: H = High, M = Moderate, L = Low, C = Comment with no false rating.
3.3 15BUUsability
The usability component comprised four PSQs that addressed different functions available in the computer model. In the following sections, we present the PSQ items that received a false rating and the participants’ impact rating.
3.3.1 31BUPost-Script Questionnaire 1
PSQ1 focused on range, map rotation, map reposition, brightness, character size, leader line, and saving user preferences. The participants provided false ratings on 13 of the 31 items in PSQ1. This rate was much higher than on PSQs 2 and 3, which had only 11 false ratings for 54 items. Table 12 presents the PSQ1 items that received a false rating and the comments provided by the participants.
26
Table 12. PSQ1 Items with False Ratings
No. Item Impacta Comment
4 The range of range values and the steps between range increments are acceptable.
L Minimum range may not need to be as low as 300' but it causes no problems.
6 The methods for changing the range setting are acceptable.
M On the keyboard, it would be easier to type in the actual range. It eliminates the additional step of thinking how to use a different digit to make it work (i.e., 3 = 300 ft).
L (2) When moving slew ball right, the map rotates counter clockwise. This goes against all other computer functions both PC and ARTS.
8 When rotating the map, the display response to your input is acceptable.
L Too slow, needs acceleration.
H Range of movement is extremely limited at small-scale range [computer range of movement issue].
11 The range of movement available for repositioning the map is acceptable. C Does not move at the same rate as the cursor - would be nice if it
did.
13 Overall, the Map Reposition function is acceptable.
L Duplicate of Item 11 comment.
14 The number of brightness controls is acceptable.
M Need brightness settings for DCB background, foreground, and frames, specifically for night and low light conditions.
L Except when DCB is on right or left side [labels don’t fit on the buttons].
18 The text font is acceptable.
C Fonts are too wide.
L The range from smallest to largest is fine. Adding more choices between sizes would allow more flexibility.
20 The range of character sizes and the steps between character sizes are acceptable. C Need larger character sizes (aging workforce).
21 Overall, the Character Size function is acceptable.
L The range from smallest to largest is fine. Adding more choices between sizes would allow more flexibility.
L Implied function for keyboard is different from other keyboard functions. It could be a "multifunction" followed by instruction for consistency.
L Except [for individual targets] when in ranges greater than 150.
22 The method for adjusting the leader line direction is acceptable.
C Keyboard best.
25 The range of leader line lengths is acceptable.
L Need a smaller minimum length. Upper end is too large. Recommend using a variable length—possibly decimal values.
M (3) The procedure is confusing and requires too many steps.
M Is a password required? ARTS preferences require only our initials and the preference sets are not protected.
C Should have SAVE AS function - many changes will be made to existing files.
30 The method for saving user preferences is acceptable.
C Change the "enter" key label to "enter/ok.”
31 The functions I used in this script are intuitive.
M Not intuitive. The functions would require practice.
aImpact: H = High, M = Moderate, L = Low, C = Comment with no false rating, (#) = Duplicate responses.
27
The range function resulted in one medium and one low impact rating. One comment reflected the participant’s preference for entering the actual range instead of using hundreds of feet, and the other indicated that the minimum range of 300 ft would never be used. Both issues were withdrawn during the caucus. The first issue was withdrawn because it reflected a user expectation based on interacting with the computer model in a lab environment and not extrapolating it to use in the tower. The second was really an observation and did not reflect an impact to performance.
The participants gave five false ratings (one high, four low) on map manipulation functions in response to Items 8, 11, and 13. Two remarks focused on the limited range of map movement in the small-scale range. When zoomed in on a secondary map, the computer model did not permit the participant to move this map to an area beyond that visible in the main map window. Discussion during the caucus session confirmed this to be a modeling issue. A second map-related issue that resulted in two low ratings was the observation that the map moved counter-clockwise in response to clockwise input. The participants found this to be counter-intuitive, though they did indicate it would likely be easy to get used to one. In the final false rating, a participant indicated that the map reposition function operated too slowly.
The brightness function resulted in one moderate impact rating. The participant indicated a need for more functionality in adjusting the DCB brightness. Specifically, they expressed a need for modifying the DCB background, foreground, and frame.
The font-related items in PSQ1 resulted in three low-impact responses. Two of these from the same individual stated that though the overall range of character sizes was acceptable, there was a need for intermediate sizes. The other rating indicated that the DCB labels were unreadable when the DCB was placed on the left or right side of the display. The group demonstrated this during the caucus session. Some DCB labels default to three lines when the DCB is moved to the sides of the display and, therefore, no longer fit on the button. The participants wrote some comments that they did not rate as issues. These included a request to increase the maximum character size and the observation that the font stroke width may be too wide.
The participants provided three low impact ratings in response to items about adjusting the leader-line direction and length. The responses focused on three different areas. One participant stated that the implied leader-line functions behaved differently from other commands and suggested implementing a ‘multifunction’ command. Further review during the caucus confirmed that the implied functions, as implemented, were consistent with most versions of ARTS and that the comment resulted from differences in fielded ARTS. Another participant identified difficulty in selecting individual targets in windows with large-scale map ranges as an issue. This item, which was related to the pick area, also surfaced during other aspects of the EUIE. In response to dialogue on this topic during the caucus, the pick area was increased during the second week. The participants made only one comment about the pick area in Week 2. Regarding the third issue, the participant indicated that the range of leader-line lengths was inappropriate. He suggested decreasing the minimum length (possibly to a few pixels), reducing the maximum length, and providing intermediate line lengths.
28
The user preference function represented an aspect of the ASDE-X interface that received a number of false ratings. Three of the four moderate impact ratings on PSQ1 about user preferences were directed at the number of steps required. The participants indicated that the procedure was confusing. The remaining item questioned the need for a password because it is not required in ARTS. The participants offered some ideas to improve the user preference function. One participant recommended providing a SAVE AS capability. In Week 1, a participant recommended modifying the ENTER key label to ENTER/OK and activating the keyboard ENTER for this function. The research team implemented this for Week 2. In Item 31, one participant indicated that the functions in PSQ1 were not intuitive. Subsequent discussions indicated that this comment was predominantly focused on the user preference function.
3.3.2 32BUPost-Script Questionnaire 2
The functions in PSQ2 that resulted in false ratings included selecting, loading, and saving user preferences; toggling the C/S list; repositioning the preview area; creating new windows; and adjusting leader lines in secondary windows. Table 13 presents the items, their associated ratings, and related comments. The majority of false ratings in PSQ 2 resulted from the user preference function. This function accounted for eight impact ratings (four moderate and four low), which indicated that the number of steps involved was excessive. The other functions resulted in one false rating each (two high and three low impact). Two of them reflected a preference for an alternate method for interacting with display elements. These included using slew and enter to move the C/S list and predefining the area of interest when creating a new map window. One participant noted that the display responded slowly when repositioning the preview area. PSQ2 also reflected a high impact rating regarding the DCB labels not being completely visible when the DCB was located on either side of the display. A participant recommended activating the secondary window border for adjusting the leader-line direction in response to identifying this as an issue.
3.3.3 33BUPost-Script Questionnaire 3
PSQ3 functions included associating a local database tag to a target, managing data blocks, managing targets (i.e., suspending, re-initiating, and terminating control), toggling data blocks on and off, defining trait areas, using scratchpads, manipulating secondary windows, and saving user preferences. Of these, only three resulted in false ratings (two moderate and one low): user preferences, associating local database tags to a target, and defining trait areas (see Table 14). One of the issues reaffirmed the PSQ1 ratings indicating that the number of steps for saving user preferences was excessive. The other moderate rating was related to the inability to modify trait areas once they were defined. Whenever a user defines a data block area and its traits (leader-line direction or length, data block character size, data block elements, etc.) and then exits the function, they can no longer modify the trait area. During the caucus, the participants indicated that modifications to the trait areas would be required on a relatively frequent basis. The remaining issue reflected one user’s inquiry into the procedure for tagging a target that was not included in the local database list. The group addressed the issue during the caucus session.
29
Table 13. PSQ2 Items with False Ratings
No. Item Impacta Comment M; L Unlike other functions, steps to save user
preferences seem excessive and too detailed. C Security is not needed for selecting and loading
preferences.
3 The methods for selecting and loading user preferences are acceptable.
C Keypad functions seemed awkward. M (2)L (2)
Too many steps. Saving user preferences would require practice.
4 The method for saving user preferences is acceptable.
C Should be able to modify a preference without deleting an existing preference.
5 Overall, the user preference function is acceptable.
M; L Too many steps.
10 The methods for toggling the C/S list on and off are acceptable.
L Use slew enter function to highlight and move.
12 Overall, the Preview Reposition function is acceptable.
L Mouse/slew too slow.
17 Overall, the DCB RPOS function is acceptable. H When the DCB is positioned to the right or left, the labels are not readable.
The methods for creating a new map window are acceptable.
H It would be easier if the area could be predetermined – same as determining the trait areas.
L Must exit secondary window and go to the main window to adjust leader line direction.
26 The methods for adjusting the leader line direction within a secondary window are acceptable.
C Activate secondary window border for leader line direction changes.
aImpact: H = High, M = Moderate, L = Low, C = Comment with no false rating, (#) = Duplicate responses.
Table 14. PSQ3 Items with False Ratings
No. Item Impacta Rating/Comment 1 The methods for associating a local aircraft/
vehicle tag to a target are acceptable. L How do you tag a target that is not in the local list?
15 The functions in the Define Trait Area are acceptable.
M Should be able to return to define trait area to change preferences at a later time.
26 The method for saving user preferences is acceptable.
M Too many steps.
aImpact: M = Moderate, L = Low.
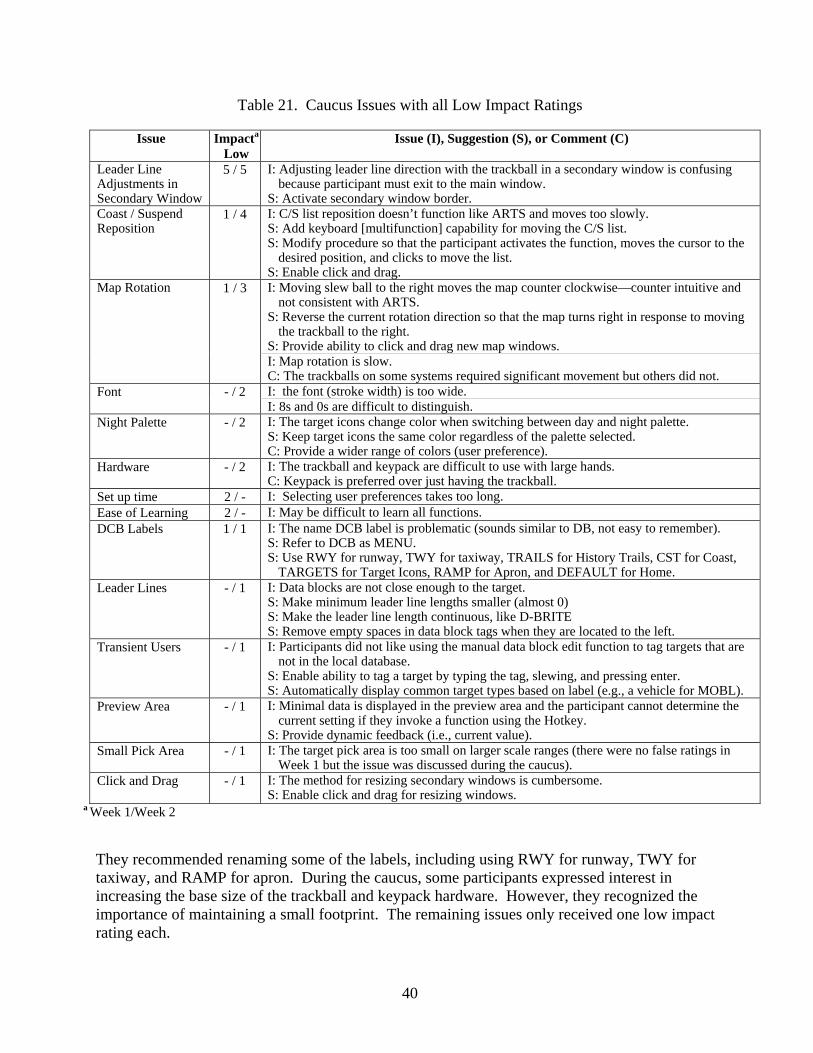
3.3.4 34BUPost-Script Questionnaire 4
During the fourth usability session, the participants repeated functions that they had performed during previous sessions but with the alternative display configuration. PSQ4 resulted in 14 false ratings for nine different items. Of these, two were rated as high impact, three as moderate, and nine as low. Table 15 presents the items and the participants comments. Most of the issues raised in this questionnaire addressed items that the group had previously noted. These included increasing the maximum character size, revising the leader-line direction implied function,
30
minimizing the number of steps required by user preferences, providing the ability to modify trait area characteristics once the function had been exited, and repositioning the C/S list. In the caucus, the participants withdrew the suggestion to revise the leader-line functionality because its operation was consistent with ARTS.
Items 7, 18, 19, and 20 in Table 15 reflect three new issues. Item 7 is related to the need to exit the Tool submenu and return to the main DCB menu to activate the velocity vectors. Item 18 addressed the difficulty that one participant experienced in locating the vector speed adjustment. Though the vector on/off function is located on the main DCB toolbar, the speed adjustment is located on the tool submenu. Items 19 and 20, which accounted for two high and two moderate ratings, represented the same issue—the keyboard-monitor configuration. The ratings were restricted to the ceiling-mounted condition in Week 1. At the first caucus, the participants noted that the viewing angle in the laboratory was too steep. As a result of reducing the viewing angle and increasing the viewing distance between weeks, no similar concerns were reported during Week 2.
Table 15. PSQ4 Items with False Ratings
No. Item Impacta Comment 5 Overall, the Character Size function is
acceptable. M The maximum font size should be increased.
6 Overall, the Leader Line Direction function is acceptable.
L The implied function may be invoked accidentally. Consider using a function key (e.g., “L”) then # (direction) and enter.
7 Overall, the toggle Velocity Vector on/off function is acceptable.
L Difficult to get back into when creating a new window – controls override a fresh window.
L (2) Too many steps. 9 Overall, the user preference function is acceptable. C Can the process be shortened into a couple of keystrokes?
10 L Make function consistent with ARTS by initiated with a keyboard entry (i.e., multi-c, slew, enter).
Overall, the Coast / Suspend List Reposition function is acceptable.
L The trackball has to be moved a lot to effect a change in position. Consider activating function, moving the cursor to the new position, and clicking to move the list.
L You should be able to make changes to a trait area even after you exit it. Currently you must delete the defined area and begin over.
17 Overall, the Define Trait Area function is acceptable.
L L: Should be single click instead of double click (computer model issue).
18 The functions I used in this script are intuitive.
L User preferences were not. I had to look for the vector speed adjustment.
H [Week 1, ceiling mount] Keyboard and monitor should be together.
19 The monitor-to-keyboard configuration I used during this script is acceptable.
M [Week 1, ceiling mount] The monitor was at too steep of an angle. It would be farther back in the tower.
H [Week 1, ceiling mount] It was difficult to use this monitor location. The DCB was difficult to read.
20 Overall, the alternate monitor location did not interfere with my ability to perform the functions in this script. M M: [Week 1, ceiling mount] Harder to read and keystrokes
required constant looking up and down. aImpact: H = High, M = Moderate, L = Low, C = Comment with no false rating, (#) = Duplicate responses.
31
3.4 16BUExit Questionnaire
The Exit Questionnaire contained three sections: Input Method Usage, Overall Component Acceptability, and General Human Factors. The following subsections present the results for each.
3.4.1 35BUInput Method Usage
In the first section of the Exit Questionnaire, the participants rated how often they expected to use each of the available input methods to perform functions. The scale ranged from 1, indicating that they would never use that input method, to 5, indicating that they would always use it. Table 16 presents the average ratings for each and the standard deviation (SD). When comparing input methods for a function, the highest value indicates the preferred method. For example, Item 1a indicates that most participants expected to use the trackball instead of the keyboard to select the preference set function. The keypack did not support this function. The SD, which is presented after the average rating, is a measure of the variability of the responses. A lower SD indicates that the responses were clustered near the average.
Table 16. Participant Ratings of Input Method Usage
Average Ratinga (SD) Function
Keyboard Trackball Keypack
1a. Select the preference set function 2.1 (0.38) 4.1 (0.38) b —
1b. Choose a preference set 2.3 (1.03) 4.0 (0.58) b 2.3 (1.03)
2. Select initiate control of a suspended track 1.9 (0.69) 2.7 (1.38) 4.1 (1.07) b
3. Select suspend a track 2.0 (0.58) 3.0 (1.29) 3.9 (1.07) b
4. Select terminate control of a track 2.0 (0.58) 3.0 (1.29) 3.9 (1.07) b
5. Toggle the data blocks on and off for a window 2.6 (1.51) 3.7 (1.25) b —
6. Select the map reposition function 1.7 (0.76) 4.4 (0.53) b —
7. Toggle the day and night palette 2.4 (1.27) 3.4 (1.13) b 3.3 (1.37)
8. Select create a new window 2.1 (1.35) 3.7 (1.25) b —
9. Select the home function 1.6 (0.53) 3.9 (1.35) b —
10. Adjust (rotate) the map orientation 1.6 (0.53) 3.6 (1.27) b 3.0 (1.41)
11. Adjust the brightness 1.7 (0.49) 4.3 (0.49) b 2.3 (1.38)
12. Adjust the character size 2.0 (1.00) 4.0 (0.82) b 2.7 (1.60)
13. Adjust the leader line direction 2.3 (1.38) 2.3 (0.95) 4.4 (0.79) b
14a. Select adjust history trail length 2.1 (0.69) 3.6 (0.98) b —
14b. Adjust the number of history trails 2.0 (0.82) 3.3 (1.38) b 2.0 (0.82)
15. Toggle the coast/suspend list on and off 2.6 (1.13) 3.6 (1.27) b —
16a. Select adjust leader line length 2.4 (0.98) 3.6 (0.98) b —
16b. Adjust the leader line length 2.1 (0.69) 3.6 (0.98) b 2.4 (0.98)
17. Select reposition preview area 2.7 (1.11) 3.7 (0.95) b — a Rating (1 = never, 5 = always) b Preferred method
32
The table shows that the participants generally preferred the trackball to any other input method. The four exceptions were initiating control of a suspended track, suspending a track, terminating control, and adjusting the leader line direction. For each of these functions, the participants rated the keypack as preferable. When toggling between day and night palettes, the ratings reflected a preference for the trackball over the keypack, but the difference was very small. The keyboard was not preferred for any function and was always at least one point less than the preferred method.
3.4.2 36BUOverall Component Acceptability
This section of the questionnaire addressed the overall acceptability of several functions and basic capabilities as a whole. Whereas the PSQs addressed various aspects of each function in detail, this form provided an overall assessment of which functions were performing adequately and which may require review. As such, many of the responses reiterate the issues previously identified. The research team added two items during the second week to investigate whether the functions selected for hotkeys on the keyboard and keypad were acceptable. Several items received no false ratings, indicating that the current implementation is acceptable. These aspects include map elements, number of target icons, leader lines, representation of target movement, system mode and health indicators, indication of coasted targets, and the monitor, keyboard, and keypack hardware. Approximately half of the 25 items resulted in at least one false rating. Of the 27 false ratings, 3 were rated with high impact, 7 with moderate impact, and 17 with low impact (see Table 17).
Item 1 dealt with the time to set up for the start of a shift using preference sets. Four of the participants had previously identified the number of steps required by the user preference function to be an issue on the PSQs. Two of them reiterated the need to simplify the process and to provide a quick method to invoke user preference sets.
The DCB item resulted in one moderate and one low impact rating. The issues raised included difficulty remembering the location of functions because of the number of buttons and the amount of time required to navigate submenus. The first may have been due in part to limited time on the system, although another participant had previously reported difficulty locating the vector speed function. The second concern, regarding the number of steps within submenus, received one low rating. Discussion during the caucus suggested that the participant was unaware that the keyboard ENTER button could be used to complete a function.
The majority of the false ratings in the Exit Questionnaire were in response to Item 4 about the aircraft, heavy, and vehicle icons. The high, moderate, and low impact categories each received two responses. Item 5, regarding the remaining icons, received another high, three moderate, and one low impact rating. In all, these items accounted for 11 false ratings. The major concern was that the aircraft, heavy, vehicle, and unknown target icons were too small on the large-scale map range. Some participants noted that the coast and suspend icons were too large and that the tags were difficult to read. The size of these icons is dependent upon the data block font size selected. As the font size is increased to 6, the coast and suspend target icons become several times larger than other targets. The text on these targets was also difficult to read.
33
Table 17. Exit Questionnaire Section II Items with False Ratings
No Item Impacta Comment L (2) Need a to be able to set up preferences quickly and take position in
the "heat of battle". 1 The time to set up this system
using preference sets at the start of a shift is acceptable. C Impact is low because I wouldn't use it.
M There are so many keys and functions it is very difficult to remember where they are.
2 The Display Control Bar [DCB] is acceptable.
L Submenus are time consuming - "done" could be implied when "enter" or slew is out of box.
H (2) M (2) L (2)
The icons are too small at the large-scale map range (especially regular aircraft).
4 The aircraft, heavy aircraft, and vehicle icons are acceptable.
C Could be better if large were distinguished from small. H Could not distinguish number from background on coast and suspend
targets. M (2) Unknown icon is very small at the large-scale map range.
M Coast and suspend icons are too large - same symbology would be fine - just not larger than regular aircraft.
L Except at the large-scale map range.
C Coast and suspend are fine.
5 The unknown, coast, and suspend track icons are acceptable.
C Use another color for unknown or aircraft to help distinguish between them.
M Increase the maximum font size to support distance work and controller preference.
9 Data blocks are acceptable.
C Add an ALL button in the DB field menu to toggle all options back on, as opposed to selecting each one individually.
L (3) Should be able to modify a trait area after it has been defined and not have to delete it and start over again.
10 The data block trait areas are acceptable.
C I like this feature a lot. 11 The data block off areas are
acceptable. L Should be able to modify them.
L Background areas were indistinguishable on the night palette. Background could be important to identify gates or important non-movement areas. The movement areas were acceptable.
L The night palette caused eyestrain.
12 The palette I used during the usability sessions is acceptable.
C I preferred the night palette for day and night conditions. L Use of two digits is time consuming - consider 1 digit or alpha
character. C Remove border around C/S list (2 participants).
14 The Coast / Suspend List is acceptable.
C Shorten highlight "dwell" so that identity highlights quicker 15 The preview area for monitoring
data entries is acceptable. L Minimal data is displayed.
22 The trackball hardware is acceptable.
L Current mounting hardware could be improved, difficult to use with large hands.
L Needs a wider base. 23 The keypack hardware is acceptable. C The keypack is the best option.
25 The trackball is acceptable for adjusting leader line direction.
L Somewhat cumbersome. When changing leader direction within a secondary window the arrow direction should be able to remain within the parameters of that window.
aImpact: H = High, M = Moderate, L = Low, C = Comment with no false rating, (#) = Duplicate response.
34
The participants made only two comments about data blocks. On Item 9, one participant repeated the suggestion to increase the maximum font size. Another suggested providing an ALL button on the data block area submenu so that all available data block components could be toggled on with a single action instead of having to toggle each one on independently.
One participant liked the data block trait feature (Item 10). This function resulted in three low impact ratings on the Exit Questionnaire, all of which related to the inability to modify traits once an area was defined. This reaffirmed the issue that was raised on PSQ 3 and 4. The last item reiterated a previous issue—the need to activate the secondary window border for leader-line direction changes. One participant entered a low impact rating for this item.
For Item 12, two participants gave low impact ratings about the night palette. One participant reported experiencing eyestrain. The other expressed difficulty distinguishing between background areas, noting concern in identifying gates or other important non-movement areas. Another participant, however, preferred the night palette for both day and night conditions.
One participant provided a low rating for Item 14, the C/S list item. This rating resulted from a misunderstanding because two characters were not required for this function. For Item 15, the participant provided the low rating because of a desire to display the current value in the preview area.
The hardware generally received very favorable comments and ratings from the participants. The keyboard and monitor hardware received no false ratings. One participant stated that the monitor was excellent. The participants gave one low impact rating on the trackball and one on the keypack. Both comments focused on the difficulty using the hardware with large hands. The participant suggested increasing the size of the base on the keypack.
3.4.3 37BUGeneral Human Factors
This section covered several fundamental human factors constructs including information content and organization, display clutter, icons, labeling, fonts, color coding, window management, input devices, training, number of steps, menus, feedback, and task support. Ten of the 29 items received false ratings (see Table 18). Of these, one represented a system anomaly, six represented previously identified issues, and the remaining three represented new issues. Item 16 is not addressed because it most likely resulted from an operating system error, which was corrected by rebooting the system.
The six items raised in this section that had been identified previously were related to icons, character size, window management, pick area, number of steps in preference sets, and the need for DCB brightness adjustments. The item addressing icons received the majority of false ratings. Three participants reiterated that aircraft icons were too small on large-scale map ranges, and another addressed the similarity between aircraft and unknown icons. One participant expressed difficulty reading data blocks and suggesting increasing the font size. Another comment focused on providing more click and drag options, a suggestion supported by many of the participants during the caucus. In response to feedback from Week 1, the research team increased the pick area for targets for the second week. This facilitated target selection, yet one participant noted in
35
Table 18. Exit Questionnaire Section III Items with False Ratings
No Item Impacta38BComment
H (2) M
Aircraft icons are too small at the large-scale map range. 5 Icons are easy to interpret.
M Unknown and aircraft icons are too similar.
L Use a different name than DCB—it's too close to DB and takes a while to get used to. Consider calling it menu.
L Rename HOME as DEFAULT.
6 The meaning of each DCB label is apparent.
C Shorten DCB labels–RWY for runway, TWY for taxiway, ALT for altitude.
8 The fonts used are clear and easy to read.
M The tags are more difficult to read than ARTS tags. [Font size issue]
L Need more options with "drag" functions. 10 Windows are easy to locate, size, and reposition. C Should be able to identify the center of the area that is desired
before opening a new window.
14 The trackball allows the participant to precisely position the cursor within a small area.
L Has limitations on larger scales. [Small pick area]
16 Keystrokes or other data entry actions appear immediately on the screen.
L System anomaly.
M L (2)
Some functions (e.g., preference saving) required too many entries to complete. Selecting “done” often seemed unnecessary.
18 The number of control actions necessary to input data or perform a function are reasonable.
C Consider windows X technology for implied operations.
L Need more brightness options for preferences on DCB. 20 The DCB is easy to use and does not provide too many options or levels. C Need more single click options. Too many double-clicks
required—use single clicks. [Caucus: system anomaly]
21 This system provides feedback on the status of an initiated action.
L When entering the number corresponding to the desired leader line direction, the preview area only shows "DIR." It does not indicate the direction selected.
22 This system is easy to learn. L Realistically a controller will only use a few functions, so the ease of learning the entire spectrum of usability is not terribly important.
aImpact: H = High, M = Moderate, L = Low, C = Comment with no false rating, (#) = Duplicate response.
Week 2 that the pick area seemed too small when using large-scale maps. The number of steps to perform the user preference function resulted in three additional false ratings. The need for providing more brightness control options for the DCB resulted in another low impact rating.
The three new issues all received low impact ratings. On Item 6, a participant recommended changing the acronym DCB. The reasons were twofold: the similarity between DCB and DB, and difficulty recalling what DCB stood for. MENU was suggested as an alternative. Another suggestion was to rename the HOME button as DEFAULT. The HOME button resets the display to a default condition but, based on ARTS terminology, one participant believed that this button was the CURSOR HOME function. In response to the item about feedback, a participant noted that the preview area does not provide sufficient information when adjusting the leader-line direction. Though the research team modified the model to display LDR DIR # in the preview
36
area in Week 2, the model still did not provide dynamic feedback of current settings when a function was invoked (e.g., character size, leader direction, brightness). The third new item related to ease of learning. One participant indicated that the system might take some time to learn but rated the issue as low because of expectations that most controllers would routinely use only a subset of the functions.
3.5 17BUCaucus
At each caucus, the research team presented slides summarizing the issues raised during the week. After outlining the review procedure, we asked the participants to provide additional explanation or examples for each issue. The research team presented the computer model on a separate screen and demonstrated each issue as necessary. The participants were free to recommend solutions. However, our goal was to gain a full understanding of the issue so that we could present it to the WG.
This section contains four tables summarizing the slide content from both weeks. Three tables contain issues classified according to the most severe participant impact rating received during the EUIE. For these tables, the first column presents the issue title and the impact column identifies the participants’ impact ratings (high, moderate, or low) for each week. The final column identifies the issue (I), suggestion (S), or demonstration (D) resulting from the caucus. The last table identifies those items that the groups reclassified as non-issues during the caucuses.
Four issues received at least one high impact rating during the EUIE (see Table 19). Of the four issues, target icons received the most ratings, with 3 high ratings each week and an additional 11 moderate and 5 low ratings over the 2 weeks. In the caucus, the group affirmed that all icon sizes, with the exception of suspend and coast targets, were too small on large-scale map ranges. This resulted in difficulty identifying targets and seeing color differences to differentiate between target types. The coast and suspend target data tags are located within the target icons, therefore, the target size is determined by the data block font size. As the data block font size is increased, these targets become increasingly larger until they are several times larger than any other target. Another related issue raised by one participant each week was difficulty reading the coast and suspend tags due to lack of contrast. A suggestion was to treat coast and suspend numbers like any other data tag and associate them by leader lines. The participants also indicated that the aircraft targets were especially small in relation to unknown targets. Using the ASDE-X computer model, the group confirmed that at large map-scale ranges, the aircraft icon size became much smaller than the unknown target size. Some participants indicated that during the readability session, they had relied on this disparity to differentiate between the two types of targets but that color differences might be useful.
Two participants noted difficulty reading DCB labels. The group confirmed during the caucus session that when located on the left or right of the display, some of the DCB labels extend beyond the buttons. This was especially evident in the trait area submenu buttons. During the first week, one participant rated the need to preselect the area of interest when creating a new map window as a high impact item. They noted that ARTS permits participants to preselect the center of an area of interest when creating a new view, and the ASDE-X interface supports this capability when defining a new trait area. During the session, the participant agreed that this item was really a preference and not a high impact issue.
37
Table 19. Caucus Issues with at Least One High Impact Rating
Impacta Issue High Mod. Low
Issue (I), Demonstration (D), or Suggestion (S)
I: Most target icons, especially regular aircraft icons, are too small on large range scale (e.g. 24,000). Most common target is regular aircraft, but its icon is the smallest.
D: The aircraft icon is much smaller than other icons at large scale ranges. S: Increase size of heavy, aircraft, vehicle, and unknown targets at large scale
range.
I: It is difficult to distinguish between Unknown and Regular Aircraft icons on large range scale.
S: Change the color for unknown or aircraft icon. S: Always show a tag at the end of a leader line (UNK for Unknown).
Target Icons 3 / 3 5 / 6 - / 5
I: Suspend and coast targets are too large. S: Use a leader line to associate these targets with the number.
Suspended / Coast Target Readability
1 / - - / 1 - / - I: Suspend and Coast tags are not readable. S: Use leader lines for Coast and Suspended targets. S: Use letter-number (e.g., C301, S02) instead of call sign.
DCB Location
1 / - - / - - / 1 I: DCB labels (especially in trait area submenu) are not readable when DCB is located on the left or right of the display.
S: Shorten labels (e.g., RWY for runway, TWY for taxiway, Trails for History Trails, CST for Coast, Targets for Target Icons, and Ramp for Apron).
New Map Window
1 / - - / - - / - I: Cannot preselect the area of interest when creating a new map window. S: Use the same method for defining new map areas as for defining trait areas. S: Participant who made the comment said it is a “nicety” not a necessity.
a Week 1/Week 2
Seven issues received at least one moderate impact rating during the EUIE (see Table 20). Of these, font size accounted for the most false responses with four moderate and two low ratings. Trait areas received five false ratings. The issues related to passwords, number of functions on the DCB, and the need for DCB brightness controls each received less than three false ratings.
Based on experience from the readability session, one participant indicated that the current maximum character size was too small, especially for viewing from extended angles and distances. In the caucus, the participants reiterated that the six available character sizes were restrictive and that additional intermediate sizes are needed. At the caucus, several participants confirmed the need to return to a defined trait area to modify the existing trait area characteristics. One participant suggested that this could be accomplished through the addition of a “Modify Trait Area” button.
Difficulty differentiating between runways and taxiways on the night palette and the number of steps each resulted in one moderate and two low ratings. The participant who reported experiencing eyestrain during the readability session attributed it to the poor contrast between the taxiway and runway night palette elements. This may have been due to the brightness settings.
38
Table 20. Caucus Issues with at least one Moderate Impact Rating
Impacta Issue Issue (I), Demonstration (D), or Suggestion (S)
Mod. Low
- / 2 I: Largest available font size needs to be increased and there are not enough intermediate font sizes.
S: Increase largest font size to at least the size available on ARTS.
Font Size 4 / -
S: Increase the number of intermediate settings. S: Use fractional increase instead of double sizes.
Passwords 2 / - - / - I: Some participants did not want a password. S: Make this a local adaptation.
Trait Areas - / 1 3 / 1 I: Trait areas should remain modifiable even after you exit the function. S: Add a “Modify Trait Area” button.
Runway / Taxiway Discrimination
- / 1 - / 2 I: When using the night palette, the runway and taxiway colors look very similar and the outline color choice is poor.
D: Modifying brightness settings improved discrimination. S: Consider another color other than yellow. I: Some functions require you to switch between input devices to complete the
procedure (e.g., saving preference sets, terminating control, suspending a track). S: Enable keyboard entry of callsign or beacon so terminating control and
suspending a track can be completed from a single device. D: In Week 2, research team activated keyboard NTER for saving preference sets. E
Number of Steps
1 / - - / 2
I: Some functions require too many steps to exit. S: Enable double-click to save and exit a function.
DCB Functions
1 / - - / - I: There are so many functions on the DCB it is difficult to remember their locations. S: Present “Done” option in same location regardless of submenu. S: When navigating submenus, do not display non-available menu options S: Make local lists one button I: DCB and C/S list frames do not have brightness adjustments. Brightness
Controls - / 1 - / -
S: Incorporate ability to adjust DCB and C/S list frames. S: Remove the C/S list frame.
a Week 1/Week 2
During the caucus, a research team member used the computer model to demonstrate that it was easier to discriminate between these two areas by modifying the brightness settings. The research member increased the runway brightness setting and decreased the taxiway brightness setting. The participant agreed that these settings were much better, but he still was not sure that yellow was the best choice. He indicated that he would probably use the day palette even at night. The issue related to the number of steps predominantly resulted from the user preferences function, especially in not having to change input devices to execute the function. One participant suggested being able to double-click to save and exit from preferences rather than having to click on DONE. In addition, many in the group indicated that when terminating or suspending a track, they would prefer entering the call sign instead of having to slew to the target.
The participants rated 14 issues with low impact ratings only (see Table 21). Leader-line adjustments in a secondary window received 10 false ratings. This only applied when using the trackball to change direction, not when using the implied function. For the coast/suspend reposition function, the participants indicated that they would like to have a multifunction slew and enter or a click and drag option. The font, night palette, trackball and keypack hardware, set up time, and ease of learning each received two low ratings. The participants provided one low impact rating each week regarding the DCB labels.
39
Table 21. Caucus Issues with all Low Impact Ratings
Issue Impacta
Low Issue (I), Suggestion (S), or Comment (C)
Leader Line Adjustments in Secondary Window
5 / 5 I: Adjusting leader line direction with the trackball in a secondary window is confusing because participant must exit to the main window.
1 / 4 I: C/S list reposition doesn’t function like ARTS and moves too slowly. S: Add keyboard [multifunction] capability for moving the C/S list. S: Modify procedure so that the participant activates the function, moves the cursor to the
desired position, and cl ks to move the list. icS: Enable click and drag. I: Moving slew ball to the right moves the map counter clockwise—counter intuitive and
not consistent with ARTS. S: Reverse the current rotation direction so that the map turns right in response to moving
the trackball to the right. S: Provide ability to click and drag new map windows.
Map Rotation 1 / 3
I: Map rotation is slow. C: The trackballs on some systems required significant movement but others did not. I: the font (stroke width) is too wide. Font - / 2 I: 8s and 0s are difficult to distinguish.
Night Palette
- / 2 I: The target icons change color when switching between day and night palette. S: Keep target icons the same color regardless of the palette selected. C: Provide a wider range of colors (user preference).
Hardware - / 2 I: The trackball and keypack are difficult to use with large hands. C: Keypack is preferred over just having the trackball.
Set up time 2 / - I: Selecting user preferences takes too long. Ease of Learning 2 / - I: May be difficult to learn all functions. DCB Labels
1 / 1 I: The name DCB label is problematic (sounds similar to DB, not easy to remember). S: Refer to DCB as MENU. S: Use RWY for runway, TWY for taxiway, TRAILS for History Trails, CST for Coast,
TARGETS for Target Icons, RAMP for Apron, and DEFAULT for Home. Leader Lines - / 1 I: Data blocks are not close enough to the target.
S: Make minimum leader line lengths smaller (almost 0) S: Make the leader line length continuous, like D-BRITE S: Remove empty spaces in data block tags when they are located to the left.
Transient Users - / 1 I: Participants did not like using the manual data block edit function to tag targets that are not in the local database.
S: Enable ability to tag a target by typing the tag, slewing, and pressing enter. S: Automatically display common target types based on label (e.g., a vehicle for MOBL).
Preview Area I: Minimal data is displayed in the preview area and the participant cannot determine the current setting if they invoke a function using the Hotkey.
S: Provide dynamic feedback (i.e., current value).
- / 1
- / 1 I: The target pick area is too small on larger scale ranges (there were no false ratings in Week 1 but the issue was discussed during the caucus).
Small Pick Area
Click and Drag
- / 1 I: The method for resizing secondary windows is cumbersome. S: Enable click and drag for resizing windows.
a Week 1/Week 2
They recommended renaming some of the labels, including using RWY for runway, TWY for taxiway, and RAMP for apron. During the caucus, some participants expressed interest in increasing the base size of the trackball and keypack hardware. However, they recognized the importance of maintaining a small footprint. The remaining issues only received one low impact rating each.
40
Table 22 presents the false ratings that the groups reclassified as non-issues during the caucus sessions. The first two items were related to testing conditions. Though only one participant raised the issue, others confirmed during the first caucus that the monitor-keyboard configuration in the lab was not realistic for the ceiling-mounted condition. The participant was too close to the display, creating too steep a viewing angle. The research team modified the arrangement for Week 2, reducing the viewing angle from 75 degrees to 60 degrees. No similar comments were made in the second week. The participant who raised the issue of glare on the display frame acknowledged that it was related to the test environment and not a shortcoming of the display itself. In fact, one participant indicated that this display was an improvement over existing tower displays. The group determined that the map repositioning, trait area method, and DCB issues were really computer model issues and not related to the ASDE-X specifications. The participants removed the final five items for a variety of reasons, including if the issue resulted from an incomplete understanding of the computer model, from experience on different versions of ARTS, or strictly from user preference.
Table 22. Caucus Issues Reclassified as Non-Issues
Impacta Issue High Mod. Low
Issue (I) or Comment (C)
Monitor-Keyboard Configuration
1 / - - / - - / - I: The keyboard and monitor configuration used in the lab for the ceiling-mounted configuration is not representative of the tower.
C: Week 2 change. The team decreased the viewing angle from 75 degrees to 60 degrees and the distance from the monitor plane from 19” to 35”
Glare - / - - / 1 - / - I: During the day condition at the tower, there was significant glare on the frame of the monitor due to the supplemental test light
C: Test condition issue. The display itself is good. Map Repositioning
- / 1 - / - - / - I: The map range of movement in a secondary window is restricted to the field displayed in the main window
C: Computer model issue. Trait Area Method
- / - - / - - / 1 I: Trait area should require a single click not a double click. C: Computer model issue. One system erroneously required a double click.
DCB I: Too many double and on / off / on situations C: Computer model issue.
- / - - / - - / 1
Number Digits for Init Control
- / - - / - - / 1 The use of two digits for initiating control is time consuming. C: One digit or alpha character is accepted by the system.
Range Readout
- / - 1 / - 1 / - I: Range readout requires you to mentally adjust the value (e.g., 4 = 400 ft) and minimum range is too low.
C: Lab issue. Entering 4 is preferred in ATC. C: Current range is reasonable.
Font
- / - 1 / - - / - I: Font is more difficult to read than ARTS tags (related to font size not style, see font size Table 20).
Leader Line Adjustments
- / - - / - 5 / - I: Adjusting leader line length using the implied keyboard function is not consistent with other keyboard functions.
C: Not an issue, function is consistent with ARTS. Color - / - - / - 1 / - I: Yellow font is difficult to focus on when first looking up at the display
during day conditions. C: Participant agreed this is not an issue; others found yellow font acceptable.
a Week 1/Week 2
41
4. 3BUConclusions
The EUIE validated the March 2001 version of the ASDE-X computer model CHI as both efficient and effective in supporting participants in their airport surveillance duties. The results demonstrate that of the more than 80 functions implemented, nearly all were intuitive, with the primary exception being user preferences. The participant comments were highly positive, some stating that the ASDE-X CHI was “ideal” for their needs and “very well thought out.” Their ratings indicated that the ASDE-X system was easy to use, required minimal interaction once configured, and would enhance their situation awareness. They indicated that both the classroom and hands-on training for the EUIE were adequate. Almost all participants found the system easy to learn. The evaluation also confirmed the usability of both ASDE-X input hardware options (keyboard-trackball and keyboard-keypack), although the participants expressed a preference for the keypack. The keypack included a trackball, which was the preferred mode of interaction for most functions, and numeric and hotkeys, which they preferred for other functions. The participants were able to use the system with both the console- and ceiling-mounted configurations after we adjusted the viewing angle to the ceiling display from 75 to 60 degrees.
Although their overall feedback was positive, the participants identified 15 issues about the ASDE-X interface that should be reviewed by the WG to determine if the VSASA should be modified. The first two, target icons and user preferences, accounted for almost half of all comments.
1. Target Icons
The participants indicated that, with the exception of suspend and coast targets, all target icons on large-scale map ranges are too small. In addition, at these ranges, the aircraft target icons are much smaller than those for unknown targets. During the readability session, the participants reported difficulty identifying some targets and seeing color differences to differentiate between target types. The readability identification data confirmed that the aircraft, unknown, and vehicle targets were problematic beyond 5 feet at large range scales.
Another aspect of target icons that drew comment was that coast and suspend target data tags are within their target icons. When data block fonts are large, these targets become several times larger than any other target. Furthermore, particularly with the modified icon colors used during the readability sessions, there is insufficient contrast between the data tags and the target icon. The caucus group suggestion to use leader lines for coast and suspend targets like those used for other targets is one option that might help to address this issue.
2. Preference Sets
Several participants indicated that the procedure itself was confusing and that the number of steps was excessive. Part of the confusion was due to the number of alternative methods for invoking this function, which were designed for use with either the keyboard or keypad. Although participants offered few suggestions, one participant recommended providing a SAVE AS capability to enable modifying existing sets.
42
3. DCB
Two issues were raised about the DCB. The first relates to the computer model. The participants noted that when the DCB is located on the left or right of the display, some of the button labels extend beyond the buttons. This was especially evident in the trait area submenu buttons.
The second issue addressed DCB labels. The participants suggested using common abbreviations for the buttons such as RWY for runway, TWY for taxiway, TRAILS for History Trails, CST for Coast, TARGETS for Target Icons, RAMP for Apron, and DEFAULT for home. The HOME button on the ASDE-X interface performs a similar function to the default function in ARTS. One participant had difficulty recalling what DCB stood for, noted the similarity between DCB and DB, and suggested renaming it MENU.
4. Color and Brightness
The issues about color and brightness fall into two basic categories. The addition of brightness adjustments for some additional screen elements is one. Several of the participants suggested providing the ability to adjust the C/S list border intensity, an additional method of reducing screen clutter. Others also recommended adding the ability to adjust the brightness of the background, foreground, and frames for the DCB.
Another aspect to receive comment was the night palette. Some participants did not like the colors selected for the night palette (especially yellow for the runway and taxiway), others noted difficulty differentiating between runways and taxiways, and some suggested adding additional color choices. These are likely preference issues because some participants found data blocks on the night palette easier to read and preferred its outline presentation of runways and taxiways. One additional related comment was that they did not like the aircraft and unknown icon colors changing between palettes.
5. Fonts
The participants identified three issues regarding fonts. In the first, they indicated that the current maximum font size is too small and suggested increasing it to at least the size of ARTS tags. They believed this would facilitate readability at extended angles and distances. A second issue was that some participants considered six font sizes to be insufficient, recommending the addition of intermediate sizes. In the final aspect, one participant indicated that the stroke font width appeared to be too wide. This may have been related to their difficulty differentiating between 8 and 0 when working at a distance. A review of the readability data confirmed that of the digits misidentified, 8 accounted for almost half of the incidences.
6. Number of Steps
The computer model required participants to switch between input devices to complete some functions. Among the examples that the group provided were
43
44
saving and deleting preference sets, terminating control, and suspending a track. The research team partially addressed this issue for the user preference function before the second week by activating the keyboard enter key. Other suggestions for reducing steps included a SAVE AS button, double click to save and exit, and being able to type in a target identification rather than slewing to the target.
7. Secondary Windows
The EUIE identified three issues related to secondary windows. The most common comment was that it was confusing to exit to the main window to change the leader-line direction when using the trackball. The participants recommended activating the secondary window border for this function. The second issue related to a general request for incorporating more “click and drag” capabilities into the ASDE-X interface, in this case for resizing map windows. Finally, some participants indicated a preference for preselecting the areas of interest when creating new map windows. This would be consistent with the ASDE-X trait area function and re-centering the map in ARTS.
8. Trait Areas
The single trait area issue was that participants could not return to a trait area, once defined, to modify the existing trait characteristics. They anticipated that the need to change traits within a data block area would be a relatively common task. In the current design, however, they would have to delete the area and redefine a new area with the desired changes. A solution proposed by one participant was to implement a “Modify Trait Area” capability.
9. Map Manipulation
Map rotation and repositioning each resulted in one issue. The participants noted that the map rotated counterclockwise in response to clockwise trackball input. They found this to be counterintuitive, although they indicated they could adapt to it. When repositioning the map, some participants indicated that the computer model response was too slow. The caucus confirmed that one workstation was the most likely cause of this issue. In a comment about maps, one participant suggested activating the keyboard up and down arrow keys for map manipulations.
10. Coast/Suspend List
The C/S list resulted in three issues. Some participants requested the ability to remove the C/S list border because they believed it served no purpose. This would be resolved without any further action if the recommendation for a brightness control were implemented. In the second issue, the participants indicated that the C/S list reposition function did not behave as it does in ARTS. In ARTS, the participant invokes the function, places the cursor at the desired location, and then moves the list with an enter command. With the ASDE-X interface, the list moved dynamically in response to trackball movements. As with secondary windows, some participants also stated they would like to be able to “click and drag” the C/S list to a desired location. The third issue was that the C/S reposition function was too slow.
45
11. Leader Lines
The EUIE participants observed that when various elements of the data block are not displayed, the data block may have large empty spaces. If the leader direction is toward the left, there is a gap between the end of the line and the data block. The group noted that large gaps may result in difficulty determining which leader line was associated with which data block. Some participants indicated that the minimum leader line length should be near zero. They recognized the need to have some indication of a leader line but suggested that a few pixels may be enough. Like font sizes, some participants requested additional intermediate settings, possibly on a continuous scale.
12. Preview Area
Although the participants indicated that the preview area provided sufficient feedback, they did note one exception. When a function is activated, the preview area does not indicate the current setting. Providing this information in the preview area and updating it dynamically could be useful, particularly if the participant invoked the function through means other than the DCB (the DCB displays the current setting on the button label) or was adjusting the setting using the trackball.
13. Pick Area
During the first week, several participants experienced difficulty selecting targets due to the small pick area. For Week 2, the research team increased the size of the pick area. The only recurrence during Week 2 was noted when the participants attempted to select targets on the large-scale map range.
14. Tagging Unknown Targets
To tag an unknown target that is not in the local traffic list, the controller uses the manual data block edit function. Though the current implementation is acceptable, the group suggested changing the procedure so that the participant enters the tag, slews to the target, and then hits ENTER. They also recommended having these targets automatically default to a target type based on the tag (e.g., MOBL represents a vehicle).
15. Trackball & Keypack Hardware
Some participants indicated that the trackball and keypack hardware may not provide adequate physical support, particularly for individuals with large hands. However, they recognized the counter space tradeoff.
The EUIE results demonstrated that the requirements of the VSASA are clear and realistic, and that the prototype CHI, with minimal modifications, would effectively support controllers in performing their jobs. Further assessments may be warranted as the development team implements modifications resulting from the EUIE and continues to develop additional functionality contained in the VSASA.
Crown (1999). STARS Air Traffic Control tower lighting measurement results report (Crown Document No C012-003-016). Washington, DC: Author.
Federal Aviation Administration (1999). Requirements document for airport surface movement enhancement and runway incursion prevention: Airport Surface Detection Equipment (ASDE-X) system (FAA Document No. ASDE-X RD, Version 1.0). Washington, DC: Author.
Federal Aviation Administration (2000a). National Airspace System (NAS) subsystem level specification for Airport Surface Detection Equipment – Model X (ASDE-X). (Draft Version 1.0). Washington, DC: Author.
Federal Aviation Administration (2000b). Runway incursion totals by category 1988 – 1999. Retrieved October 4, 2000 from the World Wide Web: HUhttp://www.faa.gov/runwaysafety/U
National Transportation Safety Board (1991). NTSB recommendations to FAA (Report Number A-91-30). Washington, DC: Author.
National Transportation Safety Board (2000). July 6, 2000 safety recommendation: In reply to A-00-66 through –71. Washington, DC: Author.
47
Acronyms
AMASS Airport Movement Area Safety System ASDE Airport Surface Detection Equipment AT Air Traffic ATC Air Traffic Control ATCS Air Traffic Control Specialist ATCT Air Traffic Control Tower CHI Computer-Human Interface C/S Coast/Suspend DCB Display Control Bar DFW Dallas-Fort Worth EUIE Early User Involvement Event FAA Federal Aviation Administration HFS Human Factors Specialist NAS National Airspace System NATCA National Air Traffic Controllers Association NTSB National Transportation Safety Board PASS Professional Airway Systems Specialists PSQ Post-Script Questionnaire RDHFL Research Development and Human Factors Laboratory SD Standard Deviation SME Subject Matter Expert VSASA Visual Specification for Airport Surveillance Applications WG Working Group WJHTC William J. Hughes Technical Center