27
Akastor © 2019 Akastor Second Quarter Results 2021 Fornebu | 15 July 2021 Karl Erik Kjelstad (CEO) & Øyvind Paaske (CFO) Akastor ASA

Akastor © 2019 Akastor
Second Quarter Results 2021
Fornebu | 15 July 2021
Karl Erik Kjelstad (CEO) & Øyvind Paaske (CFO)
Akastor ASA

Akastor © 2019 AkastorAkastor © | July 2021 Slide 2
Presenters and agenda
Portfolio highlights
Financial update
Q&A session
Karl Erik Kjelstad
Chief Executive Officer
Øyvind Paaske
Chief Financial Officer

Akastor © 2019 AkastorAkastor © | July 2021 Slide 3
Portfolio Highlights

Akastor © 2019 AkastorAkastor © | July 2021 Slide 4
Akastor portfolio composition
Industrial investments Financial investments
Leading global provider of first-class drilling systems,
products and services
100%
Global provider of subsea well construction and
intervention services
50%
Global manpower specialist within Oil & Gas, ICT,
Renewables, Chemicals, Mining, Life Sciences,
Automotive and Construction sectors
~ 15%2)
North Sea Drilling Contractor
5.6%
International drilling, well service and engineering
company
USD 75m preferred equity
Company owning 5 mid-sized AHTS vessels
100%
1) Economic interest | 100% legal ownership
2) Economic interest
Global provider of well design and drilling project
management, HSEQ, reservoir and field management
services
64%1)
Supplier of vapour recovery technology, systems and
services to O&G installations
100%

Akastor © 2019 AkastorAkastor © | July 2021 Slide 5
Joint venture between Akastor and Baker Hughes on track
▪ Comprehensive integration planning work with
close to 1 000 actions to be completed prior to
closing
▪ Ongoing verification of potential synergies including
development of detailed plans for realization
▪ Competition fillings close to be completed
▪ Documentation regarding new financing
agreements for both the joint venture and Akastor
ongoing and on track
▪ Closing of transaction expected to take place in the
second half of 2021
$80m
RCF
$220m
Bank Financing
Akastor Baker Hughes
Equity/Ownership Shareholder loan Flow of funds
Legend
JV
MHWirth SDS
$80m
SHL $120m
dividend
50%50%
Bank
syndicate
$100m
dividend
$20m
SHL

Akastor © 2019 AkastorAkastor © | July 2021
Lifecycle services, spares and componentsDrilling equipment
Slide 6
DLS
▪ 48 active rigs in quarter, up from 45 per 1Q.
Further grow expected in H2 based on
contract schedule of fleet
▪ Scrapping of four Seadrill units confirmed in
Q2. Units were cold stacked, and thus no
direct effect for MHWirth.
▪ Increased activity in quarter, driven by
offshore segment
Projects
▪ Cont. low activity in quarter as a result of
phase of ongoing projects
▪ Keppel FELS unit #2 re-activated in period
▪ Continued negotiations re. drilling
equipment package to to Guangzhou
Marine Geological Survey (GMGS) awarded
to MHWirth in December last year. Contract
now expected to be signed in 3Q (project
not included as order intake in 2Q)
▪ Newbuild market continues to be muted
and is expected to remain challenging going
forward
Products
▪ Good order intake in quarter, driven by the
non-oil segment
▪ Low revenue in quarter as a result of low
backlog per start of period
▪ Increased activity expected in second half
of the year, driven by order intake and
opportunities in non-oil markets, both for
slurry pumps and PBA’s (pile top drillers for
construction)
▪ Offshore market continue to be affected by
low investment levels among clients
Digital Technology
▪ Continued high activity in quarter, with
delivery of several new systems
▪ One DEAL system and three CADS system
(Configurable Automatic Drilling System)
delivered in 2Q
▪ Backlog consists of six control system
upgrades, one DEAL system and one CADS
system, as well as several smaller
development projects
▪ Continued good dialogue with clients
regarding new developments, including
customer funded projects
Portfolio Highlights 2Q 2021 (1 of 2)

Akastor © 2019 AkastorAkastor © | July 2021 Slide 7
▪ AGR – Continued high activity, primarily within Consultancy in Norway. Revenues and EBITDA
in quarter of NOK 178 million and NOK 8 million, respectively. AGR acquired Rig Scheduling
Software “RIG” from Deloitte Digital.
▪ Cool Sorption – Increased activity compared to last quarter. Book-to-bill of 1.4x in period.
Oth
er
ind
ustr
ial h
old
ings
Fin
an
cia
l ho
ldin
gs
▪ Odfjell Drilling – Continued positive share price development. Extension of bank facilities
secured in period.
▪ NES Fircroft – Solid growth in number of contractors through period
▪ DDW Offshore – Bareboat charter agreements for two vessels to OceanPact commenced in
quarter. One other vessel on shorter contract per end of 2Q.
▪ Aker Wayfarer affected by a COVID-19 outbreak onboard, resulting in 13 days of downtime
and 85% revenue utilization in quarter
▪ Skandi Santos continues to deliver very high uptime with revenue utilization of 100% also in
second quarter. Ongoing tender process with Petrobras for a new 3-year contract, process
expected to be clarified during second half of this year.
▪ AKOFS Seafarer with revenue utilization of 94% in quarter, delivering solid operations in
period
▪ Revenues of NOK 341 million, EBITDA of NOK 120 million (100% basis)
Portfolio Highlights 2Q 2021 (2 of 2)

Akastor © 2019 AkastorAkastor © | July 2021 Slide 8
Key value drivers for our main portfolio assets
NCE per 2Q 2021: NOK 2760m NCE per 2Q 2021: NOK 1002m NCE per 2Q 2021: NOK 789m NCE per 2Q 2021: NOK 589m
53% 19% 15% 11%
Ownership agenda:
▪ Buy-and-build strategy with
targeted IPO
Key value drivers:
▪ Reactivation of stacked rigs
driving service and product
revenue
▪ Increased focus on digital and
automation solutions driving sale
of new products and services
▪ Successful integration and
synergy realization of JV
Key value drivers:
▪ Secure high revenue utilization
on all vessels
▪ Increased LWI activity (P&A, XT
installations, and intervention
operations)
▪ Opportunistic growth
opportunities
Key value drivers:
▪ Preferred payments: continued
strong order backlog and modest
leverage
▪ Warrants: improved rig
fundamentals
Key value drivers:
▪ Demand for specialized
contractors in industries such as
Oil & Gas, Life Sciences and
Power & Renewables
Ownership agenda:
▪ Secure order backlog and
explore strategic initiatives
Ownership agenda:
▪ Maximize return on instrument
(preferred equity + warrants)
Ownership agenda:
▪ Continue to grow the company
organically and through M&A to
maximize value at exit
Akastor © 2019 AkastorAkastor © | July 2021
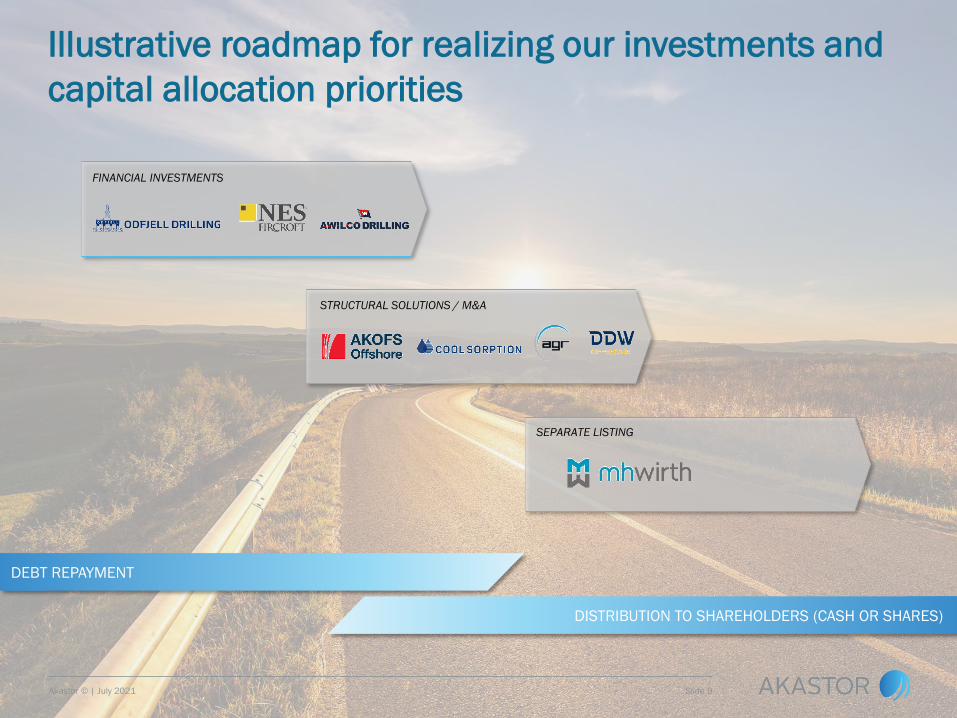
FINANCIAL INVESTMENTS
STRUCTURAL SOLUTIONS / M&A
SEPARATE LISTING
DEBT REPAYMENT
DISTRIBUTION TO SHAREHOLDERS (CASH OR SHARES)
Illustrative roadmap for realizing our investments and
capital allocation priorities
Akastor © | July 2021 Slide 9

Akastor © 2019 AkastorAkastor © | July 2021 Slide 10
Financial update

Akastor © 2019 AkastorAkastor © | July 2021 Slide 11
Financial highlights 2Q 2021
2Q 2021 highlights
▪ Following announced agreement to combine MHWirth
with Baker Hughes SDS, MHWirth is presented as
discontinued operations in the income statement
▪ Revenue and other income increase of 36 percent
year-on-year, driven by gain from finance lease
agreements in DDW Offshore and increased activity in
AGR
▪ EBITDA NOK 45 million in quarter
▪ Net financial items of NOK 12 million, including non-
cash items from financial investments of NOK 22
million
▪ Order intake, backlog and Net Current Operating
Assets (NCOA) include MHWirth
▪ NCOA continues to be significantly lower than last
year, driven by project activity in MHWirth
Note: MHWirth is presented as discontinued operations in the income statement from 1Q 2021, with comparable figures having been restated

Akastor © 2019 AkastorAkastor © | July 2021 Slide 12
Key financials reconciliation
▪ Odfjell Drilling: result of NOK 34 million includes cash interests of NOK 9 million,
PIK interests of NOK 9 million and positive valuation effects on the warrant
structure of NOK 11 million
▪ AKOFS Offshore: negative result represents 50% of the company’s net loss in
period
▪ DDW Offshore: No longer booked as financial investment following consolidation
in 4Q 2020
Akastor © 2019 AkastorAkastor © | July 2021 Slide 13
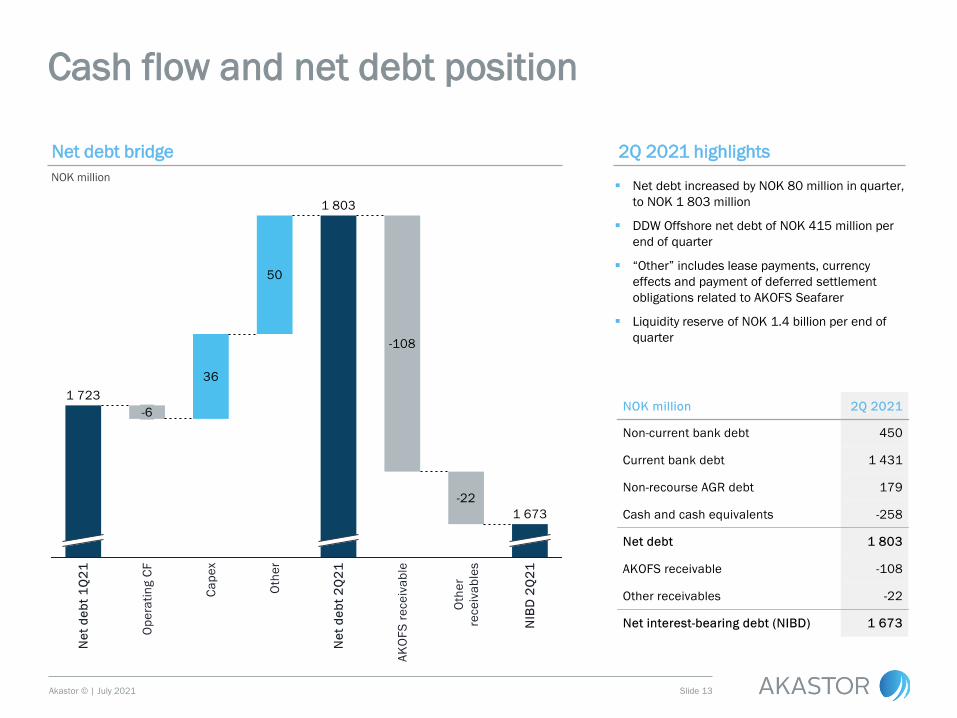
Cash flow and net debt position
Net debt bridge 2Q 2021 highlights
▪ Net debt increased by NOK 80 million in quarter,
to NOK 1 803 million
▪ DDW Offshore net debt of NOK 415 million per
end of quarter
▪ “Other” includes lease payments, currency
effects and payment of deferred settlement
obligations related to AKOFS Seafarer
▪ Liquidity reserve of NOK 1.4 billion per end of
quarter
NOK million

Akastor © 2019 AkastorAkastor © | July 2021 Slide 14
Net Capital Employed as per 2Q 2021
NOK million

Akastor © 2019 AkastorAkastor © | July 2021 Slide 15
MHWirth
Highlights 2Q 2021 Installed base per 2Q 2021
▪ Project & Products revenues were NOK 134 million, a decrease of
73% compared to last year
▪ DLS & DT revenues were NOK 551 million, a decrease of 2%
compared to last year
▪ EBITDA of NOK 51 million, giving a margin of 7.4%. Margin still
affected by relatively low revenue in period.
▪ Order intake for the period amounted NOK 0.9 billion, a book-to-bill
of 1.4x in quarter, giving a total order backlog of NOK 2.2 billion
per end of 2Q
Full package (rigs) Installed base by age
44
11Floaters
JU
21
Fixed
27
6-10
9
0-5
22
>20
11-20
18
7676
54 50 52 53 46 47 44 45 45 48
32 35 32 3336 36 37 36 35 28
81
1Q 213Q 2020202016 2017 4Q 202018 2Q 202019 2Q 21
86 85 84 86 82 83 81 80 76
Inactive units Active units
EBITDA:
Quarterly development in revenues and EBITDA margin
NOK million

Akastor © 2019 AkastorAkastor © | July 2021 Slide 16
AKOFS Offshore
Highlights 2Q 2021 Fleet overview
▪ Revenues and EBITDA of NOK 341 million and NOK 120 million,
respectively
▪ Revenue utilization for Aker Wayfarer 85% in quarter, explained by
a COVID-19 outbreak resulting in 13 days of downtime in period
▪ Skandi Santos with 100% revenue utilization in quarter
▪ AKOFS Seafarer with 94% revenue utilization in quarter
EBITDA:
Quarterly development in revenues and EBITDA-margin1)
NOK million
1) Figures presented on 100% basis
Vessels Loc. 2019 2020 2021 2022 2023 2024 2025
Skandi Santos
Aker Wayfarer
AKOFS Seafarer
+3 years option
5 years option

Akastor © 2019 AkastorAkastor © | July 2021 Slide 17
NES Fircroft
Recent development Award winning workforce solution specialist
▪ Continued increase in activity and uptick in number of contractors
seen in the quarter
▪ LTM pro-forma revenues per May 2021 around 30% lower than
one year ago, however with continued good momentum in
business and increasing revenue run-rate
▪ Slight increase in net debt seen over last months driven by NWC
movement as a result of higher activity in the business
▪ Akastor holds ~15% economic interest in the combined NES
Fircroft
Financial development (USD million)1)
0
100
200
300
0
500
1 000
1 500
2 000
2 500
3 000
Revenue NIBD
FY 19 FY 20 LTM May 20 LTM May 21
Revenue NIBD
Managed
Solutions
Outsourced, exclusive
global recruitment
services
NES’ offering includes
recruitment process
outsourcing, global
mobility and
consultancy
Permanent
Placement
Engineering positions
filled on a permanent
basis
Charge one-time fee of
the engineer’s annual
salary
Search, placement and
ongoing support of
contract engineers
NES charges a margin
on contractors salary
Contract
Engineering
HQ in Manchester, UK
Global organization
with local client
touch-points through
a network of ~45
global locations
Strategically located
in most attractive
specialist engineering
markets
Database of
650,000+ engineer
contractors
1) FY end 31st October. Figures presented on 100% basis. Revenue figures in graph pro-forma adjusted to include Fircroft
Akastor © 2019 AkastorAkastor © | July 2021 Slide 18
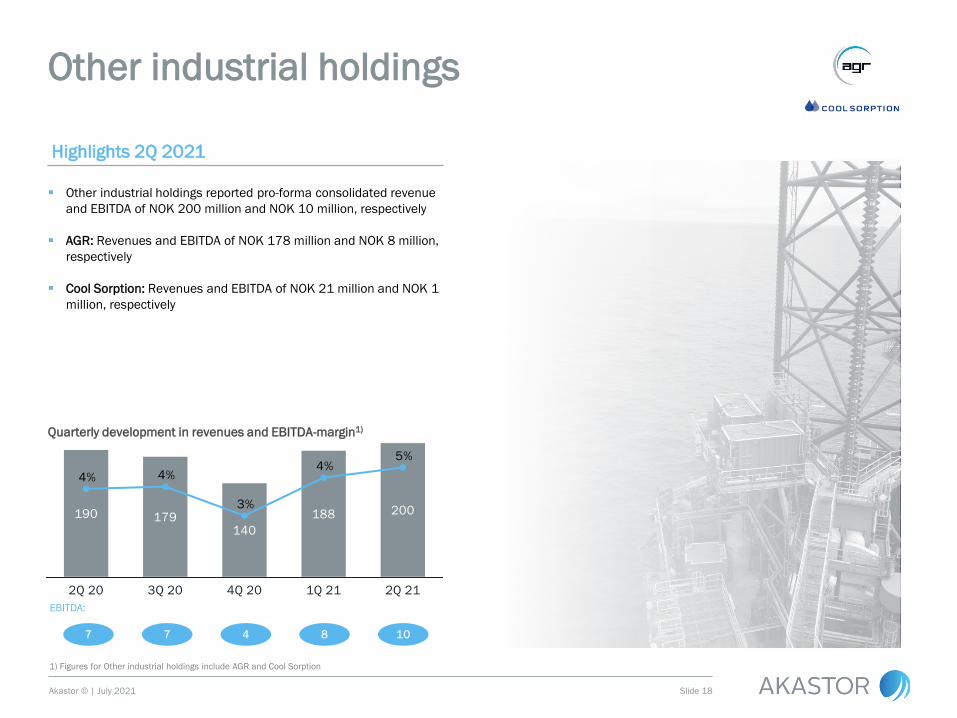
Other industrial holdings
Highlights 2Q 2021
▪ Other industrial holdings reported pro-forma consolidated revenue
and EBITDA of NOK 200 million and NOK 10 million, respectively
▪ AGR: Revenues and EBITDA of NOK 178 million and NOK 8 million,
respectively
▪ Cool Sorption: Revenues and EBITDA of NOK 21 million and NOK 1
million, respectively
EBITDA:
Quarterly development in revenues and EBITDA-margin1)
1) Figures for Other industrial holdings include AGR and Cool Sorption
Akastor © 2019 AkastorAkastor © | July 2021 Slide 19
Appendix
Akastor © 2019 AkastorAkastor © | July 2021 Slide 20
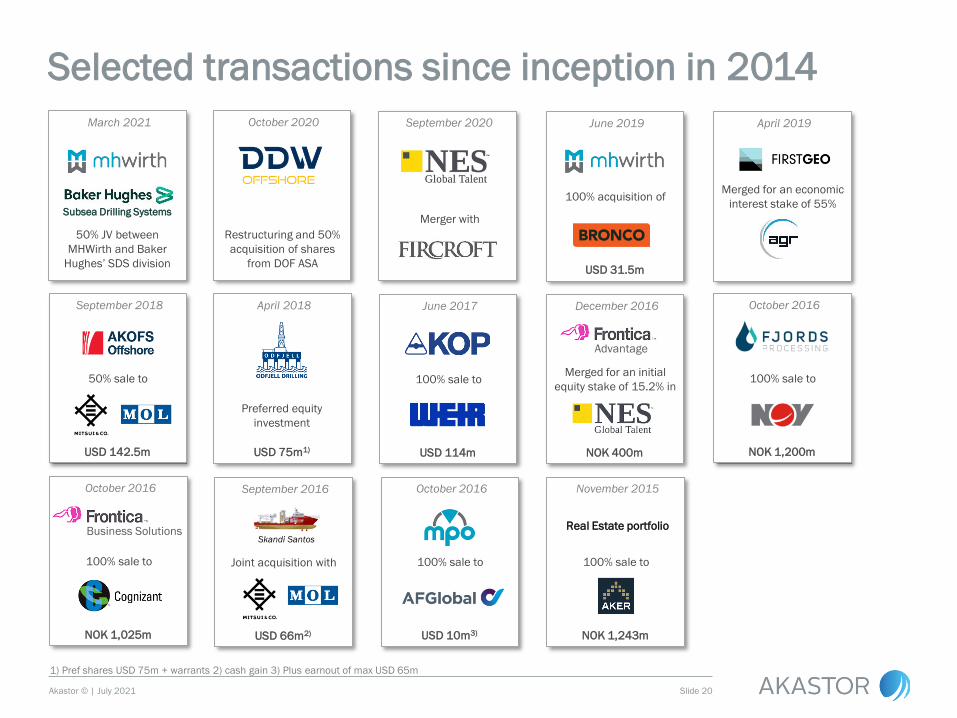
Selected transactions since inception in 2014
1) Pref shares USD 75m + warrants 2) cash gain 3) Plus earnout of max USD 65m
April 2018
Preferred equity
investment
USD 75m1)
June 2017
100% sale to
USD 114m
December 2016
Merged for an initial
equity stake of 15.2% in
NOK 400m
Advantage
October 2016
100% sale to
NOK 1,200m
October 2016
100% sale to
NOK 1,025m
Business Solutions
October 2016
100% sale to
USD 10m3)
November 2015
100% sale to
NOK 1,243m
Real Estate portfolio
September 2018
50% sale to
USD 142.5m
September 2016
Joint acquisition with
USD 66m2)
Skandi Santos
April 2019
Merged for an economic
interest stake of 55%
June 2019
100% acquisition of
USD 31.5m
October 2020
Restructuring and 50%
acquisition of shares
from DOF ASA
September 2020
Merger with
March 2021
50% JV between
MHWirth and Baker
Hughes’ SDS division
Subsea Drilling Systems

Akastor © 2019 AkastorAkastor © | July 2021 Slide 21
ODL preferred equity and warrant instrument
Instrument description:
▪ 5% cash dividend + 5% PIK per annum (semi-annual payment)
▪ Call price: 125% year 2, 120% year 3, 115% year 4, 110% year 5,
105% year 6, 100% thereafter
▪ Cash dividend step-up: 8.0% p.a. from year 7 and an additional
1.0% step-up per year until a maximum cash dividend of 10.0%
p.a.
▪ Commitment fee of USD 5.75 million paid in 2Q 2019
▪ Certain rights and covenants1) in favor of Akastor
Instrument payment profile:
Instrument description:
▪ The total warrant issue comprise six tranches with 987,500
warrants per tranche, amounting to a total 5,925,000 warrants.
Furthermore, one warrant can be exercised for one share (1-to-1
ratio) for a price of USD 0.01 per share. Maximum number of
share allocation if share price in ODL has increased with 20% p.a.
1) The agreement contain several covenants, including but not limited to an obligation
not to pay dividends or other distributions exceeding 50% of the net profit from the
preceding year (unless a similar portion of the preference capital is repaid prior to the
distribution), and in any case not pay dividends or make distributions after year 6. Also
the agreement includes a change of control covenant pertaining to restructurings with
the effect that Odfjell Partner's shareholding falls below 25%
Warrant overview:
31
October
2019
31
October
2020
31
October
2021
31
October
2022
31
October
2023
31
October
2024
31
October
2024
A
B
C
D
E
F
Barrier (NOK) 43.20 51.84 62.21 74.65 89.58 107.50
▪ Schedule 4.2: If any warrants remain unexercised at the ultimate
exercise date in 2024, the holder will receive a number of shares
determined linearly according to:
Exercise dates
𝑅𝑒𝑚𝑎𝑖𝑛𝑖𝑛𝑔 𝑤𝑎𝑟𝑟𝑎𝑛𝑡𝑠 ×𝑀𝑎𝑥[ 𝑆ℎ𝑎𝑟𝑒 𝑝𝑟𝑖𝑐𝑒 @ 31 𝑀𝑎𝑦 2024 − 36]
(107.5 − 36)
USDm 2018e 2019e 2020e 2021e 2022e 2023e 2024e 2025e 2026e
Cash Dividend 2.2 3.9 4.1 4.3 4.5 4.8 8.0 9.5 11.0
Acc. PIK 77.2 81.1 85.2 89.5 94.1 98.8 103.8 109.1 114.6
Cal l price incl . PIK 99.9 100.2 100.8 101.6 102.6 103.8 109.1 114.6
Dividend 5 % 5 % 5 % 5 % 5 % 5 % 8 % 9 % 10 %
PIK interest 5 % 5 % 5 % 5 % 5 % 5 % 5 % 5 % 5 %
Call price n.a. 125 % 120 % 115 % 110 % 105 % 100 % 100 % 100 %
Sch
ed
ule
4.2
Preferred equity structure Warrant structure

Akastor © 2019 AkastorAkastor © | July 2021 Slide 27
Key figures
AKASTOR GROUP (continuing operations)
Note: MHWirth is presented as discontinued operations from 1Q 2021, historical figures have been restated

Akastor © 2019 AkastorAkastor © | July 2021 Slide 28
Split per Company (1 of 4)
MHWIRTH

Akastor © 2019 AkastorAkastor © | July 2021 Slide 29
Split per Company (2 of 4)
AKOFS OFFSHORE 1)
1) Figures presented on a 100% basis. Akastor’s share of net profit from the joint venture is presented as part of “net financial items”

Akastor © 2019 AkastorAkastor © | July 2021 Slide 30
Split per Company (3 of 4)
AGR

Akastor © 2019 AkastorAkastor © | July 2021 Slide 31
Split per Company (4 of 4)
OTHER HOLDINGS

Akastor © 2019 AkastorAkastor © | July 2021 Slide 32
Copyright and disclaimer
CopyrightCopyright of all published material including photographs, drawings and images in this document remains vested in Akastor and third party contributors as appropriate. Accordingly, neither the whole nor any part of this document shall be reproduced in anyform nor used in any manner without express prior permission and applicable acknowledgements. No trademark, copyright or other notice shall be altered or removed from any reproduction.
DisclaimerThis Presentation includes and is based, inter alia, on forward-looking information and statements that are subject to risks anduncertainties that could cause actual results to differ. These statements and this Presentation are based on current expectations, estimates and projections about global economic conditions, the economic conditions of the regions and industries that are major markets for Akastor ASA and Akastor ASA’s (including subsidiaries and affiliates) lines of business. These expectations, estimates and projections are generally identifiable by statements containing words such as “expects”, “believes”, “estimates” or similar expressions. Important factors that could cause actual results to differ materially from those expectations include, among others, economic and market conditions in the geographic areas and industries that are or will bemajor markets for Akastor ASA. oil prices, market acceptance of new products and services, changes in governmental regulations, interest rates, fluctuations in currency exchange rates and such other factors as may be discussed from time to time in the Presentation. Although Akastor ASA believes that its expectations and the Presentation are based upon reasonable assumptions, it can give no assurance that those expectations will be achieved or that the actual results will be as set out in the Presentation. Akastor ASA is making no representation or warranty, expressed or implied, as to the accuracy, reliability or completeness of the Presentation, and neither Akastor ASA nor any of its directors, officers or employees will have any liability to you or any other persons resulting from your use.


