ALASKA TOURISM MARKETING NEEDS SURVEY Prepared for: Alaska Division of Tourism Department of Community & Economic Development Ginny Fay, Director PO Box 110801 Juneau, Alaska 99811 June 2000
Transcript
ALASKA TOURISM MARKETINGNEEDS SURVEY
Prepared for:Alaska Division of Tourism
Department of Community & Economic DevelopmentGinny Fay, Director
PO Box 110801Juneau, Alaska 99811
June 2000
ALASKA TOURISM MARKETINGNEEDS SURVEY
Prepared for:Alaska Division of Tourism
Department of Community & Economic DevelopmentGinny Fay, Director
Management of Alaska’s tourism marketing is undergoing one of the most profoundchanges since statehood. Shifting political philosophy and state budget shortfallshave decreased state government funding of tourism marketing. In response to thisloss of support, the tourism industry proposed the framework of a new organization– the Alaska Tourism Industry Association (ATIA) – that now assumes statewidetourism marketing responsibilities. It is supported largely by financial commitmentsfrom corporations, businesses and organizations with vested interest in the successof Alaska’s tourism. ATIA is now the contractor for the Alaska Statewide TourismMarketing Program with $4 million in state money inherent in that contract. TheAlaska Division of Tourism – charged by statute with responsibility for promotingtourism benefits to all areas and interests in the state – has been hamstrung bybudget cuts, and forced to respond to only a portion of their legal responsibilities inrecent years.
Yet, the Alaska Division of Tourism remains a critical link in the management oftourism marketing. That link is its statutory relationship and responsibility to alltourism interests in Alaska. In order to meet these responsibilities in the evolution oftourism marketing management, the Alaska Division of Tourism is seeking to assessthe marketing needs of Alaska’s tourism businesses and organizations. While manyof these businesses and organizations are already part of the former (AVA, ATMC)and future (ATIA) marketing organizations, others are not. The Division mustconsider all entities. Further, while a great deal of effort has resulted in the design ofan ATIA framework and membership policies, its exact role and function is beingdefined. As the recipient of the statewide tourism-marketing contract, it willcontinue to evolve. In an effort to help define the overall mission of Alaska tourismmarketing, the Division has contracted with the McDowell Group, Inc. to conduct anAlaska Tourism Marketing Needs Survey to gather input from the full range oftourism interests in Alaska.
While the response rate was lower than expected, the comprehensive nature of thesurvey content yields invaluable insights into the marketing practices, needs andopinions of this representation of the Alaska tourism industry. Most importantly, theresults provide clear program direction to the ATIA and the Division of Tourism forthe future with surprising agreement among respondents on the most desirable andimportant markets and programs.
The methodology used in this survey was an initial mail survey to 673 Alaskatourism businesses and organizations with offices in Alaska. The initial mailing wasfollowed up with telephone calls, follow-up faxes and repeat mailings. Businesssurveys traditionally receive low responses and as a result the McDowell Group hasdeveloped a phone/fax/mail follow-up methodology to boost response. The finalresponse was 142 returned usable surveys. The survey was initiated in March of 2000with extensive follow-up effort during April and May.
The design of the survey was principally by the Division of Tourism, using aquestion format derived from an Arizona tourism industry survey with someadditional refinements. While this particular format – according to a number ofrespondents and non-respondents – hindered response rates, the study teamassumes that those who did respond tended to be those with high interest andknowledge in tourism. Non-respondents are assumed to be those with less vestedinterest and knowledge in Alaska tourism and those unwilling to complete thedetailed format of the major question regarding the 20 programs the Division ofTourism wished to evaluate.
The survey sample was drawn from a variety of sources. The major source was acomplete Alaska Department of Labor list of all Alaska employers in the majortourism-affected Standard Industrial Classification (SIC) categories that definetourism as an industry. The survey used the same SIC categories used in McDowellGroup’s previous studies (the most recent being the Alaska Visitor IndustryEconomic Impact Study, 1999 Update) that quantified the economic impact of thetourism industry in Alaska. These include Transportation (air, water, ground andtransportation services), Retail Trade (general merchandise, food, apparel/accessory,eating & drinking places and miscellaneous specialty retail), and Services (hotels &other lodging places, auto/RV rentals and amusement/recreation services). Further,specific sub-categories of these SICs with high concentrations of tourism businesseswere included. Businesses were selected on the basis of having a clear involvementin tourism, as many businesses in these categories are not tourism related and wouldnot have been useful to the survey.
In addition, the survey included 40 tourism-related organizations and agencies inAlaska such as CVBs, Chambers of Commerce, and regional and statewideorganizations on file with the Division of Tourism and on the AVA membership list.Finally, a selection of 130 members of the statewide tourism industry organization,the Alaska Visitors Association, was included to insure representation of the mostactive and involved tourism businesses and organizations.
The total sample of 673 businesses and organizations with Alaska offices isconsidered representative, rather than random and statistical. The distribution of thesurvey respondents was spread relatively evenly among major categories, allowingfor some sub-group analysis and balanced representation. Of total respondents, 11%were transportation companies, 19% retail, 26% lodging of all kinds, 19% tourcompanies, 15% organizations (mostly CVBs) and 13% services/other.
Respondents were asked to identify their awareness of, use of, perceived importance(to their business or organization) and satisfaction with each of 20 marketingprograms conducted in the past by the Alaska Tourism Marketing Council and theAlaska Division of Tourism.
Only the Alaska Travel Planner programs have near-universal recognition at over90%. In contrast, at least 30% of respondents are unaware of 18 of the 20 programsunder evaluation and six programs are unknown to over 50% of respondents.
In contrast to the awareness of programs, all but one program (Direct Mail Labels) isconsidered important to their businesses or organizations by at least two-thirds of allrespondents. Clearly, respondents appreciate the value of marketing in the tourismbusiness and they are sophisticated enough to recognize that marketing involvesmany factors to be successful.
Program use varies from a high of 53% (using the Alaska Vacation Planner Listing)to just 8% (three programs). Just two programs (Planner Advertising and Listing)have participation by more than 35% of respondents and eight programs have atleast 30% participation. As a rule, participation increased as the size of the businessor organization increased.
Satisfaction ratings (by users and non-users combined) are modest, ranging from ahigh of 37% “satisfied” (Inquiry Fulfillment) to a low of 19% (Winter Tourism).Unsatisfied ratings top out at 38% unsatisfied (with Public Relations Service) with alow of 21% unsatisfied with Trade Show Attendance. Twelve programs have higherpositive than negative satisfaction ratings, seven have a negative score and oneprogram breaks even. As in use, satisfaction with programs tends to increase as thesize of the business or organization increases.
However, a further analysis of satisfaction ratings reveals dramatic differences in theopinions of users and non-users of programs. Program users are well satisfied withalmost all programs, usually by margins of two or three to one over unsatisfiedusers. Twelve programs are rated between 51% and 86% satisfied, with unsatisfiedpercentages low, typically between 15% and 25%. Users gave negative satisfactionratings to just two programs. Conversely, non-users of programs assigned negativesatisfaction ratings to 19 or 20 programs. About one-half of non-users still offeredopinions on programs they did not use nor, presumably, had much knowledge of.The other one-half of non-users did not rate satisfaction.
In summary, respondents are not universally aware of many programs. They doconsider marketing of all kinds as important to their businesses or organizations.They are selective about their participation in the 20 programs and, on average, aremoderately satisfied with those programs’ effectiveness. Program users are quitesatisfied with existing programs while some non-users, for whatever reason, be it
ignorance, misinformation or honest informed opinion, tend to view the programs asnot effective. A separate analysis of user/non-user ratings is included in this report.
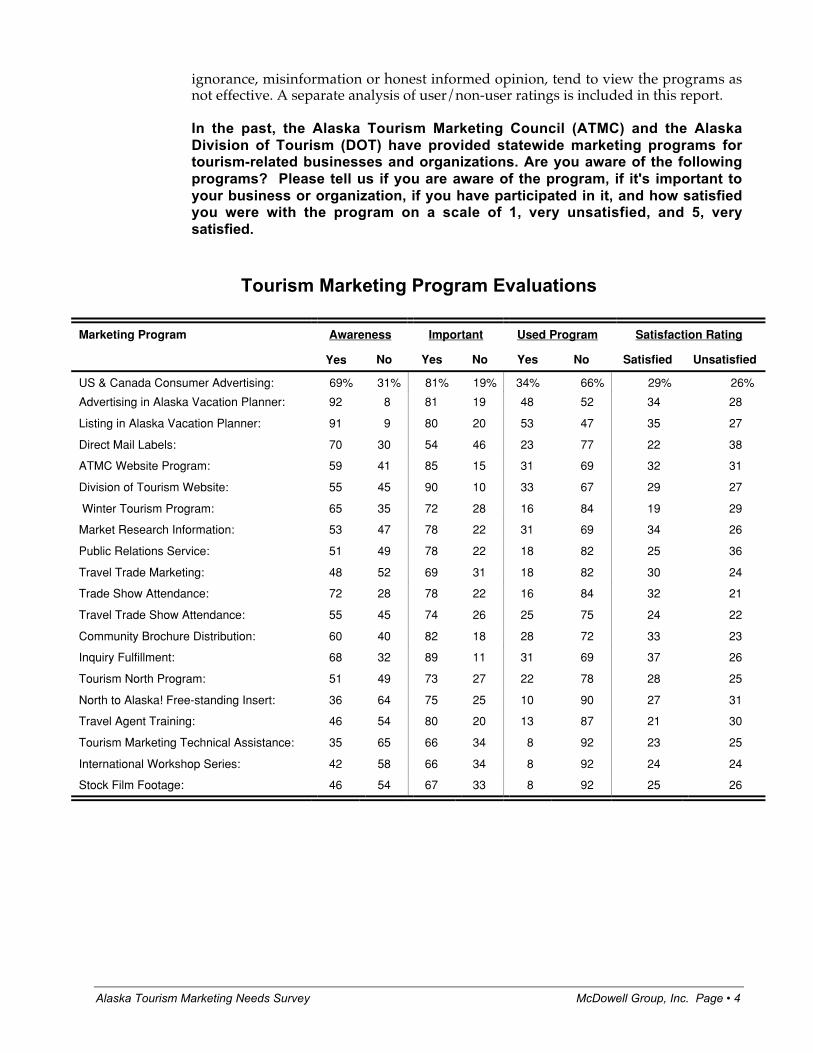
In the past, the Alaska Tourism Marketing Council (ATMC) and the AlaskaDivision of Tourism (DOT) have provided statewide marketing programs fortourism-related businesses and organizations. Are you aware of the followingprograms? Please tell us if you are aware of the program, if it's important toyour business or organization, if you have participated in it, and how satisfiedyou were with the program on a scale of 1, very unsatisfied, and 5, verysatisfied.
Tourism Marketing Program Evaluations
Marketing Program Awareness Important Used Program Satisfaction Rating
The Alaska Vacation Planner was, by far, the most recognized marketing programamong the 20 being evaluated. Ninety-two percent were aware of the opportunity toadvertise in it and 91% were aware of the listing opportunity. It was followed byTrade Show Attendance (72% were aware), Direct Mail Labels (70%), U.S, andCanada Consumer Advertising (69%) and the Winter Tourism Program (65%).Community Brochure Distribution at (60%) was the only other program with 60% orhigher awareness.
At the other end of the scale, lowest awareness went to Tourism Marketing TechnicalAssistance (35%), the North to Alaska Free Standing Insert (36%) and theInternational Workshop Series (42%).
Perceived Importance of Marketing Programs
Fulfillment and technology are the clear leaders in perceived importance. However,twelve programs were identified as important to at least 75% of respondentsincluding some programs with low awareness. Further, at least one-half of allrespondents considered every program important.
Division of Tourism Website (90%), Inquiry Fulfillment (89%) and ATMC Website(85%) were the leading choices in terms of importance to respondents’ businesses ororganizations. Community Brochure Distribution (82%) was followed byUS/Canada Consumer Advertising and Advertising in the Alaska Vacation Planner(both 81%). Listing in the Planner and Travel Agent Training (both 80%) were theother programs with 80%+ importance ratings.
Least important, by far, to respondents’ businesses or organizations was DirectMailing Labels (54% rated it important). It was followed by Tourism MarketingTechnical Assistance (67%), International Workshop Series (66%) and Stock FilmFootage (66%). Though ranked lower in importance, they are still rated high in termsof percentage.
With the exception of the two Planner programs (advertising and listings), everyprogram had a higher importance than recognition score. We assume this means thatonce people are aware of these programs they think they are important. This pointsout the need to inform tourism interests of available programs. The fact that at least30% of these tourism-focused entities that labored through the survey were unawareof 18 of the 20 programs is a major communications challenge for both the ATIA andADOT. We can probably assume that non-respondents were even less aware of theprograms.
Use of Marketing Programs
By far the most heavily used programs were the two Planner programs. PlannerListing (used by 53% of respondents) and Planner Advertising (48%) were theleading programs in terms of use. These were ranked well ahead of the 34% whoperceive themselves as using US/Canada Consumer Advertising.
Technology use is next on the program use list. One-third of respondents (33%) saidthey used the Division of Tourism Website while another 31% used the ATMCWebsite. Market Research Information and Inquiry Fulfillment (both used by 31%)were the other two programs with over 30% participation.
The Tourism North program, a significant cooperative marketing effort betweenAlaska and Canada, is used by 22% of respondents, has a 73% importance rating andjust over one-half (51%) are aware of it.
Lowest in usage rates were Tourism Marketing Technical Assistance, InternationalWorkshop series and Stock Film Footage, each used by 8% of respondents.
Overall, use tends to increase as the size of the company or organization increases.This may be due to a number of factors. Larger firms and organizations have moreresources. Participation usually costs money as in the case of some major ATMCprograms. Smaller entities tend to make higher use of some of the ADOT programs(ADOT website, inquiry servicing and community brochure distribution) that arefree. Further, larger entities are larger often because they historically have done whatis successful and participation in these programs is intended to increase success inthe Alaska tourism market place.
The largest firms and organizations are the heaviest users of all programs exceptInquiry Fulfillment and Community Brochure Distribution. Large entity use isparticularly heavy (75% to 100%) in the core ATMC programs. The largest entitieshave more than 50% participation in ten of the twenty programs. The smallestbusinesses or organizations are the least likely to participate in programs. Theirhighest participation is 41% in Planner Listings. Only 20% or more of the smallestentities participate in six of the twenty programs. Mid-sized businesses ororganizations participate more than the smaller ones and less than the largest ($5million+) businesses or organizations. Their participation is heaviest in the coreATMC programs but they are also important participants in the same ADOTprograms popular among the smallest entities.
Satisfaction with Marketing Programs
Respondents were asked to rate effectiveness on a 1 to 5 scale from “very” to “not atall” satisfied. While less than one-half of respondents actually use 19 of the 20programs, many more respondents have opinions on the effectiveness of theseprograms so the ratings also include a significant number of non-users. Respondentsare moderately satisfied overall but in many cases the largest group is in the middle,saying they are neither satisfied nor unsatisfied.
Respondents are not overly enthusiastic about the effectiveness of any of the 20programs, nor are they pointedly critical. When comparing the percentage of“satisfied’ and “unsatisfied” ratings, three programs have at least 10% morerespondents giving a satisfied than an unsatisfied rating.
Inquiry Fulfillment by ADOT (37% satisfied vs. 36% unsatisfied) and Trade ShowAttendance (32% vs. 21%) are the leaders in relative satisfaction followed closely byCommunity Brochure Distribution (33% vs. 23%).
The most heavily used programs (Planner advertising and listing) receivemoderately positive ratings with 34% and 35% positives and 28% and 27% negatives.Website programs also have lukewarm returns with positives outweighing negativesby 1% and 2% for the ATMC and ADOT sites, respectively.
Using this same relative satisfaction comparison, the programs judged least effectiveare Direct Mail Labels (22% satisfied vs. 38% unsatisfied), Public Relations Services(25% vs. 36%) and Winter Tourism Program (19% vs. 29%). Other programs with
negative satisfaction scores are Travel Agent Training, North to Alaska FreeStanding Insert, Tourism Marketing Technical Assistance and Stock Film Footage.
In general, satisfaction, like participation, tends to increase as the size of the businessor organization increases. Larger firms and organizations tend to rate programshigher, giving “satisfied” ratings above 50% and as high as 75% to nine programs.Travel Show Attendance, Market Research, Public Relations, ATMC website,U.S./Canada Consumer Advertising and Planner Advertising get the highest scores.The smallest businesses or organizations rate no program as high as 50% “satisfied”and their highest scores (of 42% to 35%) go to Inquiry Fulfillment, Market ResearchInformation, ADOT Website, Community Brochure Distribution and Trade ShowAttendance. Mid-sized firms and organizations tend to rate programs higher than dothe smallest entities and lower than do the largest entities. Among firms andorganizations with sales (or budgets) of $1-$5 million, the highest satisfaction scores(50%) are Inquiry Fulfillment and Trade Show Attendance. They also rate the coreATMC programs higher than do the smallest entities but not as high as do thelargest firms and organizations.
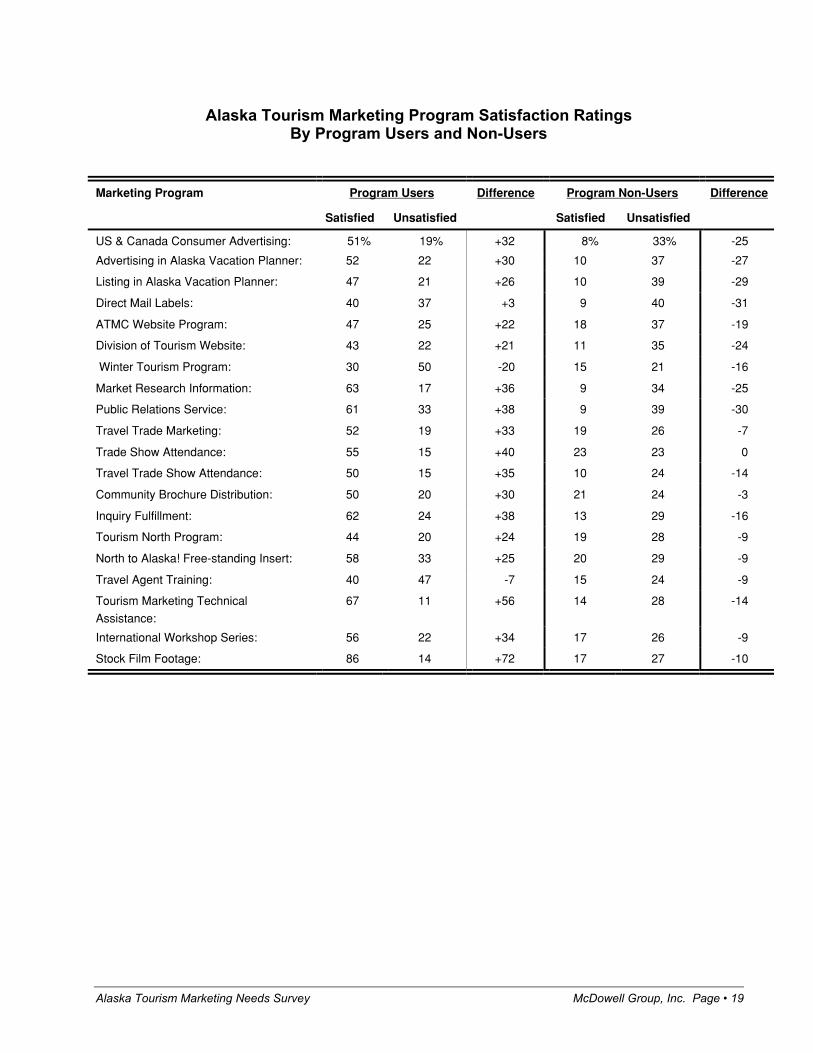
Satisfaction Rating of Alaska Marketing Program By Users and Non-Users
Following is a separate analysis of the dramatically different satisfaction opinionsexpressed by program users vs. non-users. The following table details these results.
Program users appear quite satisfied with most programs and almost all programusers did venture an opinion on this question. In seventeen of twenty cases, satisfiedprogram users significantly exceed unsatisfied users by at least 21% (ADOT Website)and as much as 72% (Stock Film Footage).Only two programs (Winter Tourism at–20% and Travel Agent Training at –7%) have more unsatisfied than satisfied users.The Direct Mail Labels program had a narrow +3% positive margin of satisfied overunsatisfied users. (See “Difference” columns in the following table for this data).
The highest satisfaction levels among program users are Stock Film Footage (86% ofusers are satisfied), Tourism Marketing Technical Assistance (67%), Market ResearchInformation (63%), Inquiry Fulfillment (62%) and Public Relations service (61%).Users are least satisfied with Winter Tourism (30% satisfied) and Travel AgentTraining and Direct Mail Labels (both with 40% of their users satisfied).
About one-fourth of all non-users of each program expressed either a negative orpositive opinion and it is the opinions of these respondents that are shown in thefollowing table. Another one-fourth of non-users expressed a neutral (neithersatisfied nor unsatisfied) opinion. Overall about one-half of non-users declined torate each program while one half did express a satisfaction rating of some kind.
The one-fourth of non-users who did offer either a positive or negative opinion aregenerally unsatisfied with nineteen of the twenty programs and the twentiethprogram had a breakeven satisfaction rating. Direct Mail Labels, Market ResearchInformation and Planner Listings had the highest negative scores when comparingsatisfied with unsatisfied percentages (see following table for details). The questionarises as to why this level of dissatisfaction exists among some non-users when thosemost familiar with these programs (users) rate them highly. Regardless of thereasons (ignorance, misinformation, honest informed opinion, etc.), a clear solutionis educational out reach to both users and potential users.
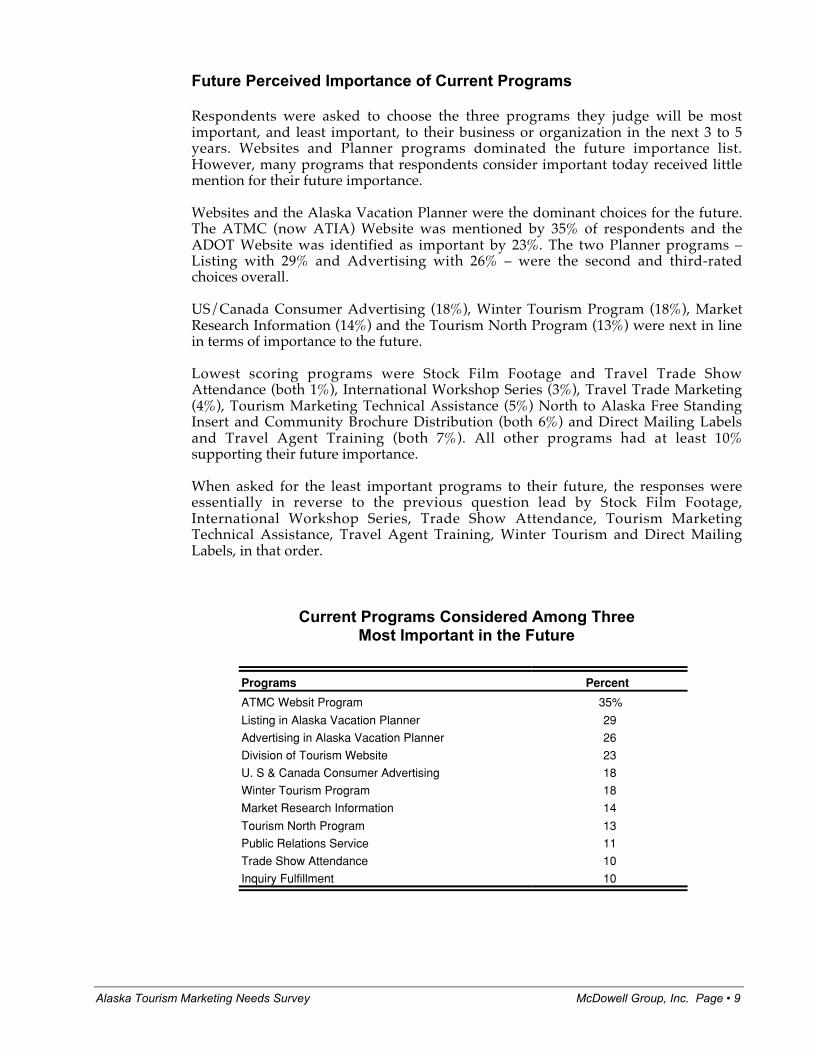
Respondents were asked to choose the three programs they judge will be mostimportant, and least important, to their business or organization in the next 3 to 5years. Websites and Planner programs dominated the future importance list.However, many programs that respondents consider important today received littlemention for their future importance.
Websites and the Alaska Vacation Planner were the dominant choices for the future.The ATMC (now ATIA) Website was mentioned by 35% of respondents and theADOT Website was identified as important by 23%. The two Planner programs –Listing with 29% and Advertising with 26% – were the second and third-ratedchoices overall.
US/Canada Consumer Advertising (18%), Winter Tourism Program (18%), MarketResearch Information (14%) and the Tourism North Program (13%) were next in linein terms of importance to the future.
Lowest scoring programs were Stock Film Footage and Travel Trade ShowAttendance (both 1%), International Workshop Series (3%), Travel Trade Marketing(4%), Tourism Marketing Technical Assistance (5%) North to Alaska Free StandingInsert and Community Brochure Distribution (both 6%) and Direct Mailing Labelsand Travel Agent Training (both 7%). All other programs had at least 10%supporting their future importance.
When asked for the least important programs to their future, the responses wereessentially in reverse to the previous question lead by Stock Film Footage,International Workshop Series, Trade Show Attendance, Tourism MarketingTechnical Assistance, Travel Agent Training, Winter Tourism and Direct MailingLabels, in that order.
Current Programs Considered Among ThreeMost Important in the Future
The survey asked respondents to describe their own in-house marketing programsthat are not directly related to the cooperative programs listed earlier in the survey.The responses reveal why these businesses and organizations value the full range ofmarketing programs offered in the past by ATMC and ADOT. The average Alaskatourism business and organization engages in several types of marketing activity. Inaddition to significant participation in cooperative programs, many of them appearto conduct comprehensive programs on their own. When it comes time to evaluateprograms, they are experienced and literate in Alaska tourism marketing.
Almost all tourism businesses or organizations in the survey prepare and distributea brochure(s) – 84% do so – and maintain a web page for information purposes(80%). Thirty percent also maintain a web page for bookings. A very high percentage(70%) purchase print media advertising on their own and nearly one-half (44%)purchase electronic media advertising. Over one-half (54%) conduct public relationsactivities of their own. A significant percentage (38%) conduct direct mailpromotions of their own.
Responding businesses and organizations tend to participate in local CVB programs(59%) and in regional marketing programs (30%), and nearly one-half claimmembership in a trade association of some kind. Four in ten call directly on travelagents and/or wholesalers. Three of ten participate in trade/consumer showsoutside and inside Alaska.
However, few of them (just 20%) evaluate their markets or programs through theirown market research.
In-House Marketing Program Utilization
Marketing Programs Percent UsingIn-House
Prepares & Distributes a Brochure(s) 84%
Maintains Internet Web Page for Information 80
Purchases Print Media Advertising 70
Participates in Local Convention and Visitors Bureau Programs 59
Conducts Public Relation Activities 54
Member of trade Organization 46
Purchases Electronic Media Advertising 44
Calls on travel Agents and/or Wholesalers 41
Conducts Direct Mail Promotions 38
Participates in Trade/Consumer Shows Inside Alaska 33
Maintains Internet Web Page for Booking 30
Participates in Regional Marketing Programs 30
Participates in Trade/Consumer Shows Outside Alaska 27
When asked which two of their marketing activities are most effective, Alaskatourism businesses or organizations identify the three most common activities –brochures, the internet and print advertising. Brochures are still the heart of tourismmarketing with 41% saying that preparing and distributing them is their mosteffective sales device. Not far behind is technology with 37% identifying maintainingtheir web page as their most effective program. Another 18% say having a web pagefor bookings is among their top two effective programs. Print media advertising ismentioned as most effective for 30%. Finally, participation in local CVB programswas in the top two for 14% of these entities.
Marketing Budgets
Marketing expenditures (expressed as a percent of total business income) variesdramatically among entities surveyed. Responding businesses or organizations totalbudgets for marketing of all kinds range from nothing to over 20% of total businessincome and averaged 11% of total business income. Overall, marketing expendituresare fairly substantial. Eleven percent spent over 20% of their total income onmarketing, 17% spent between 11% and 20%, while another 20% of all respondentsspent between 6% and 10% of their income. One-half of all respondents spentbetween 1% and 5%.
Markets: Today and in the Future
Survey respondents were asked to identify their important current markets as wellas those markets they most want emphasized in future Alaska tourism marketingprograms. We asked them to identify their current and desired future markets interms of the five segments, five countries and five states most important to them. Thequestions were open-ended so the segments mentioned in this survey are thespontaneous, un-prompted responses of Alaska tourism industry firms andorganizations.
Readers should keep in mind that each respondent was asked for the five markets ofinterest to them so the data reflects only the frequency mentions of specific markets.For some that market may be the dominant market for their business and for othersit may be the fifth most important and that could mean it is only a small segment.
In summary, respondents would like to see changes in the specific segments targetedby Alaska marketing programs in the future. Respondents consider it desirable toemphasize marketing to the adventure, eco-tourism, small cruise ship and ferrymarkets to enhance their importance to the Alaska industry. Conversely, whilerecognizing that sport fishing and large cruise ship markets are important now andwill be in the future, respondents see them as slightly lower future marketingpriorities when compared to their current importance.
While respondents are clear about their desired change in market segment emphasis,they prefer to focus in the future on the same countries and states that are producingtheir current markets. The top ten states and the top eight countries remainunchanged when comparing current markets with desired future emphasis.
Respondents were asked to list the five market segments most important to theirbusiness today. The market segments most often mentioned are, in order, sportfishing, adventure, highway, large cruise ship, small cruise ship, eco-tourism and theferry market. These were mentioned as important by between 47% (sport fishing)and 24% (ferry market) of respondents. Cultural heritage (19%), independents (14%)and winter (12%) markets followed. Readers should keep in mind that mostsegments mentioned were specific segments of independent or inde-package visitorswhile the generic term “independent” was also mentioned on its own. While thesport fishing importance may seem surprising, an estimated 150,000+ visitors dopurchase sport fishing licenses each year and many businesses appear to get at leastsome of their trade from this segment.
Markets with surprisingly low mentions include wildlife enthusiasts (mentioned by7% of respondents as one of their five most important markets), the visiting friendsand relatives market (5%) and package tours (5%).
Desirable Future Market Segments for Alaska Marketing Programs
Interestingly, the order shifts when it comes to desired future markets compared tocurrent markets. Adventure market (39%), eco-tourism (35%), sport fishing (34%),highway (31%), ferry (28%) small cruise ship (27%) and large cruise ship (24%) arethe leaders. Cultural heritage, independent and winter markets follow. Adventure,eco-tourism, ferry and small cruise ship segments increased in rank while sportfishing and large cruise ship segments were ranked lower but still stayed in the topseven markets for future marketing emphasis. The highway market remained inforth position.
Again, the absence of certain market segments among respondent priorities isnoticeable. Wildlife enthusiasts was a top five priority market for just 6% ofrespondents, ranking fourteenth, just ahead of package tours and behind the visitingfriends and relatives market. However, the more general category of eco-tourism,the #2 preferred market, certainly would include people seeking outdoorexperiences that hopefully would include wildlife viewing.
Most Important Current Markets andMost Desired Markets for Future Alaska Program Emphasis
Most Important CurrentMarket Segments
% Mentioningin Top Five
Most Desired Market Segments for FutureAlaska Program Emphasis
Today the Alaska tourism industry, as represented by these respondents, isprimarily dependent on the US market. 93% mention it as one of their five mostimportant countries. Following the U.S. is Germany (66%), Canada (43%) Japan(42%) and Australia (35%). England (19%) and Switzerland (17%) are the only othercountries mentioned by more than 10% of the respondents.
Desirable Future Market Segments By Country
When asked about the countries most desirable for future Alaska marketingprograms respondents put slightly less emphasis on the US (85%) and Germany(62%) and called for slightly more emphasis on Japan (49%), Canada (46%) andAustralia (38%). Emphasis on Switzerland declined (to 10%) while Europe increased(to 11%).
Most Important Current Markets andMost Desired Markets for Future Alaska Program Emphasis
By Country
Most Important CurrentCountries:
% Mentioningin Top Five
Most Desired Countries for FutureAlaska Program Emphasis:
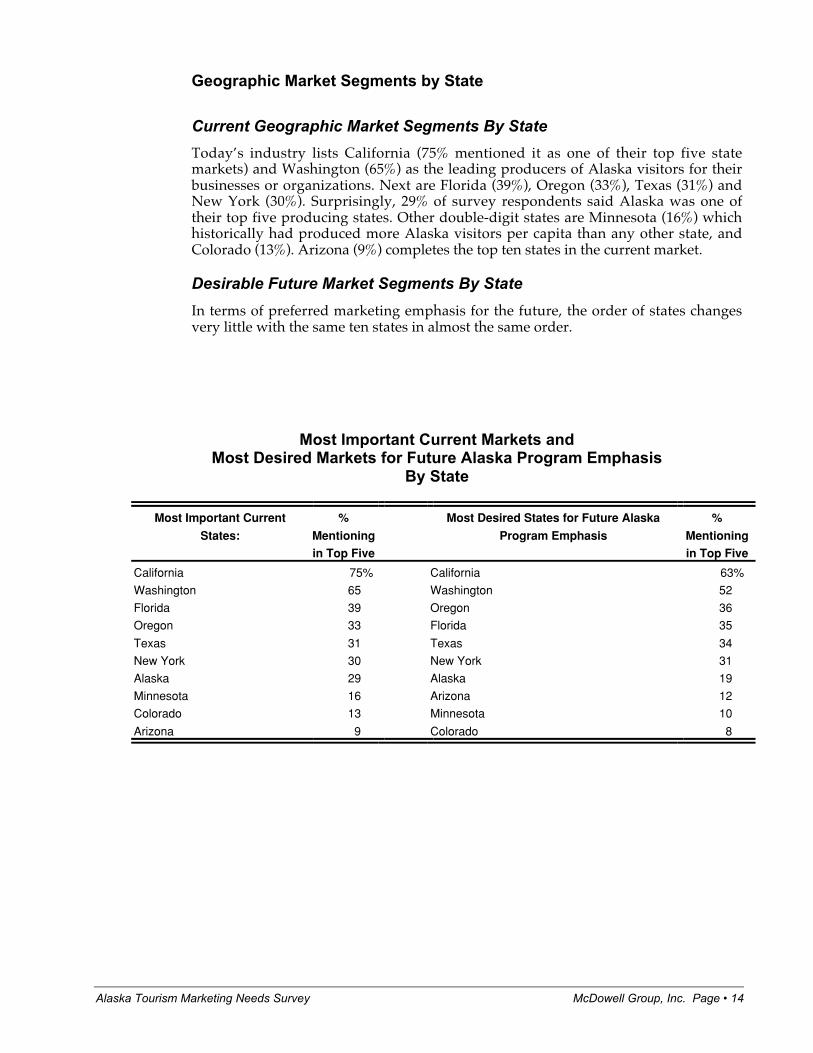
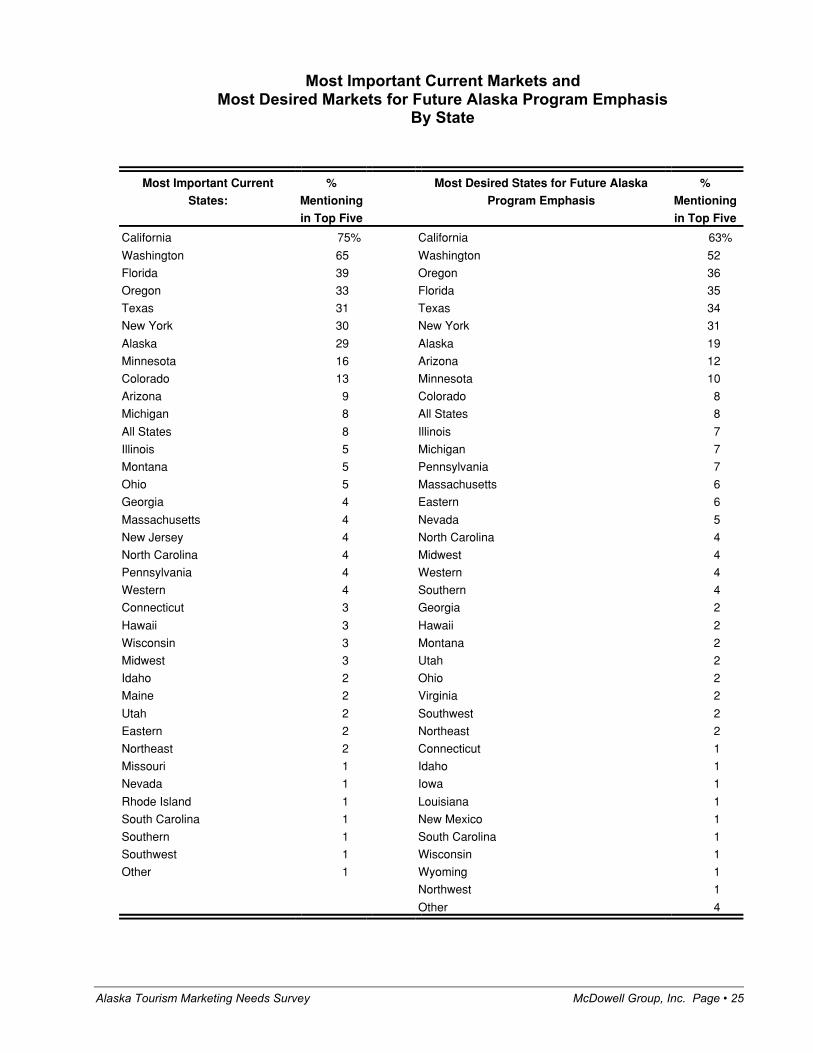
Today’s industry lists California (75% mentioned it as one of their top five statemarkets) and Washington (65%) as the leading producers of Alaska visitors for theirbusinesses or organizations. Next are Florida (39%), Oregon (33%), Texas (31%) andNew York (30%). Surprisingly, 29% of survey respondents said Alaska was one oftheir top five producing states. Other double-digit states are Minnesota (16%) whichhistorically had produced more Alaska visitors per capita than any other state, andColorado (13%). Arizona (9%) completes the top ten states in the current market.
Desirable Future Market Segments By State
In terms of preferred marketing emphasis for the future, the order of states changesvery little with the same ten states in almost the same order.
Most Important Current Markets andMost Desired Markets for Future Alaska Program Emphasis
Future Marketing Program Priorities for the State of Alaska
Website or web presence (29%), broadcast media (TV, radio) advertising (20%) andthe Alaska Vacation Planner (16%) are the top three priorities among respondents forcontinuation or implementation in the next three to five years. Print mediaadvertising (11%), winter tourism (9%), trade shows and image marketing (6%) werethe other future programs that received more than a 5% response.
When this list is compared to the past distribution of statewide programexpenditures (it heavily emphasized on print media and list fulfillment), it appearsthat the respondents would like to see changes from the program in the past (budgetallowing, of course).
Comments and Suggestions about Tourism Marketing Needs
A number of respondents entered comments about tourism marketing needs andAlaska tourism in general. These comments tended to mirror other findings in thesurvey. Nine respondents encouraged more spending on marketing to help smallfamily businesses. Other comments were aimed at improving the Vacation Planner,supporting TV advertising, increasing web presence, revising the current programsand expanding the season.
Future Alaska Tourism Marketing Program Priorities
Characteristics of Survey Respondent Businesses and Organizations
Composition of Sample
The total sample of 673 businesses and organizations with Alaska offices isconsidered representative, rather than random and statistical. The initial sampleconsisted of 40 tourism-related organizations and agencies (primarily DMOs), 130AVA members from the membership list and 503 businesses selected from severalthousand from the Alaska Department of Labor list of tourism-affected businesses.This third group also included additional AVA members as they randomly occurredin the population of all tourism-related businesses. The distribution of the 142 surveyrespondents was spread relatively evenly among major categories, allowing forsome sub-group analysis and balanced representation. Of total respondents, 11%were transportation companies, 19% retail, 26% lodging of all kinds, 19% tourcompanies, 15% organizations (mostly CVBs) and 13% services and other.
Origin of Sales
On average, the businesses surveyed generated two-thirds (66%) of their 1999 grosssales from visitors to Alaska and one-third (34%) from Alaska residents. Nearly one-half of the businesses surveyed received over 75% of their 1999 sales from visitors.
Of the total Alaska visitors that constituted the markets for the businesses surveyed,50% were classified as independent visitors, 16% as inde-package visitors and 33%were considered package tour visitors.
The dominant share of visitors business (83% of 1999 sales to visitors) came in thesummer months of May through September. Fall (October-December) delivered 8%of total visitor business and Winter (January through April) provided 9%.
Employment By Tourism Businesses and Organizations
The survey included a mix of small, medium and large operators. The average entityparticipating in the survey employed 41 people, 11 of them year-around employeesand 30 of them seasonal employees. About one in four firms employed five or fewerpeople, 28% employed 6 to 10, 18% employed 11 to 20 and 28% employed over 20people in 1999.
Gross Sales
Responding businesses represented a wide range of businesses from very smallfamily operations to major corporations. Of those willing to answer the gross salesquestion, 39% grossed $250,000 or less, 31% grossed between $250,000 and $1million, 22% between $1 million and $5 million and the 8% earned the largestamount over $5 million in 1999.
Businesses were asked the percentage of the enterprise owned by Alaska residents.Since the sample consisted of businesses and organizations with offices in Alaska, itis not surprising that 84% were owned 100% by resident Alaskans. Ten percent wereowned 50% to 99% by Alaskans and 7% of the surveyed businesses had less than50% Alaskan ownership.
1. Please briefly describe your tourism-related business or organization.
Tourism Related Category of Sample Respondents
Transportation 11%
Retail 19
Lodging 26
Tour 19
Organization 15
Services/Other 13
2. In the past, the Alaska Tourism Marketing Council (ATMC) and the Alaska Division of Tourism(DOT) have provided statewide marketing programs for tourism-related businesses and organizations.Are you aware of the following programs? Please tell us if you are aware of the program, if it'simportant to your business or organization, if you have participated in it, and how satisfied you werewith the program on a scale of 1, very unsatisfied, and 5, very satisfied.
Tourism Marketing Program Evaluations
Marketing Program Awareness Important Used Program Satisfaction Rating
3. In the next 3 to 5 years which three of the programs in question #2 do you think would be mostimportant to your business, community or organization? Please list in order of importance to you,even if you do not participate in them.
Current Programs Considered Among Three Most Important in the Future
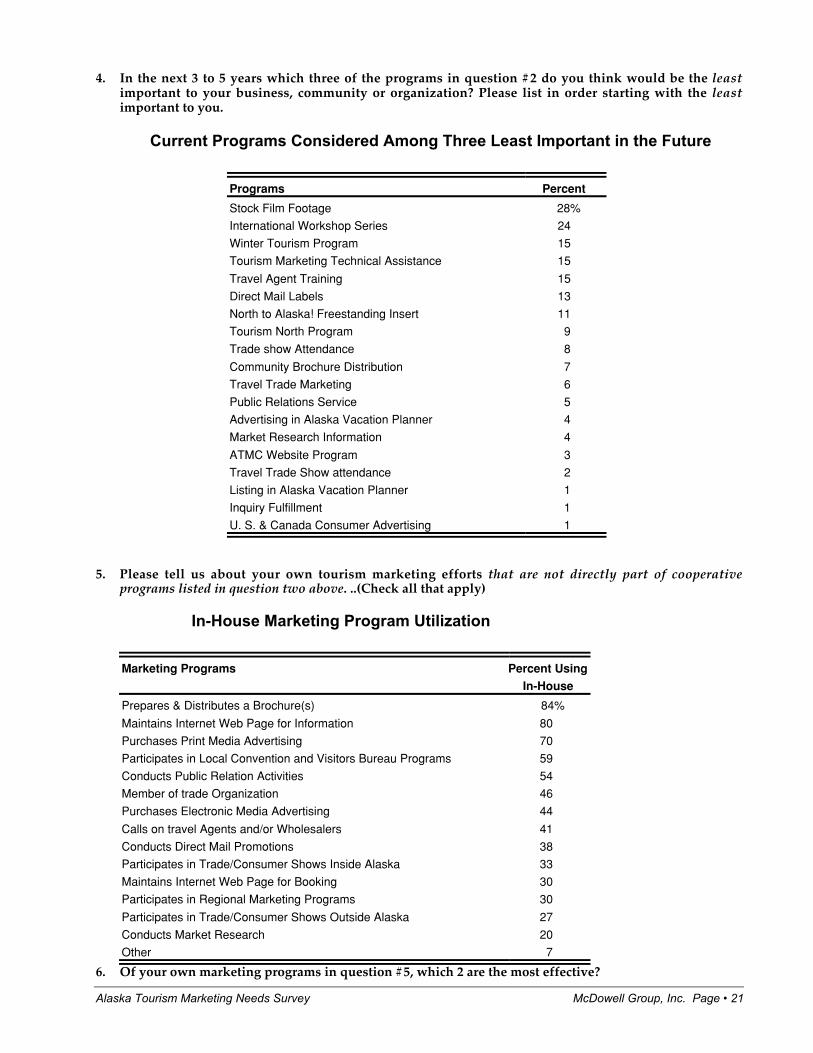
4. In the next 3 to 5 years which three of the programs in question #2 do you think would be the leastimportant to your business, community or organization? Please list in order starting with the leastimportant to you.
Current Programs Considered Among Three Least Important in the Future
Programs Percent
Stock Film Footage 28%
International Workshop Series 24
Winter Tourism Program 15
Tourism Marketing Technical Assistance 15
Travel Agent Training 15
Direct Mail Labels 13
North to Alaska! Freestanding Insert 11
Tourism North Program 9
Trade show Attendance 8
Community Brochure Distribution 7
Travel Trade Marketing 6
Public Relations Service 5
Advertising in Alaska Vacation Planner 4
Market Research Information 4
ATMC Website Program 3
Travel Trade Show attendance 2
Listing in Alaska Vacation Planner 1
Inquiry Fulfillment 1
U. S. & Canada Consumer Advertising 1
5. Please tell us about your own tourism marketing efforts that are not directly part of cooperativeprograms listed in question two above. ..(Check all that apply)
In-House Marketing Program Utilization
Marketing Programs Percent UsingIn-House
Prepares & Distributes a Brochure(s) 84%
Maintains Internet Web Page for Information 80
Purchases Print Media Advertising 70
Participates in Local Convention and Visitors Bureau Programs 59
Conducts Public Relation Activities 54
Member of trade Organization 46
Purchases Electronic Media Advertising 44
Calls on travel Agents and/or Wholesalers 41
Conducts Direct Mail Promotions 38
Participates in Trade/Consumer Shows Inside Alaska 33
Maintains Internet Web Page for Booking 30
Participates in Regional Marketing Programs 30
Participates in Trade/Consumer Shows Outside Alaska 27
Conducts Market Research 20
Other 7
6. Of your own marketing programs in question #5, which 2 are the most effective?
8. Your current market segments. Please list the five market segments, five countries and five statescurrently most important to your business or organization:
9. Future Alaska Program Emphasis: List the five market segments, five countries and five states youmost want emphasized in Alaska marketing programs in the next three to five years.
Most Important Current Markets andMost Desired Markets for Future Alaska Program Emphasis
Most Important CurrentMarket Segments
%Mentioning
in Top Five
Most Desired Market Segments for FutureAlaska Program Emphasis
10. Please rank in order the top three marketing programs of any kind that you would like the State ofAlaska to continue or implement in the next three to five years.
Future Alaska Tourism Marketing Program Priorities
Marketing Program % of Total Top ThreeMentions
Website/Web Presence 29%
Broadcast Media (TV, Radio) Advertising 20
Vacation Planner 16
Print Media (Newspaper, Magazine) Advertising 11
Winter Tourism 9
Trade Shows 7
Imagine Marketing 6
Education of Wholesalers/Travel Agents 5
Public Relations 5
Direct Mail Labels 4
Market Research 4
International Advertising 4
Promote Cultural Heritage/Art 2
Tourism North Program 1
Brochures 1
Other (All less than 1 percent) 22
11. Please estimate what percentage of your total 1999 gross sales came from.
Respondent Income Dependence on Resident and Visitor Markets
Percent of 1999 Income from: Alaska Residents Alaska Visitors
0-25% 49% 15%
26-50 24 18
51-75 13 20
76-100 14 46
Mean 33.8% 66.2%
Read: 49% of respondent businesses received 0-25% of their 1999 business from Alaska residents.