Alex Zelikovsky Department of Computer Science Georgia State University Joint work with Serghei Mangul, Irina Astrovskaya, Bassam Tork, Ion Mandoiu Viral Quasispecies Reconstruction Based on Unassembled Frequency Estimation
Transcript
Alex ZelikovskyDepartment of Computer Science
Georgia State University
Joint work with Serghei Mangul, Irina Astrovskaya, Bassam Tork, Ion Mandoiu
Viral Quasispecies Reconstruction Based on Unassembled Frequency Estimation
Outline
• Introduction• ML Model• EM Algorithm• VSEM Algorithm• Experimental Results• Conclusions and future work
ISBRA 2011, Central South University, Changsha, China
454 Pyrosequencing
• Emulsion PCR• Single nucleotide addition
— Natural nucleotides— DNA ploymerase pauses until complementary
nucleotide is dispensed— Nucleotide incorporation triggers enzymatic
reaction that results in emission of light
ISBRA 2011, Central South University, Changsha, China
ML Model• Panel : bipartite graph
— RIGHT: strings>unknown frequencies
— LEFT: reads>observed frequencies
— EDGES: probability of the read to be emitted by the string>weights are calculated based on
the mapping of the reads to the strings
ISBRA 2011, Central South University, Changsha, China
strings
S1
S2
S3
R1
R2
R4
reads
R3
ML estimates of string frequencies
• Probability that a read is sampled from string is proportional with its frequency f(j)• ML estimates for f(j) is given by n(j)/(n(1) + . . . +
n(N))— n(j) - number of reads sampled from string j
ISBRA 2011, Central South University, Changsha, China
EM algorithm
• E-step: Compute the expected number n(j) of reads that come from string j under the assumption that string frequencies f(j) are correct• M-step: For each string j, set the new value of f(j)
equal to the portion of reads being originated by string j among all observed reads in the sample
ISBRA 2011, Central South University, Changsha, China
ML Model Quality• How well the maximum likelihood model explain the
reads• Measured by deviation between expected and
observed read frequencies
— expected read frequency:
ISBRA 2011, Central South University, Changsha, China
MLj
hil
li
jij f
h
he
ji
0: ,
,
,
||
||
R
eoD j jj
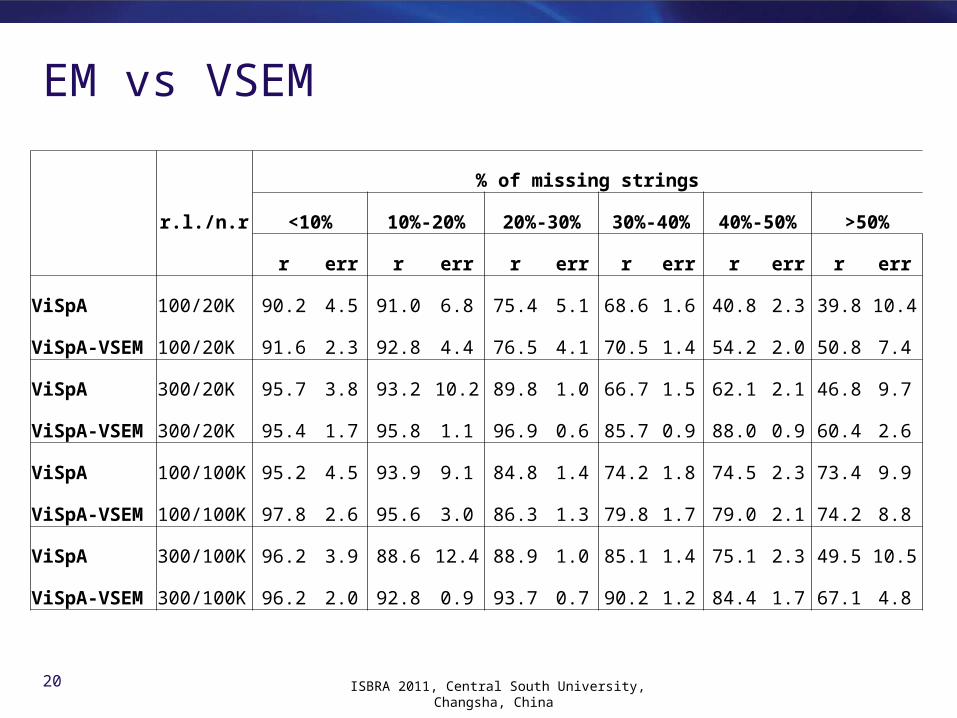
VSEM : Virtual String EM
ISBRA 2011, Central South University, Changsha, China