Page 1
RUSSIA > OIL & GAS
JUNE 18, 2014
1
Copyright © 2003-2014. Gazprombank (Open Joint-Stock Company)
Research Department
INDUSTRY UPDATE Analysts:
Alexander Nazarov [email protected]
Ivan Khromushin [email protected]
Alexey Dorokhov [email protected]
Ekaterina Zinovyeva [email protected]
Yury Tulinov, CFA [email protected]
Erik DePoy
[email protected]
Russian Oil and Gas Basic industry overview
Russian oil and gas industry handbook. In this report we provide a basic
description of the Russian oil and gas industry, including profiles of major
companies, and discuss the sector’s role in the Russian and global economy as
well as the main trends.
Russia is the world’s largest hydrocarbon producer, producing 15% of
total hydrocarbons. Russia produces 12.8% of global oil and 17.6% of global
gas, making the country the world’s top oil and gas producer on a combined
basis. In 2013, Russia produced 10.5 mln bpd of oil, ranking second in terms of
global production after Saudi Arabia. In 2013, Russia also produced 684 bcm of
gas, making it the world’s second-largest gas producer after the US.
Oil and gas industry – the most important for Russia’s economy. Russia’s
significant weight in the global economy has historically been underpinned by
the country’s strong oil and gas sector. As of 2013, the sector accounted for
28% of Russia’s GDP, 67% of the country’s exports and 56% of total revenues
of the federal budget.
Eastern focus, strengthening ties with China. Asian markets have become a
strategic focus of export diversification, with the fastest progress achieved in
relations with China. Russian-Chinese cooperation boomed in 2013, including large-
scale export contracts (Rosneft’s contract with CNPC, preliminary agreements with
Sinopec), JVs, and Chinese companies buying stakes in Russian projects
(Sinopec’s purchase of a 20% stake in NOVATEK’s Yamal-LNG). In May 2014,
Gazprom signed a $400 bln, 30-year gas export contract to China for annual
deliveries of 38 bcm of gas, which may boost its non-CIS gas exports by almost
25% starting from 2019, and announced plans to renew negotiations on a further
increase of gas exports to China using the Western route.
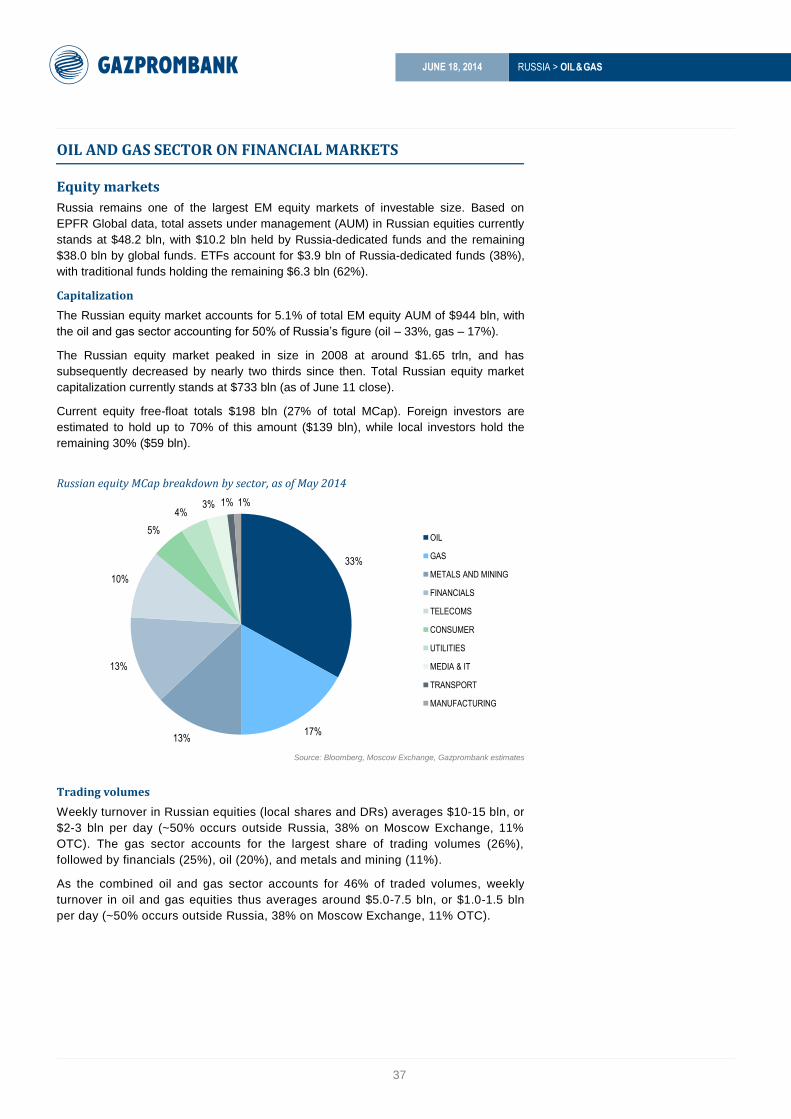
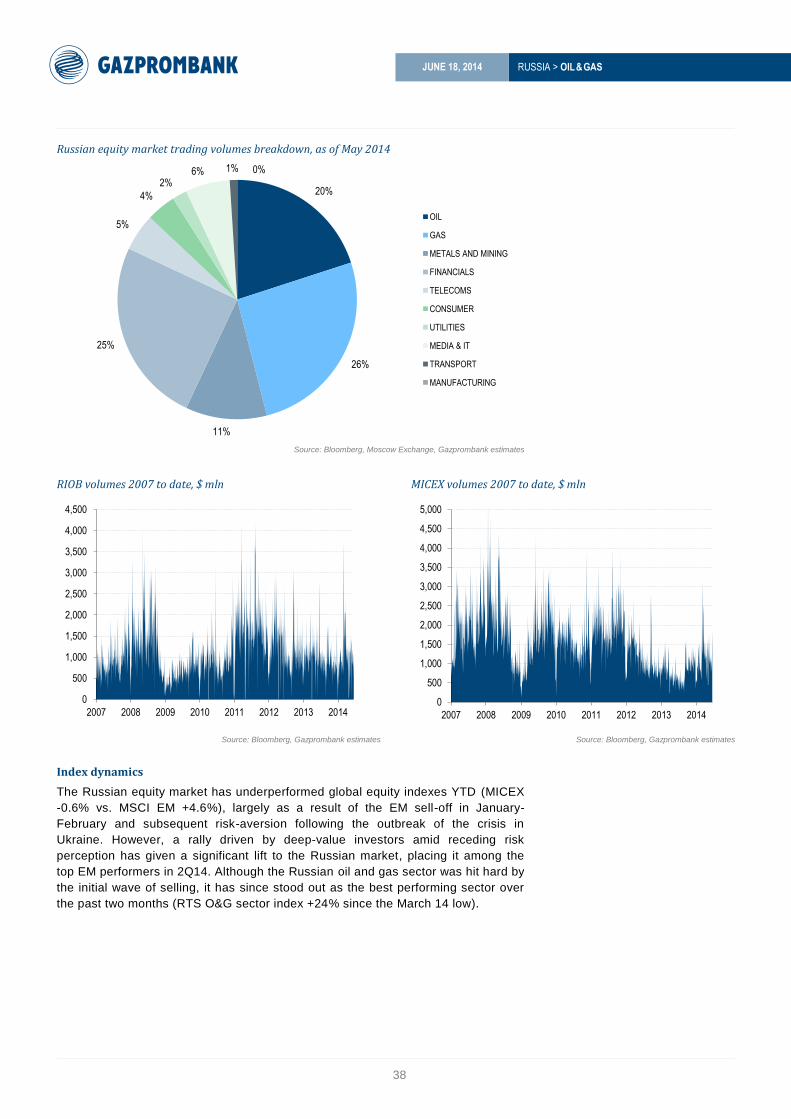
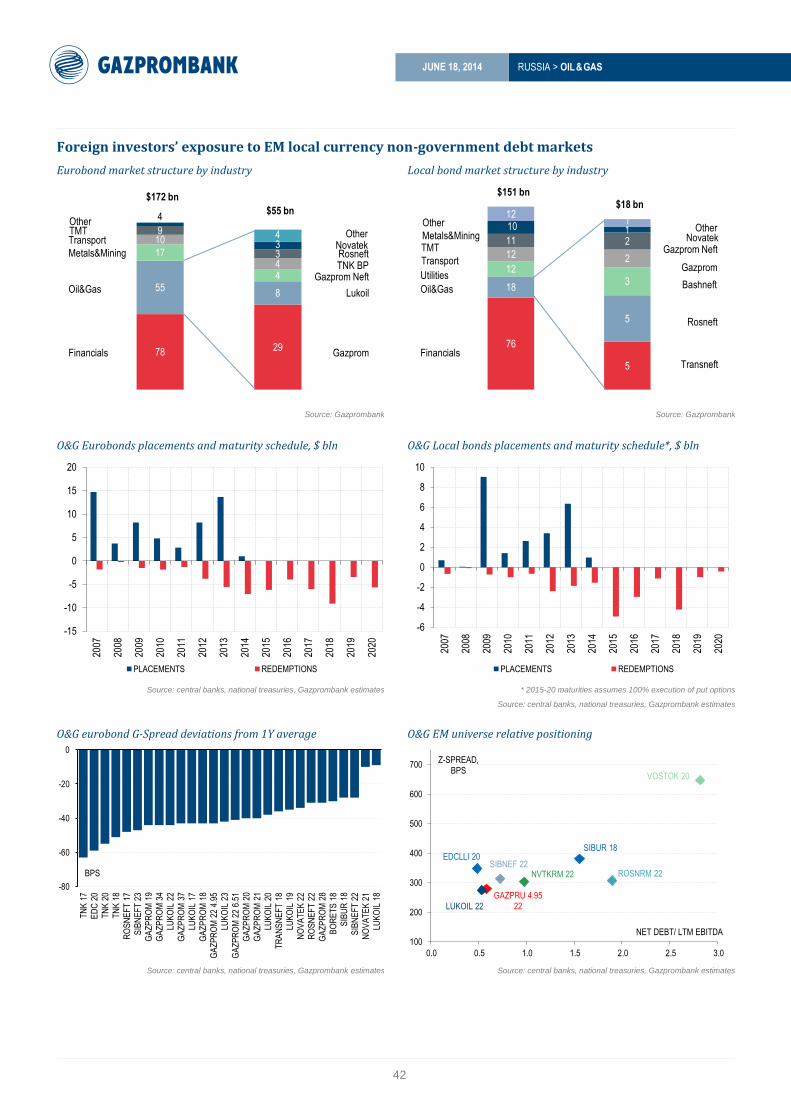
Oil and gas accounts for 50% of the Russian equity market and 22% of the
bond market. The oil and gas sector accounts for 50% (oil – 33%, gas – 17%) of
the Russian equity market’s capitalization, with weekly turnover in oil and gas
equities averaging $1.0-1.5 bln per day (~50% is outside Russia, 38% on
Moscow Exchange, 11% OTC). In the Eurobond corporate universe, oil and gas
issues comprise 31% of the total amount outstanding, with a bigger input only
from the financial sector (44%). Among local non-government bonds, 11% of
the amount outstanding is attributed to oil and gas issues.
Largest Russian oil and gas companies – low leverage, cheap valuation,
high dividend yields. Russian oil and gas companies trade with significant
discounts to international DM and EM peers, have low leverage, stable or even
growing outlooks, and offer good dividend yields. We highlight excellent
investment opportunities with good returns in both equity and fixed income
instruments.
Our top picks include Lukoil among the blue chips, and dividend names such as
the preferred shares of SurgutNG, Bashneft and Tatneft.
Russian oil and gas production
Source: CDU TEK, Gazprombank estimates
Russia’s share in global hydrocarbons production, 2013
Source: CDU TEK, BP
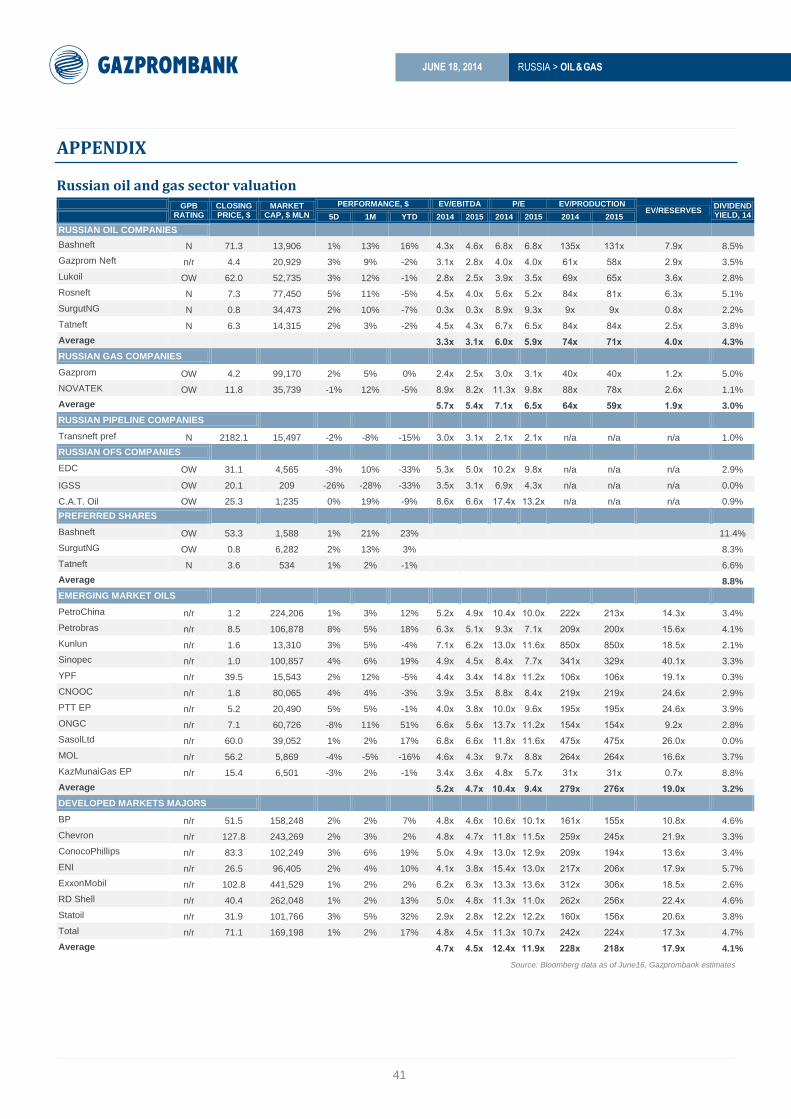
Russian oil and gas sector valuation*
* hereafter as of June 16, 2014
Source: Bloomberg, Gazprombank estimates
10.4
10.5 10.5 10.5
672
684
691 691
660
670
680
690
700
10.2
10.3
10.4
10.5
10.6
10.7
2012 2013 2014E 2015E
Oil (LHS) Gas (RHS)
mln bpd bcm
Russia 8.1 bln boe
15%
Others 44.6 bln boe
85%
Bashneft
Gazprom neft
Lukoil
Rosneft
Tatneft
Gazprom
Novatek
EM
DM
2х
4х
6х
8х
10х
12х
14х
1х 3х 5х 7х 9х
P/E
15
EV/EBITDA 15
Page 3
RUSSIA > OIL & GAS
JUNE 18, 2014
2
CONTENTS
Russian economy and oil and gas sector ...................................................................................................... 3
Macroeconomics ..............................................................................................................................................................................................................3
Sino-Russian cooperation ............................................................................................................................................................................................3
Oil and gas prices .................................................................................................................................................. 5
Oil prices .............................................................................................................................................................................................................................5
Gas prices ............................................................................................................................................................................................................................6
Russian oil and gas sector main facts ............................................................................................................ 8
Industry overview ...........................................................................................................................................................................................................8
Russian oil and gas: main players ......................................................................................................................................................................... 10
Industry trends.............................................................................................................................................................................................................. 11
Regulations ..................................................................................................................................................................................................................... 14
Unconventional oil and gas ...................................................................................................................................................................................... 15
Cooperation with China ................................................................................................................................... 17
Asia-Pacific and China: the most promising oil markets ............................................................................................................................ 17
Rosneft: the most Asia-oriented Russian oil major ....................................................................................................................................... 17
Gazprom Eastern gas program ............................................................................................................................................................................... 18
Lukoil ................................................................................................................................................................................................................................. 18
Gazprom Neft ................................................................................................................................................................................................................. 18
Corporate profiles ............................................................................................................................................. 19
Gazprom ........................................................................................................................................................................................................................... 19
NOVATEK ......................................................................................................................................................................................................................... 21
Rosneft .............................................................................................................................................................................................................................. 23
Lukoil ................................................................................................................................................................................................................................. 25
Gazprom Neft ................................................................................................................................................................................................................. 27
Bashneft ............................................................................................................................................................................................................................ 29
Surgutneftegas ............................................................................................................................................................................................................... 31
Tatneft ............................................................................................................................................................................................................................... 33
SIBUR ................................................................................................................................................................................................................................. 35
Oil and gas sector on financial markets ..................................................................................................... 37
Equity markets .............................................................................................................................................................................................................. 37
Appendix ............................................................................................................................................................... 41
Page 4
RUSSIA > OIL & GAS
JUNE 18, 2014
3
RUSSIAN ECONOMY AND OIL AND GAS SECTOR
Macroeconomics
At present, Russia enjoys steady positions among the world’s largest economies.
According to the IMF and WTO, as of 2013 Russia ranked eighth globally in terms of
nominal GDP ($2.1 trln), sixth in nominal GDP based on PPP valuation ($2.6 trln) and
thirteenth in external trade turnover ($868 bln).
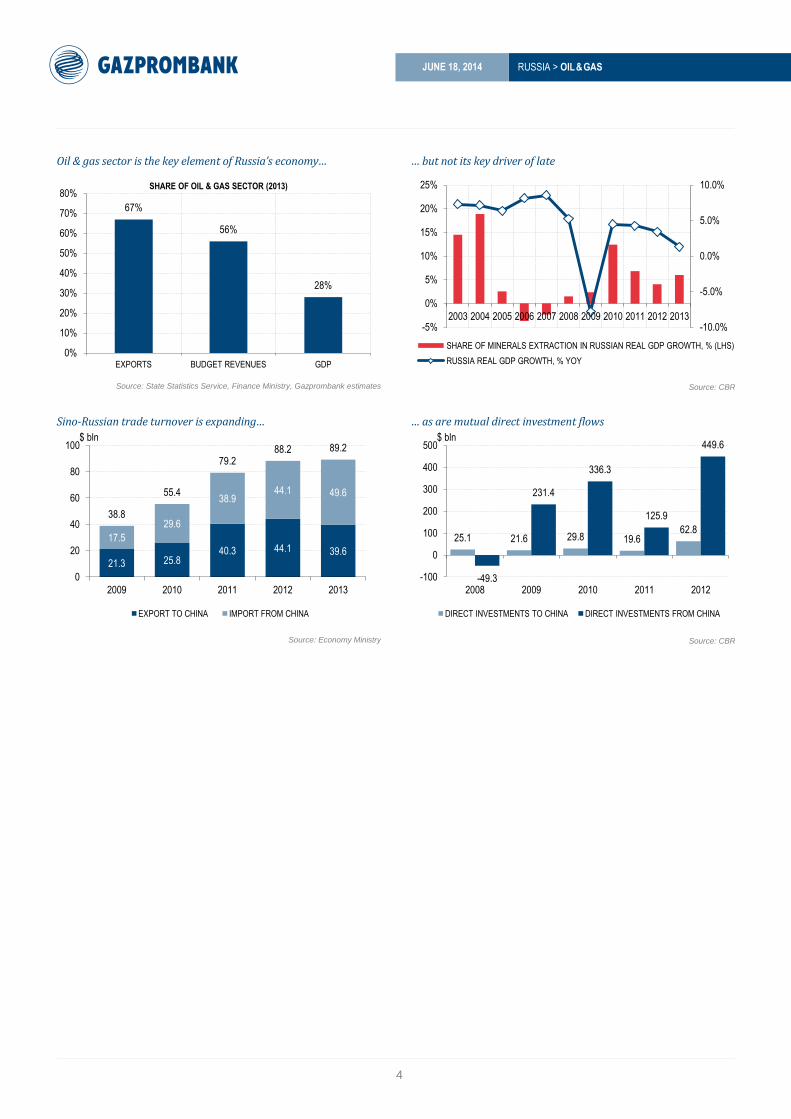
Russia’s significant weight in the global economy has historically been underpinned by the
country’s strong oil and gas sector. According to GPB estimates, as of 2013 the sector
contributed 28% to Russia’s GDP, 67% to the country’s exports and 56% to total revenues of
the federal budget.
Unsurprisingly, Russia’s key macro gauges exhibit high sensitivity to the level of oil
prices. For example, according to GPB estimates, for 2014 a decrease of the year-
average Urals price from $110/bbl to $100/bbl would prompt a 0.3-0.7 pps
deceleration of the country’s real GDP growth, a 3.0-3.2 pps decrease in the volume
of investment and a 1.1-1.2 pps deterioration of the federal budget surplus (as a
percentage of GDP). That said, we do not see significant downside risks for our
average Brent oil price forecast for this year ($108/bbl).
It is also important to note that given the relative stabilization of both selling prices and
production volumes, the oil and gas sector has not been the driving force of the Russian
economy in recent years. As such, over 2013 the contribution of minerals extraction to
Russia’s real GDP growth (+1.3%) totaled just 0.1 pps.
Sino-Russian cooperation
Asian markets have become a strategic focus of export diversification for many Russian
companies, with the fastest progress achieved in relations with China. Imports from
China have also been flourishing on the back of increasing private sector consumption.
In general, over the past five years Russia’s trade turnover with China has expanded by
2.3x times, demonstrating a spectacular 5Y CAGR of 18%.
In 2013, China contributed 10% of Russia’s consolidated imports and exports, lagging
behind the EU’s figure of 48%. However, this figure has potential for further growth –
according to Russian and Chinese government officials, trade turnover between the two
countries could reach $100 bln in 2015 (vs. $89 bln in 2013) and may double over the
next five years, to $200 bln in 2020.
One should not be misled by the stagnation of Sino-Russian trade volumes in 2013
totaling $89.2 bln (vs. $88.2 bln in 2012), as this was primarily caused by plunging
volumes of Russian exports to China (-10.2% YoY). This is likely to reverse in view of
the recent hydrocarbon deals agreed between the two countries.
Direct investment flows also provide evidence of strengthening economic ties between
the two countries. Direct investment by Chinese companies in Russia has more than
doubled since 2009, to $374 mln in 9M13. Russia’s direct investment in China has been
relatively small of late (in our view, mainly due to China’s limitations on capital flows
from abroad), but we highlight a tripling of the figure YoY in 2012 to $63 mln.
On the corporate level, Sino-Russian cooperation boomed in 2013, including large-scale
export contracts, upstream and downstream JVs (Rosneft’s contract with CNPC, preliminary
agreements with Sinopec) and purchases of stakes in Russian projects by Chinese
companies (Sinopec’s purchase of a 20% stake in NOVATEK’s Yamal-LNG). In May 2014,
Gazprom signed a $400 bln 30-year gas export contract to China for deliveries of up to 38
bcm per year, which could boost its non-CIS gas exports by almost 25% starting from 2019.
Aside from oil and gas, this cooperation has extended to the utilities sector, including the
construction of Tianwan NPP by Rosatom for the Jiangsu Nuclear Power Corporation, and
potential electricity exports from the Russian Far East to China by Inter RAO.
Page 5
RUSSIA > OIL & GAS
JUNE 18, 2014
4
Oil & gas sector is the key element of Russia’s economy… … but not its key driver of late
Source: State Statistics Service, Finance Ministry, Gazprombank estimates
Source: CBR
Sino-Russian trade turnover is expanding… … as are mutual direct investment flows
Source: Economy Ministry
Source: CBR
67%
56%
28%
0%
10%
20%
30%
40%
50%
60%
70%
80%
EXPORTS BUDGET REVENUES GDP
SHARE OF OIL & GAS SECTOR (2013)
-10.0%
-5.0%
0.0%
5.0%
10.0%
-5%
0%
5%
10%
15%
20%
25%
2003 2004 2005 2006 2007 2008 2009 2010 2011 2012 2013
SHARE OF MINERALS EXTRACTION IN RUSSIAN REAL GDP GROWTH, % (LHS)
RUSSIA REAL GDP GROWTH, % YOY
21.3 25.8 40.3 44.1 39.6
17.5
29.6
38.9 44.1 49.6
38.8
55.4
79.2 88.2 89.2
0
20
40
60
80
100
2009 2010 2011 2012 2013
EXPORT TO CHINA IMPORT FROM CHINA
$ bln
25.1 21.6 29.8 19.6 62.8
-49.3
231.4
336.3
125.9
449.6
-100
0
100
200
300
400
500
2008 2009 2010 2011 2012
DIRECT INVESTMENTS TO CHINA DIRECT INVESTMENTS FROM CHINA
$ bln
Page 6
RUSSIA > OIL & GAS
JUNE 18, 2014
5
OIL AND GAS PRICES
Oil prices
Alongside its position as the most vital commodity for the world economy, oil also
remains one of the most liquid financial assets and its price is highly sensitive to major
trends on global financial markets.
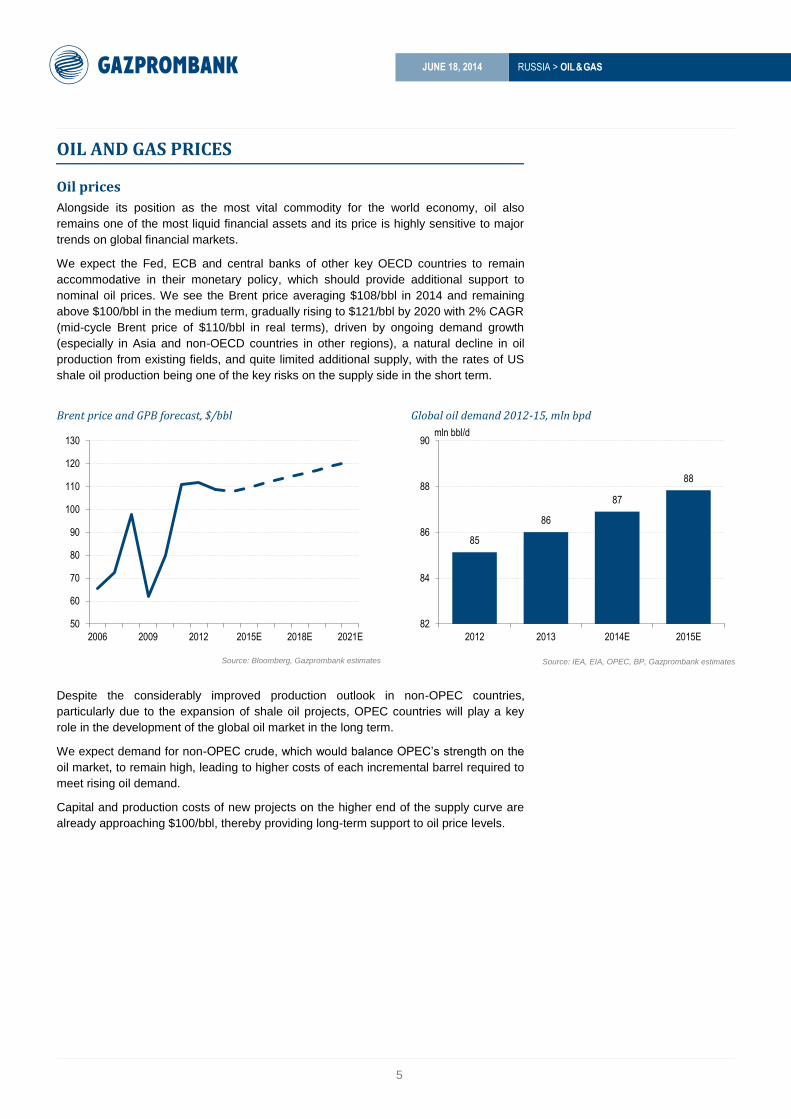
We expect the Fed, ECB and central banks of other key OECD countries to remain
accommodative in their monetary policy, which should provide additional support to
nominal oil prices. We see the Brent price averaging $108/bbl in 2014 and remaining
above $100/bbl in the medium term, gradually rising to $121/bbl by 2020 with 2% CAGR
(mid-cycle Brent price of $110/bbl in real terms), driven by ongoing demand growth
(especially in Asia and non-OECD countries in other regions), a natural decline in oil
production from existing fields, and quite limited additional supply, with the rates of US
shale oil production being one of the key risks on the supply side in the short term.
Brent price and GPB forecast, $/bbl Global oil demand 2012-15, mln bpd
Source: Bloomberg, Gazprombank estimates
Source: IEA, EIA, OPEC, BP, Gazprombank estimates
Despite the considerably improved production outlook in non-OPEC countries,
particularly due to the expansion of shale oil projects, OPEC countries will play a key
role in the development of the global oil market in the long term.
We expect demand for non-OPEC crude, which would balance OPEC’s strength on the
oil market, to remain high, leading to higher costs of each incremental barrel required to
meet rising oil demand.
Capital and production costs of new projects on the higher end of the supply curve are
already approaching $100/bbl, thereby providing long-term support to oil price levels.
50
60
70
80
90
100
110
120
130
2006 2009 2012 2015E 2018E 2021E
85
86
87
88
82
84
86
88
90
2012 2013 2014E 2015E
mln bbl/d
Page 7
RUSSIA > OIL & GAS
JUNE 18, 2014
6
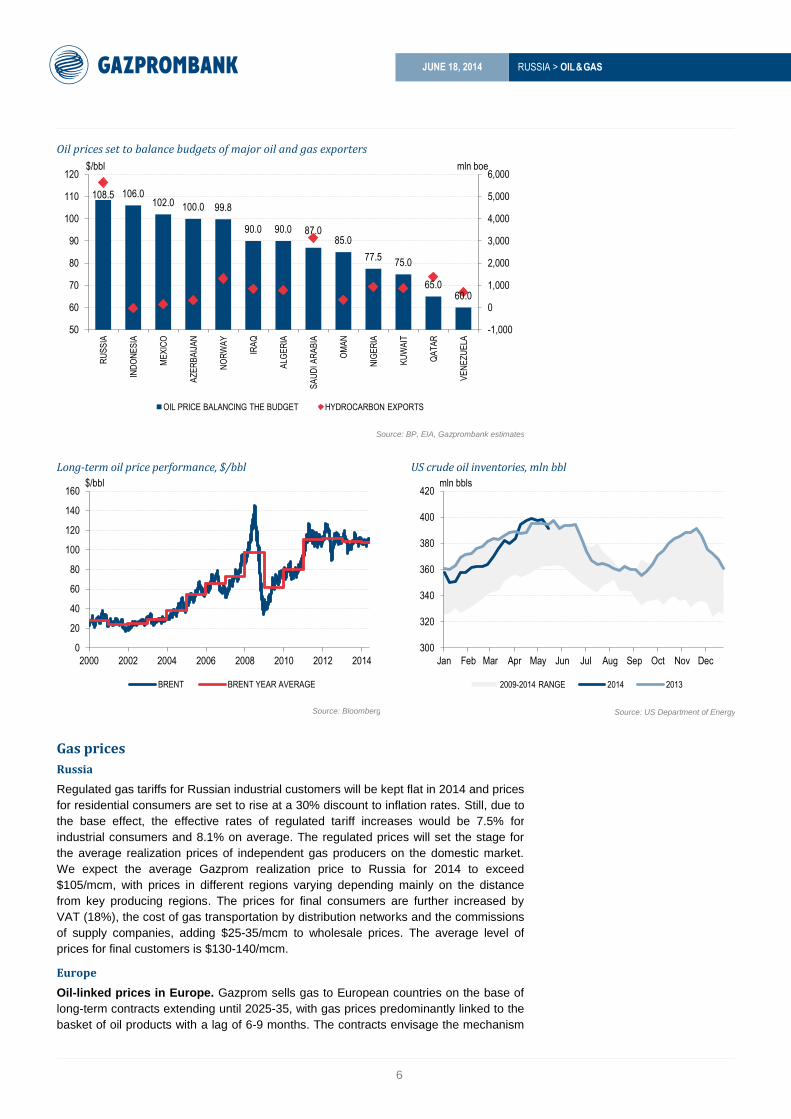
Oil prices set to balance budgets of major oil and gas exporters
Source: BP, EIA, Gazprombank estimates
Long-term oil price performance, $/bbl US crude oil inventories, mln bbl
Source: Bloomberg
Source: US Department of Energy
Gas prices
Russia
Regulated gas tariffs for Russian industrial customers will be kept flat in 2014 and prices
for residential consumers are set to rise at a 30% discount to inflation rates. Still, due to
the base effect, the effective rates of regulated tariff increases would be 7.5% for
industrial consumers and 8.1% on average. The regulated prices will set the stage for
the average realization prices of independent gas producers on the domestic market.
We expect the average Gazprom realization price to Russia for 2014 to exceed
$105/mcm, with prices in different regions varying depending mainly on the distance
from key producing regions. The prices for final consumers are further increased by
VAT (18%), the cost of gas transportation by distribution networks and the commissions
of supply companies, adding $25-35/mcm to wholesale prices. The average level of
prices for final customers is $130-140/mcm.
Europe
Oil-linked prices in Europe. Gazprom sells gas to European countries on the base of
long-term contracts extending until 2025-35, with gas prices predominantly linked to the
basket of oil products with a lag of 6-9 months. The contracts envisage the mechanism
108.5 106.0 102.0 100.0 99.8
90.0 90.0 87.0 85.0
77.5 75.0
65.0 60.0
-1,000
0
1,000
2,000
3,000
4,000
5,000
6,000
50
60
70
80
90
100
110
120
RU
SS
IA
IND
ON
ES
IA
ME
XIC
O
AZ
ER
BA
IJA
N
NO
RW
AY
IRA
Q
ALG
ER
IA
SA
UD
I AR
AB
IA
OM
AN
NIG
ER
IA
KU
WA
IT
QA
TA
R
VE
NE
ZU
ELA
OIL PRICE BALANCING THE BUDGET HYDROCARBON EXPORTS
$/bbl mln boe
0
20
40
60
80
100
120
140
160
2000 2002 2004 2006 2008 2010 2012 2014
BRENT BRENT YEAR AVERAGE
$/bbl
300
320
340
360
380
400
420
Jan Feb Mar Apr May Jun Jul Aug Sep Oct Nov Dec
2009-2014 RANGE 2014 2013
mln bbls
Page 8
RUSSIA > OIL & GAS
JUNE 18, 2014
7
of price renegotiations in case of substantial changes of the situation on the gas market.
Over the past 2-3 years, Gazprom has substantially adjusted the terms of long-term
contracts for the key market of Western Europe, where the level of competition with
LNG is especially strong, introducing up to 15% of spot market indexation in its long-
term contracts. We expect the average Gazprom realization price in Europe in 2014 to
be in the range of $370-380/mcm. We expect gas prices on the markets of East
European countries to show substantial 15-20% premiums to West European markets
due to limited availability of spot gas.
We think that the oil link will retain its leading positions in volume terms in Europe at
least over the next 3-5 years.
Heightened political tension gave rise to various speculations regarding the prospects
for Gazprom’s gas transit to Europe through Ukraine, as well as potential disruption of
the company’s gas export sales to Ukraine.
Transit risk is indeed one of the largest risk factors for Gazprom. Still, we note that the
role of gas exports through Ukraine has diminished substantially following the launch of
Nord Stream at full capacity and currently the share of transit through Ukraine is below
50% of gas exports to Europe vs. over 80% in 2005-06. Moreover, almost half of current
export flow through Ukraine can be redistributed to other routes, leaving ca. 30% in the
risk zone. The impact could be further softened by Gazprom’s underground gas storage
capacity in Europe. The launch of the South Stream pipeline in 2015-16 may completely
eliminate the issue of transit risks for Gazprom.
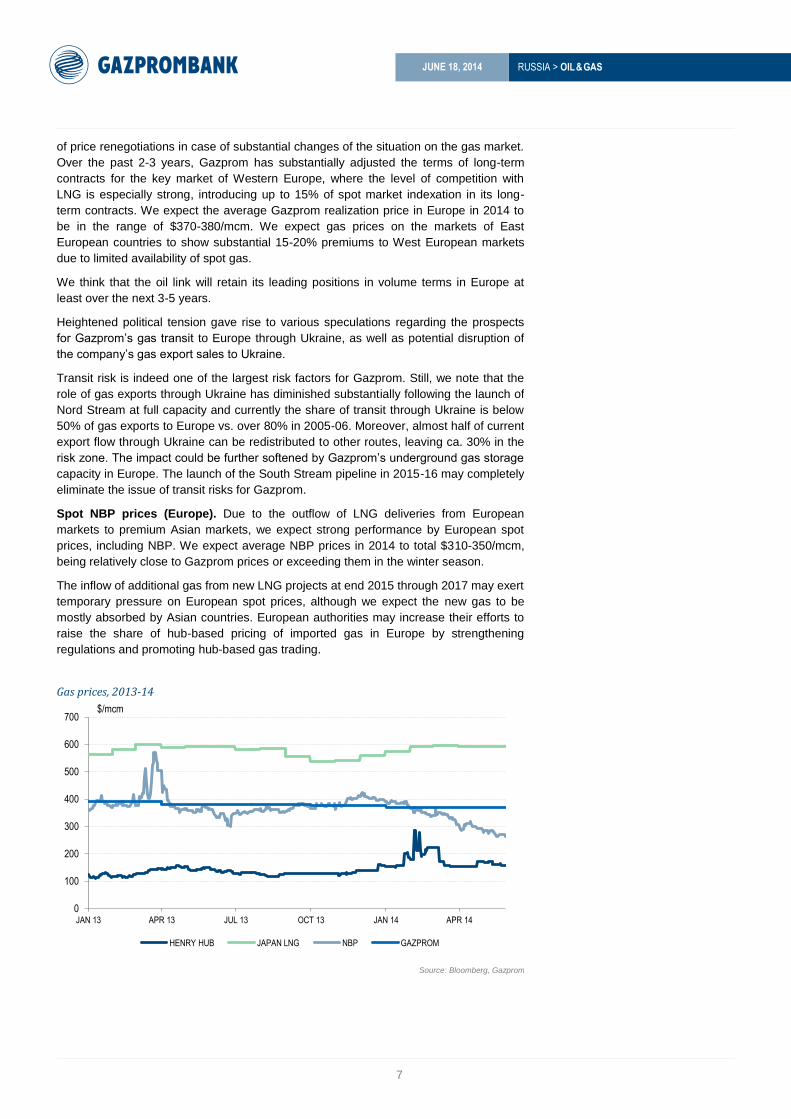
Spot NBP prices (Europe). Due to the outflow of LNG deliveries from European
markets to premium Asian markets, we expect strong performance by European spot
prices, including NBP. We expect average NBP prices in 2014 to total $310-350/mcm,
being relatively close to Gazprom prices or exceeding them in the winter season.
The inflow of additional gas from new LNG projects at end 2015 through 2017 may exert
temporary pressure on European spot prices, although we expect the new gas to be
mostly absorbed by Asian countries. European authorities may increase their efforts to
raise the share of hub-based pricing of imported gas in Europe by strengthening
regulations and promoting hub-based gas trading.
Gas prices, 2013-14
Source: Bloomberg, Gazprom
0
100
200
300
400
500
600
700
JAN 13 APR 13 JUL 13 OCT 13 JAN 14 APR 14
HENRY HUB JAPAN LNG NBP GAZPROM
$/mcm
Page 9
RUSSIA > OIL & GAS
JUNE 18, 2014
8
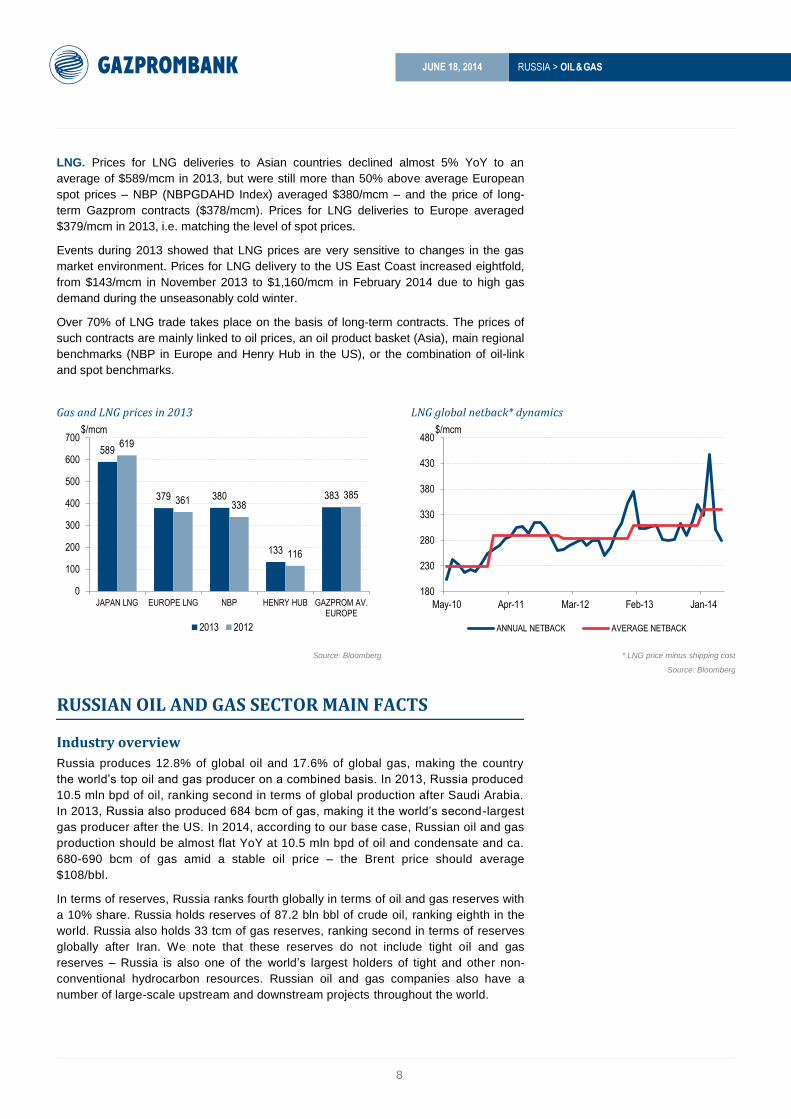
LNG. Prices for LNG deliveries to Asian countries declined almost 5% YoY to an
average of $589/mcm in 2013, but were still more than 50% above average European
spot prices – NBP (NBPGDAHD Index) averaged $380/mcm – and the price of long-
term Gazprom contracts ($378/mcm). Prices for LNG deliveries to Europe averaged
$379/mcm in 2013, i.e. matching the level of spot prices.
Events during 2013 showed that LNG prices are very sensitive to changes in the gas
market environment. Prices for LNG delivery to the US East Coast increased eightfold,
from $143/mcm in November 2013 to $1,160/mcm in February 2014 due to high gas
demand during the unseasonably cold winter.
Over 70% of LNG trade takes place on the basis of long-term contracts. The prices of
such contracts are mainly linked to oil prices, an oil product basket (Asia), main regional
benchmarks (NBP in Europe and Henry Hub in the US), or the combination of oil-link
and spot benchmarks.
Gas and LNG prices in 2013 LNG global netback* dynamics
Source: Bloomberg * LNG price minus shipping cost
Source: Bloomberg
RUSSIAN OIL AND GAS SECTOR MAIN FACTS
Industry overview
Russia produces 12.8% of global oil and 17.6% of global gas, making the country
the world’s top oil and gas producer on a combined basis. In 2013, Russia produced
10.5 mln bpd of oil, ranking second in terms of global production after Saudi Arabia.
In 2013, Russia also produced 684 bcm of gas, making it the world’s second-largest
gas producer after the US. In 2014, according to our base case, Russian oil and gas
production should be almost flat YoY at 10.5 mln bpd of oil and condensate and ca.
680-690 bcm of gas amid a stable oil price – the Brent price should average
$108/bbl.
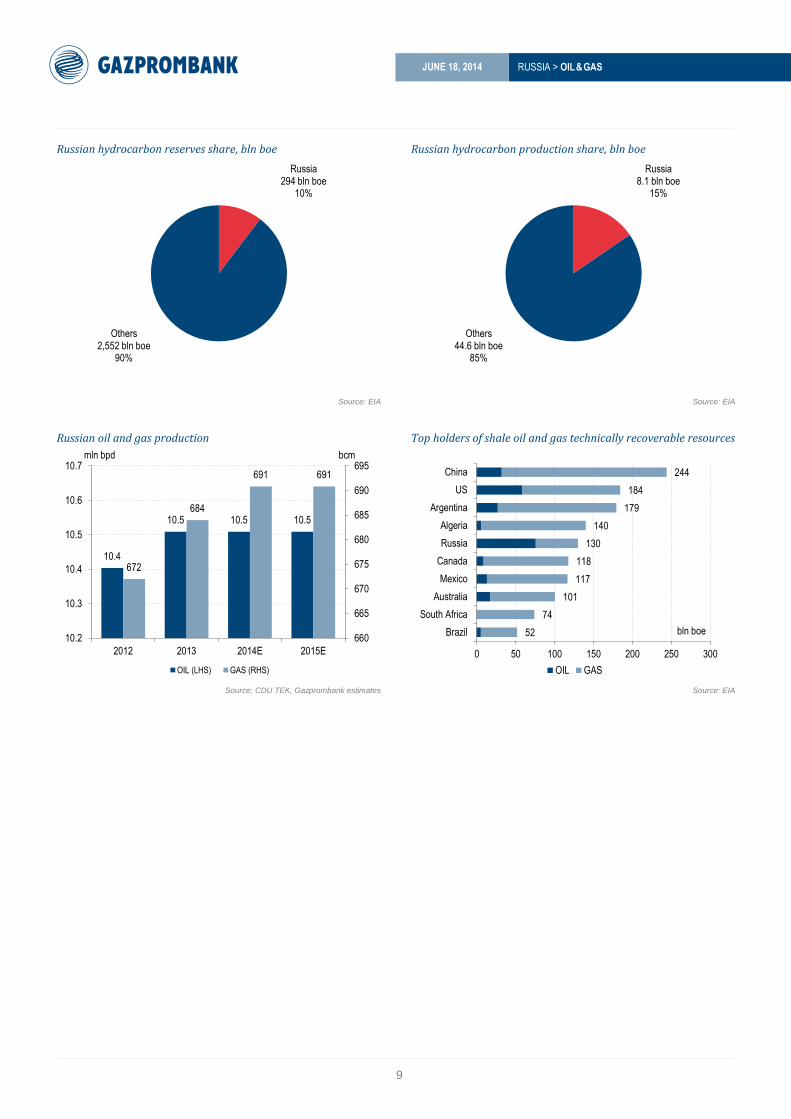
In terms of reserves, Russia ranks fourth globally in terms of oil and gas reserves with
a 10% share. Russia holds reserves of 87.2 bln bbl of crude oil, ranking eighth in the
world. Russia also holds 33 tcm of gas reserves, ranking second in terms of reserves
globally after Iran. We note that these reserves do not include tight oil and gas
reserves – Russia is also one of the world’s largest holders of tight and other non-
conventional hydrocarbon resources. Russian oil and gas companies also have a
number of large-scale upstream and downstream projects throughout the world.
589
379 380
133
383
619
361 338
116
385
0
100
200
300
400
500
600
700
JAPAN LNG EUROPE LNG NBP HENRY HUB GAZPROM AV. EUROPE
2013 2012
$/mcm
180
230
280
330
380
430
480
May-10 Apr-11 Mar-12 Feb-13 Jan-14
ANNUAL NETBACK AVERAGE NETBACK
$/mcm
Page 10
RUSSIA > OIL & GAS
JUNE 18, 2014
9
Russian hydrocarbon reserves share, bln boe Russian hydrocarbon production share, bln boe
Source: EIA Source: EIA
Russian oil and gas production Top holders of shale oil and gas technically recoverable resources
Source: CDU TEK, Gazprombank estimates Source: EIA
Russia 294 bln boe
10%
Others 2,552 bln boe
90%
Russia 8.1 bln boe
15%
Others 44.6 bln boe
85%
10.4
10.5 10.5 10.5
672
684
691 691
660
665
670
675
680
685
690
695
10.2
10.3
10.4
10.5
10.6
10.7
2012 2013 2014E 2015E
OIL (LHS) GAS (RHS)
mln bpd bcm
52
74
101
117
118
130
140
179
184
244
0 50 100 150 200 250 300
Brazil
South Africa
Australia
Mexico
Canada
Russia
Algeria
Argentina
US
China
OIL GAS
bln boe
Page 11
RUSSIA > OIL & GAS
JUNE 18, 2014
10
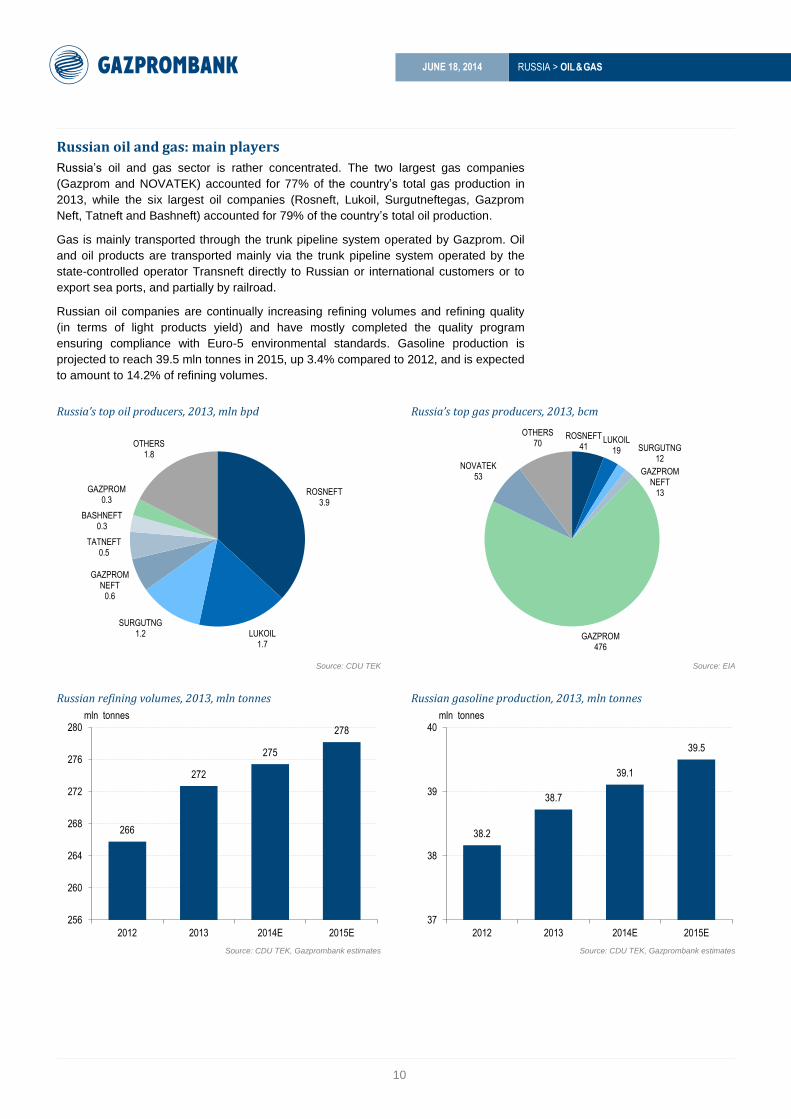
Russian oil and gas: main players
Russia’s oil and gas sector is rather concentrated. The two largest gas companies
(Gazprom and NOVATEK) accounted for 77% of the country’s total gas production in
2013, while the six largest oil companies (Rosneft, Lukoil, Surgutneftegas, Gazprom
Neft, Tatneft and Bashneft) accounted for 79% of the country’s total oil production.
Gas is mainly transported through the trunk pipeline system operated by Gazprom. Oil
and oil products are transported mainly via the trunk pipeline system operated by the
state-controlled operator Transneft directly to Russian or international customers or to
export sea ports, and partially by railroad.
Russian oil companies are continually increasing refining volumes and refining quality
(in terms of light products yield) and have mostly completed the quality program
ensuring compliance with Euro-5 environmental standards. Gasoline production is
projected to reach 39.5 mln tonnes in 2015, up 3.4% compared to 2012, and is expected
to amount to 14.2% of refining volumes.
Russia’s top oil producers, 2013, mln bpd Russia’s top gas producers, 2013, bcm
Source: CDU TEK Source: EIA
Russian refining volumes, 2013, mln tonnes Russian gasoline production, 2013, mln tonnes
Source: CDU TEK, Gazprombank estimates Source: CDU TEK, Gazprombank estimates
ROSNEFT 3.9
LUKOIL 1.7
SURGUTNG 1.2
GAZPROM NEFT
0.6
TATNEFT 0.5
BASHNEFT 0.3
GAZPROM 0.3
OTHERS 1.8
ROSNEFT 41
LUKOIL 19 SURGUTNG
12
GAZPROM NEFT
13
GAZPROM 476
NOVATEK 53
OTHERS 70
266
272
275
278
256
260
264
268
272
276
280
2012 2013 2014E 2015E
mln tonnes
38.2
38.7
39.1
39.5
37
38
39
40
2012 2013 2014E 2015E
mln tonnes
Page 12
RUSSIA > OIL & GAS
JUNE 18, 2014
11
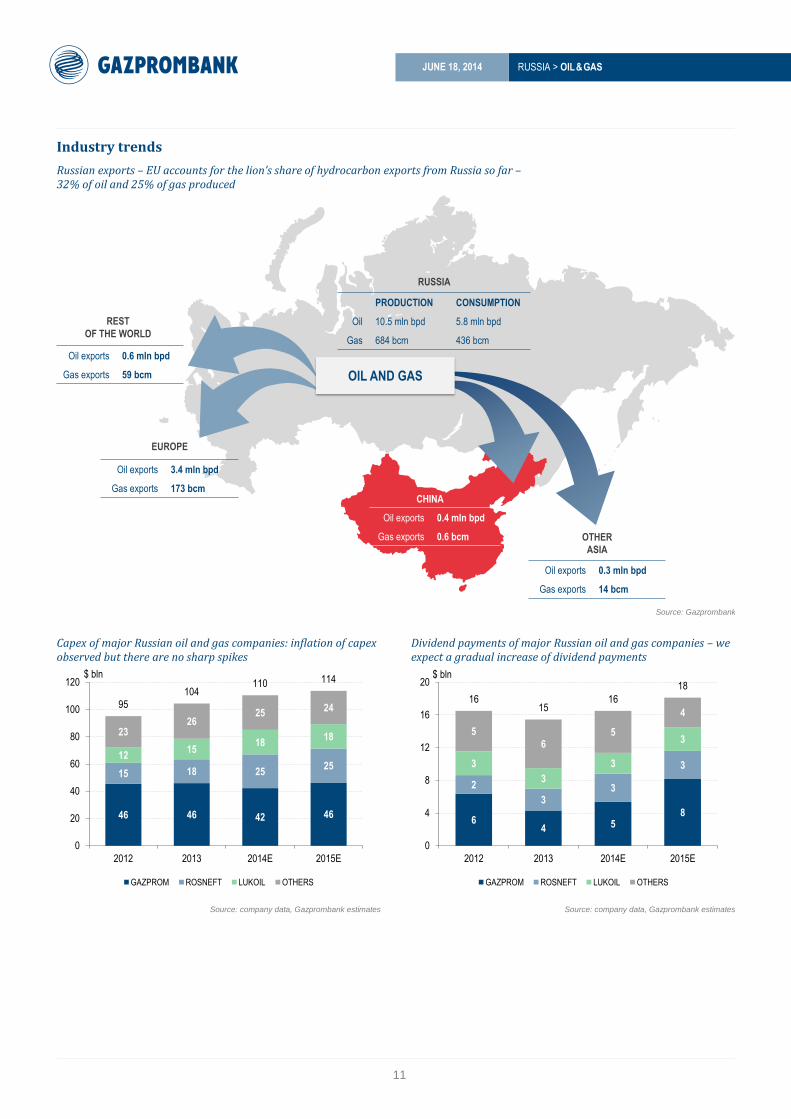
Industry trends
Russian exports – EU accounts for the lion’s share of hydrocarbon exports from Russia so far – 32% of oil and 25% of gas produced
Source: Gazprombank
Capex of major Russian oil and gas companies: inflation of capex observed but there are no sharp spikes
Dividend payments of major Russian oil and gas companies – we expect a gradual increase of dividend payments
Source: company data, Gazprombank estimates Source: company data, Gazprombank estimates
CHINA
EUROPE
REST
OF THE WORLD
Oil exports 0.6 mln bpd
Gas exports 59 bcm
Oil exports 3.4 mln bpd
Gas exports 173 bcm
Oil exports 0.4 mln bpd
Gas exports 0.6 bcm OTHER
ASIA
Oil exports 0.3 mln bpd
Gas exports 14 bcm
OIL AND GAS
RUSSIA
PRODUCTION CONSUMPTION
Oil 10.5 mln bpd 5.8 mln bpd
Gas 684 bcm 436 bcm
46 46 42 46
15 18 25 25
12 15
18 18 23
26 25 24 95
104 110 114
0
20
40
60
80
100
120
2012 2013 2014E 2015E
GAZPROM ROSNEFT LUKOIL OTHERS
$ bln
6 4 5
8
2
3 3
3 3
3
3
3 5
6 5
4
16 15
16
18
0
4
8
12
16
20
2012 2013 2014E 2015E
GAZPROM ROSNEFT LUKOIL OTHERS
$ bln
Page 13
RUSSIA > OIL & GAS
JUNE 18, 2014
12
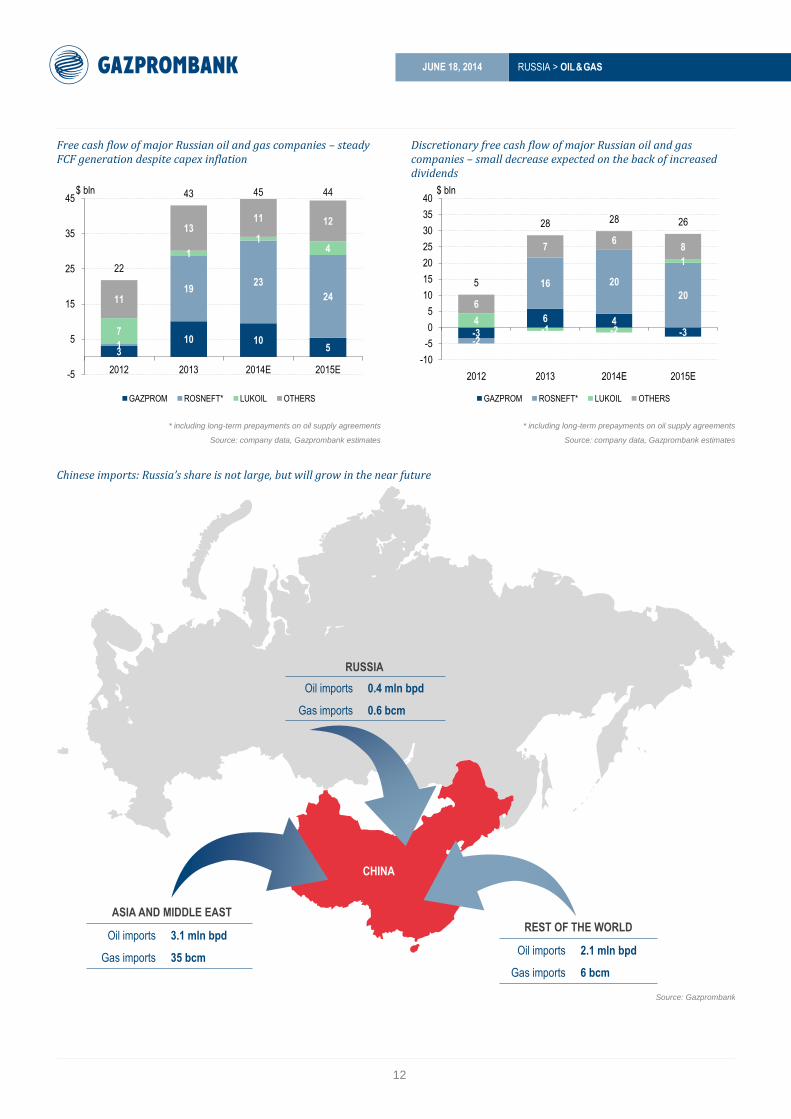
Free cash flow of major Russian oil and gas companies – steady FCF generation despite capex inflation
Discretionary free cash flow of major Russian oil and gas companies – small decrease expected on the back of increased dividends
* including long-term prepayments on oil supply agreements
Source: company data, Gazprombank estimates
* including long-term prepayments on oil supply agreements
Source: company data, Gazprombank estimates
Chinese imports: Russia’s share is not large, but will grow in the near future
Source: Gazprombank
3 10 10
5 1
19 23
24
7
1
1 4
11
13 11 12
22
43 45 44
-5
5
15
25
35
45
2012 2013 2014E 2015E
GAZPROM ROSNEFT* LUKOIL OTHERS
$ bln
-3
6 4 -3
-2
16 20
20
4 -1 -2
1
6
7 6
8
5
28 28 26
-10
-5
0
5
10
15
20
25
30
35
40
2012 2013 2014E 2015E
GAZPROM ROSNEFT* LUKOIL OTHERS
$ bln
CHINA
RUSSIA
Oil imports 0.4 mln bpd
Gas imports 0.6 bcm
REST OF THE WORLD
Oil imports 2.1 mln bpd
Gas imports 6 bcm
ASIA AND MIDDLE EAST
Oil imports 3.1 mln bpd
Gas imports 35 bcm
Page 14
RUSSIA > OIL & GAS
JUNE 18, 2014
13
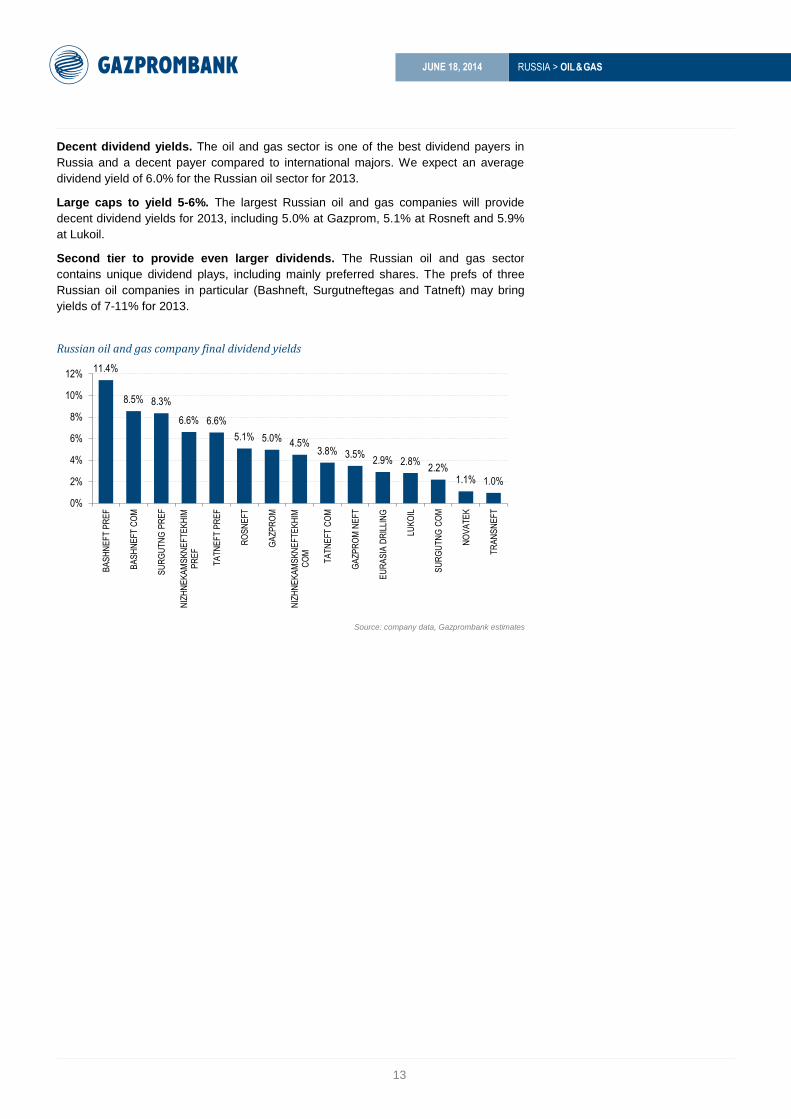
Decent dividend yields. The oil and gas sector is one of the best dividend payers in
Russia and a decent payer compared to international majors. We expect an average
dividend yield of 6.0% for the Russian oil sector for 2013.
Large caps to yield 5-6%. The largest Russian oil and gas companies will provide
decent dividend yields for 2013, including 5.0% at Gazprom, 5.1% at Rosneft and 5.9%
at Lukoil.
Second tier to provide even larger dividends. The Russian oil and gas sector
contains unique dividend plays, including mainly preferred shares. The prefs of three
Russian oil companies in particular (Bashneft, Surgutneftegas and Tatneft) may bring
yields of 7-11% for 2013.
Russian oil and gas company final dividend yields
Source: company data, Gazprombank estimates
11.4%
8.5% 8.3%
6.6% 6.6%
5.1% 5.0% 4.5% 3.8% 3.5%
2.9% 2.8% 2.2%
1.1% 1.0%
0%
2%
4%
6%
8%
10%
12%
BA
SH
NE
FT
PR
EF
BA
SH
NE
FT
CO
M
SU
RG
UT
NG
PR
EF
NIZ
HN
EK
AM
SK
NE
FT
EK
HIM
P
RE
F
TA
TN
EF
T P
RE
F
RO
SN
EF
T
GA
ZP
RO
M
NIZ
HN
EK
AM
SK
NE
FT
EK
HIM
C
OM
TA
TN
EF
T C
OM
GA
ZP
RO
M N
EF
T
EU
RA
SIA
DR
ILLI
NG
LUK
OIL
SU
RG
UT
NG
CO
M
NO
VA
TE
K
TR
AN
SN
EF
T
Page 15
RUSSIA > OIL & GAS
JUNE 18, 2014
14
Regulations
As we mentioned above, Russian oil and gas plays a crucial role for Russia’s economy
and budget income. That said, the lion’s share of revenues of Russian oil companies is
subject to taxation.
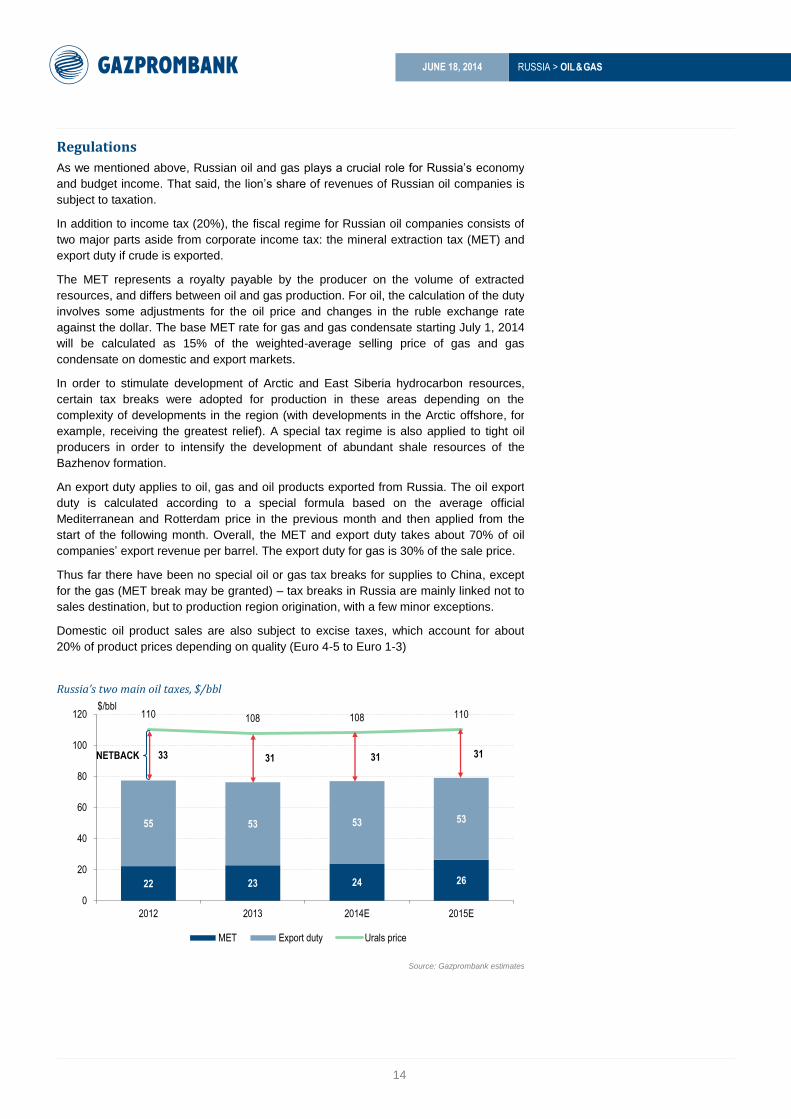
In addition to income tax (20%), the fiscal regime for Russian oil companies consists of
two major parts aside from corporate income tax: the mineral extraction tax (MET) and
export duty if crude is exported.
The MET represents a royalty payable by the producer on the volume of extracted
resources, and differs between oil and gas production. For oil, the calculation of the duty
involves some adjustments for the oil price and changes in the ruble exchange rate
against the dollar. The base MET rate for gas and gas condensate starting July 1, 2014
will be calculated as 15% of the weighted-average selling price of gas and gas
condensate on domestic and export markets.
In order to stimulate development of Arctic and East Siberia hydrocarbon resources,
certain tax breaks were adopted for production in these areas depending on the
complexity of developments in the region (with developments in the Arctic offshore, for
example, receiving the greatest relief). A special tax regime is also applied to tight oil
producers in order to intensify the development of abundant shale resources of the
Bazhenov formation.
An export duty applies to oil, gas and oil products exported from Russia. The oil export
duty is calculated according to a special formula based on the average official
Mediterranean and Rotterdam price in the previous month and then applied from the
start of the following month. Overall, the MET and export duty takes about 70% of oil
companies’ export revenue per barrel. The export duty for gas is 30% of the sale price.
Thus far there have been no special oil or gas tax breaks for supplies to China, except
for the gas (MET break may be granted) – tax breaks in Russia are mainly linked not to
sales destination, but to production region origination, with a few minor exceptions.
Domestic oil product sales are also subject to excise taxes, which account for about
20% of product prices depending on quality (Euro 4-5 to Euro 1-3)
Russia’s two main oil taxes, $/bbl
Source: Gazprombank estimates
22 23 24 26
55 53 53 53
33 31 31 31
110 108 108 110
0
20
40
60
80
100
120
2012 2013 2014E 2015E
MET Export duty Urals price
$/bbl
NETBACK
Page 16
RUSSIA > OIL & GAS
JUNE 18, 2014
15
There are no official regulatory restrictions or pricing regulations on oil and oil product
exports and pricing, both externally and domestic. In gas, the export of natural gas is a
monopoly right for Gazprom (excluding LNG), while domestic gas prices for Gazprom
are regulated both for industrial and residential users. Although gas prices are not
regulated for other Russian gas producers, the regulated gas price is a benchmark, so
the actual prices do not differ much from regulated prices.
However, independent gas producers provide certain discounts on their gas sales to
industrial customers on the domestic market, which is actively used in competition with
Gazprom.
Unconventional oil and gas
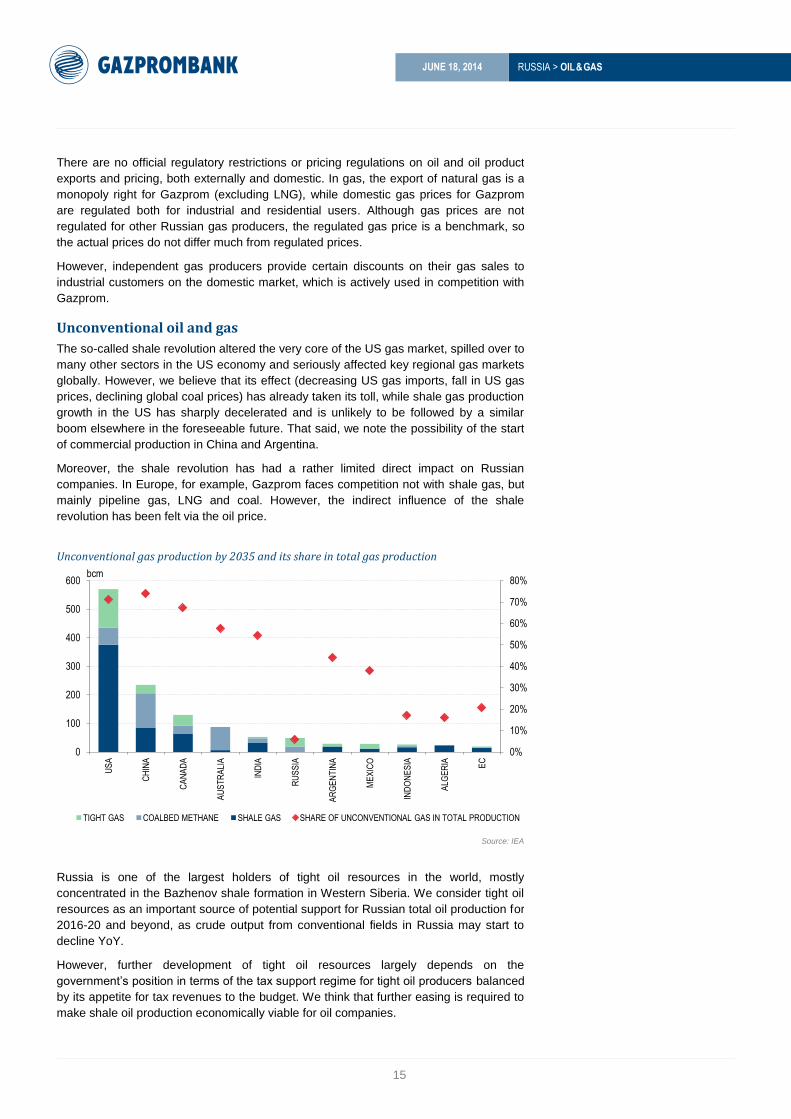
The so-called shale revolution altered the very core of the US gas market, spilled over to
many other sectors in the US economy and seriously affected key regional gas markets
globally. However, we believe that its effect (decreasing US gas imports, fall in US gas
prices, declining global coal prices) has already taken its toll, while shale gas production
growth in the US has sharply decelerated and is unlikely to be followed by a similar
boom elsewhere in the foreseeable future. That said, we note the possibility of the start
of commercial production in China and Argentina.
Moreover, the shale revolution has had a rather limited direct impact on Russian
companies. In Europe, for example, Gazprom faces competition not with shale gas, but
mainly pipeline gas, LNG and coal. However, the indirect influence of the shale
revolution has been felt via the oil price.
Unconventional gas production by 2035 and its share in total gas production
Source: IEA
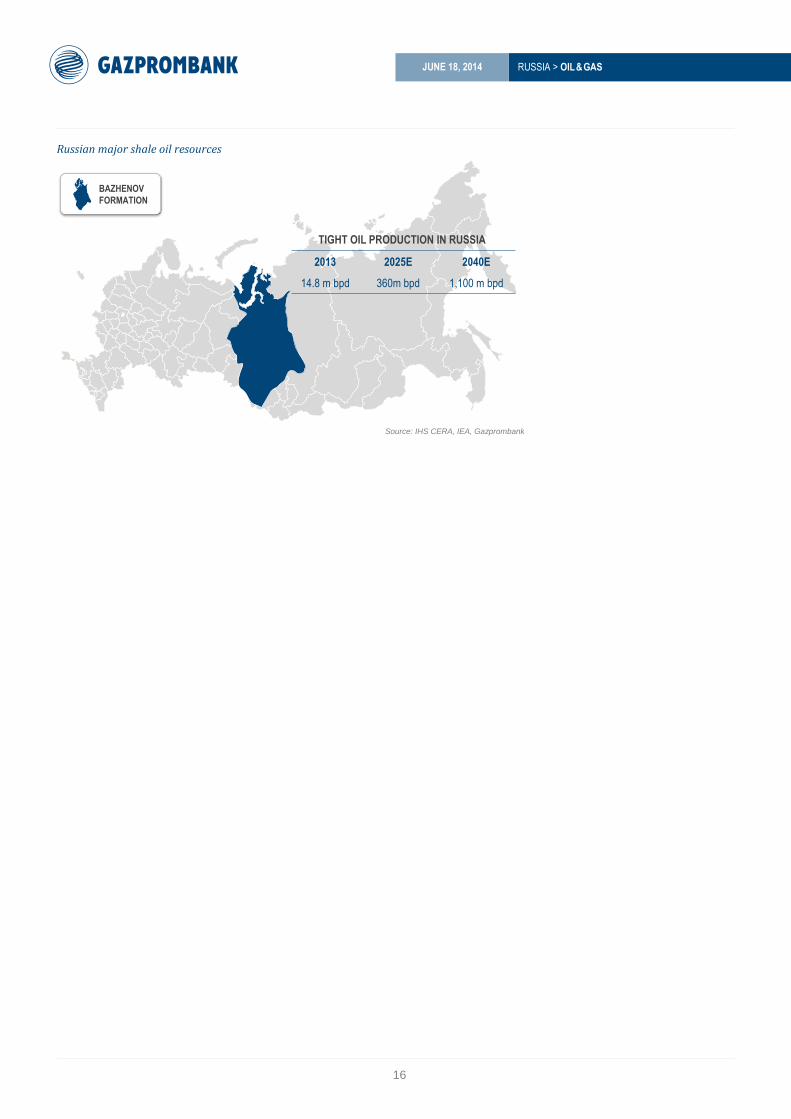
Russia is one of the largest holders of tight oil resources in the world, mostly
concentrated in the Bazhenov shale formation in Western Siberia. We consider tight oil
resources as an important source of potential support for Russian total oil production for
2016-20 and beyond, as crude output from conventional fields in Russia may start to
decline YoY.
However, further development of tight oil resources largely depends on the
government’s position in terms of the tax support regime for tight oil producers balanced
by its appetite for tax revenues to the budget. We think that further easing is required to
make shale oil production economically viable for oil companies.
0%
10%
20%
30%
40%
50%
60%
70%
80%
0
100
200
300
400
500
600
US
A
CH
INA
CA
NA
DA
AU
ST
RA
LIA
IND
IA
RU
SS
IA
AR
GE
NT
INA
ME
XIC
O
IND
ON
ES
IA
ALG
ER
IA
EC
TIGHT GAS COALBED METHANE SHALE GAS SHARE OF UNCONVENTIONAL GAS IN TOTAL PRODUCTION
bcm
Page 17
RUSSIA > OIL & GAS
JUNE 18, 2014
16
Russian major shale oil resources
Source: IHS CERA, IEA, Gazprombank
BAZHENOV
FORMATION
TIGHT OIL PRODUCTION IN RUSSIA
2013 2025E 2040E
14.8 m bpd 360m bpd 1,100 m bpd
Page 18
RUSSIA > OIL & GAS
JUNE 18, 2014
17
COOPERATION WITH CHINA
Starting from 2009, Russian oil majors have increasingly looked at Asia as a strategic
market and consider it the most important vector for diversification. The launch of the
ESPO pipeline and Rosneft’s large-scale long-term crude export contracts to China made
the expansion of Russian oils to Asia a reality and laid the foundation for a further
substantial increase of hydrocarbon exports to the region as well as broader cooperation
in the energy sphere.
Asia-Pacific and China: the most promising oil markets
Asian markets are expected to remain the key centers for long-term oil demand growth in
the world. Oil demand in the Asia-Pacific region is expected to grow at double the average
rate of world oil consumption. According to IEA forecasts, China will likely account for 60%
of total oil demand growth in Asia to 2030. Thus, the Chinese market is currently one of
the most attractive options for diversification of exports of Russian oil and gas.
Currently most of China’s oil imports come from the Middle East (over 50%). Alongside
China’s further deregulation of its oil and gas market, this could create further
opportunities for other exporters.
Most Russian oil and gas companies consider Asia and specifically China as a strategic
export market, and are designing and undertaking large-scale projects aimed at export
diversification to Asia.
The long-term trend of export diversification to Asia is organically matched by the
rising share of oil production in East Siberia and intensive oil demand growth in
Asia (specifically China).
Russian crude supplies to Asia may reach 65 mln tonnes by 2020 and up to 80 mln
tonnes by 2035, with a proportional reduction of exports to Western markets.
Substantial capex needs arising from the development of Eastern projects may be
partially counterbalanced by fiscal stimulus provided by the government as well as
potential funding from Asian partners. Russian oil and gas majors primarily have
healthy borrowing capacity and apply the same profitability criteria to the Eastern
projects as to the rest of the upstream project portfolio.
Given its vast resource base in East Siberia and the Far East of Russia as well as
long-term crude export agreements with Chinese companies, Rosneft is the clear
leader in this process. Gazprom becomes the key player in the gas area with the
conclusion of a gas export contract with China. Among other Russian oil and gas
companies, Surgutneftegas, Lukoil, SIBUR, Gazprom Neft and NOVATEK will also
play a significant role in exports to Asian markets.
Developments over the past several weeks may improve the ties of Russian oil
companies to Asian partners, including an increase in the number and volume of
joint projects, and accelerated realization of key projects of Russian oil and gas
companies aimed at Asian markets.
Diversification of crude exports to Asian markets gives Russian oil companies a long-
term fundamental base to increase their value through the development of greenfields in
Eastern Siberia and the Far East, and to secure access to new export markets.
Rosneft: the most Asia-oriented Russian oil major
Rosneft is the most Asia-oriented Russian oil major and has the largest portfolio of joint
projects with Chinese NOCs. Large-scale agreements with CNPC and Sinopec clearly
show Rosneft’s commitment to rebalance the company’s export structure and increase
the role of Asian markets in its global strategy.
Page 19
RUSSIA > OIL & GAS
JUNE 18, 2014
18
Oil supply. Rosneft is the leader among Russian oil companies by volume of crude
exports to China. In 2013, Rosneft exported 15 mln tonnes to China (0.3 mln bpd) and
another 8.6 mln tonnes to Asian markets through Kozmino seaport. We expect
Rosneft’s oil exports to Asian markets to ramp up quickly; in 2014 the company may
send 21-22 mln tonnes of oil to China by pipeline and increase the total amount of
exports to Asia to more than 30 mln tonnes (over 34% of its non-CIS exports).
The total volume of Rosneft’s crude oil deliveries to China (including direct deliveries by
ESPO and Kozmino, exports through Kazakhstan and additional deliveries to Tanjin
refinery starting from 2020) may rise to 60 mln tonnes (1.2 mln bpd) by 2020, and the
share of exports to Asia in Rosneft’s revenues may total up to 25%.
Gazprom Eastern gas program
In Eastern Russia, Gazprom owns an abundant resource base that is set to be used for
gasification of Eastern Siberia and the Far East as well as potential gas deliveries to
foreign markets, primarily in Asia.
Gas deliveries to China. In May 2014, Gazprom signed a $400 bln contract with CNPC
for annual delivery of 38 bcm of gas to China. The contract became the ever-largest
contract between Russia and China, organically complementing a previously signed
long-term oil delivery contract between Rosneft and CNPC. As a result of the contract,
Gazprom may take ca. 15% of the Chinese gas market by 2020 and increase the
volume of its non-CIS gas exports by almost 25%.
The implied price of the contract is ca. $360-380/mcm, on our calculations. The
agreement envisages the prepayment of $25 bln. Russia also offered to cancel the gas
MET for gas fields participating in the project, while the Chinese party agreed to reduce
the taxation of gas imported from Russia.
Key elements of the project will include the Power of Siberia pipeline, development of
the Chayanda and Kovykta gas fields, and construction of gas refining and helium
plants. There is also a probability of some participation by independent gas producers in
the project during one of its stages. According to Gazprom, the total volume of
investments in the project on Russian territory will exceed $55 bln. We expect
Gazprom’s capex to increase from $44 bln in 2013 to $46-50 bln per year in 2015-19.
Gazprom has also announced plans to renew negotiations in the near future on further
increase of gas exports to China using the Western route.
Lukoil
With the launch of West Qurna-2 in 2014, Lukoil aims to become an important player on
the Chinese oil market. The company is already delivering around 300 kt of oil via ESPO
to China and Southeast Asia per month.
At end March 2014, Lukoil launched its largest upstream project – the West Qurna-2
field in Iraq – and produced 120 kbpd at the field, while the end 2014 target stands at
400 kbpd and is set to reach peak production of around 1.2 mln bpd in 2017. Lukoil
considers Asian countries and China as key markets for its share in the project’s
production (up to 200 kbpd) and we do not exclude that the lion’s share of the Iraqi part
of the field’s output will also go directly to Asian markets.
Gazprom Neft
Gazprom Neft holds licenses for the development of several greenfields in Eastern Siberia,
including the Kuyumbinskoye and Chonskiy fields, which are expected to be launched by
2016-17. Gazprom Neft’s production from these fields may reach 9.5 mln tpa by 2020, which
will most likely be delivered to Asian markets, including China, via the ESPO pipeline.
Another potential oil field whose resources may be used for export to Asian markets is
Messoyakha located in northeast Siberia. Proved 2P reserves are 48.3 mln tonnes with
peak production of 3.5 mln tpa by 2026. Gazprom Neft is currently in the stage of
constructing infrastructure at the field.
Page 20
RUSSIA > OIL & GAS
JUNE 18, 2014
19
CORPORATE PROFILES
Gazprom
Gazprom is the largest public natural gas and hydrocarbons producer in the world.
The company holds 123 bln boe of proved reserves and produces 9.5 mln bpd,
accounting for 70% of Russian and 15% of world gas production. Gas has the
dominant share in Gazprom’s reserves and production, with 91% and 87% shares,
respectively. Gazprom’s key producing assets are located in Yamalo-Nenets
Autonomous District in the North of West Siberia. The high quality of Gazprom’s
upstream assets makes it the best company among global oil and gas majors by lifting
costs and upstream capex per barrel.
Gazprom has an exclusive right to export Russian gas via its pipeline, and owns and
operates the world’s largest trunk gas pipeline network that connects its fields with Russian
and European markets, accounting for 57% of gas revenues and 32% of total revenues.
Gazprom has a well-developed oil and condensate business and is the largest electricity
producer in Russia. Liquids production accounts for 30% of Gazprom’s revenues.
Gazprom’s oil subsidiary, Gazprom Neft, is the fourth-largest oil company in Russia.
Company-specific drivers
Positive export outlook, gas exports to Europe (57% of gas revenues, 32% of
total revenues) to stay close to the record levels of 2013, gas prices to remain
broadly flat, declining 2.5% YoY in Europe in 2014.
Dividend growth. A switch to 25% IFRS dividends payouts is possible in 2015-16
and could lead to an increase in dividend distribution. Gazprom’s DPS may reach
$0.34 in 2015-16E, up more than 60% from the current level.
Long-term gas supply contract with China for 38 bcm p.a., or almost 25% of 2013
exports to Europe, including a $25 bln prepayment, providing market diversification and
boosting non-CIS gas exports by almost 25% starting from 2019.
Switch to gas MET formula on July 1 adds long-term predictability to gas taxation
and links the tax burden to average realized prices vs. fixed tax rates used previously.
Strong credit profile with one of the lowest degrees of leverage among
EM/CIS/Asian peers and significant borrowing headroom under internal
indebtedness and rating agencies limits (min. $48 bln as of end 2013).
Company-specific risks
Capex risk. Simultaneous implementation of several large-scale projects – Yamal
peninsula development, gas pipelines to Europe (Bovanenkovo-Ukhta, South
Stream, Southern corridor) and the Eastern gas program – may drive Group capex to
over $45-50 bln in 2015-17, pressuring FCF and requiring additional borrowings.
Funding needs, however, could partially be covered by long-term prepayments
totaling $25 bln agreed under the gas delivery contract to China.
Regulation. Risk of sanctions, lifting of re-export limitations, leveling of realization
prices in European countries, change in regulatory treatment of key pipeline projects.
Taxation changes. Risks of cancellation of part of export duty tax breaks (up to
3-4% of EBITDA), risk of further potential revision of gas MET formula
parameters over the next 2-3 years.
Transit risk. Gazprom transports through Ukraine ca. 50% of its gas exports to
Europe. Further non-payment for gas by Ukraine and intensification of discussion
of gas supply and transit issues may lead to a temporary interruption of transit.
Gazprom may reduce the share of Ukrainian transit to ca. 35% of European
exports. The launch of South Stream may almost fully eliminate this risk by 2016.
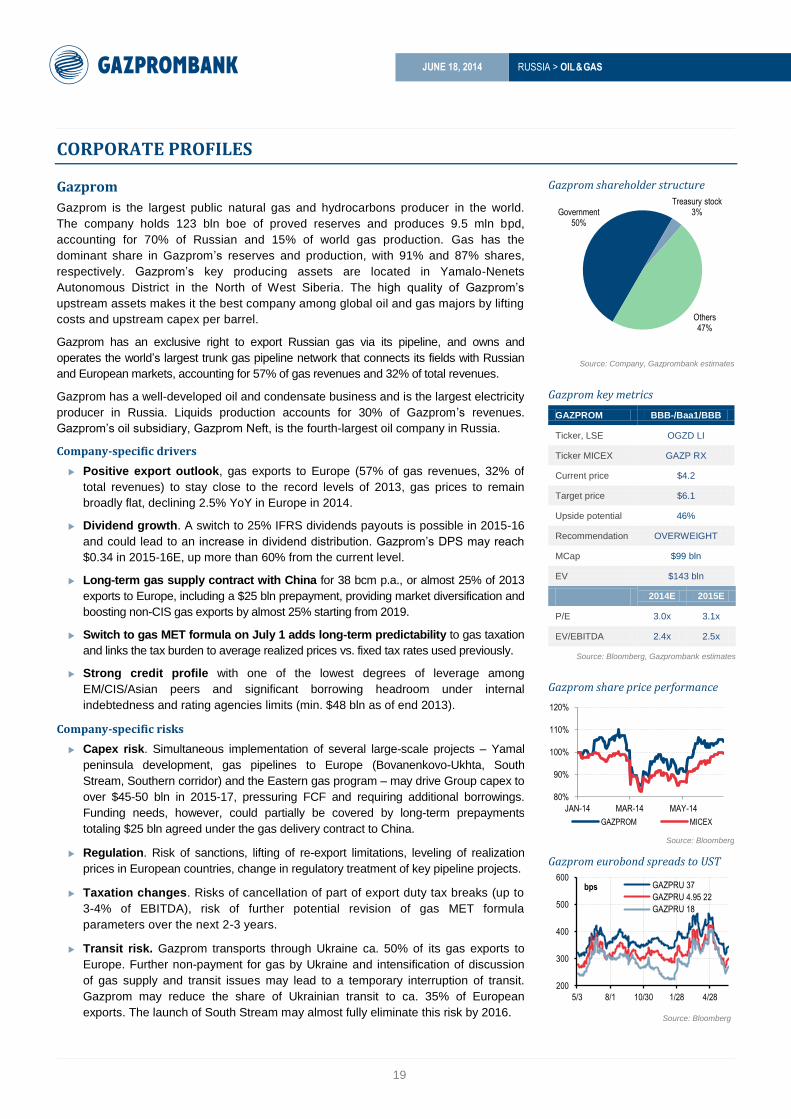
Gazprom shareholder structure
Source: Company, Gazprombank estimates
Gazprom key metrics
GAZPROM BBB-/Baa1/BBB
Ticker, LSE OGZD LI
Ticker MICEX GAZP RX
Current price $4.2
Target price $6.1
Upside potential 46%
Recommendation OVERWEIGHT
MCap $99 bln
EV $143 bln
2014E 2015E
P/E 3.0x 3.1x
EV/EBITDA 2.4x 2.5x
Source: Bloomberg, Gazprombank estimates
Gazprom share price performance
Source: Bloomberg
Gazprom eurobond spreads to UST
Source: Bloomberg
Others 47%
Government 50%
Treasury stock 3%
80%
90%
100%
110%
120%
JAN-14 MAR-14 MAY-14
GAZPROM MICEX
200
300
400
500
600
5/3 8/1 10/30 1/28 4/28
bps GAZPRU 37
GAZPRU 4.95 22
GAZPRU 18
Page 21
RUSSIA > OIL & GAS
JUNE 18, 2014
20
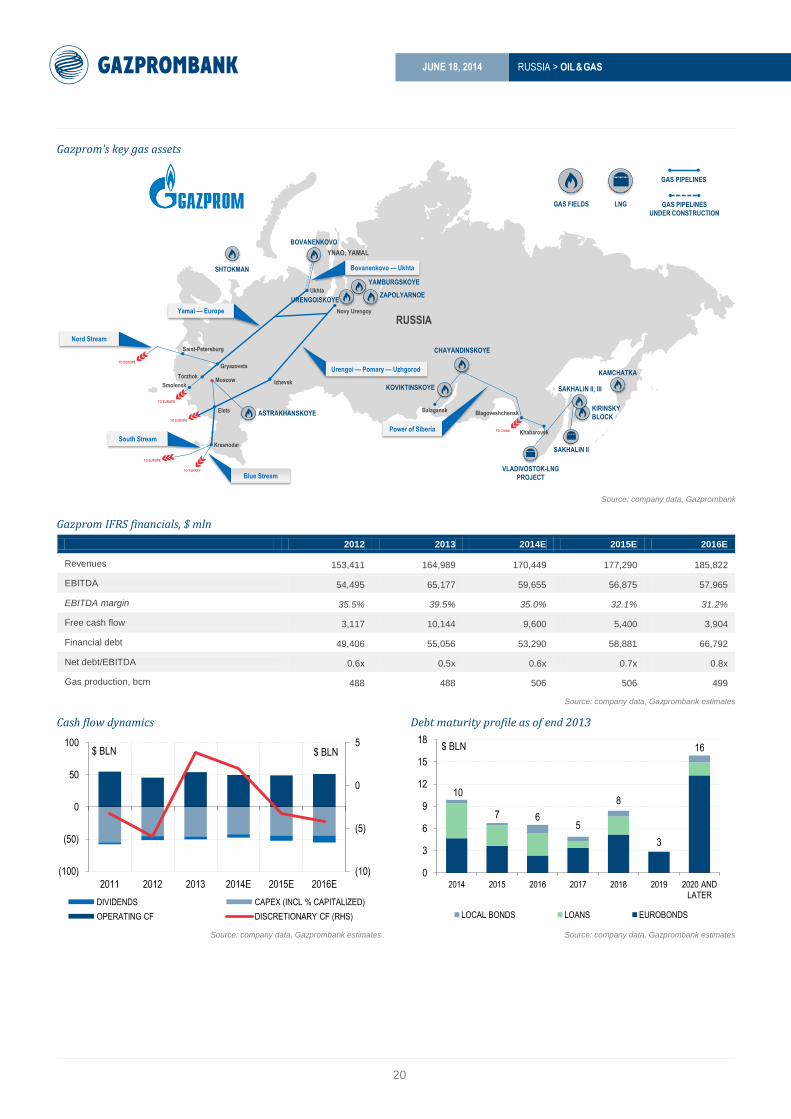
Gazprom’s key gas assets
Source: company data, Gazprombank
Gazprom IFRS financials, $ mln
2012 2013 2014E 2015E 2016E
Revenues 153,411 164,989 170,449 177,290 185,822
EBITDA 54,495 65,177 59,655 56,875 57,965
EBITDA margin 35.5% 39.5% 35.0% 32.1% 31.2%
Free cash flow 3,117 10,144 9,600 5,400 3,904
Financial debt 49,406 55,056 53,290 58,881 66,792
Net debt/EBITDA 0.6x 0.5x 0.6x 0.7x 0.8x
Gas production, bcm 488 488 506 506 499
Source: company data, Gazprombank estimates
Cash flow dynamics Debt maturity profile as of end 2013
Source: company data, Gazprombank estimates Source: company data, Gazprombank estimates
RUSSIA
YNAO, YAMAL
SHTOKMAN
KAMCHATKA
GAS FIELDS
VLADIVOSTOK-LNG
PROJECT
LNG
ZAPOLYARNOE
YAMBURGSKOYE
CHAYANDINSKOYE
KOVIKTINSKOYE SAKHALIN II, III
SAKHALIN II
Power of Siberia
Balagansk
TO CHINA
Smolensk
TO EUROPE
Ukhta
Gryazovets
Saint-Petersburg
TO EUROPE
Blagoveshchensk
Torzhok
Yamal — Europe Novy Urengoy
Izhevsk
Elets
TO EUROPE
Krasnodar
TO EUROPE
TO TURKEY
Blue Stream
South Stream
Urengoi — Pomary — Uzhgorod
Nord Stream
Bovanenkovo — Ukhta
GAS PIPELINES
BOVANENKOVO
URENGOISKOYE
Moscow
KIRINSKY
BLOCK
GAS PIPELINES
UNDER CONSTRUCTION
Khabarovsk
ASTRAKHANSKOYE
(10)
(5)
0
5
(100)
(50)
0
50
100
2011 2012 2013 2014E 2015E 2016E
$ BLN $ BLN
DIVIDENDS CAPEX (INCL % CAPITALIZED)
OPERATING CF DISCRETIONARY CF (RHS)
10
7 6 5
8
3
16
0
3
6
9
12
15
18
2014 2015 2016 2017 2018 2019 2020 AND LATER
$ BLN
LOCAL BONDS LOANS EUROBONDS
Page 22
RUSSIA > OIL & GAS
JUNE 18, 2014
21
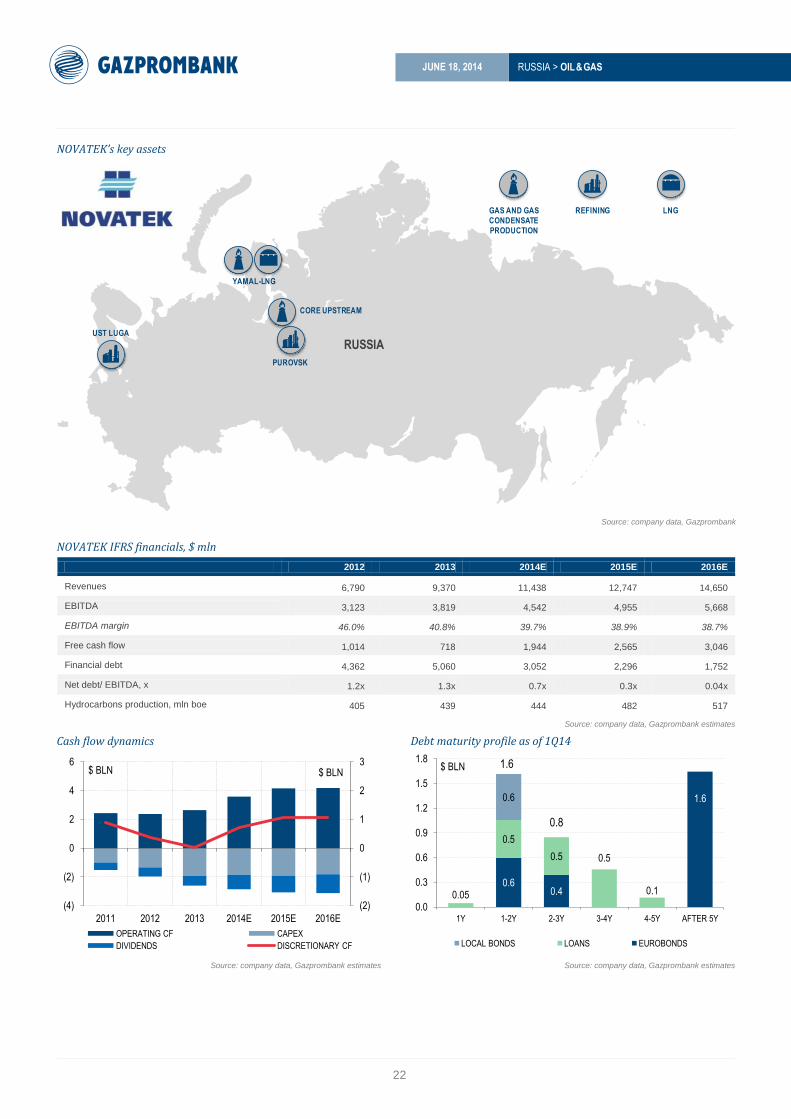
NOVATEK
NOVATEK is Russia’s second-largest gas company with 2013 gas production of
approximately 62 bcm of gas and 4.8 mln tonnes of liquid hydrocarbons, mainly gas
condensate. NOVATEK’s principal operating areas are concentrated in the Yamal-
Nenets Autonomous District (YNAO) in Western Siberia. YNAO is the most significant
gas producing region in Russia, accounting for approximately 90% of Russia’s natural
gas production and approximately 17% of global gas production. NOVATEK in 2013
accounted for 8% of Russian gas production and 18% of the Russian domestic end-
customer gas market.
NOVATEK also operates the Purovsky gas condensate stabilization plant and Ust-Luga
stable gas condensate fractionation complex. NOVATEK owns 60% of Yamal LNG
(20% owned by Total, 20% by CNPC), which is an LNG project with annual capacity of
16.5 mln tonnes and scheduled to start production in 2017.
Company-specific drivers
Unique combination of growth and FCF. NOVATEK may provide a unique
combination of double-digit growth in production of hydrocarbons and significant
free cash flow (FCF) generation. Usually oil companies provide growth in FCF,
which is especially attractive for a liquid stock with MCap of about $30 bln.
Yamal-LNG – Russia‘s largest LNG plant. Yamal-LNG will be the largest
Russian and the northernmost LNG plant in the world with one of the cheapest
upstream bases among global LNG plant projects. The LNG plant, which will start
output in 2017, will be a transformative project for NOVATEK – the company may
transform from a Russian gas domestic player (currently approximately 60-70% of
NOVATEK’s revenues come from domestic gas sales) into an international
diversified oil and gas major. Notably, 75% of LNG is contracted already.
Pro-active M&A player. NOVATEK uses its FCF to expand its business both
organically and through M&A. In 2012-13 alone, NOVATEK purchased stakes in
attractive greenfields, Nortgas and SeverEnergia, which will account for at least
30% of the company’s consolidated production by 2017. As we mentioned above,
NOVATEK generates enough free cash flow to look for more M&A in the future.
LNG supplies to China and project financing with the help of China. During
the visit of President Putin to China in May 2014, NOVATEK signed a contract to
supply 3 mln tpa of LNG to CNPC. On the same day, China Development Bank
Corporation, Vnesheconombank, Gazprombank and Yamal-LNG signed a
memorandum on project financing for the Yamal-LNG project.
Company-specific risks
Regulatory risks in taxation and gas tariffs. Although starting in 2014, gas tariffs
will grow at a slower rate than inflation and the new gas MET formula will be
introduced, Russian oil and gas taxation may change to the detriment of oil and
gas companies.
Lower than expected growth. NOVATEK is the most expensive company in the
Russian oil and gas universe on multiples, but the premium is justified by growth.
Lower than expected growth may create uncertainty regarding the company’s
prospects, while the premium valuation may seem unjustified to investors.
Inflation of Yamal-LNG capex. Upward revision of Yamal-LNG capex may lead
investors to revisit the attractiveness of the project.
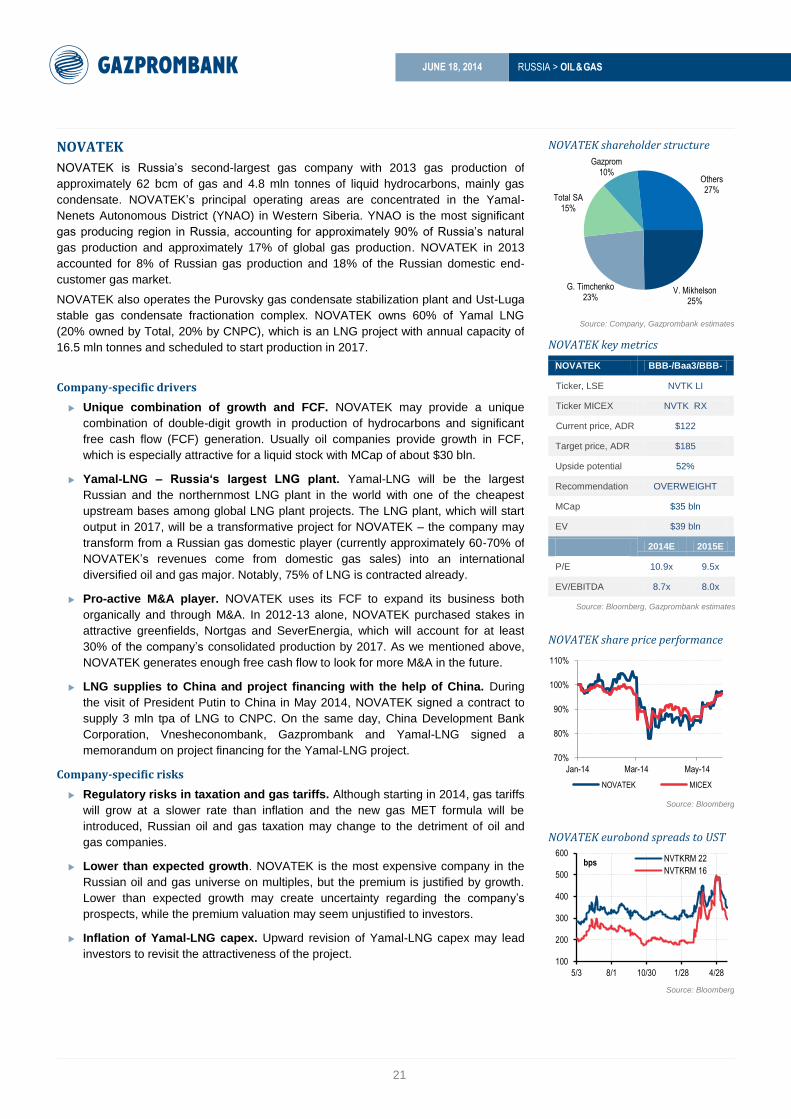
NOVATEK shareholder structure
Source: Company, Gazprombank estimates
NOVATEK key metrics
NOVATEK BBB-/Baa3/BBB-
Ticker, LSE NVTK LI
Ticker MICEX NVTK RX
Current price, ADR $122
Target price, ADR $185
Upside potential 52%
Recommendation OVERWEIGHT
MCap $35 bln
EV $39 bln
2014E 2015E
P/E 10.9x 9.5x
EV/EBITDA 8.7x 8.0x
Source: Bloomberg, Gazprombank estimates
NOVATEK share price performance
Source: Bloomberg
NOVATEK eurobond spreads to UST
Source: Bloomberg
Others 27%
V. Mikhelson 25%
G. Timchenko 23%
Total SA 15%
Gazprom 10%
70%
80%
90%
100%
110%
Jan-14 Mar-14 May-14
NOVATEK MICEX
100
200
300
400
500
600
5/3 8/1 10/30 1/28 4/28
bps NVTKRM 22
NVTKRM 16
Page 23
RUSSIA > OIL & GAS
JUNE 18, 2014
22
NOVATEK’s key assets
Source: company data, Gazprombank
NOVATEK IFRS financials, $ mln
2012 2013 2014E 2015E 2016E
Revenues 6,790 9,370 11,438 12,747 14,650
EBITDA 3,123 3,819 4,542 4,955 5,668
EBITDA margin 46.0% 40.8% 39.7% 38.9% 38.7%
Free cash flow 1,014 718 1,944 2,565 3,046
Financial debt 4,362 5,060 3,052 2,296 1,752
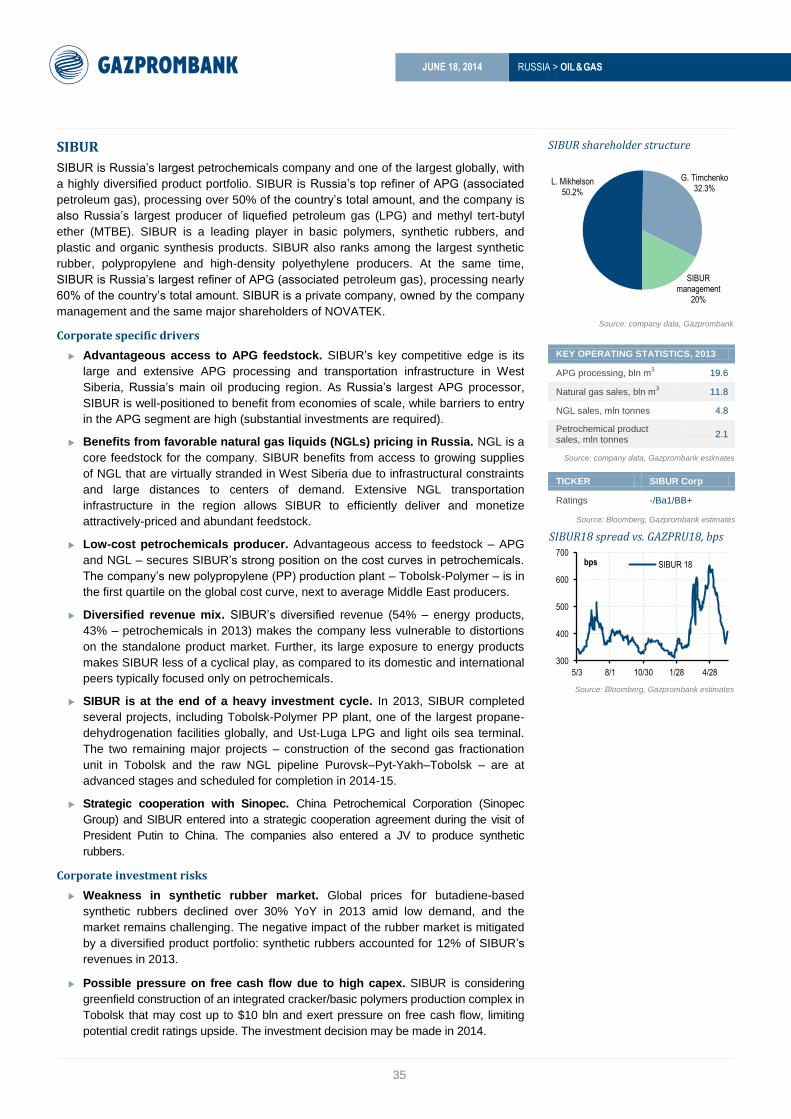
Net debt/ EBITDA, x 1.2x 1.3x 0.7x 0.3x 0.04x
Hydrocarbons production, mln boe 405 439 444 482 517
Source: company data, Gazprombank estimates
Cash flow dynamics Debt maturity profile as of 1Q14
Source: company data, Gazprombank estimates Source: company data, Gazprombank estimates
RUSSIA
PUROVSK
YAMAL-LNG
CORE UPSTREAM
UST LUGA
GAS AND GAS
CONDENSATE
PRODUCTION
REFINING LNG
(2)
(1)
0
1
2
3
(4)
(2)
0
2
4
6
2011 2012 2013 2014E 2015E 2016E
$ BLN $ BLN
OPERATING CF CAPEX
DIVIDENDS DISCRETIONARY CF
0.6 0.4
1.6
0.05
0.5
0.5 0.5
0.1
0.6
0.0
0.3
0.6
0.9
1.2
1.5
1.8
1Y 1-2Y 2-3Y 3-4Y 4-5Y AFTER 5Y
$ BLN
LOCAL BONDS LOANS EUROBONDS
1.6
0.8
Page 24
RUSSIA > OIL & GAS
JUNE 18, 2014
23
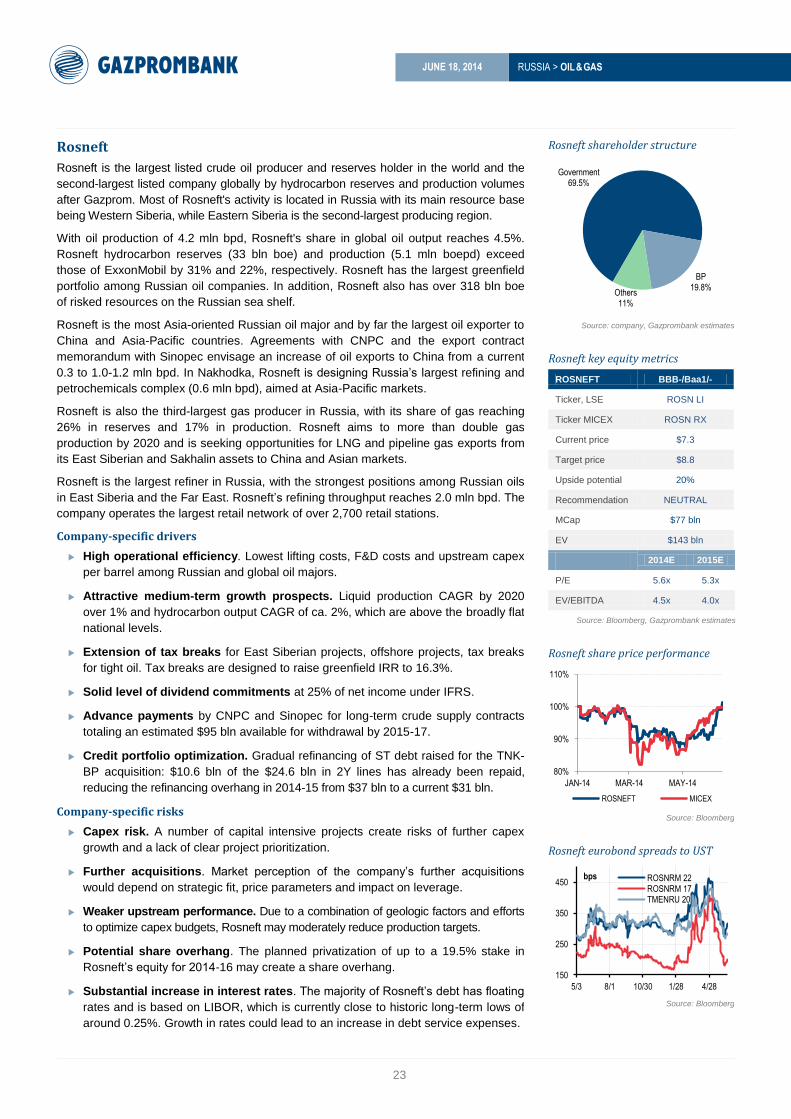
Rosneft
Rosneft is the largest listed crude oil producer and reserves holder in the world and the
second-largest listed company globally by hydrocarbon reserves and production volumes
after Gazprom. Most of Rosneft's activity is located in Russia with its main resource base
being Western Siberia, while Eastern Siberia is the second-largest producing region.
With oil production of 4.2 mln bpd, Rosneft's share in global oil output reaches 4.5%.
Rosneft hydrocarbon reserves (33 bln boe) and production (5.1 mln boepd) exceed
those of ExxonMobil by 31% and 22%, respectively. Rosneft has the largest greenfield
portfolio among Russian oil companies. In addition, Rosneft also has over 318 bln boe
of risked resources on the Russian sea shelf.
Rosneft is the most Asia-oriented Russian oil major and by far the largest oil exporter to
China and Asia-Pacific countries. Agreements with CNPC and the export contract
memorandum with Sinopec envisage an increase of oil exports to China from a current
0.3 to 1.0-1.2 mln bpd. In Nakhodka, Rosneft is designing Russia’s largest refining and
petrochemicals complex (0.6 mln bpd), aimed at Asia-Pacific markets.
Rosneft is also the third-largest gas producer in Russia, with its share of gas reaching
26% in reserves and 17% in production. Rosneft aims to more than double gas
production by 2020 and is seeking opportunities for LNG and pipeline gas exports from
its East Siberian and Sakhalin assets to China and Asian markets.
Rosneft is the largest refiner in Russia, with the strongest positions among Russian oils
in East Siberia and the Far East. Rosneft’s refining throughput reaches 2.0 mln bpd. The
company operates the largest retail network of over 2,700 retail stations.
Company-specific drivers
High operational efficiency. Lowest lifting costs, F&D costs and upstream capex
per barrel among Russian and global oil majors.
Attractive medium-term growth prospects. Liquid production CAGR by 2020
over 1% and hydrocarbon output CAGR of ca. 2%, which are above the broadly flat
national levels.
Extension of tax breaks for East Siberian projects, offshore projects, tax breaks
for tight oil. Tax breaks are designed to raise greenfield IRR to 16.3%.
Solid level of dividend commitments at 25% of net income under IFRS.
Advance payments by CNPC and Sinopec for long-term crude supply contracts
totaling an estimated $95 bln available for withdrawal by 2015-17.
Credit portfolio optimization. Gradual refinancing of ST debt raised for the TNK-
BP acquisition: $10.6 bln of the $24.6 bln in 2Y lines has already been repaid,
reducing the refinancing overhang in 2014-15 from $37 bln to a current $31 bln.
Company-specific risks
Capex risk. A number of capital intensive projects create risks of further capex
growth and a lack of clear project prioritization.
Further acquisitions. Market perception of the company’s further acquisitions
would depend on strategic fit, price parameters and impact on leverage.
Weaker upstream performance. Due to a combination of geologic factors and efforts
to optimize capex budgets, Rosneft may moderately reduce production targets.
Potential share overhang. The planned privatization of up to a 19.5% stake in
Rosneft’s equity for 2014-16 may create a share overhang.
Substantial increase in interest rates. The majority of Rosneft’s debt has floating
rates and is based on LIBOR, which is currently close to historic long-term lows of
around 0.25%. Growth in rates could lead to an increase in debt service expenses.
Rosneft shareholder structure
Source: company, Gazprombank estimates
Rosneft key equity metrics
ROSNEFT BBB-/Baa1/-
Ticker, LSE ROSN LI
Ticker MICEX ROSN RX
Current price $7.3
Target price $8.8
Upside potential 20%
Recommendation NEUTRAL
MCap $77 bln
EV $143 bln
2014E 2015E
P/E 5.6x 5.3x
EV/EBITDA 4.5x 4.0x
Source: Bloomberg, Gazprombank estimates
Rosneft share price performance
Source: Bloomberg
Rosneft eurobond spreads to UST
Source: Bloomberg
Others 11%
Government 69.5%
BP 19.8%
80%
90%
100%
110%
JAN-14 MAR-14 MAY-14
ROSNEFT MICEX
150
250
350
450
5/3 8/1 10/30 1/28 4/28
bps ROSNRM 22ROSNRM 17TMENRU 20
Page 25
RUSSIA > OIL & GAS
JUNE 18, 2014
24
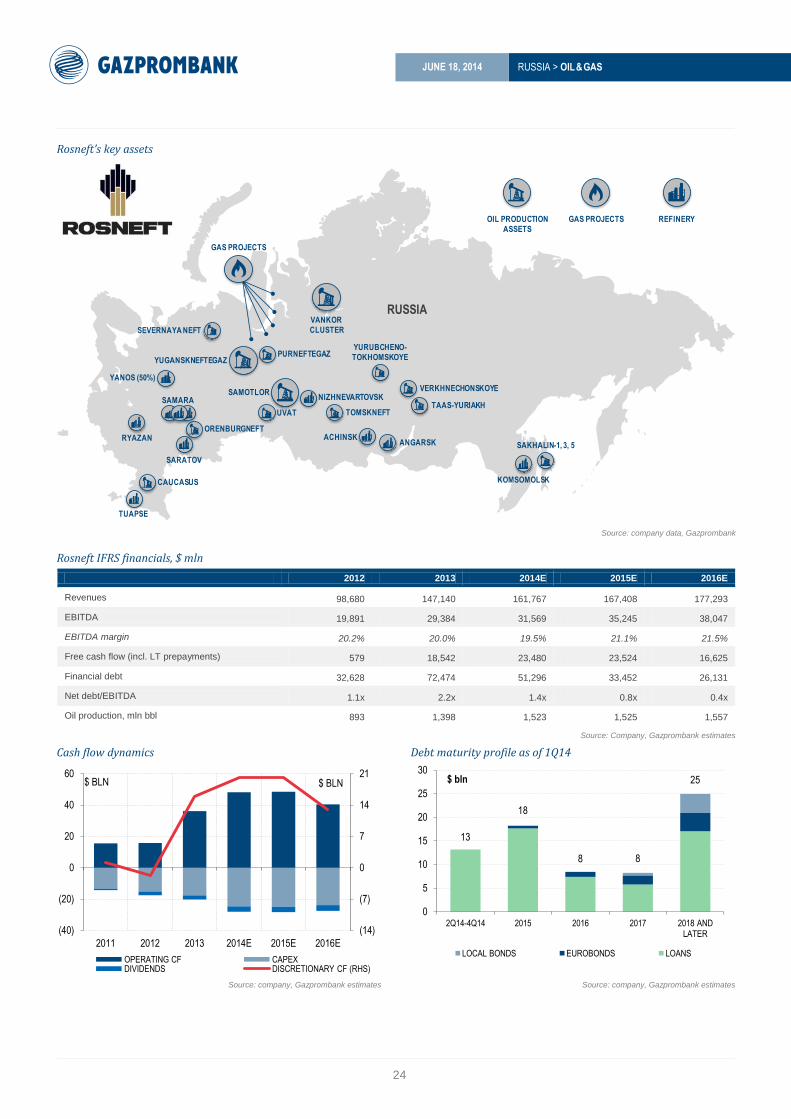
Rosneft’s key assets
Source: company data, Gazprombank
Rosneft IFRS financials, $ mln
2012 2013 2014E 2015E 2016E
Revenues 98,680 147,140 161,767 167,408 177,293
EBITDA 19,891 29,384 31,569 35,245 38,047
EBITDA margin 20.2% 20.0% 19.5% 21.1% 21.5%
Free cash flow (incl. LT prepayments) 579 18,542 23,480 23,524 16,625
Financial debt 32,628 72,474 51,296 33,452 26,131
Net debt/EBITDA 1.1x 2.2x 1.4x 0.8x 0.4x
Oil production, mln bbl 893 1,398 1,523 1,525 1,557
Source: Company, Gazprombank estimates
Cash flow dynamics Debt maturity profile as of 1Q14
Source: company, Gazprombank estimates Source: company, Gazprombank estimates
RUSSIA
PURNEFTEGAZ
VANKOR
CLUSTER
VERKHNECHONSKOYE
YUGANSKNEFTEGAZ
UVAT
SAMOTLOR
OIL PRODUCTION
ASSETS
GAS PROJECTS
ORENBURGNEFT
REFINERY
TUAPSE
SAMARA
SARATOV
RYAZAN
YANOS (50%)
TOMSKNEFT
NIZHNEVARTOVSK
KOMSOMOLSK
ACHINSKANGARSK SAKHALIN-1, 3, 5
GAS PROJECTS
TAAS-YURIAKH
YURUBCHENO-
TOKHOMSKOYE
SEVERNAYA NEFT
CAUCASUS
(14)
(7)
0
7
14
21
(40)
(20)
0
20
40
60
2011 2012 2013 2014E 2015E 2016E
$ BLN $ BLN
OPERATING CF CAPEX DIVIDENDS DISCRETIONARY CF (RHS)
13
18
8 8
25
0
5
10
15
20
25
30
2Q14-4Q14 2015 2016 2017 2018 AND LATER
$ bln
LOCAL BONDS EUROBONDS LOANS
Page 26
RUSSIA > OIL & GAS
JUNE 18, 2014
25
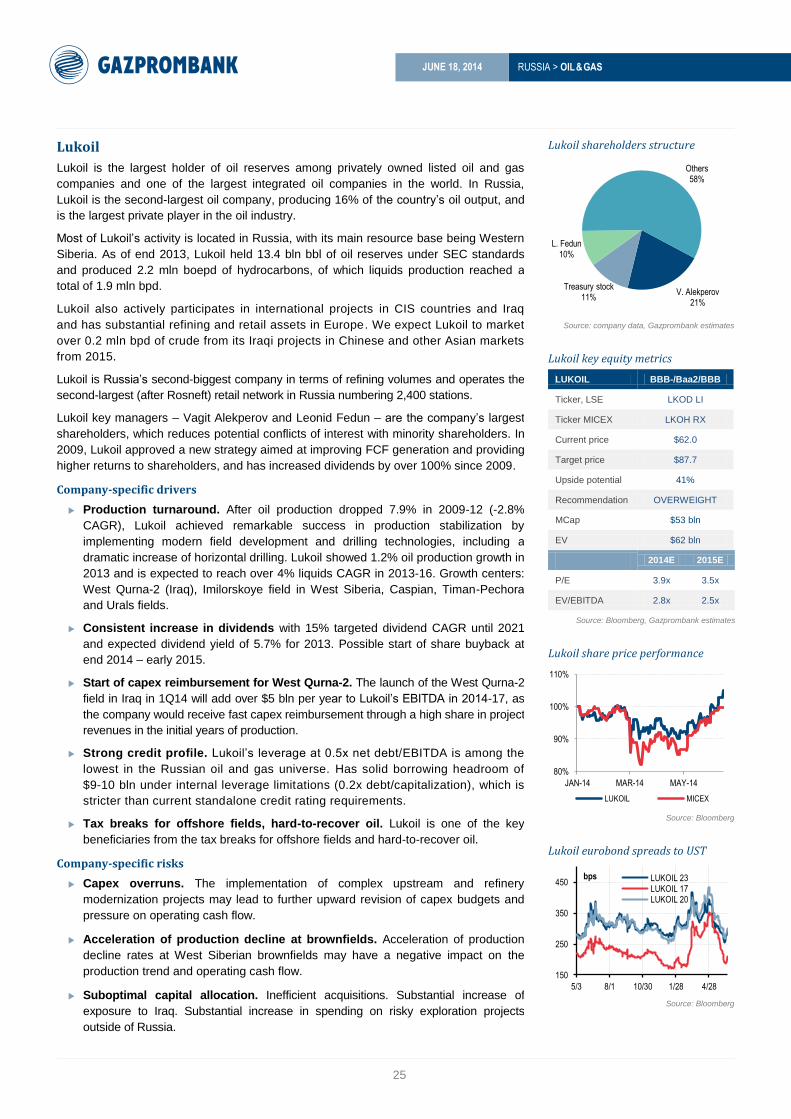
Lukoil
Lukoil is the largest holder of oil reserves among privately owned listed oil and gas
companies and one of the largest integrated oil companies in the world. In Russia,
Lukoil is the second-largest oil company, producing 16% of the country’s oil output, and
is the largest private player in the oil industry.
Most of Lukoil’s activity is located in Russia, with its main resource base being Western
Siberia. As of end 2013, Lukoil held 13.4 bln bbl of oil reserves under SEC standards
and produced 2.2 mln boepd of hydrocarbons, of which liquids production reached a
total of 1.9 mln bpd.
Lukoil also actively participates in international projects in CIS countries and Iraq
and has substantial refining and retail assets in Europe. We expect Lukoil to market
over 0.2 mln bpd of crude from its Iraqi projects in Chinese and other Asian markets
from 2015.
Lukoil is Russia’s second-biggest company in terms of refining volumes and operates the
second-largest (after Rosneft) retail network in Russia numbering 2,400 stations.
Lukoil key managers – Vagit Alekperov and Leonid Fedun – are the company’s largest
shareholders, which reduces potential conflicts of interest with minority shareholders. In
2009, Lukoil approved a new strategy aimed at improving FCF generation and providing
higher returns to shareholders, and has increased dividends by over 100% since 2009.
Company-specific drivers
Production turnaround. After oil production dropped 7.9% in 2009-12 (-2.8%
CAGR), Lukoil achieved remarkable success in production stabilization by
implementing modern field development and drilling technologies, including a
dramatic increase of horizontal drilling. Lukoil showed 1.2% oil production growth in
2013 and is expected to reach over 4% liquids CAGR in 2013-16. Growth centers:
West Qurna-2 (Iraq), Imilorskoye field in West Siberia, Caspian, Timan-Pechora
and Urals fields.
Consistent increase in dividends with 15% targeted dividend CAGR until 2021
and expected dividend yield of 5.7% for 2013. Possible start of share buyback at
end 2014 – early 2015.
Start of capex reimbursement for West Qurna-2. The launch of the West Qurna-2
field in Iraq in 1Q14 will add over $5 bln per year to Lukoil’s EBITDA in 2014-17, as
the company would receive fast capex reimbursement through a high share in project
revenues in the initial years of production.
Strong credit profile. Lukoil’s leverage at 0.5x net debt/EBITDA is among the
lowest in the Russian oil and gas universe. Has solid borrowing headroom of
$9-10 bln under internal leverage limitations (0.2x debt/capitalization), which is
stricter than current standalone credit rating requirements.
Tax breaks for offshore fields, hard-to-recover oil. Lukoil is one of the key
beneficiaries from the tax breaks for offshore fields and hard-to-recover oil.
Company-specific risks
Capex overruns. The implementation of complex upstream and refinery
modernization projects may lead to further upward revision of capex budgets and
pressure on operating cash flow.
Acceleration of production decline at brownfields. Acceleration of production
decline rates at West Siberian brownfields may have a negative impact on the
production trend and operating cash flow.
Suboptimal capital allocation. Inefficient acquisitions. Substantial increase of
exposure to Iraq. Substantial increase in spending on risky exploration projects
outside of Russia.
Lukoil shareholders structure
Source: company data, Gazprombank estimates
Lukoil key equity metrics
LUKOIL BBB-/Baa2/BBB
Ticker, LSE LKOD LI
Ticker MICEX LKOH RX
Current price $62.0
Target price $87.7
Upside potential 41%
Recommendation OVERWEIGHT
MCap $53 bln
EV $62 bln
2014E 2015E
P/E 3.9x 3.5x
EV/EBITDA 2.8x 2.5x
Source: Bloomberg, Gazprombank estimates
Lukoil share price performance
Source: Bloomberg
Lukoil eurobond spreads to UST
Source: Bloomberg
Others 58%
V. Alekperov 21%
Treasury stock 11%
L. Fedun 10%
80%
90%
100%
110%
JAN-14 MAR-14 MAY-14
LUKOIL MICEX
150
250
350
450
5/3 8/1 10/30 1/28 4/28
bps LUKOIL 23LUKOIL 17LUKOIL 20
Page 27
RUSSIA > OIL & GAS
JUNE 18, 2014
26
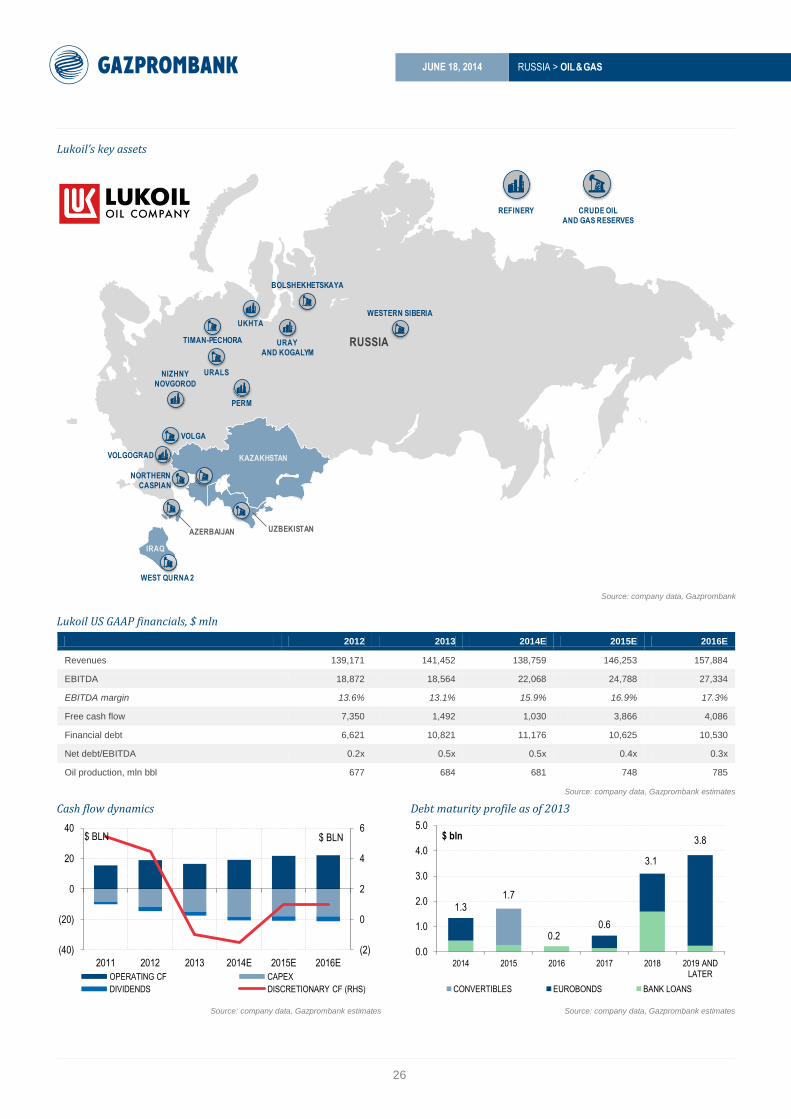
Lukoil’s key assets
Source: company data, Gazprombank
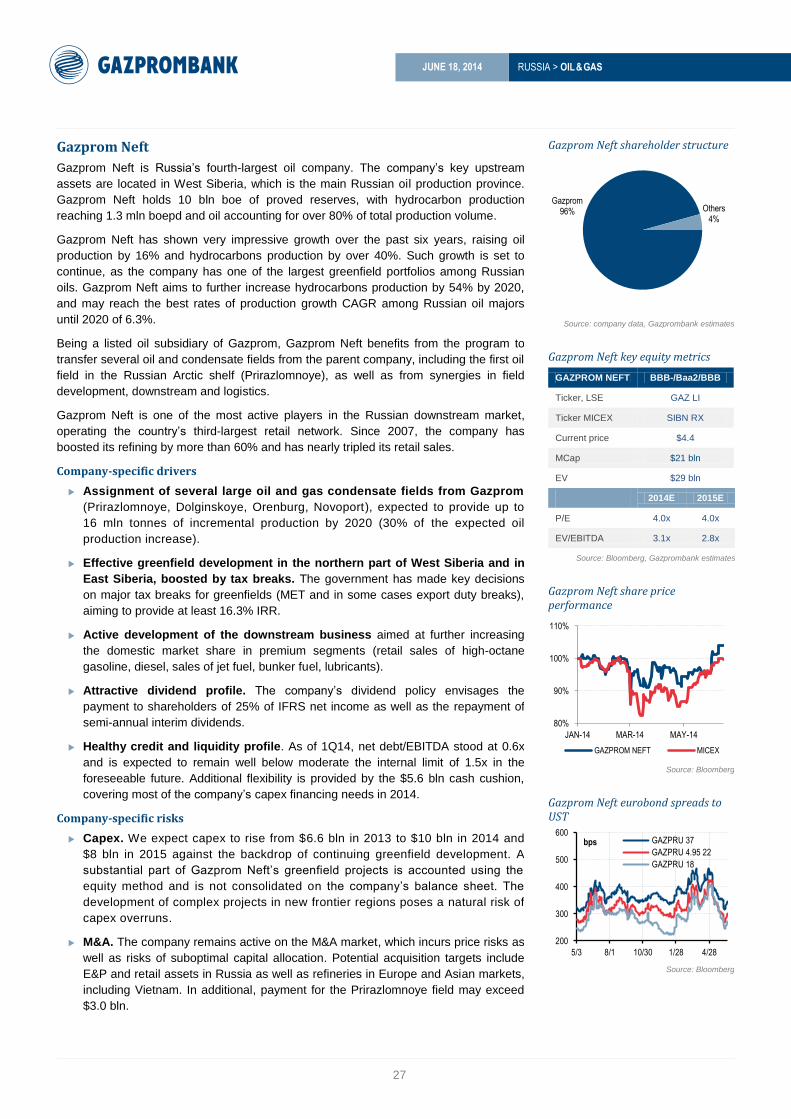
Lukoil US GAAP financials, $ mln
2012 2013 2014E 2015E 2016E
Revenues 139,171 141,452 138,759 146,253 157,884
EBITDA 18,872 18,564 22,068 24,788 27,334
EBITDA margin 13.6% 13.1% 15.9% 16.9% 17.3%
Free cash flow 7,350 1,492 1,030 3,866 4,086
Financial debt 6,621 10,821 11,176 10,625 10,530
Net debt/EBITDA 0.2x 0.5x 0.5x 0.4x 0.3x
Oil production, mln bbl 677 684 681 748 785
Source: company data, Gazprombank estimates
Cash flow dynamics Debt maturity profile as of 2013
Source: company data, Gazprombank estimates Source: company data, Gazprombank estimates
RUSSIA
VOLGOGRAD
REFINERY
NIZHNY
NOVGOROD
UKHTA
URAY
AND KOGALYM
PERM
CRUDE OIL
AND GAS RESERVES
NORTHERN
CASPIAN
VOLGA
URALS
TIMAN-PECHORA
BOLSHEKHETSKAYA
WESTERN SIBERIA
WEST QURNA 2
IRAQ
KAZAKHSTAN
UZBEKISTANAZERBAIJAN
(2)
0
2
4
6
(40)
(20)
0
20
40
2011 2012 2013 2014E 2015E 2016E
$ BLN $ BLN
OPERATING CF CAPEX
DIVIDENDS DISCRETIONARY CF (RHS)
1.3 1.7
0.2 0.6
3.1
3.8
0.0
1.0
2.0
3.0
4.0
5.0
2014 2015 2016 2017 2018 2019 AND LATER
$ bln
CONVERTIBLES EUROBONDS BANK LOANS
Page 28
RUSSIA > OIL & GAS
JUNE 18, 2014
27
Gazprom Neft
Gazprom Neft is Russia’s fourth-largest oil company. The company’s key upstream
assets are located in West Siberia, which is the main Russian oil production province.
Gazprom Neft holds 10 bln boe of proved reserves, with hydrocarbon production
reaching 1.3 mln boepd and oil accounting for over 80% of total production volume.
Gazprom Neft has shown very impressive growth over the past six years, raising oil
production by 16% and hydrocarbons production by over 40%. Such growth is set to
continue, as the company has one of the largest greenfield portfolios among Russian
oils. Gazprom Neft aims to further increase hydrocarbons production by 54% by 2020,
and may reach the best rates of production growth CAGR among Russian oil majors
until 2020 of 6.3%.
Being a listed oil subsidiary of Gazprom, Gazprom Neft benefits from the program to
transfer several oil and condensate fields from the parent company, including the first oil
field in the Russian Arctic shelf (Prirazlomnoye), as well as from synergies in field
development, downstream and logistics.
Gazprom Neft is one of the most active players in the Russian downstream market,
operating the country’s third-largest retail network. Since 2007, the company has
boosted its refining by more than 60% and has nearly tripled its retail sales.
Company-specific drivers
Assignment of several large oil and gas condensate fields from Gazprom
(Prirazlomnoye, Dolginskoye, Orenburg, Novoport), expected to provide up to
16 mln tonnes of incremental production by 2020 (30% of the expected oil
production increase).
Effective greenfield development in the northern part of West Siberia and in
East Siberia, boosted by tax breaks. The government has made key decisions
on major tax breaks for greenfields (MET and in some cases export duty breaks),
aiming to provide at least 16.3% IRR.
Active development of the downstream business aimed at further increasing
the domestic market share in premium segments (retail sales of high-octane
gasoline, diesel, sales of jet fuel, bunker fuel, lubricants).
Attractive dividend profile. The company’s dividend policy envisages the
payment to shareholders of 25% of IFRS net income as well as the repayment of
semi-annual interim dividends.
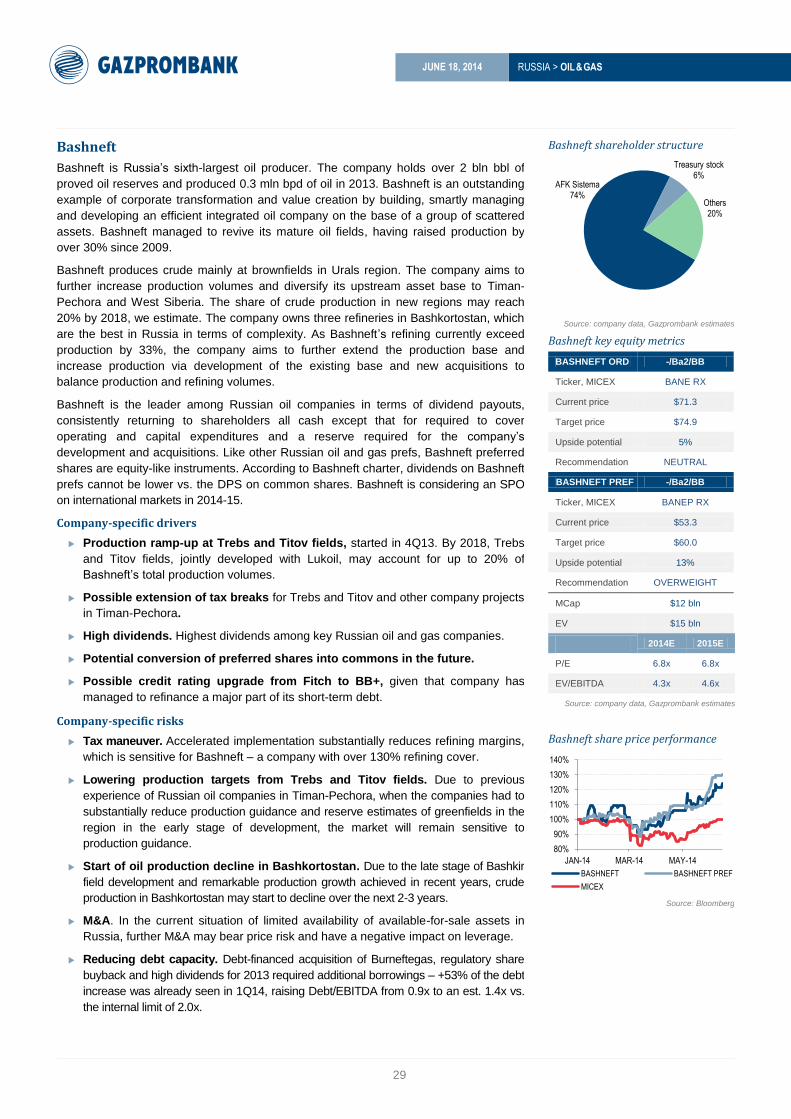
Healthy credit and liquidity profile. As of 1Q14, net debt/EBITDA stood at 0.6x
and is expected to remain well below moderate the internal limit of 1.5x in the
foreseeable future. Additional flexibility is provided by the $5.6 bln cash cushion,
covering most of the company’s capex financing needs in 2014.
Company-specific risks
Capex. We expect capex to rise from $6.6 bln in 2013 to $10 bln in 2014 and
$8 bln in 2015 against the backdrop of continuing greenfield development. A
substantial part of Gazprom Neft’s greenfield projects is accounted using the
equity method and is not consolidated on the company’s balance sheet. The
development of complex projects in new frontier regions poses a natural risk of
capex overruns.
M&A. The company remains active on the M&A market, which incurs price risks as
well as risks of suboptimal capital allocation. Potential acquisition targets include
E&P and retail assets in Russia as well as refineries in Europe and Asian markets,
including Vietnam. In additional, payment for the Prirazlomnoye field may exceed
$3.0 bln.
Gazprom Neft shareholder structure
Source: company data, Gazprombank estimates
Gazprom Neft key equity metrics
GAZPROM NEFT BBB-/Baa2/BBB
Ticker, LSE GAZ LI
Ticker MICEX SIBN RX
Current price $4.4
MCap $21 bln
EV $29 bln
2014E 2015E
P/E 4.0x 4.0x
EV/EBITDA 3.1x 2.8x
Source: Bloomberg, Gazprombank estimates
Gazprom Neft share price performance
Source: Bloomberg
Gazprom Neft eurobond spreads to UST
Source: Bloomberg
Others 4%
Gazprom 96%
80%
90%
100%
110%
JAN-14 MAR-14 MAY-14
GAZPROM NEFT MICEX
200
300
400
500
600
5/3 8/1 10/30 1/28 4/28
bps GAZPRU 37
GAZPRU 4.95 22
GAZPRU 18
Page 29
RUSSIA > OIL & GAS
JUNE 18, 2014
28
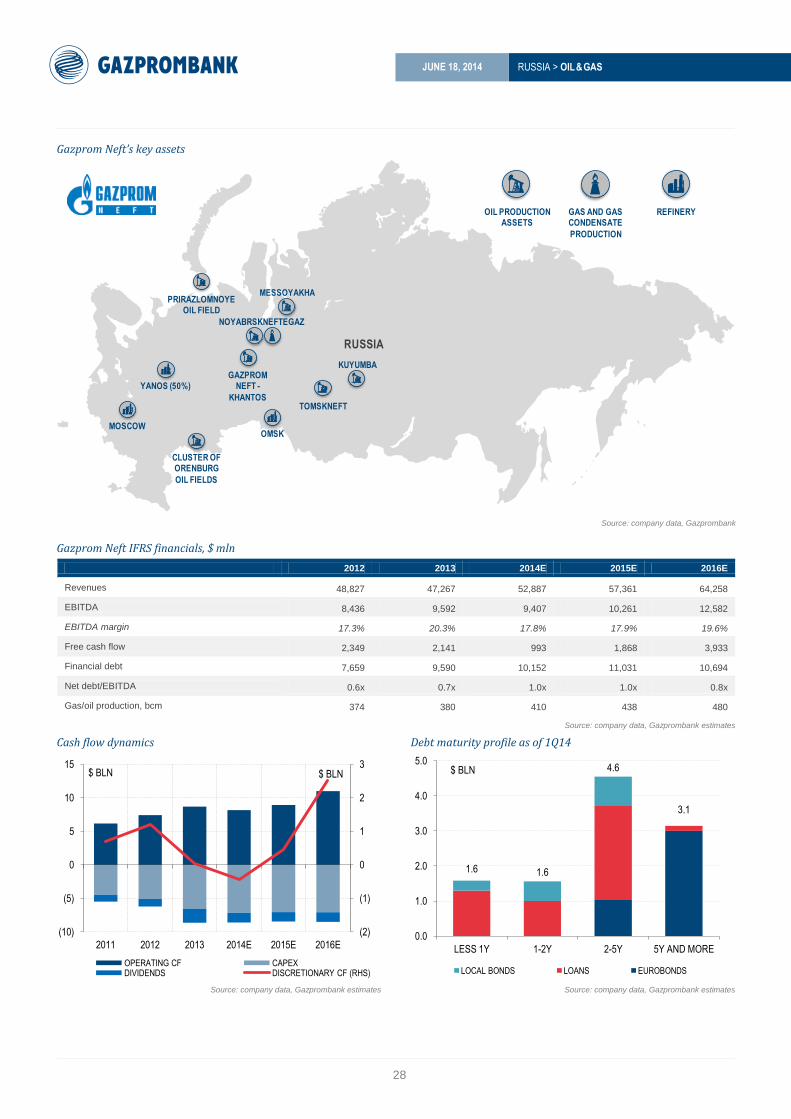
Gazprom Neft’s key assets
Source: company data, Gazprombank
Gazprom Neft IFRS financials, $ mln
2012 2013 2014E 2015E 2016E
Revenues 48,827 47,267 52,887 57,361 64,258
EBITDA 8,436 9,592 9,407 10,261 12,582
EBITDA margin 17.3% 20.3% 17.8% 17.9% 19.6%
Free cash flow 2,349 2,141 993 1,868 3,933
Financial debt 7,659 9,590 10,152 11,031 10,694
Net debt/EBITDA 0.6x 0.7x 1.0x 1.0x 0.8x
Gas/oil production, bcm 374 380 410 438 480
Source: company data, Gazprombank estimates
Cash flow dynamics Debt maturity profile as of 1Q14
Source: company data, Gazprombank estimates Source: company data, Gazprombank estimates
RUSSIA
YANOS (50%)
PRIRAZLOMNOYE OIL FIELD
MOSCOWOMSK
CLUSTER OFORENBURG
OIL FIELDS
NOYABRSKNEFTEGAZ
OIL PRODUCTION ASSETS
REFINERYGAS AND GAS CONDENSATE
PRODUCTION
GAZPROM NEFT -
KHANTOSTOMSKNEFT
MESSOYAKHA
KUYUMBA
(2)
(1)
0
1
2
3
(10)
(5)
0
5
10
15
2011 2012 2013 2014E 2015E 2016E
$ BLN $ BLN
OPERATING CF CAPEX DIVIDENDS DISCRETIONARY CF (RHS)
1.6 1.6
4.6
3.1
0.0
1.0
2.0
3.0
4.0
5.0
LESS 1Y 1-2Y 2-5Y 5Y AND MORE
$ BLN
LOCAL BONDS LOANS EUROBONDS
Page 30
RUSSIA > OIL & GAS
JUNE 18, 2014
29
Bashneft
Bashneft is Russia’s sixth-largest oil producer. The company holds over 2 bln bbl of
proved oil reserves and produced 0.3 mln bpd of oil in 2013. Bashneft is an outstanding
example of corporate transformation and value creation by building, smartly managing
and developing an efficient integrated oil company on the base of a group of scattered
assets. Bashneft managed to revive its mature oil fields, having raised production by
over 30% since 2009.
Bashneft produces crude mainly at brownfields in Urals region. The company aims to
further increase production volumes and diversify its upstream asset base to Timan-
Pechora and West Siberia. The share of crude production in new regions may reach
20% by 2018, we estimate. The company owns three refineries in Bashkortostan, which
are the best in Russia in terms of complexity. As Bashneft’s refining currently exceed
production by 33%, the company aims to further extend the production base and
increase production via development of the existing base and new acquisitions to
balance production and refining volumes.
Bashneft is the leader among Russian oil companies in terms of dividend payouts,
consistently returning to shareholders all cash except that for required to cover
operating and capital expenditures and a reserve required for the company’s
development and acquisitions. Like other Russian oil and gas prefs, Bashneft preferred
shares are equity-like instruments. According to Bashneft charter, dividends on Bashneft
prefs cannot be lower vs. the DPS on common shares. Bashneft is considering an SPO
on international markets in 2014-15.
Company-specific drivers
Production ramp-up at Trebs and Titov fields, started in 4Q13. By 2018, Trebs
and Titov fields, jointly developed with Lukoil, may account for up to 20% of
Bashneft’s total production volumes.
Possible extension of tax breaks for Trebs and Titov and other company projects
in Timan-Pechora.
High dividends. Highest dividends among key Russian oil and gas companies.
Potential conversion of preferred shares into commons in the future.
Possible credit rating upgrade from Fitch to BB+, given that company has
managed to refinance a major part of its short-term debt.
Company-specific risks
Tax maneuver. Accelerated implementation substantially reduces refining margins,
which is sensitive for Bashneft – a company with over 130% refining cover.
Lowering production targets from Trebs and Titov fields. Due to previous
experience of Russian oil companies in Timan-Pechora, when the companies had to
substantially reduce production guidance and reserve estimates of greenfields in the
region in the early stage of development, the market will remain sensitive to
production guidance.
Start of oil production decline in Bashkortostan. Due to the late stage of Bashkir
field development and remarkable production growth achieved in recent years, crude
production in Bashkortostan may start to decline over the next 2-3 years.
M&A. In the current situation of limited availability of available-for-sale assets in
Russia, further M&A may bear price risk and have a negative impact on leverage.
Reducing debt capacity. Debt-financed acquisition of Burneftegas, regulatory share
buyback and high dividends for 2013 required additional borrowings – +53% of the debt
increase was already seen in 1Q14, raising Debt/EBITDA from 0.9x to an est. 1.4x vs.
the internal limit of 2.0x.
Bashneft shareholder structure
Source: company data, Gazprombank estimates
Bashneft key equity metrics
BASHNEFT ORD -/Ba2/BB
Ticker, MICEX BANE RX
Current price $71.3
Target price $74.9
Upside potential 5%
Recommendation NEUTRAL
BASHNEFT PREF -/Ba2/BB
Ticker, MICEX BANEP RX
Current price $53.3
Target price $60.0
Upside potential 13%
Recommendation OVERWEIGHT
MCap $12 bln
EV $15 bln
2014E 2015E
P/E 6.8x 6.8x
EV/EBITDA 4.3x 4.6x
Source: company data, Gazprombank estimates
Bashneft share price performance
Source: Bloomberg
Others 20%
AFK Sistema 74%
Treasury stock 6%
80%
90%
100%
110%
120%
130%
140%
JAN-14 MAR-14 MAY-14
BASHNEFT BASHNEFT PREF
MICEX
Page 31
RUSSIA > OIL & GAS
JUNE 18, 2014
30
Bashneft’s key assets
Source: Company’s data, Gazprombank
Bashneft financials, $ mln
2012 2013 2014E 2015E 2016E
Revenues 17,139 17,703 17,424 18,016 18,673
EBITDA 3,176 3,188 3,404 3,192 3,384
EBITDA margin 18.5% 18.0% 19.5% 17.7% 18.1%
Free cash flow 1,299 1,642 1,593 1,273 1,350
Financial debt 3,629 2,775 4,663 4,770 4,411
Net debt/EBITDA 0.9 0.7 1.2 1.2 1.0
Oil production, mln bbl 111 113 117 120 123
Source: company data, Gazprombank estimates
Cash flow dynamics Debt maturity profile as of June 1, 2014
Source: company data, Gazprombank estimates Source: company data, Gazprombank estimates
RUSSIA
UFA REFINERYNOVOIL
UFANEFTEKHIM
TREBS AND TITOV FIELDS
OIL FIELDSIN BASHKORTOSTAN
Ufa
OIL PRODUCTION REFINERY
BURNEFTEGAS
(3)
(2)
(1)
0
1
2
3
(3)
(2)
(1)
0
1
2
3
2011 2012 2013 2014E 2015E 2016E
$ BLN $ BLN
OPERATING CF CAPEX
DIVIDENDS DISCRETIONARY CF (RHS)
0.3
0.9
0.6
0.9 0.8
1.4
0.0
0.3
0.6
0.9
1.2
1.5
2014 2015 2016 2017 2018 2019 AND LATER
$ BLN
Page 32
RUSSIA > OIL & GAS
JUNE 18, 2014
31
Surgutneftegas
Surgutneftegas is Russia’s third-largest oil company in terms of both crude output and
market cap. The company’s 2013 crude production totaled about 61.5 mln tonnes.
Surgutneftegas also produced 12.0 bcm of gas last year, making it the country’s fourth-
largest gas producer. Brownfields account for 91% of production, with only one field –
Fedorovskoye – accounting for more than 10% of total company output. Moreover,
brownfield production is declining – we estimate by 1.5% in 2011 and about 1.5-2.5%
per year going forward. In 2011-14, the decline in brownfields is compensated by
production from Eastern Siberia (mainly Talakan field).
Surgutneftegas is a unique company in terms of balance sheet structure – it is one of
the few large companies in the world with a cash pile on its balance sheet that is similar
in size to the company’s market cap, e.g. the EV of Surgutneftegas is close to zero,
implying the lowest EV/EBITDA multiples in the industry.
Surgutneftegas preferred shares are a decent dividend play. According to the
company’s charter, dividends on preferred shares should be equal to about 7% of RAS
net income, as preferred dividends move in line with RAS net income dynamics.
Surgutneftegas preferred shares provide shareholders with a dividend yield of 8-11%. At
the same time, the company’s charter does not contain a benchmark for the dividend
payout on ordinary shares, which yield only about 1-2%. As a result, the company’s
preferred shares, which have historically traded with a 35-45% discount to commons,
began to trade with a premium in May.
Company-specific drivers
Tax maneuver. Surgutneftegas has one of the largest shares of crude oil export
sales in revenues among Russian O&G majors and one of the lowest refining
yields. Although not finalized yet, the tax maneuver will likely decrease refining
margins and increase upstream margins, which will support Surgutneftegas’ profits.
High dividends on preferred shares. As we noted, Surgutneftegas preferred
shares are among the highest-yielding stocks in the Russian oil and gas universe.
Common shares, although bringing lower yields, reflect the growth in preferred
shares.
Defensive play against ruble depreciation. Surgutneftegas holds a large cash
pile, mainly denominated in USD and EUR. As a result of ruble depreciation,
Surgutneftegas books a FX gain that is included in RAS net income for dividend
calculation purposes. We roughly estimate that holders of Surgutneftegas
preferred shares receive an additional RUB 0.3 in dividends (boosting the yield
by around 1 pp) for every 1 RUB in depreciation against the dollar.
Company-specific risks
Decrease of production at core fields. Like most Russian oil majors,
Surgutneftegas faces a decrease in output from its brownfields. Although the
company has new projects, it may face an overall production decline in the future.
Non-transparent shareholder structure. We estimate that about 66% of
Surgutneftegas common shares are owned by non-commercial entities, none of
which hold a share of more than 5%. The absence of a clear beneficiary and the
risks of an unfriendly merger (with no offer to minorities) are probably among the
main reasons for the almost zero EV/EBITDA multiples.
Cash pile usage. For years, the cash pile has never been used by Surgutneftegas,
leading to speculation that it does not exist. Surgutneftegas has not used its cash
for expansion, mergers or buybacks and has thus been criticized by the market.
The fact that the cash pile is not being used by the company is probably the reason
why the market does not really account for it when valuing Surgutneftegas.
Surgutneftegas shareholder structure
Source: company data, Gazprombank estimates
Surgutneftegas key equity metrics
SURGUTNG ORD -/-/-
Ticker, MICEX SNGS RX
Current price $0.79
Target price $0.93
Upside potential 17%
Recommendation NEUTRAL
SURGUTNG PREF -/-/-
Ticker, MICEX SNGSP RX
Current price $0.82
Target price $0.82
Upside potential 1%
Recommendation OVERWEIGHT
MCap $34 bln
EV $3 bln
2014E 2015E
P/E 8.9x 9.3x
EV/EBITDA 0.3x 0.3x
Source: company data, Gazprombank estimates
Surgutneftegas share price performance
Source: Bloomberg
Others 30%
Non-commercial organizations
66%%
Management 4%
80%
90%
100%
110%
120%
JAN-14 MAR-14 MAY-14 SURGUTNG SURGUTNG PREF MICEX
Page 33
RUSSIA > OIL & GAS
JUNE 18, 2014
32
Surgutneftegas’ key assets
Source: Company’s data, Gazprombank
Surgutneftegas financials, $ mln
2012 2013 2014E 2015E 2016E
Revenues 42,078 41,363 42,009 42,880 43,518
EBITDA 8,839 8,219 8,463 8,534 8,680
EBITDA margin 21.0% 19.9% 20.1% 19.9% 19.9%
Free cash flow 3,515 2,537 1,394 2,383 2,550
Financial debt 2,091 2,284 1,917 1,917 1,917
Net debt/EBITDA -3.3 -3.9 -2.9 -3.0 -3.2
Oil production, mln bbl 450 450 443 443 439
Source: company data, Gazprombank estimates
Cash flow dynamics Cash pile dynamics as of 2013
Source: company data, Gazprombank estimates * According to RAS
Source: company data, Gazprombank estimates
RUSSIA
OIL PRODUCTION REFINERY
TALAKANSKOYE
SURGUT(KEY PRODUCTION REGION)
KINEF CRUDEREFINING
(3)
(2)
(1)
0
1
2
3
(10)
(8)
(6)
(4)
(2)
0
2
4
6
8
10
2011 2012 2013 2014E 2015E 2016E
$ BLN $ BLN
OPERATING CF CAPEX DIVIDENDS DISCRETIONARY CF
29
23
27
31
34
0
5
10
15
20
25
30
35
40
2009* 2010 2011 2012 2013
$ BLN
Page 34
RUSSIA > OIL & GAS
JUNE 18, 2014
33
Tatneft
Tatneft is Russia’s fifth-largest oil producer with annual production of more than 25 mln
tonnes. Tatneft’s fields have a unique geographical profile – most of the company’s
reserves are located in a single geographical zone with the shortest route both to export
and refining capacities. The company’s crude oil production has been stable for the past
10 years and can probably remain so for another 10 years. We also note that Tatneft
has the longest reserves life among Russian oil majors.
The company also operates the 8 mln tonne p.a. TANECO refinery, which starting from
2014 began to be reflected in Tatneft’s margins. In 1Q14, TANECO started a
hydrocracker that has been a game changer for Tatneft’s downstream. Before 1Q14 the
downstream generated insignificant margins due to low refining quality. Revenues in the
refining segment in FY13 accounted for about 40% of the company’s total revenue
structure and 15% of pre-tax income, up from about 9% in 2012. As of 1Q14, the share
of this segment in pre-tax income amounted already to 23%.
Thanks to the unique geographical location of Tatneft’s fields (close to main export
destinations), the company has the lowest transportation expenses per bbl among
Russian oil majors. On the back of a lack of development capex, Tatneft has the lowest
upstream capex per bbl among Russian oil companies.
The company is an excellent FCF generator, with FCF totaling almost $3 bln in 2013
and another $1 bln in 1Q14. The situation may change when the company starts the
construction of the second stage of TANECO refinery, which may cost $4.5 bln.
The company is also a decent dividend payer. Tatneft has historically paid out 30% of
RAS net income, which implies a 4-5% dividend yield for common shares and 7-8% for
prefs.
Company-specific drivers
Hydrocracker at TANECO improved margins. In 1Q14, after the start of the
hydrocracker, Tatneft showed the highest EBITDA margin in the company’s history.
Moreover, 1Q14 did not fully reflect the operations of the new TANECO unit and
the full effect will be seen only in the coming quarters.
Bitumen oil project. This is a separate mega-project of high viscous (bitumen) oil
production that could require up to RUB 100 bln in investment. The company
expects to reach production of 2 mln tonnes of bitumen oil within the next 3-4
years. Taking into account the special tax regime, production of bitumen oil is
profitable at current oil prices. The bitumen oil project gives Tatneft something that
the company’s investment history has not seen for quite a long time – growth.
Dividends. As mentioned above, Tatneft is a stable dividend payer, providing
investors with a defensive play.
Company-specific risks
TANECO second stage. Tatneft is about to decide on whether to expand
TANECO refinery to 14 mln tonnes p.a., which would push FCF into negative
territory for several years. Moreover, the project may have a negative NPV as a
result of changes in taxation that decrease refining margins.
Mature upstream. Tatneft operates one of the world’s oldest oil fields –
Romashkinskoye, which still accounts for more than 50% of the company’s crude
oil production. Although the recovery ratio is unique and Tatneft has an excellent
track record of operating its mature brownfields, there is still a risk of declining
output in the future.
Tatneft shareholder structure
Source: company data, Gazprombank estimates
Tatneft key equity metrics
TATNEFT ORD -/-/-
Ticker, LSE ATAD LI
Current price (ADR) $37.9
Target price $37.2
Upside potential -2%
Recommendation NEUTRAL
TATNEFT PREF -/-/-
Ticker, MICEX TATNP RX
Current price $3.6
Target price $3.0
Upside potential -16%
Recommendation NEUTRAL
MCap $14 bln
EV $16 bln
2014E 2015E
P/E 6.7x 6.5x
EV/EBITDA 4.5x 4.3x
Source: company data, Gazprombank estimates
Tatneft share price performance
Source: Bloomberg
Others 30%
TAIF 5%
Tatarstan 61%
Treasury stock 2.5%
Management 2%
80%
90%
100%
110%
JAN-14 MAR-14 MAY-14
TATNEFT TATNEFT PREF
MICEX
Page 35
RUSSIA > OIL & GAS
JUNE 18, 2014
34
Tatneft’s key assets
Source: company data, Gazprombank
Tatneft financials, $ mln
2012 2013 2014E 2015E 2016E
Revenues 14,293 14,299 13,863 13,662 15,906
EBITDA 3,844 3,888 4,045 3,846 3,909
EBITDA margin 26.9% 27.2% 29.2% 28.2% 24.6%
Free cash flow 1,282 1,927 1,793 1,648 1,897
Financial debt 2,308 1,508 437 437 437
Net debt/EBITDA 0.5x 0.2x -0.1x -0.3x -0.5x
Oil production, mln bbl 193 194 187 187 187
Source: company data, Gazprombank estimates
Cash flow dynamics Net debt dynamics
Source: company data, Gazprombank estimates Source: company data, Gazprombank estimates
RUSSIA
OIL PRODUCTION REFINERY
TANECOREFINERY & KEY UPSTREAM
(2)
(1)
0
1
2
3
(4)
(2)
0
2
4
6
2011 2012 2013 2014E 2015E 2016E
$ BLN $ BLN
OPERATING CF CAPEX DIVIDENDS DISCRETIONARY CF
2.5
3.2
2.6
1.9
0.6
0
1
1
2
2
3
3
4
2009 2010 2011 2012 2013
$ BLN
Page 36
RUSSIA > OIL & GAS
JUNE 18, 2014
35
SIBUR
SIBUR is Russia’s largest petrochemicals company and one of the largest globally, with
a highly diversified product portfolio. SIBUR is Russia’s top refiner of APG (associated
petroleum gas), processing over 50% of the country’s total amount, and the company is
also Russia’s largest producer of liquefied petroleum gas (LPG) and methyl tert-butyl
ether (MTBE). SIBUR is a leading player in basic polymers, synthetic rubbers, and
plastic and organic synthesis products. SIBUR also ranks among the largest synthetic
rubber, polypropylene and high-density polyethylene producers. At the same time,
SIBUR is Russia’s largest refiner of APG (associated petroleum gas), processing nearly
60% of the country’s total amount. SIBUR is a private company, owned by the company
management and the same major shareholders of NOVATEK.
Corporate specific drivers
Advantageous access to APG feedstock. SIBUR’s key competitive edge is its
large and extensive APG processing and transportation infrastructure in West
Siberia, Russia’s main oil producing region. As Russia’s largest APG processor,
SIBUR is well-positioned to benefit from economies of scale, while barriers to entry
in the APG segment are high (substantial investments are required).
Benefits from favorable natural gas liquids (NGLs) pricing in Russia. NGL is a
core feedstock for the company. SIBUR benefits from access to growing supplies
of NGL that are virtually stranded in West Siberia due to infrastructural constraints
and large distances to centers of demand. Extensive NGL transportation
infrastructure in the region allows SIBUR to efficiently deliver and monetize
attractively-priced and abundant feedstock.
Low-cost petrochemicals producer. Advantageous access to feedstock – APG
and NGL – secures SIBUR’s strong position on the cost curves in petrochemicals.
The company’s new polypropylene (PP) production plant – Tobolsk-Polymer – is in
the first quartile on the global cost curve, next to average Middle East producers.
Diversified revenue mix. SIBUR’s diversified revenue (54% – energy products,
43% – petrochemicals in 2013) makes the company less vulnerable to distortions
on the standalone product market. Further, its large exposure to energy products
makes SIBUR less of a cyclical play, as compared to its domestic and international
peers typically focused only on petrochemicals.
SIBUR is at the end of a heavy investment cycle. In 2013, SIBUR completed
several projects, including Tobolsk-Polymer PP plant, one of the largest propane-
dehydrogenation facilities globally, and Ust-Luga LPG and light oils sea terminal.
The two remaining major projects – construction of the second gas fractionation
unit in Tobolsk and the raw NGL pipeline Purovsk–Pyt-Yakh–Tobolsk – are at
advanced stages and scheduled for completion in 2014-15.
Strategic cooperation with Sinopec. China Petrochemical Corporation (Sinopec
Group) and SIBUR entered into a strategic cooperation agreement during the visit of
President Putin to China. The companies also entered a JV to produce synthetic
rubbers.
Corporate investment risks
Weakness in synthetic rubber market. Global prices for butadiene-based
synthetic rubbers declined over 30% YoY in 2013 amid low demand, and the
market remains challenging. The negative impact of the rubber market is mitigated
by a diversified product portfolio: synthetic rubbers accounted for 12% of SIBUR’s
revenues in 2013.
Possible pressure on free cash flow due to high capex. SIBUR is considering
greenfield construction of an integrated cracker/basic polymers production complex in
Tobolsk that may cost up to $10 bln and exert pressure on free cash flow, limiting
potential credit ratings upside. The investment decision may be made in 2014.
SIBUR shareholder structure
Source: company data, Gazprombank
Source: company data, Gazprombank estimates
Source: Bloomberg, Gazprombank estimates
SIBUR18 spread vs. GAZPRU18, bps
Source: Bloomberg, Gazprombank estimates
KEY OPERATING STATISTICS, 2013
APG processing, bln m3 19.6
Natural gas sales, bln m3 11.8
NGL sales, mln tonnes 4.8
Petrochemical product sales, mln tonnes
2.1
TICKER SIBUR Corp
Ratings -/Ba1/BB+
SIBUR management
20%
L. Mikhelson 50.2%
G. Timchenko 32.3%
300
400
500
600
700
5/3 8/1 10/30 1/28 4/28
bps SIBUR 18
Page 37
RUSSIA > OIL & GAS
JUNE 18, 2014
36
SIBUR’s key assets
Source: company data, Gazprombank
SIBUR financials, $ mln
2011 2012 2013
Revenues 8,472 8,733 8,479
EBITDA 2,942 2,593 2,408
EBITDA margin 35% 30% 28%
Free cash flow 298 (76) 157
Financial debt 2,575 3,161 3,070
Net debt/EBITDA 0.7x 1.0x 1.2x
Source: company data, Gazprombank estimates
Cash flow dynamics, $ bln Debt maturity profile as of 2013, $ bln
Source: company data, Gazprombank estimates Source: company data, Gazprombank estimates
RUSSIA
FEEDSTOCK AND ENERGY
TRANSPORTATION PETROCHEMICALS
PLASTICS, RUBBERSAND POLYMERS
TOBOLSK PLASTICSAND POLYMERS
APGREFINING FACILITIES
ORGSINTEZUST LUGA
-1.2
-0.9
-0.6
-0.3
0.0
0.3
0.6
0.9
-4.0
-3.0
-2.0
-1.0
0.0
1.0
2.0
3.0
2009 2010 2011 2012 2013
OPERATING CF CAPEX DIVIDENDS DISCRETIONARY CF (RHS)
1.3
0.2
1.3
0.3
0.0
0.5
1.0
1.5
<1y 1-2y 2-5y >5y
Page 38
RUSSIA > OIL & GAS
JUNE 18, 2014
37
OIL AND GAS SECTOR ON FINANCIAL MARKETS
Equity markets
Russia remains one of the largest EM equity markets of investable size. Based on
EPFR Global data, total assets under management (AUM) in Russian equities currently
stands at $48.2 bln, with $10.2 bln held by Russia-dedicated funds and the remaining
$38.0 bln by global funds. ETFs account for $3.9 bln of Russia-dedicated funds (38%),
with traditional funds holding the remaining $6.3 bln (62%).
Capitalization
The Russian equity market accounts for 5.1% of total EM equity AUM of $944 bln, with
the oil and gas sector accounting for 50% of Russia’s figure (oil – 33%, gas – 17%).
The Russian equity market peaked in size in 2008 at around $1.65 trln, and has
subsequently decreased by nearly two thirds since then. Total Russian equity market
capitalization currently stands at $733 bln (as of June 11 close).
Current equity free-float totals $198 bln (27% of total MCap). Foreign investors are
estimated to hold up to 70% of this amount ($139 bln), while local investors hold the
remaining 30% ($59 bln).
Russian equity MCap breakdown by sector, as of May 2014
Source: Bloomberg, Moscow Exchange, Gazprombank estimates
Trading volumes
Weekly turnover in Russian equities (local shares and DRs) averages $10-15 bln, or
$2-3 bln per day (~50% occurs outside Russia, 38% on Moscow Exchange, 11%
OTC). The gas sector accounts for the largest share of trading volumes (26%),
followed by financials (25%), oil (20%), and metals and mining (11%).
As the combined oil and gas sector accounts for 46% of traded volumes, weekly
turnover in oil and gas equities thus averages around $5.0-7.5 bln, or $1.0-1.5 bln
per day (~50% occurs outside Russia, 38% on Moscow Exchange, 11% OTC).
33%
17% 13%
13%
10%
5%
4% 3% 1% 1%
OIL
GAS
METALS AND MINING
FINANCIALS
TELECOMS
CONSUMER
UTILITIES
MEDIA & IT
TRANSPORT
MANUFACTURING
Page 39
RUSSIA > OIL & GAS
JUNE 18, 2014
38
Russian equity market trading volumes breakdown, as of May 2014
Source: Bloomberg, Moscow Exchange, Gazprombank estimates
RIOB volumes 2007 to date, $ mln MICEX volumes 2007 to date, $ mln
Source: Bloomberg, Gazprombank estimates Source: Bloomberg, Gazprombank estimates
Index dynamics
The Russian equity market has underperformed global equity indexes YTD (MICEX
-0.6% vs. MSCI EM +4.6%), largely as a result of the EM sell-off in January-
February and subsequent risk-aversion following the outbreak of the crisis in
Ukraine. However, a rally driven by deep-value investors amid receding risk
perception has given a significant lift to the Russian market, placing it among the
top EM performers in 2Q14. Although the Russian oil and gas sector was hit hard by
the initial wave of selling, it has since stood out as the best performing sector over
the past two months (RTS O&G sector index +24% since the March 14 low).
20%
26%
11%
25%
5%
4%
2% 6% 1% 0%
OIL
GAS
METALS AND MINING
FINANCIALS
TELECOMS
CONSUMER
UTILITIES
MEDIA & IT
TRANSPORT
MANUFACTURING
0
500
1,000
1,500
2,000
2,500
3,000
3,500
4,000
4,500
2007 2008 2009 2010 2011 2012 2013 20140
500
1,000
1,500
2,000
2,500
3,000
3,500
4,000
4,500
5,000
2007 2008 2009 2010 2011 2012 2013 2014
Page 40
RUSSIA > OIL & GAS
JUNE 18, 2014
39
RTS O&G Index vs RTS Index, YTD
Source: Bloomberg, Gazprombank estimates
We note that contrarian investors may be focusing on Russia as a deep-value play
(‘14E P/BV of 0.7x, just half the EM average of 1.4x) as well as one of the best
markets in which to receive dividends (‘14E MICEX dividend yield of 4.5% vs. the EM
average of 2.9%).
YTD equity index performance RTS Index vs Brent, YTD
Source: Bloomberg, Gazprombank estimates Source: Bloomberg, Gazprombank estimates
Exchanges
Moscow Exchange (MOEX), formed by the 2011 merger of the MICEX and RTS, is
Russia’s largest securities exchange. As of end 2013, MOEX had 722 issuers admitted
to trading in its securities section.
MOEX is among the world’s largest public exchanges by MCap ($3.34 bln) and boasts
above-average profitability with an EBITDA margin of 66% (2013). Among world peers,
MOEX ranks 21st by equity MCap of traded securities ($663 bln as of 1Q14 according
to WFE data) and 21st by equity trading volume (as of 1Q14).
MOEX represents a vertically integrated platform that combines pre-trading, trading and
post-trading services. It incorporates various types of products with both cyclical (stocks
and bonds) and counter-cyclical (money market and FX) behavior along with unified
clearing for all. MOEX also provides settlement and safekeeping services.
75%
80%
85%
90%
95%
100%
105%
JAN
14
FE
B 1
4
MA
R 1
4
AP
R 1
4
MA
Y 1
4
JUN
14
RTS O&G INDEX RTS INDEX
-10%
-5%
0%
5%
10%
15%
20%
25%
INDIA TURKEY BRAZIL US MSCI EM
MSCI WORLD
CHINA MSCI RUSSIA
JAPAN
75%
80%
85%
90%
95%
100%
105%
110%
JAN
14
FE
B 1
4
MA
R 1
4
AP
R 1
4
MA
Y 1
4
JUN
14
BRENT, $/BBL RTS INDEX
Page 41
RUSSIA > OIL & GAS
JUNE 18, 2014
40
Depository receipts (DRs) based on local shares are also traded globally, with listings
and OTC trading in London (LSE), New York (NYSE, Nasdaq) and Frankfurt (DAX). A
few stocks, such as RUSAL (Hong Kong), Evraz (London) and Yandex (New York),
have direct listings on foreign markets with no local analogs.
MOEX vertically integrated model
Source: company data, Gazprombank
Tax and regulatory reform
Since December 2012, Russian authorities have approved several changes to the Tax
Code, the Law on Joint-Stock Companies and the Law on Securities Markets. Starting
January 1, 2014, dividends should be paid out 25 days after a GM is held (10 days to
nominal holders), compared with 60 days previously. This allows for the setting of
separate record dates for dividends and GMs. In addition, some tax breaks for private
long-term holders of equity are likely to be introduced. Although the shorter time frame
for dividend payments and greater flexibility for companies to set record dates are
indeed positive developments, we believe they are likely to have a significant impact on
trading only starting in 2015.
The main upcoming event for the Russian equity market is the introduction in July of
equity settlements through Euroclear and Clearstream, which will simplify the process of
trading in Russian equities for a wider global investor base.
PRE-TRADING
TRADING POST-TRADING
Pre-order
validation
Risk analysis
Information services
Access and risk
management
Risk
management
Settlement
Clearing (NCC-CCP)
Unified risk management
Collateral (cash, FX, securities)
Settlement
Depository (CSD)
Repo collateral management
Repository for OTC trades
Page 42
RUSSIA > OIL & GAS
JUNE 18, 2014
41
APPENDIX
Russian oil and gas sector valuation GPB
RATING CLOSING PRICE, $
MARKET CAP, $ MLN
PERFORMANCE, $ EV/EBITDA P/E EV/PRODUCTION EV/RESERVES
DIVIDEND YIELD, 14 5D 1M YTD 2014 2015 2014 2015 2014 2015
RUSSIAN OIL COMPANIES
Bashneft N 71.3 13,906 1% 13% 16% 4.3х 4.6х 6.8х 6.8х 135х 131х 7.9х 8.5%
Gazprom Neft n/r 4.4 20,929 3% 9% -2% 3.1х 2.8х 4.0х 4.0х 61х 58х 2.9х 3.5%
Lukoil OW 62.0 52,735 3% 12% -1% 2.8х 2.5х 3.9х 3.5х 69х 65х 3.6х 2.8%
Rosneft N 7.3 77,450 5% 11% -5% 4.5х 4.0х 5.6х 5.2х 84х 81х 6.3х 5.1%
SurgutNG N 0.8 34,473 2% 10% -7% 0.3х 0.3х 8.9х 9.3х 9х 9х 0.8х 2.2%
Tatneft N 6.3 14,315 2% 3% -2% 4.5х 4.3х 6.7х 6.5х 84х 84х 2.5х 3.8%
Average
3.3х 3.1х 6.0х 5.9х 74х 71х 4.0х 4.3%
RUSSIAN GAS COMPANIES
Gazprom OW 4.2 99,170 2% 5% 0% 2.4х 2.5х 3.0х 3.1х 40х 40х 1.2х 5.0%
NOVATEK OW 11.8 35,739 -1% 12% -5% 8.9х 8.2х 11.3х 9.8х 88х 78х 2.6х 1.1%
Average
5.7х 5.4х 7.1х 6.5х 64х 59х 1.9х 3.0%
RUSSIAN PIPELINE COMPANIES
Transneft pref N 2182.1 15,497 -2% -8% -15% 3.0х 3.1х 2.1х 2.1х n/a n/a n/a 1.0%
RUSSIAN OFS COMPANIES
EDC OW 31.1 4,565 -3% 10% -33% 5.3х 5.0х 10.2х 9.8х n/a n/a n/a 2.9%
IGSS OW 20.1 209 -26% -28% -33% 3.5х 3.1х 6.9х 4.3х n/a n/a n/a 0.0%
C.A.T. Oil OW 25.3 1,235 0% 19% -9% 8.6х 6.6х 17.4х 13.2х n/a n/a n/a 0.9%
PREFERRED SHARES
Bashneft OW 53.3 1,588 1% 21% 23% 11.4%
SurgutNG OW 0.8 6,282 2% 13% 3% 8.3%
Tatneft N 3.6 534 1% 2% -1% 6.6%
Average 8.8%
EMERGING MARKET OILS
PetroChina n/r 1.2 224,206 1% 3% 12% 5.2х 4.9х 10.4х 10.0х 222х 213х 14.3х 3.4%
Petrobras n/r 8.5 106,878 8% 5% 18% 6.3х 5.1х 9.3х 7.1х 209х 200х 15.6х 4.1%
Kunlun n/r 1.6 13,310 3% 5% -4% 7.1х 6.2х 13.0х 11.6х 850х 850х 18.5х 2.1%
Sinopec n/r 1.0 100,857 4% 6% 19% 4.9х 4.5х 8.4х 7.7х 341х 329х 40.1х 3.3%
YPF n/r 39.5 15,543 2% 12% -5% 4.4х 3.4х 14.8х 11.2х 106х 106х 19.1х 0.3%
CNOOC n/r 1.8 80,065 4% 4% -3% 3.9х 3.5х 8.8х 8.4х 219х 219х 24.6х 2.9%
PTT EP n/r 5.2 20,490 5% 5% -1% 4.0х 3.8х 10.0х 9.6х 195х 195х 24.6х 3.9%
ONGC n/r 7.1 60,726 -8% 11% 51% 6.6х 5.6х 13.7х 11.2х 154х 154х 9.2х 2.8%
SasolLtd n/r 60.0 39,052 1% 2% 17% 6.8х 6.6х 11.8х 11.6х 475х 475х 26.0х 0.0%
MOL n/r 56.2 5,869 -4% -5% -16% 4.6х 4.3х 9.7х 8.8х 264х 264х 16.6х 3.7%
KazMunaiGas EP n/r 15.4 6,501 -3% 2% -1% 3.4х 3.6х 4.8х 5.7х 31х 31х 0.7х 8.8%
Average 5.2х 4.7х 10.4х 9.4х 279х 276х 19.0х 3.2%
DEVELOPED MARKETS MAJORS
BP n/r 51.5 158,248 2% 2% 7% 4.8х 4.6х 10.6х 10.1х 161х 155х 10.8х 4.6%
Chevron n/r 127.8 243,269 2% 3% 2% 4.8х 4.7х 11.8х 11.5х 259х 245х 21.9х 3.3%
ConocoPhillips n/r 83.3 102,249 3% 6% 19% 5.0х 4.9х 13.0х 12.9х 209х 194х 13.6х 3.4%
ENI n/r 26.5 96,405 2% 4% 10% 4.1х 3.8х 15.4х 13.0х 217х 206х 17.9х 5.7%
ExxonMobil n/r 102.8 441,529 1% 2% 2% 6.2х 6.3х 13.3х 13.6х 312х 306х 18.5х 2.6%
RD Shell n/r 40.4 262,048 1% 2% 13% 5.0х 4.8х 11.3х 11.0х 262х 256х 22.4х 4.6%
Statoil n/r 31.9 101,766 3% 5% 32% 2.9х 2.8х 12.2х 12.2х 160х 156х 20.6х 3.8%
Total n/r 71.1 169,198 1% 2% 17% 4.8х 4.5х 11.3х 10.7х 242х 224х 17.3х 4.7%
Average
4.7х 4.5х 12.4х 11.9х 228х 218х 17.9х 4.1%
Source: Bloomberg data as of June16, Gazprombank estimates
Page 43
RUSSIA > OIL & GAS
JUNE 18, 2014
42
Foreign investors’ exposure to EM local currency non-government debt markets
Eurobond market structure by industry Local bond market structure by industry
Source: Gazprombank Source: Gazprombank
O&G Eurobonds placements and maturity schedule, $ bln O&G Local bonds placements and maturity schedule*, $ bln
Source: central banks, national treasuries, Gazprombank estimates * 2015-20 maturities assumes 100% execution of put options
Source: central banks, national treasuries, Gazprombank estimates
O&G eurobond G-Spread deviations from 1Y average O&G EM universe relative positioning
Source: central banks, national treasuries, Gazprombank estimates Source: central banks, national treasuries, Gazprombank estimates
78 29
55 8
17
4
10
4
9
3
4
3 4
Financials
Oil&Gas
Metals&Mining
Transport TMT
$172 bn
Gazprom
Lukoil
Gazprom Neft TNK BP Rosneft
Novatek Other
Other $55 bn
76
5
18
5
12 3
12 2
11 2
10 1
12 1
Financials
Oil&Gas
Transport
TMT Metals&Mining
$151 bn
Transneft
Rosneft
Bashneft
Gazprom
Gazprom Neft Novatek
Other Other
$18 bn
Utilities
-15
-10
-5
0
5
10
15
20
2007
2008
2009
2010
2011
2012
2013
2014
2015
2016
2017
2018
2019
2020
PLACEMENTS REDEMPTIONS
-6
-4
-2
0
2
4
6
8
10
2007
2008
2009
2010
2011
2012
2013
2014
2015
2016
2017
2018
2019
2020
PLACEMENTS REDEMPTIONS
-80
-60
-40
-20
0
LUK
OIL
18
NO
VA
TE
K 2
1 S
IBN
EF
T 2
2 S
IBU
R 1
8 B
OR
ET
S 1
8 G
AZ
PR
OM
28
RO
SN
EF
T 2
2 N
OV
AT
EK
22
LUK
OIL
19
TR
AN
SN
EF
T 1
8 LU
KO
IL 2
0 G
AZ
PR
OM
21
GA
ZP
RO
M 2
0 G
AZ
PR
OM
22
6.51
LU
KO
IL 2
3 G
AZ
PR
OM
22
4.95
G
AZ
PR
OM
18
LUK
OIL
17
GA
ZP
RO
M 3
7 LU
KO
IL 2
2
GA
ZP
RO
M 3
4 G
AZ
PR
OM
19
SIB
NE
FT
23
RO
SN
EF
T 1
7 T
NK
18
TN
K 2
0 E
DC
20
TN
K 1
7
BPS
VOSTOK 20
GAZPRU 4.95 22 LUKOIL 22
NVTKRM 22 ROSNRM 22 SIBNEF 22
EDCLLI 20 SIBUR 18
100
200
300
400
500
600
700
0.0 0.5 1.0 1.5 2.0 2.5 3.0
Z-SPREAD, BPS
NET DEBT/ LTM EBITDA
Page 44
HQ: 16/1 Nametkina St., Moscow 117420, Russia. Office: 7 Koroviy val St.
Copyright © 2003-2014. Gazprombank (Open Joint Stock Company). All rights reserved
This report has been prepared by the analysts of Gazprombank (Open Joint Stock Company) (hereinafter — Gazprombank) and is based on information obtained from public sources believed to be reliable, but is not guaranteed as necessarily being
accurate. With the exception of information directly pertaining to Gazprombank, the latter shall not be liable for the accuracy or completeness of any information shown herein. All opinions and judgments herein represent solely analysts’ personal opinion
regarding the events and situations described and analyzed in this report. They should not be regarded as Gazprombank’s position and are subject to change without notice, also in connection with new corporate or market events that may transpire.
Gazprombank shall be under no obligation to update, amend this report or otherwise notify anyone of any such changes. The financial instruments mentioned herein may be unsuitable for certain categories of investors. This report should not be the only
basis used when adopting an investment decision. Investors should make investment decisions at their own discretion, inviting independent consultants, if necessary, for their specific interests and objectives. The authors shall not be liable for any actions
resulting from the use of this report. Any information contained herein or in the appendices hereto shall not to be construed as a solicitation or an offer to buy or sell any securities or advertisement, unless otherwise expressly stated herein or in the
appendices hereto.
Research Department
+7 (495) 983 18 00
EQUITY SALES
+7 (495) 988 23 75
EQUITY TRADING
+7 (495) 988 24 10
FIXED INCOME SALES
+7 (495) 983 18 80
FIXED INCOME TRADING
+7 (499) 271 91 04