HAL Id: tel-01767494 https://tel.archives-ouvertes.fr/tel-01767494 Submitted on 16 Apr 2018 HAL is a multi-disciplinary open access archive for the deposit and dissemination of sci- entific research documents, whether they are pub- lished or not. The documents may come from teaching and research institutions in France or abroad, or from public or private research centers. L’archive ouverte pluridisciplinaire HAL, est destinée au dépôt et à la diffusion de documents scientifiques de niveau recherche, publiés ou non, émanant des établissements d’enseignement et de recherche français ou étrangers, des laboratoires publics ou privés. Méthodologie instrumentale à l’échelle atomique pour une meilleure compréhension des mécanismes de ségrégation intergranulaire dans les aciers : application au phosphore. Alfiia Akhatova To cite this version: Alfiia Akhatova. Méthodologie instrumentale à l’échelle atomique pour une meilleure compréhension des mécanismes de ségrégation intergranulaire dans les aciers : application au phosphore.. Science des matériaux [cond-mat.mtrl-sci]. Normandie Université, 2017. Français. NNT: 2017NORMR131. tel-01767494
Transcript
HAL Id: tel-01767494https://tel.archives-ouvertes.fr/tel-01767494
Submitted on 16 Apr 2018
HAL is a multi-disciplinary open accessarchive for the deposit and dissemination of sci-entific research documents, whether they are pub-lished or not. The documents may come fromteaching and research institutions in France orabroad, or from public or private research centers.
L’archive ouverte pluridisciplinaire HAL, estdestinée au dépôt et à la diffusion de documentsscientifiques de niveau recherche, publiés ou non,émanant des établissements d’enseignement et derecherche français ou étrangers, des laboratoirespublics ou privés.
Méthodologie instrumentale à l’échelle atomique pourune meilleure compréhension des mécanismes de
ségrégation intergranulaire dans les aciers : applicationau phosphore.
Alfiia Akhatova
To cite this version:Alfiia Akhatova. Méthodologie instrumentale à l’échelle atomique pour une meilleure compréhensiondes mécanismes de ségrégation intergranulaire dans les aciers : application au phosphore.. Sciencedes matériaux [cond-mat.mtrl-sci]. Normandie Université, 2017. Français. �NNT : 2017NORMR131�.�tel-01767494�
[3] The Pressurized Water Reactor (PWR), (n.d.). https://www.nrc.gov/reading-rm/basic-ref/students/animated-pwr.html (accessed March 30, 2017).
[4] Assessment and Management of Ageing of Major Nuclear Power Plant Components Important to Safety: Steam Generators, International Atomic Energy Agency, Vienna, 2011.
[5] Integrity of Reactor Pressure Vessels in Nuclear Power Plants: Assessment of Irradiation Embrittlement Effects in Reactor Pressure Vessel Steels, International Atomic Energy Agency, Vienna, 2009.
[6] N. Soneda, Irradiation Embrittlement of Reactor Pressure Vessels (RPVs) in Nuclear Power Plants, Elsevier, 2014.
[7] PRIS – Miscellaneous reports – Operational by Age, (n.d.). https://www.iaea.org/PRIS/WorldStatistics/OperationalByAge.aspx (accessed February 5, 2016).
[8] A. Chabre, Research nuclear reactors: a nuclear energy division monograph, CEA Saclay and Groupe Moniteur, Paris, 2012.
[9] B.A. Gurovich, E.A. Kuleshova, Y.I. Shtrombakh, D.Y. Erak, A.A. Chernobaeva, O.O. Zabusov, Fine structure behaviour of VVER-1000 RPV materials under irradiation, J. Nucl. Mater. 389 (2009) 490–496. doi:10.1016/j.jnucmat.2009.02.002.
[10] E.A. Kuleshova, A.D. Erak, A.S. Kiselev, S.A. Bubyakin, A.P. Bandura, Influence of operation factors on brittle fracture initiation and critical local normal stress in SE(B) type specimens of VVER reactor pressure vessel steels, J. Nucl. Mater. 467, Part 2 (2015) 927–936. doi:10.1016/j.jnucmat.2015.10.037.
[11] D. Erak, B. Gurovich, D. Zhurko, Improvement of radiation embrittlement dependences for VVER-1000 Pressure Vessel materials on service-life extension, in: Manchester, UK, 2015. Available at: https://repository.lib.ncsu.edu/bitstream/handle/1840.20/33782/SMiRT-23_Paper_383.pdf?sequence=1&isAllowed=y.
[12] F.W. Noble, B.A. Senior, B.L. Eyre, The effect of phosphorus on the ductility of 9Cr-1Mo steels, Acta Metall. Mater. 38 (1990) 709–717. doi:10.1016/0956-7151(90)90022-9.
33
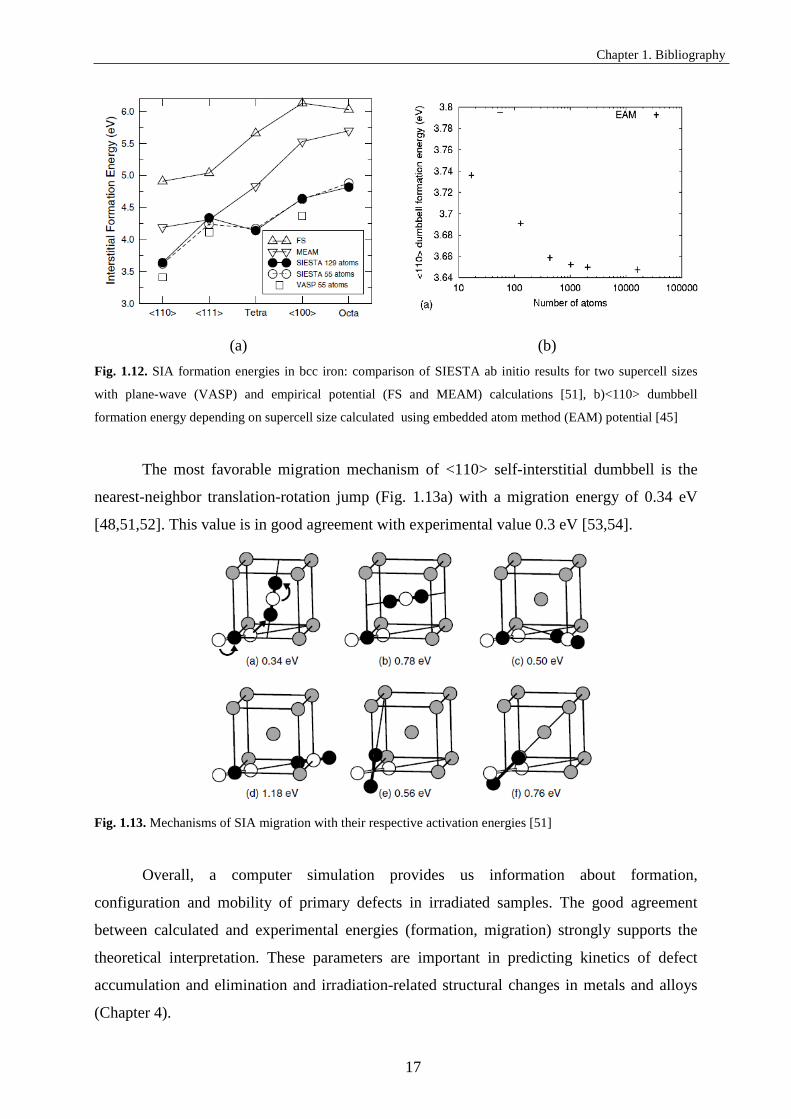
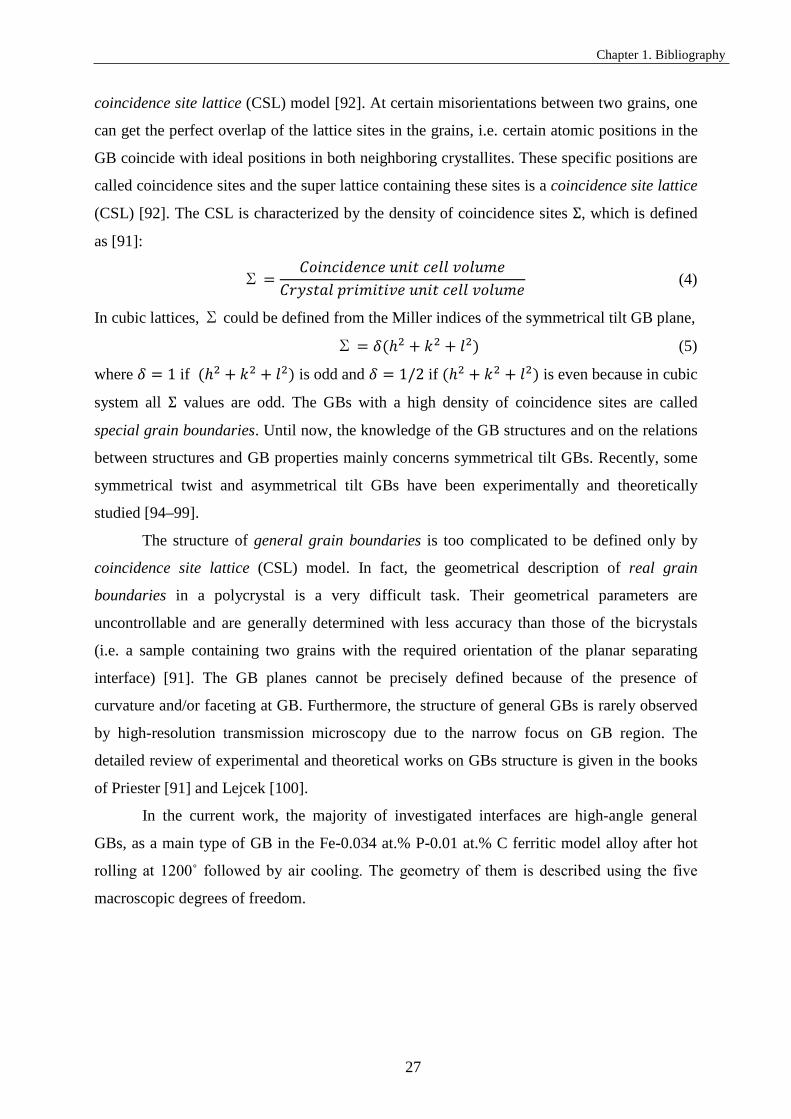
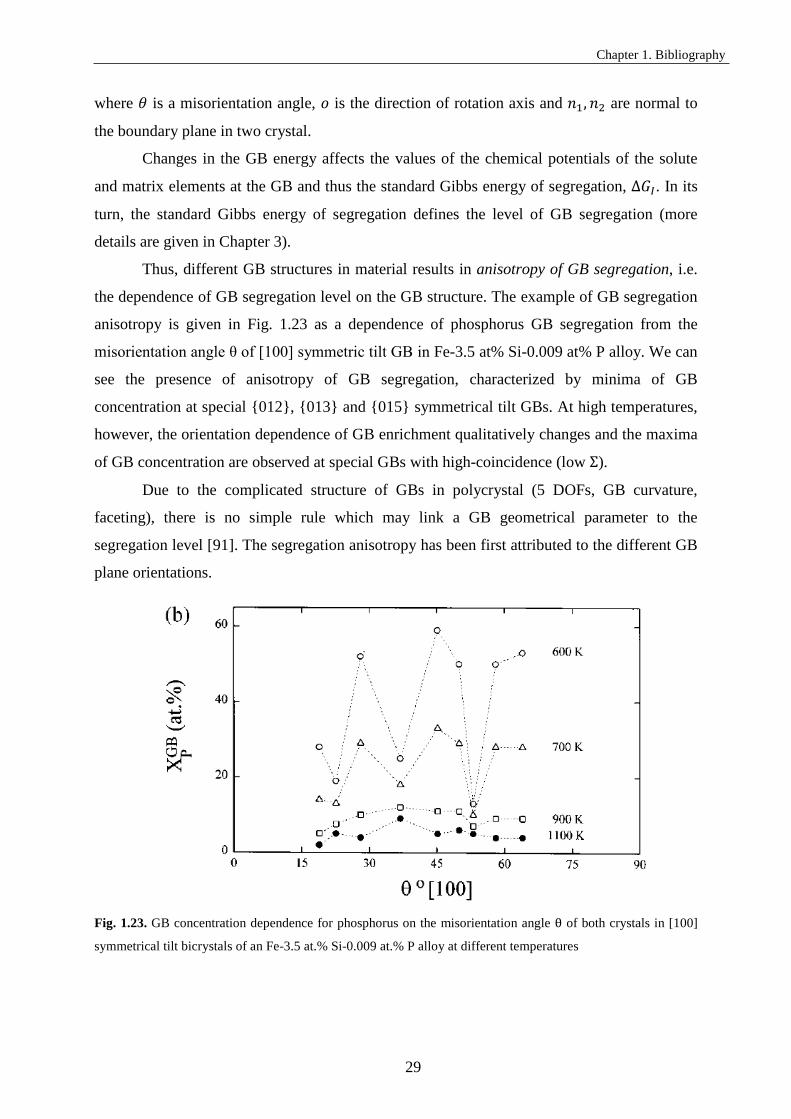
Chapter 1. Bibliography
[13] Q. Li, L. Li, E. Liu, D. Liu, X. Cui, Temper embrittlement dynamics induced by non-equilibrium segregation of phosphorus in steel 12Cr1MoV, Scr. Mater. 53 (2005) 309–313. doi:10.1016/j.scriptamat.2005.04.011.
[14] C.L. Briant, S.K. Banerji, Intergranular failure in steel: the role of grain-boundary composition, Int. Met. Rev. 23 (1978) 164–199. doi:10.1179/imtr.1978.23.1.164.
[15] C. Naudin, J.M. Frund, A. Pineau, Intergranular fracture stress and phosphorus grain boundary segregation of a Mn-Ni-Mo steel, Scr. Mater. 40 (1999) 1013–1019. doi:10.1016/S1359-6462(99)00069-X.
[16] H. Nakata, K. Fujii, K. Fukuya, R. Kasada, A. Kimura, Grain Boundary Phosphorus Segregation in Thermally Aged Low Alloy Steels, J. Nucl. Sci. Technol. 43 (2006) 785–793. doi:10.1080/18811248.2006.9711160.
[17] S.-H. Song, H. Zhuang, J. Wu, L.-Q. Weng, Z.-X. Yuan, T.-H. Xi, Dependence of ductile-to-brittle transition temperature on phosphorus grain boundary segregation for a 2.25Cr1Mo steel, Mater. Sci. Eng. A. 486 (2008) 433–438. doi:10.1016/j.msea.2007.09.032.
[18] M. Hashimoto, Y. Ishida, R. Yamamoto, M. Doyama, T. Fujiwara, Atomic and electronic structures of a grain boundary in iron with impurity segregation, Surf. Sci. 144 (1984) 182–195. doi:10.1016/0039-6028(84)90714-3.
[19] R. Wu, A.J. Freeman, G.B. Olson, On the electronic basis of the phosphorus intergranular embrittlement of iron, J. Mater. Res. 7 (1992) 2403–2411. doi:10.1557/JMR.1992.2403.
[20] Y.F. Migal, V.I. Kolesnikov, I.V. Kolesnikov, Impurity and alloying elements on grain surface in iron: Periodic dependence of binding energy on atomic number and influence on wear resistance, Comput. Mater. Sci. 111 (2016) 503–512. doi:10.1016/j.commatsci.2015.10.003.
[21] S. Rosinski, Review of Phosphorus Segregation and Intergranular Embrittlement in Reactor Pressure Vessel Steels (PWRMRP-19): PWR Material Reliability Project (PWRMRP), EPRI, Palo Alto, CA, 2000.
[22] S.G. Druce, G. Gage, G. Jordan, Effect of ageing on properties of pressure vessel steels, Acta Metall. 34 (1986) 641–652. doi:10.1016/0001-6160(86)90179-3.
[23] Z. Zhai, Y. Miyahara, H. Abe, Y. Watanabe, Segregation behavior of phosphorus in the heat-affected zone of an A533B/A182 dissimilar weld joint before and after simulated thermal aging, J. Nucl. Mater. 452 (2014) 133–140. doi:10.1016/j.jnucmat.2014.05.005.
[24] M. Tabuchi, H. Okada, M. Kondo, S. Tsukamoto, F. Abe, N.I. for M. Science, L. Sumitomo Metal Industries, L. Mitsubishi, Heavy Industries, Welded joint of tempered
34
Chapter 1. Bibliography
martensite based heat-resistant steel, 2004. Available at: https://www.google.com/patents/EP1621643A1?cl=en (accessed March 31, 2017).
[25] Gage G., Druce S.G., Popkiss E.W., Effect of ageing on properties of pressure vessel steels, Acta Metall., vol 34 (1986) pp 641-652. doi: 10.1016/0001-6160(86)90179-3
[26] P.A. Platonov, A.A. Chernobaeva, Formation of radiation induced precipitates in VVER RPV materials, Int. J. Press. Vessels Pip. 148 (2016) 36–45. doi:10.1016/j.ijpvp.2016.11.001.
[27] Y. Nishiyama, K. Onizawa, M. Suzuki, J.W. Anderegg, Y. Nagai, T. Toyama, M. Hasegawa, J. Kameda, Effects of neutron-irradiation-induced intergranular phosphorus segregation and hardening on embrittlement in reactor pressure vessel steels, Acta Mater. 56 (2008) 4510–4521. doi:10.1016/j.actamat.2008.05.026.
[28] C. English, Final report of the PISA project: phosphorus influence on steels ageing (PISA), European Comission, 2005.
[29] C. English, S. Ortner, G. Gage, W. Server, S. Rosinski, Review of Phosphorus Segregation and Intergranular Embrittlement in Reactor Pressure Vessel Steels, in: S. Rosinski, M. Grossbeck, T. Allen, A. Kumar (Eds.), Eff. Radiat. Mater. 20th Int. Symp., ASTM International, 100 Barr Harbor Drive, PO Box C700, West Conshohocken, PA 19428-2959, 2001: pp. 151-151–23. doi:10.1520/STP10531S.
[30] C. Lu, T. Yang, K. Jin, N. Gao, P. Xiu, Y. Zhang, F. Gao, H. Bei, W.J. Weber, K. Sun, Y. Dong, L. Wang, Radiation-induced segregation on defect clusters in single-phase concentrated solid-solution alloys, Acta Mater. 127 (2017) 98–107. doi:10.1016/j.actamat.2017.01.019.
[31] C.M. Barr, G.A. Vetterick, K.A. Unocic, K. Hattar, X.-M. Bai, M.L. Taheri, Anisotropic radiation-induced segregation in 316L austenitic stainless steel with grain boundary character, Acta Mater. 67 (2014) 145–155. doi:10.1016/j.actamat.2013.11.060.
[32] H. Wiedersich, P.R. Okamoto, N.Q. Lam, A theory of radiation-induced segregation in concentrated alloys, J. Nucl. Mater. 83 (1979) 98–108. doi:10.1016/0022-3115(79)90596-8.
[33] T.R. Allen, J.T. Busby, G.S. Was, E.A. Kenik, On the mechanism of radiation-induced segregation in austenitic Fe–Cr–Ni alloys, J. Nucl. Mater. 255 (1998) 44–58. doi:10.1016/S0022-3115(98)00010-5.
[34] V. Kuksenko, Model oriented irradiation experiments in Fe-Cr model alloys, PhD thesis, Université de Rouen, 2011.
[35] W.G. Wolfer, 1.01 - Fundamental Properties of Defects in Metals A2 - Konings, Rudy J.M., in: Compr. Nucl. Mater., Elsevier, Oxford, 2012: pp. 1–45.
35
Chapter 1. Bibliography
[36] R.E. Stoller, L.R. Greenwood, Subcascade formation in displacement cascade simulations: Implications for fusion reactor materials, J. Nucl. Mater. 271–272 (1999) 57–62. doi:10.1016/S0022-3115(98)00730-2.
[37] G.S. Was, Fundamentals of Radiation Materials Science: Metals and Alloys, Springer, 2007.
[38] G.H. Kinchin, R.S. Pease, The mechanism of the irradiation disordering of alloys, J. Nucl. Energy 1954. 1 (1955) 200–202. doi:10.1016/0891-3919(54)90016-9.
[39] Seeger A., On the theory of radiation damage and radiation hardening, in: Proc. Second U. N. Int. Conf. Peac. Uses At. Energy, Geneva, 1958.
[41] ASTM standart E521-96. Standard practice for neutron radiation damage simulation by charged-particle irradiation, 2009.
[42] P. Olsson, C.S. Becquart, C. Domain, Ab initio threshold displacement energies in iron, Mater. Res. Lett. 4 (2016) 219–225. doi:10.1080/21663831.2016.1181680.
[43] A. Hardouin Duparc, C. Moingeon, N. Smetniansky-de-Grande, A. Barbu, Microstructure modelling of ferritic alloys under high flux 1 MeV electron irradiations, J. Nucl. Mater. 302 (2002) 143–155. doi:10.1016/S0022-3115(02)00776-6.
[44] L. Malerba, Molecular dynamics simulation of displacement cascades in α-Fe: A critical review, J. Nucl. Mater. 351 (2006) 28–38. doi:10.1016/j.jnucmat.2006.02.023.
[45] C. Domain, C.S. Becquart, Ab initio calculations of defects in Fe and dilute Fe-Cu alloys, Phys. Rev. B. 65 (2001). doi:10.1103/PhysRevB.65.024103.
[46] A. Vehanen, P. Hautojärvi, J. Johansson, J. Yli-Kauppila, P. Moser, Vacancies and carbon impurities in α - iron: Electron irradiation, Phys. Rev. B. 25 (1982) 762–780. doi:10.1103/PhysRevB.25.762.
[47] A.A. Vasiliev, V.V. Rybin, A.A. Zisman, The nature of the phosphorus atom mobility in bcc iron irradiated at low temperatures, J. Nucl. Mater. 231 (1996) 249–253. doi:10.1016/0022-3115(96)00201-2.
[48] R.A. Johnson, Interstitials and Vacancies in α Iron, Phys. Rev. 134 (1964) A1329–A1336. doi:10.1103/PhysRev.134.A1329.
[49] G.J. Ackland, D.J. Bacon, A.F. Calder, T. Harry, Computer simulation of point defect properties in dilute Fe—Cu alloy using a many-body interatomic potential, Philos. Mag. A. 75 (1997) 713–732. doi:10.1080/01418619708207198.
36
Chapter 1. Bibliography
[50] J.M. Soler, E. Artacho, J.D. Gale, A. García, J. Junquera, P. Ordejón, Daniel Sánchez-Portal, The SIESTA method for ab initio order- N materials simulation, J. Phys. Condens. Matter. 14 (2002) 2745. doi:10.1088/0953-8984/14/11/302.
[51] C.-C. Fu, F. Willaime, P. Ordejón, Stability and Mobility of Mono- and Di-Interstitials in α -Fe, Phys. Rev. Lett. 92 (2004). doi:10.1103/PhysRevLett.92.175503.
[52] F. Willaime, C.C. Fu, M.C. Marinica, J. Dalla Torre, Stability and mobility of self-interstitials and small interstitial clusters in α-iron: ab initio and empirical potential calculations, Nucl. Instrum. Methods Phys. Res. Sect. B Beam Interact. Mater. At. 228 (2005) 92–99. doi:10.1016/j.nimb.2004.10.028.
[53] P. Paufler, R. W. Cahn, P. Haasen (eds). Physical metallurgy 3rd revised and enlarged edition. North-Holland physics publishing, Amsterdam, Oxford, New York, Tokyo 1983. doi:10.1002/crat.2170200229.
[54] H. Ullmaier, ed., Atomic Defects in Metals, Springer-Verlag, Berlin, 1991. doi:10.1007/b37800.
[55] Druce S.G., English C.A., Foreman A.J.E., McElroy R.J., Vatter E.A., Bolton C.J., Buswell J.T., Jones R.B., The modelling of irradiation-enhanced phosphorus segregation in neutron irradiated reactor pressure vessel submerged-arc weld, in: Eff. Radiat. Mater. 17th Int. Symp. ASTM, West Conshohocken, PA, 1996.
[57] S.M. Murphy, J.M. Perks, Analysis of phosphorus segregation in ion-irradiated nickel, J. Nucl. Mater. 171 (1990) 360–372. doi:10.1016/0022-3115(90)90382-W.
[58] H. Hurchand, S.D. Kenny, C.F. Sanz-Navarro, R. Smith, P.E.J. Flewitt, The influence of P solutes on an irradiated α-Fe matrix, Nucl. Instrum. Methods Phys. Res. Sect. B Beam Interact. Mater. At. 229 (2005) 92–102. doi:10.1016/j.nimb.2004.11.010.
[59] E. Meslin, C.-C. Fu, A. Barbu, F. Gao, F. Willaime, Theoretical study of atomic transport via interstitials in dilute Fe − P alloys, Phys. Rev. B. 75 (2007). doi:10.1103/PhysRevB.75.094303.
[60] C. Domain, C.S. Becquart, Diffusion of phosphorus in α-Fe: An ab initio study, Phys. Rev. B. 71 (2005) 214109. doi:10.1103/PhysRevB.71.214109.
[61] S.M.J. Gordon, H. Hurchand, S.D. Kenny, R. Smith, Diffusion of radiation damage in Fe–P systems, Nucl. Instrum. Methods Phys. Res. Sect. B Beam Interact. Mater. At. 228 (2005) 131–136. doi:10.1016/j.nimb.2004.10.034.
37
Chapter 1. Bibliography
[62] S. Song, R.G. Faulkner, Diffusion Characteristics of Interstitial and Vacancy Based Complexes, Defect Diffus. Forum. 143–147 (1997) 149–154. doi:10.4028/www.scientific.net/DDF.143-147.149.
[63] Z. Lu, R.G. Faulkner, Irradiation Assisted Grain Boundary Segregation in Steels, Materials Research Society, Warrendale, PA, USA, 2008.
[64] R.G. Faulkner, S. Song, P.E.J. Flewitt, A model describing neutron irradiation-induced segregation to grain boundaries in dilute alloys, Metall. Mater. Trans. A. 27 (1996) 3381–3390. doi:10.1007/BF02595431.
[65] S. Song, Radiation-induced grain boundary segregation in dilute alloys, PhD thesis, Loughborough University, UK, 1995. Available at: https://dspace.lboro.ac.uk/dspace-jspui/handle/2134/10475 (accessed April 28, 2017).
[66] R.G. Faulkner, N.C. Waite, E.A. Little, T.S. Morgan, Radiation-induced grain boundary segregation in dilute alloys, Mater. Sci. Eng. A. 171 (1993) 241–248. doi:10.1016/0921-5093(93)90411-7.
[67] R.G. Faulkner, S. Song, P.E.J. Flewitt, M. Victoria, P. Marmy, Grain boundary segregation under neutron irradiation in dilute alloys, J. Nucl. Mater. 255 (1998) 189–209. doi:10.1016/S0022-3115(98)00022-1.
[69] G.J. Ackland, M.I. Mendelev, D.J. Srolovitz, S. Han, A.V. Barashev, Development of an interatomic potential for phosphorus impurities in -iron, J. Phys. Condens. Matter. 16 (2004) S2629–S2642. doi:10.1088/0953-8984/16/27/003.
[70] L. Messina, M. Nastar, T. Garnier, C. Domain, P. Olsson, Exact ab initio transport coefficients in bcc Fe − X ( X = Cr , Cu , Mn , Ni , P , Si ) dilute alloys, Phys. Rev. B. 90 (2014). doi:10.1103/PhysRevB.90.104203.
[71] L. Messina, M. Nastar, P. Olsson, Ab initio-based investigation of solute-dumbbell transport and radiation induced segregation in Fe-X (X= Cr, Cu, Mn, Ni, P, Si) dilute alloys, (2015).
[72] M. Nastar, F. Soisson, 1.18 - Radiation-Induced Segregation, in: R.J.M. Konings (Ed.), Compr. Nucl. Mater., Elsevier, Oxford, 2012.
[73] L.E. Rehn, P.R. Okamoto, D.I. Potter, H. Wiedersich, Effect of solute misfit and temperature on irradiation-induced segregation in binary Ni alloys, J. Nucl. Mater. 74 (1978) 242–251. doi:10.1016/0022-3115(78)90363-X.
38
Chapter 1. Bibliography
[74] P.R. Okamoto, L.E. Rehn, Radiation-induced segregation in binary and ternary alloys, J. Nucl. Mater. 83 (1979) 2–23. doi:10.1016/0022-3115(79)90587-7.
[75] P.R. Okamoto, H. Wiedersich, Segregation of alloying elements to free surfaces during irradiation, J. Nucl. Mater. 53 (1974) 336–345. doi:10.1016/0022-3115(74)90267-0.
[76] H. Takahashi, S. Ohnuki, T. Takeyama, Radiation-induced segregation at internal sinks in electron irradiated binary alloys, J. Nucl. Mater. 104 (1981) 1415–1419. doi:10.1016/0022-3115(82)90798-X.
[77] Z. Lu, R.G. Faulkner, N. Sakaguchi, H. Kinoshita, H. Takahashi, P.E.J. Flewitt, Effect of hafnium on radiation-induced inter-granular segregation in ferritic steel, J. Nucl. Mater. 351 (2006) 155–161. doi:10.1016/j.jnucmat.2006.02.026.
[78] J.L. Brimhall, D.R. Baer, R.H. Jones, Radiation induced phosphorus segregation in austenitic and ferritic alloys, J. Nucl. Mater. 122 (1984) 196–200. doi:10.1016/0022-3115(84)90595-6.
[79] E.A. Little, Microstructural evolution in irradiated ferritic-martensitic steels: transitions to high dose behaviour, J. Nucl. Mater. 206 (1993) 324–334. doi:10.1016/0022-3115(93)90131-H.
[80] A. Etienne, B. Radiguet, N.J. Cunningham, G.R. Odette, P. Pareige, Atomic scale investigation of radiation-induced segregation in austenitic stainless steels, J. Nucl. Mater. 406 (2010) 244–250. doi:10.1016/j.jnucmat.2010.08.043.
[81] R.G. Faulkner, R.B. Jones, Z. Lu, P.E.J. Flewitt, Grain boundary impurity segregation and neutron irradiation effects in ferritic alloys, Philos. Mag. 85 (2005) 2065–2099. doi:10.1080/14786430412331331853.
[82] S. Ohnuki, H. Takahashi, T. Takeyama, Void swelling and segregation of solute in ion-irradiated ferritic steels, J. Nucl. Mater. 104 (1981) 1121–1125. doi:10.1016/0022-3115(82)90751-6.
[83] R.E. Clausing, L. Heatherly, R.G. Faulkner, A.F. Rowcliffe, K. Farrell, Radiation-induced segregation in HT-9 martensitic steel, J. Nucl. Mater. 141–143 (1986) 978–981. doi:10.1016/0022-3115(86)90128-5.
[84] G. Gupta, Z. Jiao, A.N. Ham, J.T. Busby, G.S. Was, Microstructural evolution of proton irradiated T91, J. Nucl. Mater. 351 (2006) 162–173. doi:10.1016/j.jnucmat.2006.02.028.
[85] Z. Lu, R.G. Faulkner, G. Was, B.D. Wirth, Irradiation-induced grain boundary chromium microchemistry in high alloy ferritic steels, Scr. Mater. 58 (2008) 878–881. doi:10.1016/j.scriptamat.2008.01.004.
39
Chapter 1. Bibliography
[86] A.J. Ardell, Radiation-Induced Solute Segregation in Alloys, in: V. Ghetta, D. Gorse, D. Mazière, V. Pontikis (Eds.), Mater. Issues Gener. IV Syst., Springer Netherlands, Dordrecht, 2008: pp. 285–310. doi:10.1007/978-1-4020-8422-5_15.
[87] E.A. Kuleshova, B.A. Gurovich, Z.V. Lavrukhina, M.A. Saltykov, S.V. Fedotova, A.N. Khodan, Assessment of segregation kinetics in water-moderated reactors pressure vessel steels under long-term operation, J. Nucl. Mater. 477 (2016) 110–122. doi:10.1016/j.jnucmat.2016.04.060.
[88] K. Ebihara, M. Yamaguchi, Y. Nishiyama, K. Onizawa, H. Matsuzawa, Effect of carbon on irradiation-induced grain-boundary phosphorus segregation in reactor pressure vessel steels using first-principles-based rate theory model, J. Nucl. Mater. 414 (2011) 328–335. doi:10.1016/j.jnucmat.2011.05.001.
[89] Bischler P.J., Wild R.K., A microstructural study of phosphorus segregation and intergranular fracture in neutron irradiated reactor pressure vessel submerged-arc weld, in: Eff. Radiat. Mater. 17th Int. Symp. ASTM STP 1270 Gelles RK Nanstad Kumar EA Little, American Society for Testing and Materials, West Conshohocken, PA, 1996.
[91] L. Priester, Grain boundaries from theory to engineering, Springer, Dordrecht; New York, 2013. http://dx.doi.org/10.1007/978-94-007-4969-6 (accessed February 17, 2017).
[93] C. Günster, Magnetically and Capillary Driven Grain Boundary Motion in Zinc Bicrystals, Cuvillier Verlag, 2013.
[94] D. Wolf, Structure and energy of general grain boundaries in bcc metals, J. Appl. Phys. 69 (1991) 185–196. doi:10.1063/1.347741.
[95] D. Wolf, Structure-energy correlation for grain boundaries in f.c.c. metals—IV. Asymmetrical twist (general) boundaries, Acta Metall. Mater. 38 (1990) 791–798. doi:10.1016/0956-7151(90)90031-B.
[96] K.L. Merkle, D. Wolf, Low-energy configurations of symmetric and asymmetric tilt grain boundaries, Philos. Mag. A. 65 (1992) 513–530. doi:10.1080/01418619208201536.
[97] M.A. Tschopp, D.L. McDowell, Structural unit and faceting description of Σ3 asymmetric tilt grain boundaries, J. Mater. Sci. 42 (2007) 7806–7811. doi:10.1007/s10853-007-1626-6.
[98] T. Schober, R.W. Balluffi, Quantitative observation of misfit dislocation arrays in low and high angle twist grain boundaries, Philos. Mag. 21 (1970) 109–123. doi:10.1080/14786437008238400.
40
Chapter 1. Bibliography
[99] Z.-H. Liu, Y.-X. Feng, J.-X. Shang, Characterizing twist grain boundaries in BCC Nb by molecular simulation: Structure and shear deformation, Appl. Surf. Sci. 370 (2016) 19–24. doi:10.1016/j.apsusc.2016.02.097.
[100] P. Lejcek, Grain Boundary Segregation in Metals, Springer Berlin Heidelberg, Berlin, Heidelberg, 2010. [101] J.W. Gibbs, The collected works of J. Willard Gibbs., Yale University Press, New Haven, 1948.
[102] S. Hofmann, P. Lejěek, J. Adámek, Grain boundary segregation in [100] symmetrical tilt bicrystals of an Fe-Si alloy, Surf. Interface Anal. 19 (1992) 601–606. doi:10.1002/sia.7401901112.
[103] W. Swiatnicki, S. Lartigue-Korinek, J.Y. Laval, Grain boundary structure and intergranular segregation in Al2O3, Acta Metall. Mater. 43 (1995) 795–805. doi:10.1016/0956-7151(94)00256-H.
[104] S. Suzuki, K. Abiko, H. Kimura, Phosphorus segregation related to the grain boundary structure in an Fe-P alloy, Scr. Metall. 15(1981)1139–1143. doi:10.1016/0036-9748(81)90175-7.
[105] G.O. Williams, V. Randle, J.R. Cowan, P. Spellward, The role of misorientation and phosphorus content on grain growth and intergranular fracture in iron–carbon–phosphorus alloys, J. Microsc. 213 (2004) 321–327. doi:10.1111/j.0022-2720.2004.01301.x.
41
Chapter 2. Material and experimental techniques
2. Chapter 2. Material and experimental techniques
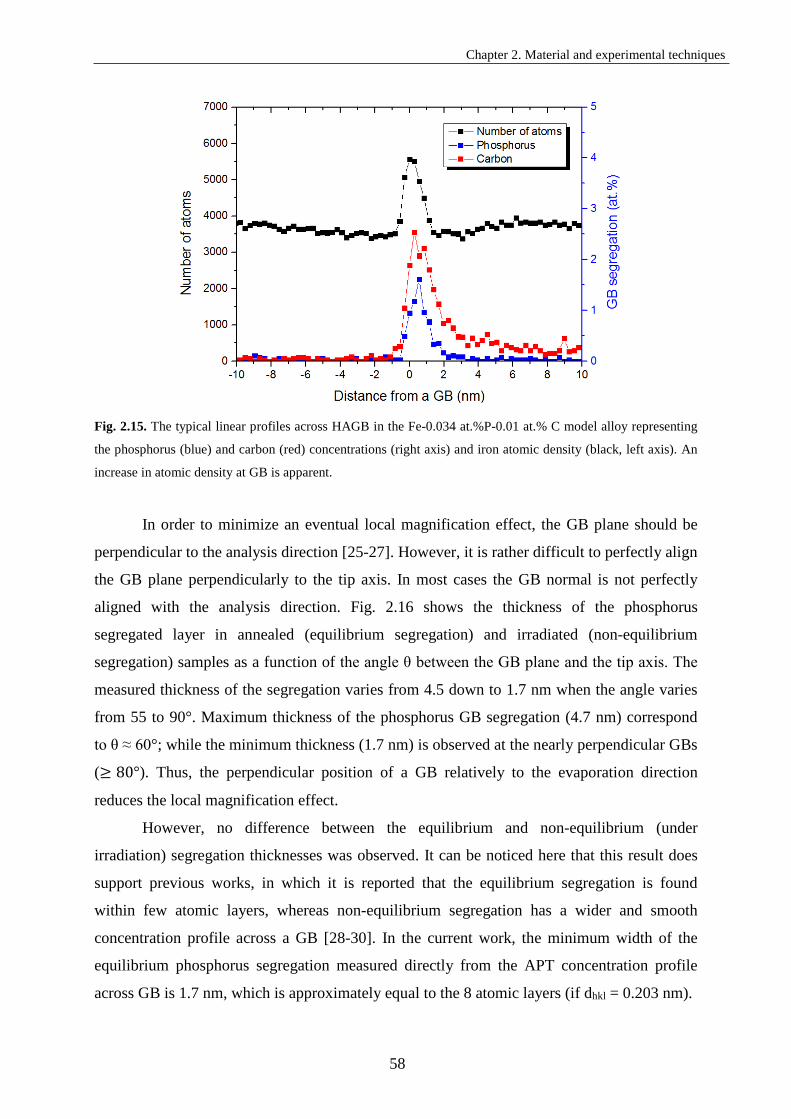
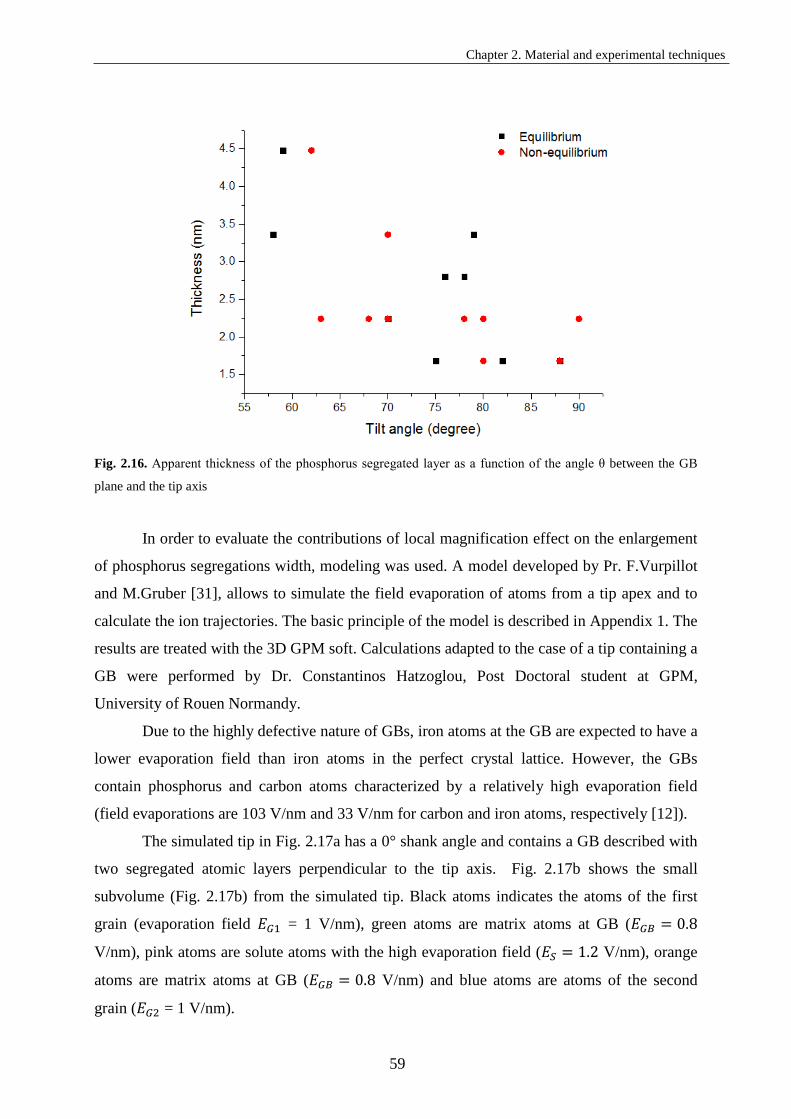
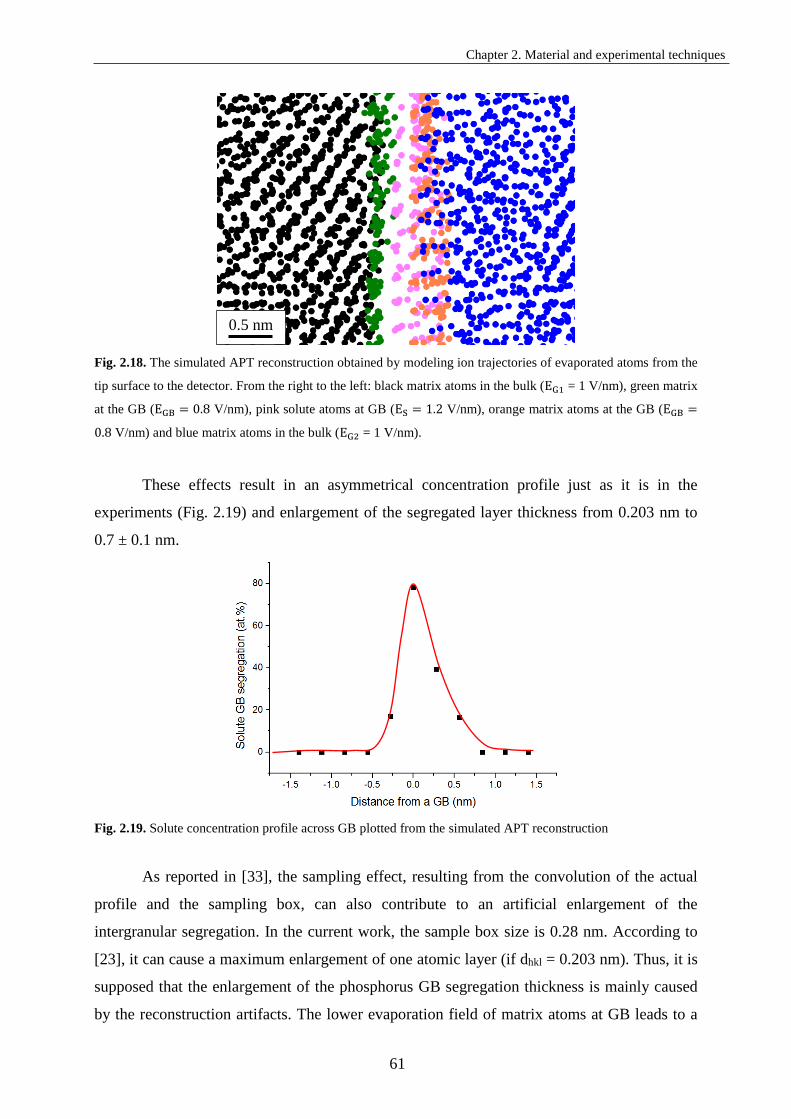
This work is dedicated to understand the influence of ageing conditions and GB
geometry on the intergranular segregation of phosphorus in the Fe-0.034 at.% P-0.01 at.% C
model alloy. The description of the investigated model alloy is given in the first section of this
chapter: the elaboration, chemical composition and the microstructure in the as-received state
and ageing conditions.
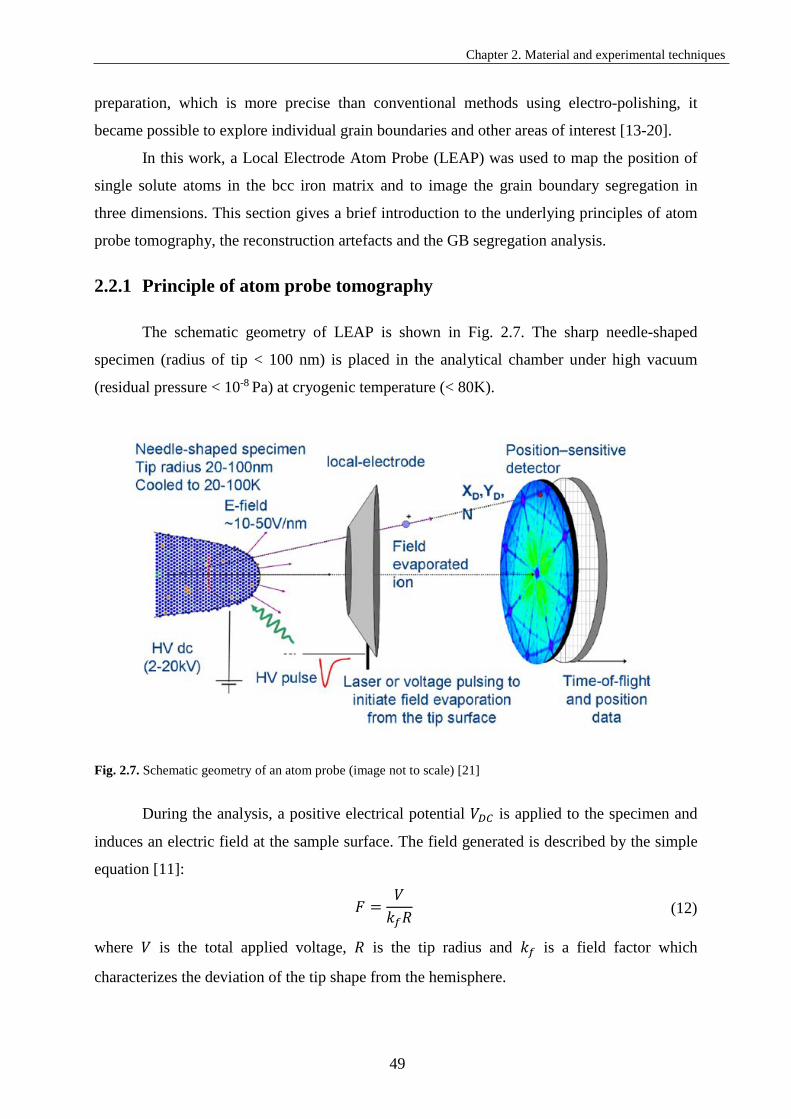
The second part of this chapter describes Atom Probe Tomography (APT), which is
the main tool in this research to determine the relationship between GB structure and the level
of GB segregation. The working principles and application of APT to study the intergranular
segregation are given in the second part of this chapter.
Scanning Transmission Electron Microscopy (STEM), described in the third section,
was used to characterize crystal defects and to measure the GB segregation along irradiation
profile using Energy-Dispersive X-ray Spectroscopy (EDS).
To provide the atomic-scale study of GB segregation, the site-specific sample
extraction was used. The specimen preparation using SEM-FIB (Scanning Electron
Microscopy/Focused Ion Beam) lift-out process is given in the fourth section of this chapter.
Finally, the determination of GB geometry using correlative Transmission Kikuchi
Diffraction (TKD) and APT is described in details.
42
Chapter 2. Material and experimental techniques
2.1 Materials: model alloy
2.1.1 Elaboration
The material studied in this work is a high purity Fe-0.034 at.% P-0.01 at.% C model
alloy. The ingot of 110 × 110 × 80 mm3 supplied by OCAS (Belgium) was cast in a vacuum
induction furnace. After reheating at 1200°C, it was hot rolled in 6 passes to 20 mm thickness.
Then it was air-cooled down to the room temperature. The nominal chemical composition of
the model alloy, which was measured in OCAS using optical emission spectrometry (OES)
and X-ray fluorescence is given in Table 2.1.
Table 2.1. Chemical composition of the Fe-0.034 at.% P-0.01 at.% C alloy determined by OES (at.%, Fe bal.)
P C Si Mn S Cr Ni Al Ti O N 0.0343 0.007 0.004 0.0014 0.0009 0.0037 0.0068 0.0093 0.0017 0.0105 0.002
The composition of the as-received model alloy was checked by Atom Probe
Tomography (APT) analysis before any treatment (Table 2.2).
Table 2.2. Chemical composition of the Fe-0.034 at.% P-0.01 at.% C alloy determined by APT (at.%, Fe bal.)
P C Si Mn S Cr Ni Al Ti O N 0.032±
0.01 0.007±0.004
- 0.0048 - 0.0039 - 0.010 - 0.025 0.011
The concentration of phosphorus (0.032 ± 0.01 at.%) and carbon atoms (0.007 ± 0.004
at.%) in the bulk is close to the nominal composition. However, both phosphorus and carbon
concentrations vary from one volume to another (Fig. 2.1). Since these fluctuations are larger
than the standard error of the APT analysis, it indicates that the bulk concentration of
phosphorus and carbon can vary through volume. This can be caused by a number of complex
processes during casting and hot-rolling. We will not discuss them further and assume that the
initial bulk concentration of phosphorus and carbon atoms is non-variable and equal to the
average value.
43
Chapter 2. Material and experimental techniques
Fig. 2.1. Bulk concentrations of phopshorus and carbon atoms measured by APT from the different volumes
(grains)
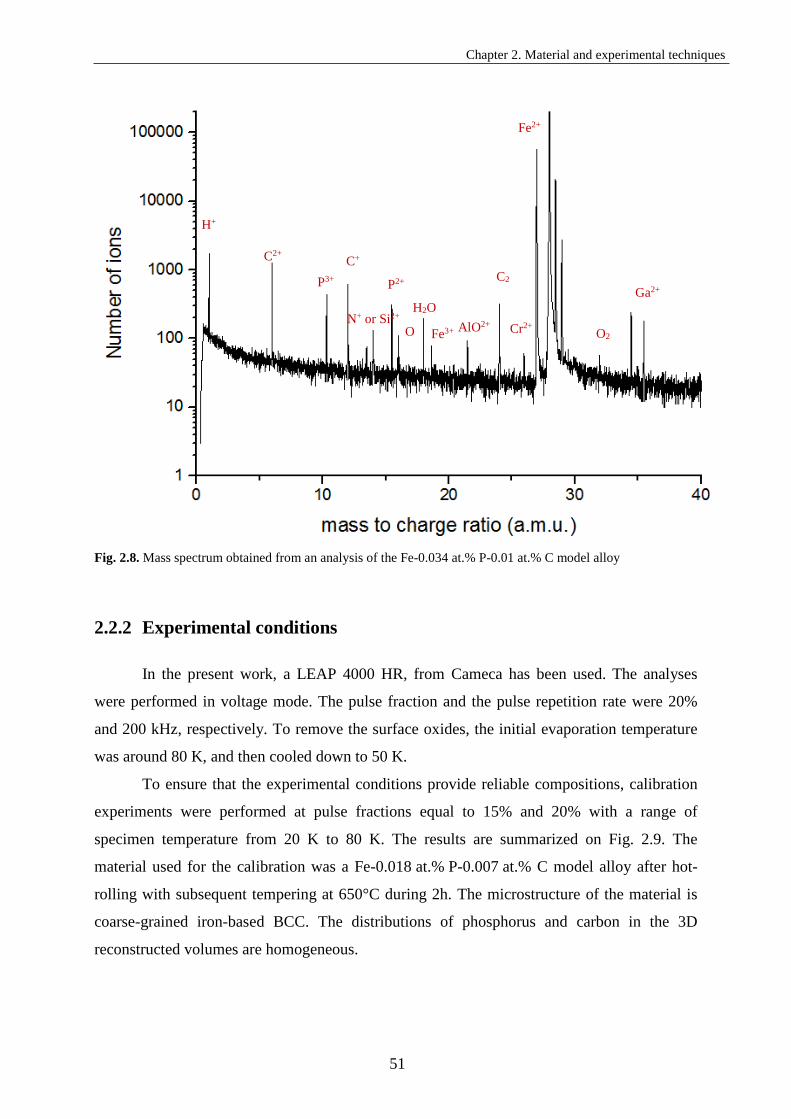
APT mass spectrum analysis revealed a small peak at 14 a.m.u. (atomic mass unit).
The absence of peaks at 14.5 and 15 a.m.u. (minor isotopes of Si) suggests that it is 14N+.
However, due to the low concentration of this element in a bulk (0.01 ± 0.005 at.%), the
presence of some Si cannot be excluded unambiguously. The concentration of other detected
elements (Cr, Al, O) is less than < 0.01 at.% and is in good agreement with OES
measurement, excepted for O and Mn. The O concentration measured by APT (0.025 ± 0.005
at.%) is higher than the one measured by OES (0.0105 at.%). It is possible that the APT value
is slightly overestimated due to the oxidation of the tip. The amount of Mn detected by APT
(0.0048 at% )is three times larger than measured by OES (0.0014 at%). In comparison with
OES, no S, Ni and Ti are detected.
Specimens in the form of plates of 4 × 4 × 2 mm3 were cut and polished with abrasive
paper down to 4000 grit, followed by polishing using a diamond paste of 3 μm and 1 μm size.
In the final step, the samples were polished using an aluminum oxide polishing paste of 0.1
µm grit size and cleaned in ethanol in an ultrasonic cleaner.
The as-received Fe-0.034 at.% P-0.01 at.% C model alloy has a coarse-grained (~ 200
µm) ferritic microstructure. Fig. 2.2 shows the surface images of the same area obtained using
Scanning Electron microscope (SEM) in the secondary electrons (SE) mode and the Electron
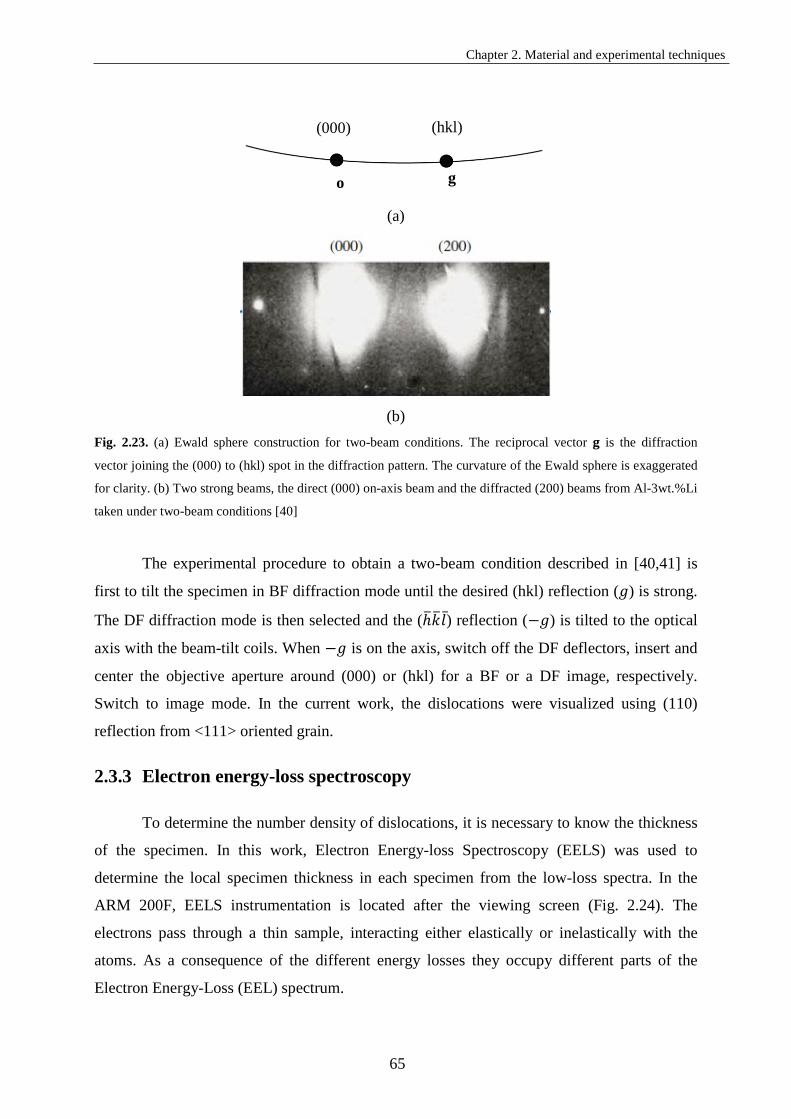
In this work EBSD mapping and GB study are performed using a Zeiss NVision 40
SEM equipped with an EBSD camera. A flat well-polished specimen is placed in the SEM
chamber at a highly tilted angle (70° from horizontal) toward the EBSD camera. The incident
beam is diffracted by crystal planes forming two diffracting large-angle cones (Fig. 2.33a).
(a) (b) Fig. 2.33. (a) The incident beam is diffracted from the crystallographic plane resulting two diffracting cones.
This large-angle and thus almost parallel cones project onto the phosphorus screen and form the Kikuchi bands.
(b)The middle of Kikuchi bands and their intersection correspond with crytallographic planes and zone axis,
respectively.
The cones are projected onto a phosphorus screen and form the Kikuchi bands. The
middle of a Kikuchi pair (2 projected lines) corresponds to diffracting crystal planes and the
intersections of Kikuchi bands correspond to zone axes. A Hough transform is used to
identify the position of Kikuchi bands and calculate the angles between them. The calculated
angles are compared with a standard and are indexed for each pixel generating orientation
map [54].
The results of EBSD measurements are shown in the so-called crystal orientation map
on selected viewing direction (Fig. 2.34), where the crystallographic orientations are assigned
to different colors. The crystal orientation map is interpreted using the inverse pole figure
73
Chapter 2. Material and experimental techniques
(IPF). In the case of a cubic crystal symmetry red is assigned to the directions near [011]
corner, green to the directions near [011], and blue to the directions near [111] corner. Also
the crystal orientation map is often called IPF map.
From the EBSD map, the GB misorientation angle and rotation axis can be calculated
(three DOFs). Therefore, using 2D EBSD map the GB with the desired misorientation and
length (< 10 µm) is chosen. Since the position of a GB plane under the sample surface is
unknown, the definition of a GB plane orientation requires additional experiments. In this
work, the GB plane is characterized correlating Transmission Kikuchi Diffraction (TKD) and
Atom Probe 3D reconstruction (see 2.4.5)
(a) (b)
Fig. 2.34. (a) A typical crystal orientation map in Z direction (normal to the surface) for a sample of the Fe-0.034
at.% P-0.01 at.% C alloy in which the colours are defined by the (b) inverse pole figure (IPF)
TKD is a method used in a SEM with the EBSD detector. The method was proposed
by Keller and Geiss [55] as a variation of EBSD analysis with better spatial resolution. The
main difference from conventional EBSD is that the TKD works with diffracted transmitted
electrons. In the current work, TKD is used for the site-specific preparation of APT specimens
with GB.
2.4.4 Site-specific sample preparation
The specimens containing GBs are made using FIB lift-out method in a Zeiss NVision
40 microscope equipped with a Kleindiek micromanipulator [13]. First a GB for site-specific
preparation is selected from EBSD orientation map. Then, small chunk (2 × 2 × 8 𝜇𝜇𝑐𝑐3)
74
Chapter 2. Material and experimental techniques
containing the GB is cut from the sample (Fig. 2.35A) and lifted-out thanks to the
micromanipulator (Fig. 2.35B). As it is said in the APT section, the GB has to be nearly
perpendicular to the tip axis to minimise the local magnification effect [25]. However, it is not
possible to avoid a small deviation of GB from the perpendicular position. The chunk is
welded to a W pre-tip employing Pt deposition. Finally, annular milling is performed to form
the APT microtip with ~ 10 nm radius of curvature (Fig. 2.35 C, D).
Fig. 2.35. SEM and FIB images showing different steps of the GB containing specimen preparation for APT: (A)
the deposition of a Pt protection layer perpendicular to the GB plane on the surface and milling of three trenches
around Pt layer, (B) the lift-out and mounting of the chunk on a support tip with the micromanipulator, (C) the
milling pattern superimposed with FIB image of the tip, (D) APT tip after several steps of FIB annular milling
The milling process is controlled thanks to TKD (Fig. 2.36). Indeed, the idea is to
perform TKD orientation map and to identify the GB position after each annular milling step
[56]. Several repetitions of FIB annular milling with consequent TKD mapping is required to
place the GB close (< 50 nm) to the tip apex. Final milling is performed at 2kV to “clean” the
sample from Ga+ ions and damaged zone and to decrease the speed of process in order to
control accurately the distance between GB and tip apex.
(A) (B)
(C) (D)
75
Chapter 2. Material and experimental techniques
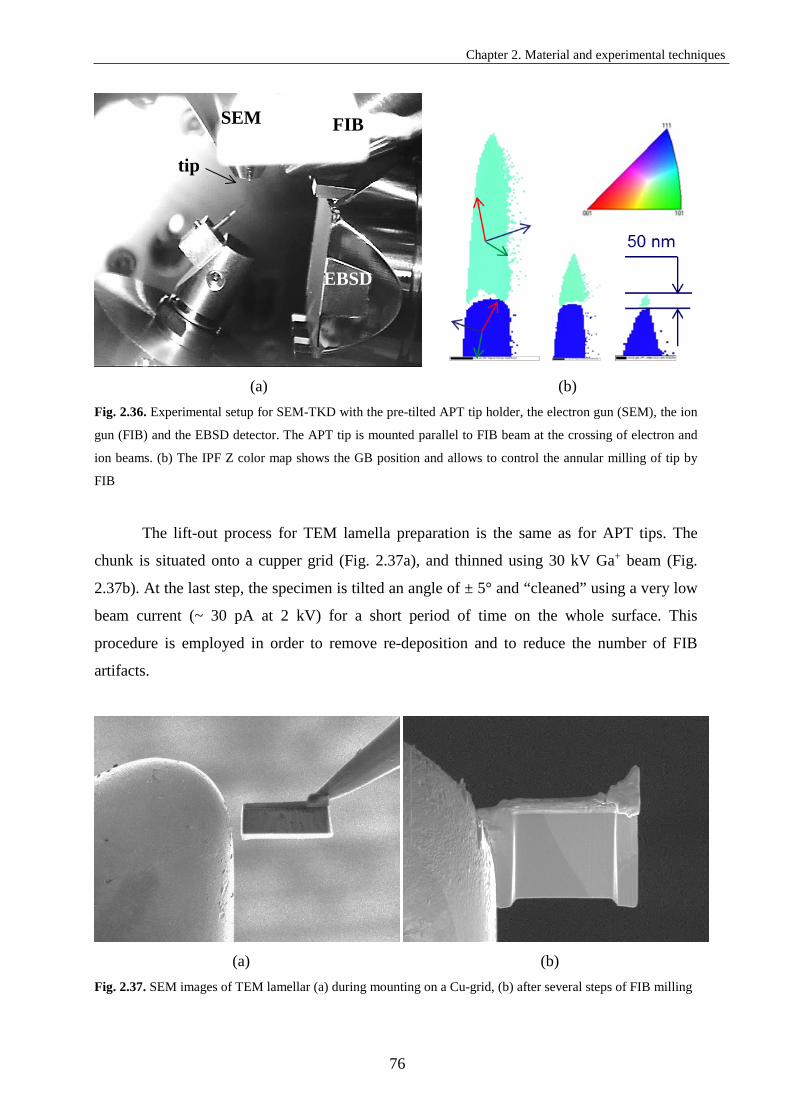
(a) (b)
Fig. 2.36. Experimental setup for SEM-TKD with the pre-tilted APT tip holder, the electron gun (SEM), the ion
gun (FIB) and the EBSD detector. The APT tip is mounted parallel to FIB beam at the crossing of electron and
ion beams. (b) The IPF Z color map shows the GB position and allows to control the annular milling of tip by
FIB
The lift-out process for TEM lamella preparation is the same as for APT tips. The
chunk is situated onto a cupper grid (Fig. 2.37a), and thinned using 30 kV Ga+ beam (Fig.
2.37b). At the last step, the specimen is tilted an angle of ± 5° and “cleaned” using a very low
beam current (~ 30 pA at 2 kV) for a short period of time on the whole surface. This
procedure is employed in order to remove re-deposition and to reduce the number of FIB
artifacts.
(a) (b)
Fig. 2.37. SEM images of TEM lamellar (a) during mounting on a Cu-grid, (b) after several steps of FIB milling
SEM FIB
EBSD
tip
76
Chapter 2. Material and experimental techniques
2.4.5 Determination of grain boundary nature from APT and TKD
techniques
The conventional 2D EBSD technique allows to determine the misorientation angle
and the rotation axis of a GB. To find the GB plane orientation, both TKD and APT data are
needed. The method is based on the works of Babinsky [57], Herbig [18] and Mandal [58].
Fig. 2.38a shows the schematic set-up for TKD mapping of the APT specimen at the
last preparation step. The APT specimen remains at the same position as it was for annular
milling. The coordinate system used to identify the crystal directions with TKD is specified in
the acquisition program as shown on Fig. 2.38. The X axis is parallel to EBSD screen, the Y
axis is the tip axis and the Z axis is the axis perpendicular to tip axis giving a direct marker.
Fig. 2.38b shows inverse pole figure (IPF) map of the APT specimen close to the last
step of milling. The tip containing 11°[44�3] GB was prepared from the Fe-0.034 at.% P-0.01
at.% C alloy irradiated up to 0.75 dpa.
(a) (b)
Fig. 2.38. (a) Schematic set-up in the microscope chamber for TKD analysis. The tip axis is located parallel to
the FIB at the intersection point with SEM beam. X, Y and Z axis are respectively the axis parallel to EBSD
screen, the tip axis and the axis perpendicular to tip axis giving a direct marker; (b) Inverse pole figure (IPF) map
of APT sample containing 11°[44�3] GB indicates the crystallographic directions lying along X axis
From the TKD indexing, the crystal orientation of each grain is calculated and
displayed in the form of spherical and stereographic projections (Fig. 2.39). The stereographic
projection is a projection of points from the surface of a sphere onto its equatorial plane [59].
SEM
e- Y
Z
Pre-tilted specimen holder
EBSD detector
APT tip
IPF X FIB
0.2 µm
77
Chapter 2. Material and experimental techniques
To find, for example, the stereographic projection of [100] direction crossing the spherical
surface at point 𝑃𝑃, join 𝑃𝑃 with the south pole 𝑇𝑇 and the intersection of PS with the equatorial
plane will be the stereographic projection of [100] direction.
Fig. 2.39. (a) The spherical and (b) the stereographic projections of grain I (upper); (c) the spherical and (d) the
stereographic projections of grain II (lower) of APT sample containing 11°[44�3] GB
The first step is to plot the 3D APT reconstruction and, guided by the GB position,
turn the reconstruction so that the GB is located exactly as on the IPF map (Fig. 2.40).
(a) (b)
(c) (d)
P
S
[100]
[100]
78
Chapter 2. Material and experimental techniques
(a) (b) Fig. 2.40. (a) IPF X color map and (b) 3D APT reconstruction of the sample containing the 11°[44�3] GB. The
reconstruction is turned so that the GB is located as well as on the IPF map
Second, the APT reconstruction is rotated around tip axis (defined previously as the Y
axis in TKD) until the GB projection appears as a straight line (Fig. 2.41a). Doing this, the
angle of rotation around Y axis needed to get a straight projection, noted 𝛼𝛼, is measured. In
the example given in figures Fig. 2.40b and Fig. 2.41a it is about 70°.
Then, the angle between the GB plane normal and the Y-axis can be directly
measured, as it is shown in Fig. 2.41b. This angle, noted 𝛽𝛽, is the angle of inclination of the
GB plane from the perpendicular position relative to the tip axis. In the example given here, it
is about 30°.
(a) (b)
Fig. 2.41. (a) 3D APT reconstruction of sample containing 11°[44�3] GB after rotation to the angle α = 70°, (b)
schematic image of APT reconstruction with position of GB plane relatively to the coordinate system. The Y
axis is parallel to the tip axis, the GB plane normal is inclined from the Y axis to the angle β
The knowledge of angles 𝛼𝛼 and 𝛽𝛽 allows to determine Miller indexes of the GB plane
in both grains, as shown in Fig. 2.42. Thus, the complete geometry of the analysed GB is
known. It is here 11°[44�3](3�44)/(4�55).
IPF X
X
Y Y
GB plane normal
Z β
Grain II Grain I
79
Chapter 2. Material and experimental techniques
(a) (b)
Fig. 2.42. Scheme for determination of the GB plane normal in (a) Grain I and (b) Grain II
α
β β
α [-344] [-455]
80
Chapter 2. Material and experimental techniques
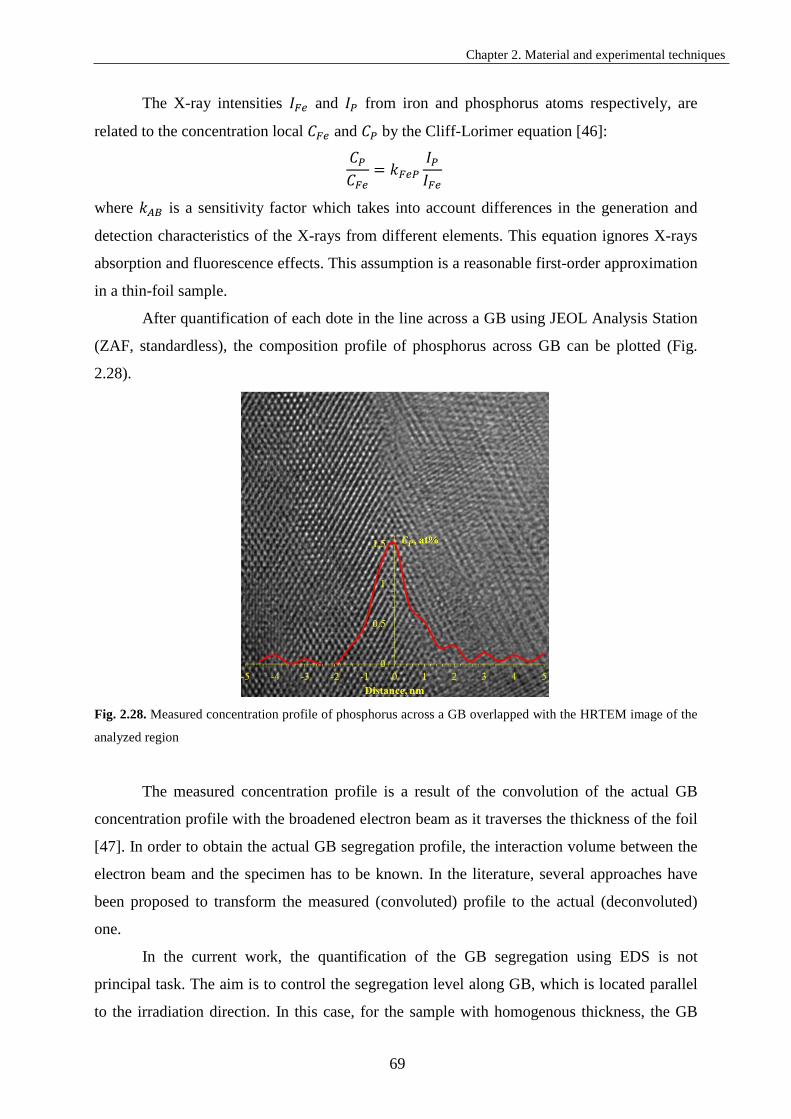
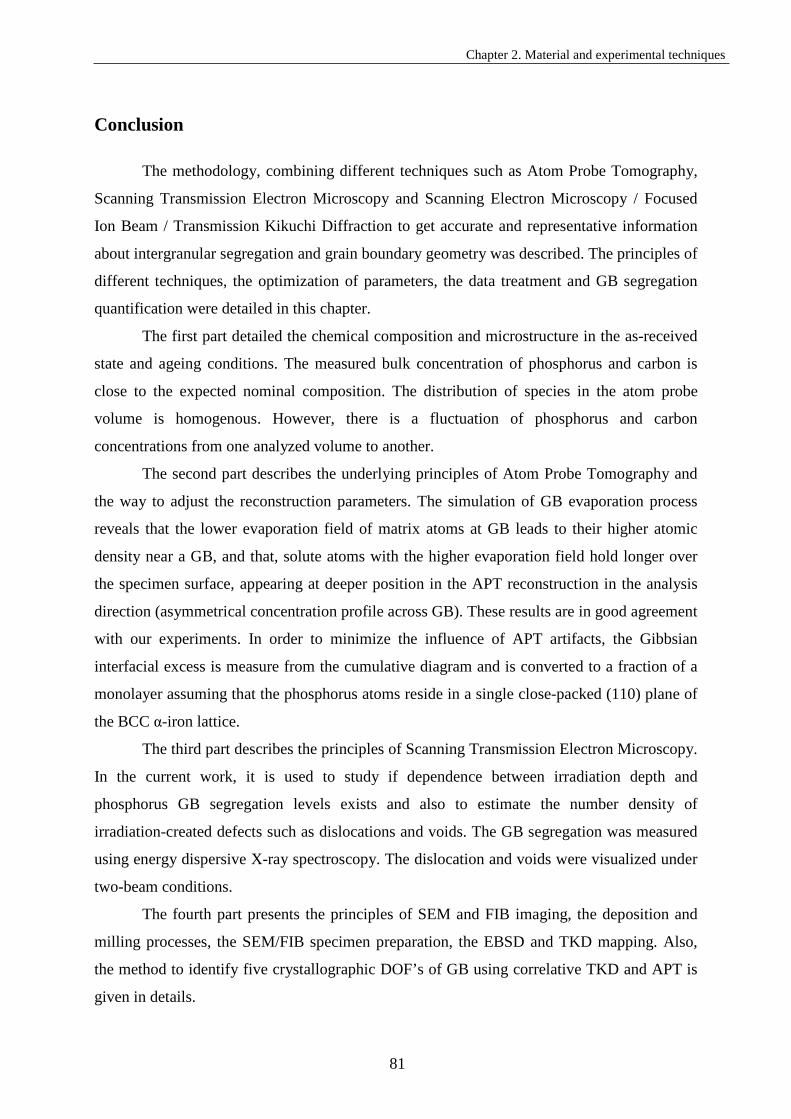
Conclusion
The methodology, combining different techniques such as Atom Probe Tomography,
Scanning Transmission Electron Microscopy and Scanning Electron Microscopy / Focused
Ion Beam / Transmission Kikuchi Diffraction to get accurate and representative information
about intergranular segregation and grain boundary geometry was described. The principles of
different techniques, the optimization of parameters, the data treatment and GB segregation
quantification were detailed in this chapter.
The first part detailed the chemical composition and microstructure in the as-received
state and ageing conditions. The measured bulk concentration of phosphorus and carbon is
close to the expected nominal composition. The distribution of species in the atom probe
volume is homogenous. However, there is a fluctuation of phosphorus and carbon
concentrations from one analyzed volume to another.
The second part describes the underlying principles of Atom Probe Tomography and
the way to adjust the reconstruction parameters. The simulation of GB evaporation process
reveals that the lower evaporation field of matrix atoms at GB leads to their higher atomic
density near a GB, and that, solute atoms with the higher evaporation field hold longer over
the specimen surface, appearing at deeper position in the APT reconstruction in the analysis
direction (asymmetrical concentration profile across GB). These results are in good agreement
with our experiments. In order to minimize the influence of APT artifacts, the Gibbsian
interfacial excess is measure from the cumulative diagram and is converted to a fraction of a
monolayer assuming that the phosphorus atoms reside in a single close-packed (110) plane of
the BCC α-iron lattice.
The third part describes the principles of Scanning Transmission Electron Microscopy.
In the current work, it is used to study if dependence between irradiation depth and
phosphorus GB segregation levels exists and also to estimate the number density of
irradiation-created defects such as dislocations and voids. The GB segregation was measured
using energy dispersive X-ray spectroscopy. The dislocation and voids were visualized under
two-beam conditions.
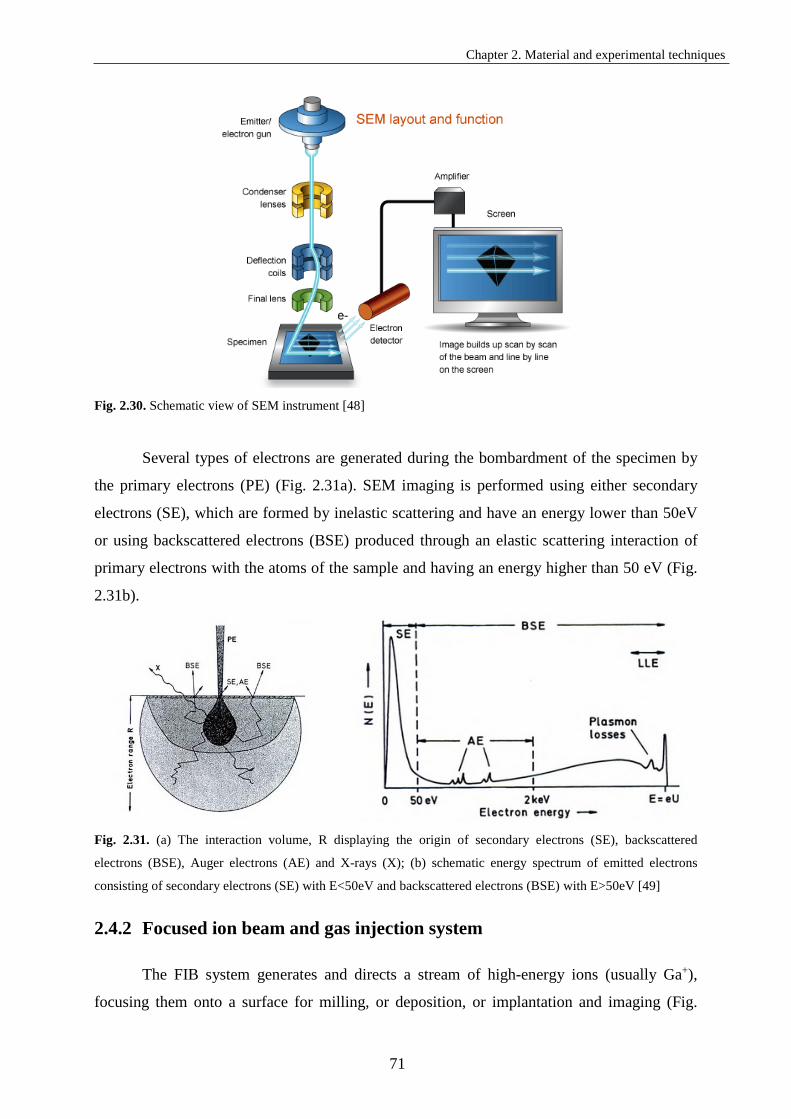
The fourth part presents the principles of SEM and FIB imaging, the deposition and
milling processes, the SEM/FIB specimen preparation, the EBSD and TKD mapping. Also,
the method to identify five crystallographic DOF’s of GB using correlative TKD and APT is
given in details.
81
Chapter 2. Material and experimental techniques
References
[1] ASTM A508 / A508M-04, Standard Specification for Quenched and Tempered Vacuum-Treated Carbon and Alloy Steel Forgings for Pressure Vessels, ASTM International, West Conshohocken, PA, 2004, www.astm.org, doi: 10.1520/A0508_A0508M-04.
[2] C. Miller, F. Champigny, J.M. Frund, Manufacturing Conditions of French Reactor Pressure Vessels to Avoid the Occurrence of Hydrogen Flakes, in: ASME, 2016: p. V01AT01A063. doi:10.1115/PVP2016-63881.
[3] Suzuki, Z. Für Met. 83 (1992).
[4] B. Radiguet, Etude de la formation d'amas diffus de solutés sous irradiation dans des alliages modèles ferritiques, PhD thesis, Université de Rouen, 2004.
[5] O.K. von Goldbeck, IRON—Binary Phase Diagrams, Springer Berlin Heidelberg, Berlin, 1982.
[6] Y. Serruys, M.-O. Ruault, P. Trocellier, S. Henry, O. Kaïtasov, P. Trouslard, Multiple ion beam irradiation and implantation: JANNUS project, Nucl. Instrum. Methods Phys. Res. Sect. B Beam Interact. Mater. At. 240 (2005) 124–127. doi:10.1016/j.nimb.2005.06.100.
[7] N.H. Packan, K. Farrell, J.O. Stiegler, Correlation of neutron and heavy-ion damage, J. Nucl. Mater. 78 (1978) 143–155. doi:10.1016/0022-3115(78)90513-5.
[8] J.F. Ziegler, J.P. Biersack, The Stopping and Range of Ions in Matter, in: D.A. Bromley (Ed.), Treatise Heavy-Ion Sci., Springer US, 1985.
[9] ASTM standart E521-96. Standard practice for neutron radiation damage simulation by charged-particle irradiation, ASTM International, West Conshohocken, PA, 2009.
[10] R.E. Stoller, M.B. Toloczko, G.S. Was, A.G. Certain, S. Dwaraknath, F.A. Garner, On the use of SRIM for computing radiation damage exposure, Nucl. Instrum. Methods Phys. Res. Sect. B Beam Interact. Mater. At. 310 (2013) 75–80. doi:10.1016/j.nimb.2013.05.008.
[14] M.I. Hartshorne, D. Isheim, D.N. Seidman, M.L. Taheri, Specimen preparation for correlating transmission electron microscopy and atom probe tomography of mesoscale features, Ultramicroscopy, 147 (2014) 25–32. doi:10.1016/j.ultramic.2014.05.005.
[15] E.A. Marquis, R. Hu, T. Rousseau, A systematic approach for the study of radiation-induced segregation/depletion at grain boundaries in steels, J. Nucl. Mater. 413 (2011) 1–4. doi:10.1016/j.jnucmat.2011.03.023.
[16] A. Etienne, B. Radiguet, N.J. Cunningham, G.R. Odette, P. Pareige, Atomic scale investigation of radiation-induced segregation in austenitic stainless steels, J. Nucl. Mater. 406 (2010) 244–250. doi:10.1016/j.jnucmat.2010.08.043.
[17] M.L. Taheri, J.T. Sebastian, B.W. Reed, D.N. Seidman, A.D. Rollett, Site-specific atomic scale analysis of solute segregation to a coincidence site lattice grain boundary, Ultramicroscopy, 110 (2010) 278–284. doi:10.1016/j.ultramic.2009.11.006.
[18] M. Herbig, M. Kuzmina, C. Haase, R.K.W. Marceau, I. Gutierrez-Urrutia, D. Haley, D.A. Molodov, P. Choi, D. Raabe, Grain boundary segregation in Fe–Mn–C twinning-induced plasticity steels studied by correlative electron backscatter diffraction and atom probe tomography, Acta Mater. 83 (2015) 37–47. doi:10.1016/j.actamat.2014.09.041.
[19] Y.J. Li, D. Ponge, P. Choi, D. Raabe, Segregation of boron at prior austenite grain boundaries in a quenched martensitic steel studied by atom probe tomography, Scr. Mater. 96 (2015) 13–16. doi:10.1016/j.scriptamat.2014.09.031.
[20] B. Färber, E. Cadel, A. Menand, G. Schmitz, R. Kirchheim, Phosphorus segregation in nanocrystalline Ni–3.6 at.% P alloy investigated with the tomographic atom probe (TAP), Acta Mater. 48 (2000) 789–796. doi:10.1016/S1359-6454(99)00397-3.
[21] www.atomprobe.materials.ox.ac.uk
[22] L. Yao, B. Gault, J.M. Cairney, S.P. Ringer, On the multiplicity of field evaporation events in atom probe: A new dimension to the analysis of mass spectra, Philos. Mag. Lett. 90 (2010) 121–129. doi:10.1080/09500830903472997.
[23] B.P. Geiser, T.F. Kelly, D.J. Larson, J. Schneir, J.P. Roberts, Spatial Distribution Maps for Atom Probe Tomography, Microsc. Microanal. 13 (2007) 437–447. doi:10.1017/S1431927607070948.
[24] F. Vurpillot, G. Da Costa, A. Menand, D. Blavette, Structural analyses in three-dimensional atom probe: a Fourier transform approach, J. Microsc. 203 (2001) 295–302. doi:10.1046/j.1365-2818.2001.00923.x.
[25] D. Blavette, A. Bostel, J.M. Sarrau, B. Deconihout, A. Menand, An atom probe for three-dimensional tomography, Nature 363 (1993) 432–435. doi:10.1038/363432a0.
[26] P. Maugis, K. Hoummada, A methodology for the measurement of the interfacial excess of solute at a grain boundary, Scr. Mater. 120 (2016) 90–93. doi:10.1016/j.scriptamat.2016.04.005.
[27] P.J. Felfer, C.R. Killmore, J.G. Williams, K.R. Carpenter, S.P. Ringer, J.M. Cairney, A quantitative atom probe study of the Nb excess at prior austenite grain boundaries in a Nb microalloyed strip-cast steel, Acta Mater. 60 (2012) 5049–5055. doi:10.1016/j.actamat.2012.06.013.
[28] L. Karlsson, H. Nordén, Overview no. 63. Non-equilibrium grain boundary segregation of boron in austenitic stainless steel-II. Fine scale segregation behaviour, Acta Metall. 36 (1988) 13–24. doi:10.1016/0001-6160(88)90024-7.
[29] H. Erhart, H.J. Grabke, Equilibrium segregation of phosphorus at grain boundaries of Fe–P, Fe–C–P, Fe–Cr–P, and Fe–Cr–C–P alloys, Met. Sci. 15 (1981) 401–408. doi:10.1179/030634581790426877.
[30] M. Tomozawa, Y. Miyahara, K. Kako, Solute segregation on Σ3 and random grain boundaries in type 316L stainless steel, Mater. Sci. Eng. A. 578 (2013) 167–173. doi:10.1016/j.msea.2013.04.048.
[31] F. Vurpillot, Three-Dimensional Reconstruction in Atom Probe Tomography, in: At. Probe Tomogr., Elsevier, 2016: pp. 183–249. doi:10.1016/B978-0-12-804647-0.00007-3.
[32] P.J. Felfer, B. Gault, G. Sha, L. Stephenson, S.P. Ringer, J.M. Cairney, A New Approach to the Determination of Concentration Profiles in Atom Probe Tomography, Microsc. Microanal. 18 (2012) 359–364. doi:10.1017/S1431927611012530.
[33] R. Lard, L. Lechevallier, A. Zarefy, A. Bostel, J. Juraszek, J.M. Le Breton, B. Rodmacq, B. Dieny, Structural analysis of a (Pt/Co)3/IrMn multilayer: Investigation of sub-nanometric layers by tomographic atom probe, J. Appl. Phys. 105 (2009). doi:10.1063/1.3106636.
[34] J.W. Gibbs, The collected works of J. Willard Gibbs., Yale University Press, New Haven, 1948.
[35] B.W. Krakauer, D.N. Seidman, Absolute atomic-scale measurements of the Gibbsian interfacial excess of solute at internal interfaces, Phys. Rev. B. 48 (1993) 6724–6727. doi:10.1103/PhysRevB.48.6724.
[36] M.K. Miller, K.F. Russell, APFIM characterization of a high phosphorus Russian RPV weld, Appl. Surf. Sci. 94–95 (1996) 378–383. doi:10.1016/0169-4332(95)00400-9.
[37] M. Hazewinkel, ed., Encyclopaedia of mathematics: an updated and annotated translation of the Soviet “Mathematical encyclopaedia,” Reidel ; Sold and distributed in the
84
Chapter 2. Material and experimental techniques
U.S.A. and Canada by Kluwer Academic Publishers, Dordrecht ; Boston : Norwell, MA, U.S.A, 1988.
[38] S.J. Pennycook, A.R. Lupini, M. Varela, A. Borisevich, Y. Peng, M.P. Oxley, K.V. Benthem, M.F. Chisholm, Scanning Transmission Electron Microscopy for Nanostructure Characterization, in: W. Zhou, Z.L. Wang (Eds.), Scanning Microsc. Nanotechnol., Springer New York, 2006: pp. 152–191. doi:10.1007/978-0-387-39620-0_6.
[39] S.J. Pennycook, P.D. Nellist, eds., Scanning Transmission Electron Microscopy, Springer New York, New York, NY, 2011.
[40] D.B. Williams, C.B. Carter, The Transmission Electron Microscope, in: Transm. Electron Microsc., Springer US, 2009: pp. 3–22. doi:10.1007/978-0-387-76501-3_1.
[41] M.L. Jenkins, M.A. Kirk, Characterisation of Radiation Damage by Transmission Electron Microscopy, Taylor & Francis, 2000.
[42] http://www.eels.info/
[43] J. Silcox, Core-loss EELS, Curr. Opin. Solid State Mater. Sci. 3 (1998) 336–342. doi:10.1016/S1359-0286(98)80042-9.
[44] T. Malis, S.C. Cheng, R.F. Egerton, EELS log-ratio technique for specimen-thickness measurement in the TEM, J. Electron Microsc. Tech. 8 (1988) 193–200. doi:10.1002/jemt.1060080206.
[45] A.D. Gianfrancesco, Materials for Ultra-Supercritical and Advanced Ultra-Supercritical Power Plants, Woodhead Publishing, 2016.
[46] G. Cliff, G.W. Lorimer, The quantitative analysis of thin specimens, J. Microsc. 103 (1975) 203–207. doi:10.1111/j.1365-2818.1975.tb03895.x.
[47] R.D. Carter, D.L. Damcott, M. Atzmon, G.S. Was, S.M. Bruemmer, E.A. Kenik, Quantitative analysis of radiation-induced grain-boundary segregation measurements, J. Nucl. Mater. 211 (1994) 70–84. doi:10.1016/0022-3115(94)90282-8.
[48] Layout MyScope, (n.d.). http://www.ammrf.org.au/myscope/sem/practice/principles/layout.php#detail (accessed June 15, 2017).
[49] L. Reimer, Scanning Electron Microscopy, Springer Berlin Heidelberg, Berlin, Heidelberg, 1998. doi:10.1007/978-3-540-38967-5.
[50] N. Yao, Focused ion beam systems: basics and applications, Cambridge University Press, 2007.
85
Chapter 2. Material and experimental techniques
[51] L.A. Giannuzzi, F.A. Stevie, eds., Introduction to Focused Ion Beams, Kluwer Academic Publishers, Boston, 2005. doi:10.1007/b101190.
[52] A. Aitkaliyeva, J.W. Madden, B.D. Miller, J.I. Cole, J. Gan, Comparison of preparation techniques for nuclear materials for transmission electron microscopy (TEM), J. Nucl. Mater. 459 (2015) 241–246. doi:10.1016/j.jnucmat.2015.01.042.
[53] A. Rigort, J.M. Plitzko, Cryo-focused-ion-beam applications in structural biology, Arch. Biochem. Biophys. 581 (2015) 122–130. doi:10.1016/j.abb.2015.02.009.
[54] A.J. Schwartz, M. Kumar, B.L. Adams, D.P. Field, eds., Electron Backscatter Diffraction in Materials Science, Springer US, Boston, MA, 2009.
[55] R.R. Keller, R.H. Geiss, Transmission EBSD from 10 nm domains in a scanning electron microscope: TRANSMISSION EBSD IN THE SEM, J. Microsc. 245 (2012) 245–251. doi:10.1111/j.1365-2818.2011.03566.x.
[56] K. Babinsky, R. De Kloe, H. Clemens, S. Primig, A novel approach for site-specific atom probe specimen preparation by focused ion beam and transmission electron backscatter diffraction, Ultramicroscopy. 144 (2014) 9–18. doi:10.1016/j.ultramic.2014.04.003.
[57] K. Babinsky, W. Knabl, A. Lorich, R. De Kloe, H. Clemens, S. Primig, Grain boundary study of technically pure molybdenum by combining APT and TKD, Ultramicroscopy. 159 (2015) 445-451. doi:10.1016/j.ultramic.2015.05.014.
[58] S. Mandal, K.G. Pradeep, S. Zaefferer, D. Raabe, A novel approach to measure grain boundary segregation in bulk polycrystalline materials in dependence of the boundaries’ five rotational degrees of freedom, Scr. Mater. 81 (2014) 16–19. doi:10.1016/j.scriptamat.2014.02.016.
[59] Whittaker E.J.W., The stereographic projection, University Colledge Cardiff Press, Cardiff, United Kingdom, 1984.
86
Chapter 3. Equilibrium grain boundary segregation in Fe-P-C alloy
In the current work, the difference between the predicted and experimental free Gibbs
energies is about ∆𝐺𝐺𝑃𝑃′ = 5 𝑘𝑘𝐽𝐽/𝑐𝑐𝑛𝑛𝑙𝑙 (Fig. 3.17).
The phosphorus equilibrium GB segregation at 450°C, 𝐶𝐶𝑃𝑃𝜙𝜙, determined using equation
(84) with substitution of the experimentally measured GB segregation of carbon, 𝐶𝐶𝑃𝑃𝜙𝜙, (0.25 ±
0.4 monolayer) is equal to 0.17 ± 0.02 monolayer. The APT measurement of phosphorus GB
segregation after 1000 h of ageing at 450°C gave the mean value at HAGBs of 0.14 ± 0.01
monolayer. This means that the phosphorus GB segregation needs more than 1000 h to reach
the equilibrium value.
116
Chapter 3. Equilibrium grain boundary segregation in Fe-P-C alloy
Fig. 3.17. Comparison of the theoretical temperature dependence of the standard Gibbs free energy of
phosphorus GB segregation in the Fe-0.034 at.% P-0.01 at.% C alloy calculated by equations (83)(red line) and
(84)(blue line) with the experimental data
In order to determine the time needed to reach the phosphorus and carbon equilibrium
GB segregations at 450°C the segregation kinetics were analysed. The phosphorus and carbon
GB segregation kinetics are described by equation (78). Different values of pre-exponential
factor and activation energy of phosphorous diffusion are given in literature. In order to cover
the whole range of possible diffusion coefficients at a given temperature, kinetics of GB
segregation were calculated using two "extreme" diffusion coefficients.
The first coefficient from Matsuyama et al. [61] corresponds to a relatively slow
diffusion of phosphorus in α-iron. It is expressed as:
𝐷𝐷𝑃𝑃1 = 13.8 𝑀𝑀𝑥𝑥𝑑𝑑 �−332000
8.314𝑇𝑇� (85)
The second diffusion coefficient corresponds to a relatively fast diffusion. It was
obtained from Qingfen et al. [62] as:
𝐷𝐷𝑃𝑃2 = 2.9 ∙ 10−4𝑀𝑀𝑥𝑥𝑑𝑑 �−231000
8.314𝑇𝑇� (86)
The kinetics curves of phosphorus GB segregation at 650°C and 450°C comparing
with the experimental APT data are presented in Fig. 3.18. Red line correspond to the
phosphorus segregation kinetics calculated with diffusion coefficient DP1 , the black line is the
phosphorus segregation kinetics calculated with DP2 . The black dotes indicate the phosphorus
segregation at HAGBs measured by APT. Since the phosphorus GB segregation at 650°C
reaches the equilibrium in time less than 2h, the segregation kinetics calculated using the
∆𝐺𝐺′
117
Chapter 3. Equilibrium grain boundary segregation in Fe-P-C alloy
faster diffusion coefficient DP2 more plausibly describes the segregation process at 650°C.
Faster segregation kinetics at 450°C also shows the best fit with two APT measurements of
phosphorus GB segregation from the sample aged at 450°C during 1000h.
Thus, it is assumed, that the time needed to reach the equilibrium phosphorus GB
segregation at 450°C in the Fe-0.034 at.% P-0.01 at.% C model alloy is about 3000h (or 125
days).
(a) (b) Fig. 3.18. Kinetics of phosphorus GB segregation in the Fe-0.034 at.% P-0.01 at.% C model alloy at (a) 650°C
and (b) 450°C. Red line correspond to the diffusion coefficient 𝐷𝐷𝑃𝑃1, black line – to 𝐷𝐷𝑃𝑃2
Also, the time necessary to reach the equilibrium intergranular carbon segregation was
calculated. The diffusivity of carbon is given by [10]:
𝐷𝐷𝑃𝑃 = 1.67 ∙ 10−7𝑀𝑀𝑥𝑥𝑑𝑑 �−780008.314𝑇𝑇
� (87)
The equilibrium intergranular segregation of carbon at 450°𝐶𝐶 and 650°𝐶𝐶 are 𝐶𝐶𝑃𝑃𝜙𝜙 = 0.25 ±
0.4 monolayer and 𝐶𝐶𝑃𝑃𝜙𝜙 = 0.03 ± 0.01 monolayer, respectively. Thus, the time necessary to
reach the equilibrium intergranular carbon segregation is < 2 𝑠𝑠𝑀𝑀𝑐𝑐 at 650°C and < 10 𝑠𝑠𝑀𝑀𝑐𝑐 at
450°C.
Analytical approach described above was used to predict the equilibrium GB
segregation of phosphorus at 450°C and 650°C in the Fe-0.034 at.% P-0.01 at.% C model
alloy. The Lejcek’s model allows to consider the variation of the GB segregation with the GB
structure. The minimum and maximum values predicted by his model correspond with the
segregation at low-energy special GBs and high-energy general GBs, respectively. However,
118
Chapter 3. Equilibrium grain boundary segregation in Fe-P-C alloy
some questions, such as, the distribution of segregating elements in structurally different GBs,
including twist, asymmetrical and mixed ones; the effect of the GB plane; the segregation
dependent structural changes (e.g. faceting) are still open and required additional theoretical
and experimental studies.
119
Chapter 3. Equilibrium grain boundary segregation in Fe-P-C alloy
Conclusions
In this chapter, the equilibrium phosphorus and carbon segregations were investigated
in Fe-0.034 at.% P-0.01 at.% C model alloys thermally aged at 650°C during 2h and 450°C
during 1000h. The annealing at 650°C during 2h simulates the stress relieve heat treatment
(SRHT) of RPV steel in the industry. In the current work, a SRHT during 2h is the reference
state of the specimens before thermal ageing and irradiation. The phosphorus GB segregation
after 2h of SRHT was measured by APT and the mean value is equal to 0.12 ± 0.01
monolayer. Since the additional SRHT during 24 h did not affect the phosphorus segregation
value, this value is supposed to be the equilibrium GB segregation of phosphorus at 650°C.
An additional SRHT didn’t change the phosphorus GB segregation value, but
significantly reduce the carbon GB segregation. Since the size of specimen annealed at 650°C
during 24 h was 4 × 4 × 20 mm3, while the previous annealing during 2h was performed on
the specimen with the size of 20 × 20 × 20 mm3, it was assumed that the higher carbon GB
segregation in a bigger specimen is a result of slower cooling rate and thus the segregation of
carbon at GB during air-cooling.
A thermal ageing at 450°C was performed to make an atomic-scale investigation of
equilibrium phosphorus GB segregation in the Fe-0.034 at.% P-0.01 at.% C model alloys and
to compare the results with irradiated samples. The irradiation temperature was the same as
the thermal ageing temperature, i.e. 450°C. The study of equilibrium GB segregation helps to
separate different mechanisms of GB segregation under irradiation (see Chapter 4). The
phosphorus GB segregation after 1000 h of thermal ageing at 450°C is 0.14 ± 0.01 monolayer.
In order to determine the equilibrium GB segregation of phosphorus at 450°C the
Guttmann’s model of equilibrium GB segregation was used. The thermodynamic parameters
were taken from the works of Lejček and co-workers. The model was first verified at 650°C.
The predicted equilibrium phosphorus GB segregation at 650°C (0.21 ± 0.01 monolayer) was
much higher than the experimentally observed (0.10 ± 0.01 monolayer).
Since the parameters given by Lejček were obtained by AES experiments, while APT
was used in the current work, it was decided to use both techniques to measure the GB
segregation in the same material. The comparison of AES and APT measurements of
phosphorus GB segregation for specimen annealed at 650°C during 2h demonstrates that the
AES experiments, giving (1.4 ± 0.5) × 1014 atoms/cm2 is in good agreement with APT
measurements of phosphorus segregation at GBs ((1.6 ± 1.0) × 1014 atoms/cm2). Based on
120
Chapter 3. Equilibrium grain boundary segregation in Fe-P-C alloy
that fact, it was supposed that the difference between theoretical prediction and experimental
data is a result of GB segregation quantification. In the current work, the Gibbsian interfacial
excess measured by APT is converted to a fraction of a monolayer, assuming that the
phosphorus atoms reside in a single close-packed (110) plane of BCC α-iron, while Lejček et
al. have estimated the atomic density of GB plane from AES analysis of pure iron surface
[44]. Since the (110) plane is the highest density plane in a bcc iron, our assumption
underestimates the phosphorus GB segregation.
Considering this fact, the temperature dependence of free Gibbs energy of phosphorus
segregation is given by ∆𝐺𝐺𝑃𝑃 = −27000 − 21.5 ∙ 𝑇𝑇 + 7000 ∙ �𝑋𝑋𝑃𝑃𝜙𝜙 − 𝑋𝑋𝑃𝑃𝐵𝐵�. Thus, the
theoretical value of equilibrium GB segregation of phosphorus at 450°C is 0.17 ± 0.02
monolayers. The time needed to reach the equilibrium GB segregation is about 3000h. In the
current work, the thermal ageing at 450°C was conducted on the Fe-0.034 at.% P-0.01 at.% C
model alloy during 1000h. After 1000h the phosphorus GB segregation reaches 0.14 ± 0.01
monolayer, which is ~ 80% from the equilibrium segregation value.
The segregation kinetics of phosphorus is sufficiently well described by McLean’s
model using the diffusion coefficient of 𝐷𝐷𝑃𝑃 = 2.9 ∙ 10−4𝑀𝑀𝑥𝑥𝑑𝑑 �−2310008.314𝑁𝑁
� from Qingfen [62]. It
is necessary to anneal during ~ 1 h at 650°C and ~ 3000 h at 450°C to reach the equilibrium
GB segregation.
121
Chapter 3. Equilibrium grain boundary segregation in Fe-P-C alloy
References
[1] S.-H. Song, H. Zhuang, J. Wu, L.-Q. Weng, Z.-X. Yuan, T.-H. Xi, Dependence of ductile-to-brittle transition temperature on phosphorus grain boundary segregation for a 2.25Cr1Mo steel, Mater. Sci. Eng. A. 486 (2008) 433–438. doi:10.1016/j.msea.2007.09.032.
[2] C. English, S. Ortner, G. Gage, W. Server, S. Rosinski, Review of Phosphorus Segregation and Intergranular Embrittlement in Reactor Pressure Vessel Steels, in: S. Rosinski, M. Grossbeck, T. Allen, A. Kumar (Eds.), Eff. Radiat. Mater. 20th Int. Symp., ASTM International, USA, 2001. doi:10.1520/STP10531S.
[3] Q. Li, L. Li, E. Liu, D. Liu, X. Cui, Temper embrittlement dynamics induced by non-equilibrium segregation of phosphorus in steel 12Cr1MoV, Scr. Mater. 53 (2005) 309–313. doi:10.1016/j.scriptamat.2005.04.011.
[4] S. Rosinski, Review of Phosphorus Segregation and Intergranular Embrittlement in Reactor Pressure Vessel Steels (PWRMRP-19): PWR Material Reliability Project (PWRMRP), EPRI, USA 2000.
[5] C. Naudin, J.M. Frund, A. Pineau, Intergranular fracture stress and phosphorus grain boundary segregation of a Mn-Ni-Mo steel, Scr. Mater. 40 (1999) 1013–1019. doi:10.1016/S1359-6462(99)00069-X.
[6] J. Kameda, Y. Nishiyama, Combined effects of phosphorus segregation and partial intergranular fracture on the ductile–brittle transition temperature in structural alloy steels, Mater. Sci. Eng. A. 528 (2011) 3705–3713. doi:10.1016/j.msea.2011.01.018.
[7] P.E.J. Flewitt, R.K. Wild, The Distribution of Segregated Elements to Grain Boundaries Measured by Auger Electron Spectroscopy, Mater. Sci. Forum. 294–296 (1999) 297–300. doi:10.4028/www.scientific.net/MSF.294-296.297.
[8] C.L. Brunt, Sources of variability in grain boundary segregation, Acta Metall. 31 (1983) 257–266. doi:10.1016/0001-6160(83)90102-5.
[9] F.C. Campbell, Elements of Metallurgy and Engineering Alloys, ASM International, 2008.
[10] J.R.G. Silva, R.B. McLellan, Diffusion of carbon and nitrogen in B.C.C. iron, Mater. Sci. Eng. 26 (1976) 83–87. doi:10.1016/0025-5416(76)90229-9.
[11] J.R. Cowan, H.E. Evans, R.B. Jones, P. Bowen, The grain-boundary segregation of phosphorus and carbon in an Fe–P–C alloy during cooling, Acta Mater. 46 (1998) 6565–6574. doi:10.1016/S1359-6454(98)00295-X.
Chapter 3. Equilibrium grain boundary segregation in Fe-P-C alloy
[13] A.W. Czanderna, Methods of Surface Analysis, Elsevier, 2012.
[14] P. Lejcek, Grain Boundary Segregation in Metals, Springer Berlin Heidelberg, Berlin, Heidelberg, 2010. http://link.springer.com/10.1007/978-3-642-12505-8 (accessed March 9, 2015).
[15] H. Erhart, H.J. Grabke, Equilibrium segregation of phosphorus at grain boundaries of Fe–P, Fe–C–P, Fe–Cr–P, and Fe–Cr–C–P alloys, Met. Sci. 15 (1981) 401–408. doi:10.1179/030634581790426877.
[16] K. Ebihara, M. Yamaguchi, Y. Nishiyama, K. Onizawa, H. Matsuzawa, Effect of carbon on irradiation-induced grain-boundary phosphorus segregation in reactor pressure vessel steels using first-principles-based rate theory model, J. Nucl. Mater. 414 (2011) 328–335. doi:10.1016/j.jnucmat.2011.05.001.
[17] Y. Koguchi, K. Takahashi, Y. Ishikawa, Impurity segregation of stainless steel studied by atom-probe and auger electron spectroscopy, J. Phys. Colloq. 48 (1987) C6-411-C6-416. doi:10.1051/jphyscol:1987667.
[18] S. Hofmann, Auger- and X-Ray Photoelectron Spectroscopy in Materials Science, Springer Berlin Heidelberg, Berlin, Heidelberg, 2013.
[19] R. Wild, Auger Electron Spectroscopy (AES) for surface analysis, (1981) 183–194. doi:10.1016/S0042-207X(81)80384-3.
[20] J.C. Riviere, S. Myhra, Handbook of Surface and Interface Analysis: Methods for Problem-Solving, CRC Press, 2009.
[21] J.C. Vickerman, I. Gilmore, Surface analysis: the principal techniques, John Wiley & Sons, 2011.
[22] E.D. Hondros, M.P. Seah, The theory of grain boundary segregation in terms of surface adsorption analogues, Metall. Trans. A. 8 (1977) 1363–1371. doi:10.1007/BF02642850.
[23] D. McLean, Grain boundaries in metals, Clarendon Press, 1957.
[24] R.H. Fowler, E.A. Guggenheim, Statistical thermodynamics, Cambridge University Press
[25] M. Guttmann, Equilibrium segregation in a ternary solution: A model for temper embrittlement, Surf. Sci. 53 (1975) 213–227. doi:10.1016/0039-6028(75)90125-9.
[26] M. Guttmann, Interfacial Segregation and Temper Embrittlement, in: Encycl. Mater. Sci. Technol. Second Ed., Elsevier, Oxford, 2001
123
Chapter 3. Equilibrium grain boundary segregation in Fe-P-C alloy
[27] M. Guttmann, Temper embrittlement and ternary equilibrium segregation, Mater. Sci. Eng. 42 (1980) 227–232. doi:10.1016/0025-5416(80)90032-4.
[28] M.P. Seah, E.D. Hondros, Use of a “BET” analogue equation to describe grain boundary segregation, Scr. Metall. 7 (1973) 735–737. doi:10.1016/0036-9748(73)90124-5.
[29] S. Brunauer, P.H. Emmett, E. Teller, Adsorption of Gases in Multimolecular Layers, J. Am. Chem. Soc. 60 (1938) 309–319. doi:10.1021/ja01269a023.
[30] P. Lejček, S. Hofmann, Grain boundary segregation diagrams of α-iron, Interface Sci. 1 (1993) 163–174. doi:10.1007/BF00203606.
[31] R. Hultgren, D.T. Hawkins, P.D. Desai, Selected values of the thermodynamic properties of binary alloys, American Society for Metals, Metals Park, Ohio, 1973.
[32] P. Lejček, L. Zheng, S. Hofmann, M. Šob, Applied Thermodynamics: Grain Boundary Segregation, Entropy. 16 (2014) 1462–1483. doi:10.3390/e16031462.
[33] L. Priester, Grain boundaries from theory to engineering, Springer, Dordrecht; New York, 2013.
[34] L. Movileanu, E.A. Schiff, Entropy-enthalpy Compensation of Biomolecular Systems in Aqueous Phase: a Dry Perspective, Monatshefte Chem. 144 (2013) 59–65. doi:10.1007/s00706-012-0839-9.
[35] U. Ryde, A fundamental view of enthalpy–entropy compensation, MedChemComm. 5 (2014) 1324. doi:10.1039/C4MD00057A.
[36] J.F. Perez-Benito, M. Mulero-Raichs, Enthalpy-Entropy Compensation Effect in Chemical Kinetics and Experimental Errors: A Numerical Simulation Approach, J. Phys. Chem. A. 120 (2016) 7598–7609. doi:10.1021/acs.jpca.6b08079.
[37] P. Lejček, Enthalpy–entropy compensation effect in grain boundary phenomena, Z. Für Met. 96 (2005) 1129–1133. doi:10.3139/146.101151.
[38] P. Lejček, S. Hofmann, V. Paidar, Solute segregation and classification of [100] tilt grain boundaries in α-iron: consequences for grain boundary engineering, Acta Mater. 51 (2003) 3951–3963. doi:10.1016/S1359-6454(03)00219-2.
[39] J. Janovec, M. Jenko, P. Lejček, J. Pokluda, Grain boundary segregation of phosphorus and silicon in polycrystals and bicrystals of the Fe–2.6Si–0.055P alloy, Mater. Sci. Eng. A. 462 (2007) 441–445. doi:10.1016/j.msea.2006.02.464.
[40] P. Lejček, J. Adámek, S. Hofmann, Anisotropy of grain boundary segregation in Σ = 5 bicrystals of α-iron, Surf. Sci. 264 (1992) 449–454. doi:10.1016/0039-6028(92)90201-G.
124
Chapter 3. Equilibrium grain boundary segregation in Fe-P-C alloy
[41] S. Hofmann, P. Lejěek, J. Adámek, Grain boundary segregation in [100] symmetrical tilt bicrystals of an Fe-Si alloy, Surf. Interface Anal. 19 (1992) 601–606. doi:10.1002/sia.7401901112.
[42] P. Lejček, S. Hofmann, Temperature dependence of the phosphorus segregation at the twin boundary in an Fe-4 at.% Si alloy, Surf. Interface Anal. 16 (1990) 546–551. doi:10.1002/sia.7401601113.
[43] P. Lejček, S. Hofmann, Segregation enthalpies of phosphorus, carbon and silicon at {013} and {012} symmetrical tilt grain boundaries in an Fe-3.5 at.% Si alloy, Acta Metall. Mater. 39 (1991) 2469–2476. doi:10.1016/0956-7151(91)90026-W.
[44] P. Lejček, Characterization of grain boundary segregation in an Fe-Si alloy, Anal. Chim. Acta. 297 (1994) 165–178. doi:10.1016/0003-2670(93)E0388-N.
[45] C.H.P. Lupis, Chemical Thermodynamics of Materials, Elsevier, Amsterdam, 1983.
[46] H.S. Carslaw, J.C. Jaeger, Conduction of Heat in Solids, Clarendon Press, 1986.
[47] A.P. Sutton, V. Vitek, On the Structure of Tilt Grain Boundaries in Cubic Metals I. Symmetrical Tilt Boundaries, Philos. Trans. R. Soc. Math. Phys. Eng. Sci. 309 (1983) 1–36. doi:10.1098/rsta.1983.0020.
[48] H.J. Frost, F. Spaepen, Hard sphere models for the structure of grain boundaries, J. Phys. Colloq. 43 (1982) C6-73-C6-82. doi:10.1051/jphyscol:1982608.
[49] M.F. Ashby, F. Spaepen, S. Williams, The structure of grain boundaries described as a packing of polyhedra, Acta Metall. 26 (1978)1647–1663.doi:10.1016/0001-6160(78)90075-5.
[50] M.F. Ashby, F. Spaepen, A new model for the structure of grain boundaries: Packing of polyhedra, Scr. Metall. 12 (1978) 193–195. doi:10.1016/0036-9748(78)90162-X.
[51] H. Gleiter, On the structure of grain boundaries in metals, Mater. Sci. Eng. 52 (1982) 91–131. doi:10.1016/0025-5416(82)90040-4.
[52] D.L. Medlin, K. Hattar, J.A. Zimmerman, F. Abdeljawad, S.M. Foiles, Defect character at grain boundary facet junctions: Analysis of an asymmetric Σ = 5 grain boundary in Fe, Acta Mater. 124 (2017) 383–396. doi:10.1016/j.actamat.2016.11.017.
[53] A. Biedermann, M. Schmid, B.M. Reichl, P. Varga, Competitive segregation of Si and P on Fe96.5Si3.5 (100) and (110), Fresenius J. Anal. Chem. 353 (1995) 259–262. doi:10.1007/BF00322048.
[54] M. Lavrskyi, H. Zapolsky, A.G. Khachaturyan, Quasiparticle approach to diffusional atomic scale self-assembly of complex structures: from disorder to complex crystals and double-helix polymers, Npj Comput. Mater. 2 (2016). doi:10.1038/npjcompumats.2015.13.
125
Chapter 3. Equilibrium grain boundary segregation in Fe-P-C alloy
[55] P. Lejček, S. Hofmann, Interstitial and substitutional solute segregation at individual grain boundaries of α -iron: data revisited, J. Phys. Condens. Matter. 28 (2016) 064001. doi:10.1088/0953-8984/28/6/064001.
[56] P Lejček,, S. Hofmann, Grain boundary segregation, anisotropy and prediction, in: Encycl. Mater. Sci. Technol. Pergamon, Amsterdam, 2002.
[57] H. Hänsel, H.J. Grabke, Grain boundary segregation of phosphorus and carbon in ferritic iron, Scr. Metall. 20 (1986) 1641–1644. doi:10.1016/0036-9748(86)90411-4.
[58] H.J. Grabke, Surface and Grain Boundary Segregation on and in Iron and Steels, ISIJ Int. 29 (1989) 529–538. doi:10.2355/isijinternational.29.529.
[59] W. Wei, H.J. Grabke, The effect of alloying elements on the grain boundary segregation of phosphorus in iron and the intergranular corrosion of the Fe-P system, Corros. Sci. 26 (1986) 223–236. doi:10.1016/0010-938X(86)90057-0.
[60] S. Suzuki, M. Obata, K. Abiko, H. Kimura, Effect of carbon on the grain boundary segregation of phosphorus in α-iron, Scr. Metall. 17 (1983) 1325–1328. doi:10.1016/0036-9748(83)90225-9.
[61] T. Matsuyama, H. Hosokawa, H. Suto, Tracer Diffusion of P in Iron and Iron Alloys, Trans. Jpn. Inst. Met. 24 (1983) 589–594. doi:10.2320/matertrans1960.24.589.
[62] L. Qingfen, Y. Shanglin, L. Li, Z. Lei, X. Tingdong, Experimental study on non-equilibrium grain-boundary segregation kinetics of phosphorus in an industrial steel, Scr. Mater. 47 (2002) 389–392. doi:10.1016/S1359-6462(02)00151-3.
[63] O.K. von Goldbeck, Iron-X Binary Phase Diagrams, Springer Berlin Heidelberg, Berlin, Heidelberg, 1982.
126
Chapter 4. Solutes segregation under ion irradiation in Fe-P-C model alloy
4. Chapter 4. Solutes segregation under ion irradiation
in Fe-P-C model alloy
As it was shown in Chapter 1, during the last years, phosphorus segregation in RPV
steels and Fe-based model alloys was extensively studied in order to understand the
mechanisms of irradiation embrittlement. However, the dependence of the variation of
phosphorus segregation with GB geometry has not been studied systematically. This is an
open question often ignored in the literature. This chapter will report on the characterization
of intergranular segregation after self-ion irradiation of Fe-P model alloys and its possible
relationship with GB geometry.
In the first part of the current chapter, the structural and chemical investigations of
self-ion irradiated Fe-0.034 at.% P-0.01 at.% C model alloy by STEM-EDX and APT are
presented. Five degrees of freedom were determined for each GB using combined APT/TKD
method. The relationship between GB geometry and segregation intensity is discussed. Also,
phosphorus clusters and its segregation on the dislocation lines are observed. The density of
dislocations and voids is determined from the STEM images and considered in the modeling.
In order to gain a better understanding of the mechanism of intergranular segregation,
a Faulkner’s RIS model for dilute alloys was applied to predict the segregation behavior of
phosphorus to GBs in irradiated Fe-0.034 at.% P-0.01 at.% C model alloy. A detailed
description of the model and comparison with experimental data is given in the second part of
this chapter.
127
Chapter 4. Solutes segregation under ion irradiation in Fe-P-C model alloy
4.1 Radiation-induced segregation related to the grain boundary
structure
4.1.1 Phosphorus segregation as a function of irradiation depth
As explained in Chapter 2, self-ion irradiations were used to get insight in the
understanding of the effects of neutron irradiation on phosphorous intergranular segregation.
However, because of high electronic energy loss, ions lose energy quickly, giving rise to
spatially non uniform energy deposition profile [1]. The penetration distance of 10 MeV Fe5+
ions into iron target, according to the SRIM calculation, is approximately 2.5 µm. It is thus
considered that in the depth range from 300 to 1000 nm there is no influence of sample
surface and a limited number of implanted iron ions. But at least, there is an effect of the dose
rate and PKA spectrum, in comparison to neutron irradiation condition. Moreover, the method
for APT tip preparation used in this work, suffer from uncertainty in the determination of the
sample depth extraction. According to the more widely used method, the irradiated surface is
located perpendicular to the microtip axis (Fig. 4.1). The layer of Pt on the top allows to the
operator to control the depth of milling with high accuracy (below 10 nm).
Fig. 4.1. Schematic image of the irradiated sample welded to the microtip post. The implanted surface is
oriented perpendicular to the axis of microtip post
In our case, in order to control the process of milling by TKD mapping [2,3] and to
minimize the 3D atomic reconstruction artifacts, the GB was oriented perpendicular to the tip
axis. The delicate part of the machining is the control of the erosion in the irradiatied volume
Pt layer Sample Pt weld
Microtip post
Irradiation direction
128
Chapter 4. Solutes segregation under ion irradiation in Fe-P-C model alloy
after the milling of the Pt layer, which is the only indicator of the surface location. One must
keep in mind that the APT tip apex with a GB in must be formed in a depth range of 0.5 to 1
µm (Fig. 4.2). According to the SRIM calculation, this depth range corresponds to a roughly
homogeneous irradiation with a dose rate variation of only 2.5 × 10⁻⁵ to 4 × 10⁻⁵ 𝑑𝑑𝑑𝑑𝑑𝑑/𝑠𝑠.
Fig. 4.2. The specimen with a size 10×4×2 µm3 is placed onto a W-microtip post using micromanipulator. The
homogeneous irradiated part between 0.5 and 1µm depth is shown by dotted red lines
In order to verify that the phosphorus segregation along GB in the direction of
irradiation, especially in the range from 0.5 to 1 µm, is homogenous, TEM lamellae
containing GB was prepared. An in situ lift-out technique using DualBeam Focused Ion Beam
Scanning Electron Microscope (FIB-SEM) was used to extract a thin foil from across a GB
43°[100] in the Fe-0.034 at.% P-0.01 at.% C model alloy irradiated at 450°C using Fe ions at
a dose rate 3 × 10⁻⁵ 𝑑𝑑𝑑𝑑𝑑𝑑/𝑠𝑠.
Since the foil is a cross section of the irradiated sample, phosphorus GB segregation
can be examined as a function of irradiation depth. Phosphorus GB segregation has been
measured by Energy-Dispersive X-ray Analysis (EDX) using the GPM’s scanning
transmission electron microscope with a field emission electron source (FEG-STEM).
The phosphorus concentration is plotted as a function of depth below the surface
(Fig. 4.3, red dots). The analysis revealed an approximately constant value of phosphorus
segregation in the depth range from 0.3 to 1.2 µm. Thus, the distribution of phosphorus is
homogenous in the area of the APT tip preparation, which is between 0.5 and 1 µm.
Fe5+ irradiation
Microtip post Specimen
0.5 µm 1 µm
GB
129
Chapter 4. Solutes segregation under ion irradiation in Fe-P-C model alloy
Fig. 4.3. STEM-EDX measurement of phosphorus concentration at general 43°[100] GB, as well as dose
evolution as a function of irradiation depth
4.1.2 Radiation-induced segregation at grain boundaries
In our study, the effect of irradiation was studied on a Fe-0.034 at.% P-0.01 at.% C
model alloy after a stress relieve heat treatment (SRHT) at 650°C for 2h. This material was
irradiated at 450°C with 10 MeV Fe5+ ions to three irradiation doses (0.075 ± 0.025; 0.38 ±
0.12; 0.75 ± 0.25 dpa). The GB chemistry was examined using APT.
Atom probe analysis revealed that phosphorus and carbon atoms segregate at GBs.
Fig. 4.4a presents a typical 3D APT reconstruction, with a clear enrichment of phosphorus
atoms at GB. This was obtained in an APT tip prepared from the sample irradiated to 0.75 dpa
and containing a HAGB with a misorientation of 43°[100](11-1)/(3-50). Fig. 4.4b shows that
the distribution of phosphorus atoms in the GB plane is homogenous in this HAGB. The
different experiments show the same behavior in LAGBs.
130
Chapter 4. Solutes segregation under ion irradiation in Fe-P-C model alloy
(a) (b)
Fig. 4.4. (a) 3D APT reconstruction of a small volume of the Fe-0.034 at.% P-0.01 at.% C alloy irradiated at 450°C
up to 0.75 ± 0.25 dpa. In figure (a) the phosphorus and carbon atoms distribution clearly reveal the 43°[100] (11-
1)/(3-50) GB and figure (b) shows the distribution of phosphorus atoms on this GB plane
Five degrees of freedom were determined for each GB using combined APT/TKD
method. Monolayer coverages of phosphorus and carbon atoms with the corresponding GB
geometry are presented in Table 4.1.
Despite the large dispersion of values for each GB, the mean phosphorus segregation
at HAGBs increases with irradiation dose. In the sample irradiated to 0.075 ± 0.025 dpa,
phosphorus GB segregation reaches on the average 0.22 ± 0.05 monolayer. With increasing
the dose to 0.38 ± 0.12 dpa, phosphorus GB segregation reaches 0.29 ± 0.08 monolayer. The
sample irradiated to the highest dose, 0.75 ± 0.25 dpa, shows the most important phosphorus
segregation level at boundaries with the average value of 0.36 ± 0.14 monolayers and the
highest value of 0.50 ± 0.01 monolayer at 43°[100] (-3-21)/(-521) GB. The lowest phosphorus
segregation (0.15 ± 0.03 monolayer) was obtained for the lowest-angle GB, i.e. 8°[101](-3-
23)/(-2-12).
Two APT specimens with different orientations (43°[100](11-1)/(3-50) and 43°[100](-
3-21)/(-521)) where prepared from one large GB. Indeed, when the GB surface is spatially
curved, these two samples, in two different area of the curve surface have different GB plane
orientations. Both phosphorus and carbon segregation levels vary significantly from one GB
to another. This is an indicator of the strong variations in GB energies depending on their
geometries. As we can see from Table 4.1 the phosphorus segregation at 43°[100](-3-21)/(-
521) GB is ~ 30% higher than at 43°[100](11-1)/(3-50) GB.
As for as carbon segregation is concerned, the segregation level does not change with
irradiation dose (0.20 ± 0.05 monolayer after irradiation to 0.075 dpa, 0.20 ± 0.06 monolayer
after 0.38 dpa and 0.19 ± 0.04 monolayer after 0.75 dpa). It seems that both the GB structure
10 nm 10 nm
131
Chapter 4. Solutes segregation under ion irradiation in Fe-P-C model alloy
and the phosphorus segregation influence on the value of carbon GB segregation. The lowest
carbon segregation (0.13 ± 0.02 monolayer) was observed in the lowest-angle 8°[101](-3-
23)/(-2-12) GB. Other low carbon segregation (0.14 ± 0.01 monolayer) corresponds with the
The prediction of radiation enhanced and total (combined radiation enhanced and
radiation induced) phosphorus segregation in Fe-0.034 at.% P-0.01 at.% C alloy irradiated to
three different doses is presented in Fig. 4.10.
Radiation-induced segregation (RIS) caused by phosphorus-interstitial complex
diffusion is absolutely dominant below approximately 500°C and equilibrium segregation
144
Chapter 4. Solutes segregation under ion irradiation in Fe-P-C model alloy
dominates above this temperature. The segregation peak occurs in a temperature range
between 400 and 450°C. Below these temperatures, the maximum non-equilibrium
segregation amount is larger, but kinetics processes are slower, and above these temperatures,
the segregation is still lower because of lower maximum segregation values. Consequently,
the predictions from the model suggest that the magnitude of the segregation peak increases
and shifts to lower temperatures with increasing dose (irradiation time) at the same dose rate.
Fig. 4.10. Model prediction of radiation-enhanced (RES) and combined radiation enhanced and radiation
induced segregations (RES+RIS) of phosphorus in Fe-0.034 at.% P-0.01 at.% C alloy as a function of irradiation
temperature and dose (a dose rate is 3 × 10⁻⁵ 𝑑𝑑𝑑𝑑𝑑𝑑/𝑠𝑠)
Experimental studies of low-alloy ferritic steel revealed that in a range from 400°C to
550°C temper embrittlement associated with GB segregation of phosphorus occurs and leads
to intergranular fracture [10,45,54]. Thus, Faulkner’s model satisfactorily indicates the area of
considerable phosphorus segregation.
Phosphorus segregation kinetics modelling is compared with experimental data on
phosphorus segregation in Fe-0.034 at.% P-0.01 at.% C model alloy. Fig. 4.11 shows
radiation-enhanced segregation (RES) and combined radiation enhanced and induced
segregation (RIS+RES) kinetics. The phosphorus GB segregation before irradiation, in the
samples after stress relieve heat treatment (SRHT) is 0.12 ± 0.01 monolayer. In figure it is
shown by black dash line.
RES+RIS
RES
145
Chapter 4. Solutes segregation under ion irradiation in Fe-P-C model alloy
The equilibrium GB segregation of phosphorus at 450°C is 0.17 ± 0.02 monolayer.
The diffusion coefficient of phosphorus in steels at this temperature is 5.8 × 10⁻²¹ 𝑐𝑐/𝑠𝑠.
According to the segregation kinetics model of McLean (see Chapter 3), more than 3000 h
needs to reach the equilibrium GB segregation. While under ion irradiation, the coefficient of
radiation-enhanced diffusion of phosphorus is equal to 9 × 10⁻¹³ 𝑐𝑐/𝑠𝑠, so the equilibrium GB
segregation (0.17 ± 0.02 monolayers of phosphorus) is reached faster. Therefore, the
radiation-enhanced mechanism of segregation is shown by the straight solid pink line, which
indicates the equilibrium GB segregation of phosphorus at 450°C. As it was noted before,
experimental data exceed the predicted equilibrium value of phosphorus GB segregation at
450°C. One exception is the GB with a low misorientation angle: 8°[101] (-3-23)/(-2-12).
Fig. 4.11. Comparison of predicted (solid lines) dose dependence of phosphorus grain boundary segregation in
Fe-0.034 at.% P-0.01 at.% C ( dose rate = 3 × 10⁻⁵ 𝑑𝑑𝑑𝑑𝑑𝑑/𝑠𝑠 ) with experimental data (symbols). The pink and
blue solid lines represents kinetics of combined radiation enhanced and induced segregation (RIS+RES) and
radiation-enhanced segregation (RES), respectively. The black dash line indicates the level of phosphorus GB
segregation before irradiation, in the samples after stress relieve heat treatment (SRHT)
We can say that the experimental results are broadly comparable with RIS-RES model
prediction. However, there is a spread of segregation due to GB structure effects, which will
be discussed later.
RIS model of Faulkner together with experimental data from thermal aged samples
allows to us to distinguish the nature of phosphorus segregation at GBs. For instance, the total
amount of phosphorus segregation at 43°[100] (11-1)/(3-50) GB is ~ 0.36 monolayer. Of
them: ~ 0.12 monolayer (~ 33% from the total amount) was segregated during stress relieve
146
Chapter 4. Solutes segregation under ion irradiation in Fe-P-C model alloy
heat treatment, ~ 0.05 monolayer (~ 14% from the total amount) is the radiation-enhanced
segregation via the vacancy mechanism, and ~ 0.19 monolayer (~ 53% from the total amount)
is radiation-induced segregation via phosphorus-interstitial complex diffusion.
Thus, considering the experimental data from the heat treated samples and the results
of equilibrium and radiation-induced GB segregation modelling, it is possible to qualitatively
distinguish the participation of each mechanism in the formation of the final value of
phosphorus GB segregation. Also, Faulkner’s model based on coupled interstitial point defect
and solute fluxes represented the general behavior of RIS in Fe-0.034 at.% P-0.01 at.% C
model alloy and satisfactorily indicates the temperature range where phosphorus GB
segregation reaches the maximum level. Furthermore, as it was shown in many works of
Faulkner and his colleges [9–11,13,37,55,56], the model also can sufficiently indicates the
effects of dose, dose rate, dislocation and void density, grain size and considers the presence
other solute elements in the bulk.
4.3 Discussion
Faulkner’s RIS model along with many others presents the segregation of phosphorus
to GBs acting as perfect sinks. However, variation in GB nature may influence the sink
efficiency and thus the segregation level. In the current work, the large dispersion of the
values is observed. For example, intergranular phosphorus segregation in sample irradiated to
0.75 dpa may vary from 21% to 50%. Moreover, there is some variation of phosphorus
segregation along GB.
Due to the complicated structure of GBs (5 DOFs, GB curvature, faceting), there is no
simple rule to link a GB geometrical parameter to its segregation level [57]. The segregation
variations have been first attributed to the different GB plane orientations. The previous
Auger electron spectroscopy analyses, after fracture, demonstrated that larger phosphorus
segregation occurs at GBs with high Miller index planes, while the segregation is low for
those with low index planes [58–60]. Also, Ogura et al. [58] have found a correlation between
the boundary straightness and the phosphorus segregation level: there is lower phosphorus
segregation at straight boundaries, and higher at curved GBs.
Fig. 4.12 shows the combined band contrast (BC) and grain boundary (GB) map of the
Fe-0.034 at.% P-0.01 at.% C model alloy, which was obtained by EBSD. The red and yellow
arrows indicate the straight and curved GBs, respectively.
147
Chapter 4. Solutes segregation under ion irradiation in Fe-P-C model alloy
Fig. 4.12. The combined band contrast (BC) and grain boundary (GB) EBSD map of the Fe-0.034 at.% P-0.01
at.% C model alloy. The red and yellow arrows indicate the straight and curved GBs, respectively
The GBs, whose traces are observed straight or with boundaries having long straight
segment are referred to as straight boundaries. However, they are not necessarily straight on
an atomic scale. The GBs, whose traces are observed curved, i.e. the GB plane orientation
change along the boundary are referred to as curved boundaries. However, the curved
boundaries may be decomposed in planar segments and presented as a set of facets with low
indices [61].
In order to measure the local curvature of GB traces, the concept of curvature at a
point on a surface, describing in [62], was used. Fig. 4.13 shows a curve in the XY plane. To
define the curvature at a point P place two other points, A and B, on the curve. Construct a
circle through these three points. This circle has a center, O, and a radius r. Now let A and B
approach P. The point O moves and the radius changes. In the limit as A and B arrive at P, the
center approaches the center of curvature for the point P, and the radius becomes the radius of
curvature. The curvature of the curve at P is the reciprocal of this radius.
148
Chapter 4. Solutes segregation under ion irradiation in Fe-P-C model alloy
Fig. 4.13. Curvature at a point P on a curve in two dimensional space is the reciprocal of the radius of a circle
that passes through three adjacent points (A,P and B) on the curve at P [62]
It can also be shown that the curvature is the rate of rotation of the tangent to the curve
as the point P moves along the arc length, s:
𝑘𝑘 =1𝑛𝑛
=𝑑𝑑𝜃𝜃𝑑𝑑𝑠𝑠
(122)
where 𝜃𝜃 is the angle between curve and tangent.
In order to check the influence of GB plane orientation and straightness to phosphorus
segregation level, the closest low-index plane (deviation angle less than 10°) and the
boundary curvature 𝑘𝑘 was determined for each GB and given in Table 4.3. For straight GBs
the 𝑘𝑘 = 0.
With regard to the GBs statistics, the GB straightness seems to be the most influential
factor. In the sample irradiated to 0.075 ± 0.025 dpa, phosphorus is enriched to 0.20 ± 0.01
monolayers at curved GB with low misorientation angle 12°[-331]{221}/{211}, which is
slightly higher than phosphorus segregation (0.17 ± 0.01 monolayer) at HAGB 31°[01-2]
{130}/{001}. A similar behavior is observed in the sample irradiated to 0.75 ± 0.25 dpa. The
phosphorus segregation (0.35 ± 0.02 monolayers) at curved 12°[-335]{221}/{221} GB is
higher than the segregation (0.21 ± 0.01 monolayers) at straight 34°[10-1] {211}/{311} GB
with higher misorientation angle.
In the sample irradiated to 0.38 ± 0.12 dpa, two GBs have a very similar structure: GB
45°[41-1]{311}/{321} and 41°[-441]{311}/{311}. Both of them have high misorientation
angle, high index rotation axis and high index GB planes. But curved GB 45°[41-
149
Chapter 4. Solutes segregation under ion irradiation in Fe-P-C model alloy
1]{311}/{321} has higher phosphorus segregation (0.37 ± 0.01 monolayer) than straight GB
41°[-441]{311}/{311} (0.21 ± 0.01 monolayer).
Table 4.3. Summary of GB plane orientations given in nearest low Miller indices, GB curvatures and related
phosphorus segregation
Dose (dpa)
𝜽𝜽 (°)
[hkl] (hkl)1 Nearest low Miller
indexes
Deviation (°)
(hkl)2 Nearest low Miller
indexes
Deviation (°)
𝒌𝒌, GB curvature (103 m-1)
𝑪𝑪𝑷𝑷𝚽𝚽 (mono-layers)
0.075 12 -331 22-1 {221} 0 3-22 {211} 8 2.9 0.20
31 01-2 1-30 {130} 0 010 {001} 0 0 0.17
42 113 250 {120} 4.8 -322 {211} 8 1.5 0.27
0.38 8 101 32-3 {111} 10 21-2 {120} 0 0 0.15
41 -441 521 {311} 7 251 {311} 7 0 0.21
45 41-1 15-1 {311} 9.5 -413 {321} 5 0.9 0.37
0.75 12 1-11 -335 {211} 5 5-34 {221} 8 3.6 0.35
34 10-1 32-2 {211} 8.5 52-1 {311} 7.8 0 0.21
44 100 11-1 {111} 0 3-50 {120} 4.4 4.5 0.36
44 100 32-1 {321} 0 -521 {311} 7.8 4.5 0.50
To the author’s knowledge, the influence of boundary curvature on the segregation
intensity has not been investigated from the theoretical point of view. Thus our results suggest
the direction for future theoretical development.
The influence of the GB plane orientation was determined by comparing two samples
from a same curved GB. It was found that the GB area with higher nearest Miller indices
43°[100]{321}/{311} has greater phosphorus segregation level (0.50 ± 0.01 monolayer) than
GB 43°[100]{111}/{120} with relatively low index GB plane (0.36 ± 0.01 monolayer).
A possible explanation for this phenomenon can be the presence of larger excess
volume for high Miller index GBs [63–65]. According to the structural unit model, the GB
excess volume describes how much expansion is induced by the presence of a GB in a
material [66]. Wolf et al. [67,68] was one of the first who calculated that the low-index GB
planes in polycrystal are associated with low-energy and small amount of volume expansion.
However, there are some contradictory examples, which showed that low indexed GB plane
are not necessarily associated with the low GB energy and segregation [69,70]. Our result is
in agreement with the theory of Wolf, but the statistics is low (only one GB).
Thus, our study has distinguished the significant influence of GB plane orientation and
curvature on phosphorus segregation level. The main advantage of our results is the atomic-
150
Chapter 4. Solutes segregation under ion irradiation in Fe-P-C model alloy
scale observing, which can support the simulation works at the same scale. The main
limitation of the experimental results is low statistics. Clearly, more experimental and
theoretical researches are still necessary before obtaining a definitive correlation between GB
structure and intergranular segregation.
As it was noted before, the Faulkner’s model assumes that the GBs are perfect sinks.
This model was useful for us to distinguish the different segregation mechanisms of
phosphorus under thermal and irradiation ageing. However, this approach does not enable us
to consider GB structure effect, since there is no GB sink efficiency in the model.
Further study is needed to develop the atomic scale model for anticipating the GB
energy (sink efficiency) to the boundary structure. Until recently, studies of GB energy have
been generally limited a small number of GBs. Most of them has studied symmetrical tilt and
twist GBs and presented the GB energy as a function of misorientation angle or boundary
coincidence Σ [71–76]. A few atomistic simulations have explored the role of GB plane
orientation on the structure of asymmetrical GBs [69,70,72,77]. For general GBs with mixed
(tilt and twist) structure the GB energies should be calculated over all five degrees-of-
freedom. In recent years, great effort has been devoted to the computational study of GB
structure and energy. Several authors [78–82] have reported the GB energy as a function of all
macroscopic five crystallographic parameters. Despite of the considerable effort that has been
devoted, the computational study of GB is still not trivial. The new approach has to consider
the infinite number of different GBs depending on the misorientation between the two grains
and GB plane orientation.
The further step is to apply this atomic-scale model to RIS. It has been shown [83–85]
that the defect structure at GB and subsequently the sink efficiency can evolve in a complex
manner during irradiation. In addition, our results have shown the influence of GB plane
curvature on the segregation level. These factors will complicate the prediction of RIS in RPV
steel. Moreover, interaction between different solutes at GB should be taken into account.
151
Chapter 4. Solutes segregation under ion irradiation in Fe-P-C model alloy
Conclusion
In the first part of this chapter, intra granular and intergranular phosphorus segregation
in self-ion irradiated Fe-0.034 at.% P-0.01 at.% C model alloy were studied using atomic-
scale resolution techniques. The STEM-EDX analysis revealed the homogeneous distribution
of phosphorus in the area of the APT tip preparation, which is between 0.5 and 1 µm.
A few APT experiments revealed phosphorus clustering and segregation on
dislocation lines. STEM study has shown that during 10 MeV Fe5+ ion irradiation at 450°C of
the Fe-0.034 at.% P-0.01 at.% C model alloy up to 0.75 dpa, irradiation damage becomes
apparent in the form of a dislocation array and voids down to 2 µm depth. The number density
of dislocations and voids were measured and included in the total sink strength, which
appears in the radiation-induced segregation model.
The APT analysis of the Fe-0.034 at.% P-0.01 at.% C after ion irradiation up to 0.75
dpa has shown that the mean phosphorus segregations at HAGBs increases with irradiation
dose, while the carbon GB segregation does not change. The phosphorus segregation at high-
angle GBs in all irradiated samples is larger than the equilibrium GB segregation of
phosphorus at the same temperature. It was suggest the presence and influence of flux
coupling effect between irradiation point defect and phosphorus atoms, i.e. a radiation-
induced segregation (RIS) mechanism.
Further modeling using Faulkner’s model has demonstrated that RIS of phosphorus
caused by phosphorus-interstitial complex diffusion is absolutely dominant mechanism in the
Fe-0.034 at.% P-0.01 at.% C model alloy under ion irradiation at 450°C using 10 MeV Fe5+
ions at a dose rate 3.0 × 10⁻⁵ 𝑑𝑑𝑑𝑑𝑑𝑑/𝑠𝑠. Considering the experimental data from the heat treated
samples and the results of equilibrium and radiation-induced GB segregation modelling, it
was qualitatively distinguished the participation of each mechanism in the formation of the
final value of phosphorus GB segregation.
It was found the experimental evidence of the higher phosphorus segregation at curved
GBs than at straight one. Also, it was demonstrated that larger phosphorus segregation occurs
at GBs with high Miller index planes, while the segregation is low for those with low index
planes. In the discussion part it was concluded that analytical models similar to the Faulkner’s
one oversimplify the RIS process. Therefore, further study is needed to develop the atomic
scale model for anticipating the GB properties (energy, sink efficiency, solute segregation) to
the boundary structure.
152
Chapter 4. Solutes segregation under ion irradiation in Fe-P-C model alloy
References
[1] G.S. Was, R.S. Averback, Radiation Damage Using Ion Beams, in: Compr. Nucl. Mater., Elsevier, 2012: pp. 195–221. doi:10.1016/B978-0-08-056033-5.00007-0.
[2] K. Babinsky, R. De Kloe, H. Clemens, S. Primig, A novel approach for site-specific atom probe specimen preparation by focused ion beam and transmission electron backscatter diffraction, Ultramicroscopy. 144 (2014) 9–18. doi:10.1016/j.ultramic.2014.04.003.
[3] K. Babinsky, W. Knabl, A. Lorich, R. De Kloe, H. Clemens, S. Primig, Grain boundary study of technically pure molybdenum by combining APT and TKD, Ultramicroscopy. doi:10.1016/j.ultramic.2015.05.014.
[4] O.K. von Goldbeck, Iron-X Binary Phase Diagrams, Springer Berlin Heidelberg, Berlin, Heidelberg, 1982.
[5] R.K. Ham, The determination of dislocation densities in thin films, Philos. Mag. 6 (1961) 1183–1184. doi:10.1080/14786436108239679.
[6] E.A. Little, D.A. Stow, Void-swelling in irons and ferritic steels, J. Nucl. Mater. 87 (1979) 25–39. doi:10.1016/0022-3115(79)90123-5.
[7] L.K. Mansur, M.H. Yoo, The effects of impurity trapping on irradiation-induced swelling and creep, J. Nucl. Mater. 74 (1978) 228–241. doi:10.1016/0022-3115(78)90362-8.
[8] I.M. Neklyudov, V.N. Voyevodin, Features of structure-phase transformations and segregation processes under irradiation of austenitic and ferritic-martensitic steels, J. Nucl. Mater. 212–215 (1994) 39–44. doi:10.1016/0022-3115(94)90031-0.
[9] R.G. Faulkner, S. Song, P.E.J. Flewitt, M. Victoria, P. Marmy, Grain boundary segregation under neutron irradiation in dilute alloys, J. Nucl. Mater. 255 (1998) 189–209. doi:10.1016/S0022-3115(98)00022-1.
[10] R.G. Faulkner, S. Song, P.E.J. Flewitt, A model describing neutron irradiation-induced segregation to grain boundaries in dilute alloys, Metall. Mater. Trans. A. 27 (1996) 3381–3390. doi:10.1007/BF02595431.
[11] R.G. Faulkner, N.C. Waite, E.A. Little, T.S. Morgan, Radiation-induced grain boundary segregation in dilute alloys, Mater. Sci. Eng. A. 171 (1993) 241–248. doi:10.1016/0921-5093(93)90411-7.
[12] R.G. Faulkner, Combined grain boundary equilibrium and non-equilibrium segregation in ferritic/martensitic steels,Acta Metall. 35(1987) 2905–2914. doi:10.1016/0001-6160(87)90289-6.
153
Chapter 4. Solutes segregation under ion irradiation in Fe-P-C model alloy
[13] Z. Lu, R.G. Faulkner, Irradiation Assisted Grain Boundary Segregation in Steels, Materials Research Society, Warrendale, 2008.
[14] L. Messina, M. Nastar, P. Olsson, Ab initio-based investigation of solute-dumbbell transport and radiation induced segregation in Fe-X (X= Cr, Cu, Mn, Ni, P, Si) dilute alloys, 2015.
[15] A. Barbu, A.B. Lidiard, Solute segregation in dilute bcc alloys under irradiation, Philos. Mag. A. 74 (1996) 709–722. doi:10.1080/01418619608243537.
[16] C. Domain, C.S. Becquart, Diffusion of phosphorus in α-Fe: An ab initio study, Phys. Rev. B. 71 (2005) 214109. doi:10.1103/PhysRevB.71.214109.
[18] G.S. Was, Fundamentals of Radiation Materials Science: Metals and Alloys, Springer Science & Business Media, 2007.
[19] P.T. Heald, M.V. Speight, Point defect behaviour in irradiated materials, Acta Metall. 23 (1975) 1389–1399.
[20] S.B. Fisher, R.J. White, K.M. Miller, Quantitative analysis of void swelling in pure copper, Philos. Mag. A. 40 (1979) 239–255. doi:10.1080/01418617908243101.
[21] F. Laliberte, L. Boldon, L. Liu, A Review of the Application of Rate Theory to Simulate Vacancy Cluster Formation and Interstitial Defect Formation in Reactor Pressure Vessel Steel., J. Eng. Sci. Technol. Rev. 8 (2015).
[22] R. Bullough, M.H. Wood, Mechanisms of radiation induced creep and growth, J. Nucl. Mater. 90 (1980) 1–21. doi:10.1016/0022-3115(80)90241-X.
[23] A.D. Brailsford, R. Bullough, M.R. Hayns, Point defect sink strengths and void-swelling, J. Nucl. Mater. 60 (1976) 246–256. doi:10.1016/0022-3115(76)90139-2.
[24] T.M. Williams, A.M. Stoneham, D.R. Harries, The segregation of boron to grain boundaries in solution-treated Type 316 austenitic stainless steel, Met. Sci. 10 (1976) 14–19. doi:10.1179/030634576790431471.
[25] R.G. Faulkner, Non-equilibrium grain-boundary segregation in austenitic alloys, J. Mater. Sci. 16 (1981) 373–383. doi:10.1007/BF00738626.
[26] D. McLean, Grain boundaries in metals, Clarendon Press, 1957.
[27] M. Guttmann, Equilibrium segregation in a ternary solution: A model for temper embrittlement, Surf. Sci. 53 (1975) 213–227. doi:10.1016/0039-6028(75)90125-9.
154
Chapter 4. Solutes segregation under ion irradiation in Fe-P-C model alloy
[28] L.E. Rehn, Production of freely-migrating defects, J. Nucl. Mater. 174 (1990) 144–150. doi:10.1016/0022-3115(90)90228-F.
[29] L. Messina, M. Nastar, T. Garnier, C. Domain, P. Olsson, Exact ab initio transport coefficients in bcc Fe − X ( X = Cr , Cu , Mn , Ni , P , Si ) dilute alloys, Phys. Rev. B. 90 (2014). doi:10.1103/PhysRevB.90.104203.
[30] L. De Schepper, D. Segers, L. Dorikens-Vanpraet, M. Dorikens, G. Knuyt, L.M. Stals, P. Moser, Positron annihilation on pure and carbon-doped α -iron in thermal equilibrium, Phys. Rev. B. 27 (1983) 5257–5269. doi:10.1103/PhysRevB.27.5257.
[31] A. Hardouin Duparc, C. Moingeon, N. Smetniansky-de-Grande, A. Barbu, Microstructure modelling of ferritic alloys under high flux 1 MeV electron irradiations, J. Nucl. Mater. 302 (2002) 143–155. doi:10.1016/S0022-3115(02)00776-6.
[32] G.J. Ackland, M.I. Mendelev, D.J. Srolovitz, S. Han, A.V. Barashev, Development of an interatomic potential for phosphorus impurities in -iron, J. Phys. Condens. Matter. 16 (2004) S2629–S2642. doi:10.1088/0953-8984/16/27/003.
[33] A.D. Le Claire, G. Neumann, Diffusion in impurities in Solid Metallic Elements, in: Diffus. Solid Met. Alloys, Springer-Verlag, 1990.
[34] C. Domain, C.S. Becquart, Ab initio calculations of defects in Fe and dilute Fe-Cu alloys, Phys. Rev. B. 65 (2001). doi:10.1103/PhysRevB.65.024103.
[35] A.A. Vasiliev, V.V. Rybin, A.A. Zisman, The nature of the phosphorus atom mobility in bcc iron irradiated at low temperatures, J. Nucl. Mater. 231 (1996) 249–253. doi:10.1016/0022-3115(96)00201-2.
[36] E. Meslin, C.-C. Fu, A. Barbu, F. Gao, F. Willaime, Theoretical study of atomic transport via interstitials in dilute Fe − P alloys, Phys. Rev. B. 75 (2007). doi:10.1103/PhysRevB.75.094303.
[38] K. Tapasa, A.V. Barashev, D.J. Bacon, Y.N. Osetsky, Computer simulation of carbon diffusion and vacancy–carbon interaction in α-iron, Acta Mater. 55 (2007) 1–11. doi:10.1016/j.actamat.2006.05.029.
[39] C. Domain, C.S. Becquart, J. Foct, Ab initio study of foreign interstitial atom (C, N) interactions with intrinsic point defects in α -Fe, Phys. Rev. B. 69 (2004). doi:10.1103/PhysRevB.69.144112.
[40] B.-J. Lee, A modified embedded-atom method interatomic potential for the Fe–C system, Acta Mater. 54 (2006) 701–711. doi:10.1016/j.actamat.2005.09.034.
155
Chapter 4. Solutes segregation under ion irradiation in Fe-P-C model alloy
[41] H. Hurchand, S.D. Kenny, C.F. Sanz-Navarro, R. Smith, P.E.J. Flewitt, The influence of P solutes on an irradiated α-Fe matrix, Nucl. Instrum. Methods Phys. Res. Sect. B Beam Interact. Mater. At. 229 (2005) 92–102. doi:10.1016/j.nimb.2004.11.010.
[42] P. Paufler, R. W. Cahn, P. Haasen (eds). Physical metallurgy 3rd revised and enlarged edition. North-Holland physics publishing, (1985) 270–270. doi:10.1002/crat.2170200229.
[43] M. Kiritani, H. Takata, K. Moriyama, F.E. Fujita, Mobility of lattice vacancies in iron, Philos. Mag. A. 40 (1979) 779–802.
[44] L. Qingfen, Y. Shanglin, L. Li, Z. Lei, X. Tingdong, Experimental study on non-equilibrium grain-boundary segregation kinetics of phosphorus in an industrial steel, Scr. Mater. 47 (2002) 389–392. doi:10.1016/S1359-6462(02)00151-3.
[45] H. Nakata, K. Fujii, K. Fukuya, R. Kasada, A. Kimura, Grain Boundary Phosphorus Segregation in Thermally Aged Low Alloy Steels, J. Nucl. Sci. Technol. 43 (2006) 785–793. doi:10.1080/18811248.2006.9711160.
[46] S. Song, R.G. Faulkner, Diffusion Characteristics of Interstitial and Vacancy Based Complexes, Defect Diffus. Forum. 143–147 (1997) 149–154. doi:10.4028/www.scientific.net/DDF.143-147.149.
[47] R.A. Johnson, N.Q. Lam, Solute segregation in metals under irradiation, Phys. Rev. B. 13 (1976) 4364–4375. doi:10.1103/PhysRevB.13.4364.
[48] L. Messina, M. Nastar, N. Sandberg, P. Olsson, Systematic electronic-structure investigation of substitutional impurity diffusion and flux coupling in bcc iron, (2015).
[49] Y. Katoh, T. Muroga, A. Kohyama, R.E. Stoller, C. Namba, Rate theory modeling of defect evolution under cascade damage conditions: the influence of vacancy-type cascade remnants on defect evolution, J. Nucl. Mater. 233–237 (1996) 1022–1028. doi:10.1016/S0022-3115(96)00088-8.
[50] D. Meade, Grain boundary segregation of impurity elements in reactor pressure vessel steels, PhD thesis, Loughborough University, 1998. Available at: https://dspace.lboro.ac.uk/dspace-jspui/handle/2134/16934 (accessed May 29, 2017).
[51] R. Wu, A.J. Freeman, G.B. Olson, On the electronic basis of the phosphorus intergranular embrittlement of iron, J. Mater. Res. 7 (1992) 2403–2411. doi:10.1557/JMR.1992.2403.
[52] N.R. Rhodes, M.A. Tschopp, K.N. Solanki, Quantifying the energetics and length scales of carbon segregation to α -Fe symmetric tilt grain boundaries using atomistic simulations, Model. Simul. Mater. Sci. Eng. 21 (2013) 035009. doi:10.1088/0965-0393/21/3/035009.
156
Chapter 4. Solutes segregation under ion irradiation in Fe-P-C model alloy
[53] P. Lejček, S. Hofmann, Segregation enthalpies of phosphorus, carbon and silicon at {013} and {012} symmetrical tilt grain boundaries in an Fe-3.5 at.% Si alloy, Acta Metall. Mater. 39 (1991) 2469–2476. doi:10.1016/0956-7151(91)90026-W.
[54] S. Song, Z. Yuan, D. Shen, L. Weng, Effects of phosphorus grain boundary segregation and hardness on the ductile-to-brittle transition for a 2.25Cr1Mo steel, J. Wuhan Univ. Technol.-Mater Sci Ed. 22 (2007) 1–6. doi:10.1007/s11595-005-1001-x.
[55] R.G. Faulkner, R.B. Jones, Z. Lu, P.E.J. Flewitt, Grain boundary impurity segregation and neutron irradiation effects in ferritic alloys, Philos. Mag. 85 (2005) 2065–2099. doi:10.1080/14786430412331331853.
[56] Z. Lu, R.G. Faulkner, P.E.J. Flewitt, The role of irradiation-induced phosphorus segregation in the ductile-to-brittle transition temperature in ferritic steels, Mater. Sci. Eng. A. 437 (2006) 306–312. doi:10.1016/j.msea.2006.07.114.
[57] L. Priester, Grain boundaries from theory to engineering, Springer, Dordrecht; New York, 2013.
[58] T. Ogura, C.J. McMahon Jr., H.C. Feng, V. Vitek, Structure-dependent intergranular segregation of phosphorus in austenite in a Ni-Cr steel, Acta Metall. 26 (1978) 1317–1330. doi:10.1016/0001-6160(78)90147-5.
[59] S. Suzuki, K. Abiko, H. Kimura, Phosphorus segregation related to the grain boundary structure in an Fe-P alloy, Scr. Metall. 15 (1981)1139–1143.doi:10.1016/0036-9748(81)90175-7.
[60] G.O. Williams, V. Randle, J.R. Cowan, P. Spellward, The role of misorientation and phosphorus content on grain growth and intergranular fracture in iron–carbon–phosphorus alloys, J. Microsc. 213 (2004) 321–327. doi:10.1111/j.0022-2720.2004.01301.x.
[61] D.L. Medlin, K. Hattar, J.A. Zimmerman, F. Abdeljawad, S.M. Foiles, Defect character at grain boundary facet junctions: Analysis of an asymmetric Σ = 5 grain boundary in Fe, Acta Mater. 124 (2017) 383–396. doi:10.1016/j.actamat.2016.11.017.
[63] M. Koiwa, H. Seyazaki, T. Ogura, A systematic study of symmetric tilt-boundaries in hard-sphere f.c.c. crystals, Acta Metall. 32 (1984) 171–182. doi:10.1016/0001-6160(84)90214-1.
[64] C. Li , D.B. Williams, The relationship between grain-boundary structure and segregation in a rapidly solidified Fe-P alloy, Philos. Mag. 85 (2005) 2023–2032. doi:10.1080/14786430412331325030.
157
Chapter 4. Solutes segregation under ion irradiation in Fe-P-C model alloy
[65] J.J. Bean, K.P. McKenna, Origin of differences in the excess volume of copper and nickel grain boundaries, Acta Mater. 110 (2016) 246–257. doi:10.1016/j.actamat.2016.02.040.
[66] H.J. Frost, F. Spaepen, Hard Sphere models for the structure of grain boundaries, J. Phys. Colloq. 43 (1982) C6-73-C6-82. doi:10.1051/jphyscol:1982608.
[67] D. Wolf, S. Yip, Materials Interfaces: Atomic-level Structure and Properties, Springer Science & Business Media, 1992.
[68] D. Wolf, Structure and energy of general grain boundaries in bcc metals, J. Appl. Phys. 69 (1991) 185–196. doi:10.1063/1.347741.
[69] M.A. Tschopp, D.L. Mcdowell, Asymmetric tilt grain boundary structure and energy in copper and aluminium, Philos. Mag. 87 (2007) 3871–3892. doi:10.1080/14786430701455321.
[70] M.A. Tschopp, D.L. McDowell, Structural unit and faceting description of Σ3 asymmetric tilt grain boundaries, J. Mater. Sci. 42 (2007) 7806–7811. doi:10.1007/s10853-007-1626-6.
[71] Y. Shibuta, S. Takamoto, T. Suzuki, A Molecular Dynamics Study of the Energy and Structure of the Symmetric Tilt Boundary of Iron, ISIJ Int. 48 (2008) 1582–1591. doi:10.2355/isijinternational.48.1582.
[72] K.L. Merkle, D. Wolf, Low-energy configurations of symmetric and asymmetric tilt grain boundaries, Philos. Mag. A. 65 (1992) 513–530. doi:10.1080/01418619208201536.
[73] A. Sutton, R.. Balluffi, Overview no. 61 On geometric criteria for low interfacial energy, Acta Metall. 35 (1987) 2177–2201. doi:10.1016/0001-6160(87)90067-8.
[74] W. Gui-Jin, V. Vitek, Relationships between grain boundary structure and energy, Acta Metall. 34 (1986) 951–960. doi:10.1016/0001-6160(86)90068-4.
[75] D.N. Seidman, Subnanoscale Studies of Segregation at Grain Boundaries: Simulations and Experiments, Annu. Rev. Mater. Res. 32 (2002) 235–269. doi:10.1146/annurev.matsci.32.011602.095455.
[76] V.R. Coffman, J.P. Sethna, Grain boundary energies and cohesive strength as a function of geometry, Phys. Rev. B. 77 (2008). doi:10.1103/PhysRevB.77.144111.
[77] D. Wolf, Structure-energy correlation for grain boundaries in f.c.c. metals—IV. Asymmetrical twist (general) boundaries, Acta Metall. Mater. 38 (1990) 791–798. doi:10.1016/0956-7151(90)90031-B.
[78] J. Li, S.J. Dillon, G.S. Rohrer, Relative grain boundary area and energy distributions in nickel, Acta Mater. 57 (2009) 4304–4311. doi:10.1016/j.actamat.2009.06.004.
158
Chapter 4. Solutes segregation under ion irradiation in Fe-P-C model alloy
[79] H. Beladi, N.T. Nuhfer, G.S. Rohrer, The five-parameter grain boundary character and energy distributions of a fully austenitic high-manganese steel using three dimensional data, Acta Mater. 70 (2014) 281–289. doi:10.1016/j.actamat.2014.02.038.
[80] E.R. Homer, S. Patala, J.L. Priedeman, Grain Boundary Plane Orientation Fundamental Zones and Structure-Property Relationships, Sci. Rep. 5 (2015) 15476. doi:10.1038/srep15476.
[81] V.V. Bulatov, B.W. Reed, M. Kumar, Grain boundary energy function for fcc metals, Acta Mater. 65 (2014) 161–175. doi:10.1016/j.actamat.2013.10.057.
[82] H.-K. Kim, W.-S. Ko, H.-J. Lee, S.G. Kim, B.-J. Lee, An identification scheme of grain boundaries and construction of a grain boundary energy database, Scr. Mater. 64 (2011) 1152–1155. doi:10.1016/j.scriptamat.2011.03.020.
[83] B.P. Uberuaga, L.J. Vernon, E. Martinez, A.F. Voter, The relationship between grain boundary structure, defect mobility, and grain boundary sink efficiency, Sci. Rep. 5 (2015). doi:10.1038/srep09095.
[84] F.J. Pérez-Pérez, R. Smith, Preferential damage at symmetrical tilt grain boundaries in bcc iron, Nucl. Instrum. Methods Phys. Res. Sect. B Beam Interact. Mater. At. 180 (2001) 322–328. doi:10.1016/S0168-583X(01)00439-6.
[85] X.-M. Bai, B.P. Uberuaga, The Influence of Grain Boundaries on Radiation-Induced Point Defect Production in Materials: A Review of Atomistic Studies, JOM. 65 (2013) 360–373. doi:10.1007/s11837-012-0544-5.
159
Conclusion and Perpectives
Conclusion and Perspectives
The main objective of the current PhD work was to develop and combine theoretical
tools and experimental methods to quantify experimentally, understand mechanisms and
model phosphorus intergranular segregations in steels as a function of grain boundary (GB)
nature and ageing conditions (thermal ageing, irradiation). For a better understanding of the
mechanisms and to simplify the identification of the influence of each parameter, a ternary
model alloy (Fe – 0.034 at.% P – 0.01 at.% C) was investigated instead of complex
commercial steel.
Atom Probe Tomography (APT) analysis of as-received material revealed the
homogenous distribution of phosphorus and carbon atoms at the scale of an atom probe
reconstructed volume. The bulk concentration of phosphorus and carbon varies from one
volume to another, however the mean values (0.032 ± 0.01 at.% of phosphorus and 0.007 ±
0.004 at.% of carbon) are close to the nominal composition.
All the samples were annealed at 650°C during 2 h. Such treatment was intended to
simulate stress relieve heat treatment (SRHT), which is performed on RPV steel to decrease
the residual stresses. To ensure that the equilibrium is reached after 2 h, a heat treatment in the
same conditions but during 24 h was performed. After that, some samples were ion irradiated.
The irradiations were performed at 450°C with 10 MeV Fe5+ ions under a flux of (1.2 ±
0.4) × 1011 𝐶𝐶𝑛𝑛𝑛𝑛𝑠𝑠/𝑐𝑐𝑐𝑐2/𝑠𝑠 . Three irradiation durations were used (2500s, 12500s, 25000s)
which corresponds respectively to doses 0.075, 0.357 and 0.75 dpa at a sample depth of about
750 nm. To allow better differentiation between thermal and radiation-induced segregations in
irradiated material, some other samples were thermally aged at the irradiation temperature
(450°C) during 1000 h after SRHT.
After generalities on mechanisms of irradiation damage in Fe and Fe-based alloys and
on structure of GBs in polycrystals in the chapter 1, the chapter 2 focusses on physical
principles of different techniques namely: Atom Probe Tomography (APT), Scanning
Transmission Electron Microscopy (STEM), Scanning Electron Microscopy (SEM), Focused
Ion Beam (FIB), Electron Backscatter Diffraction (EBSD), Transmission Kikuchi Diffraction
(TKD).
The main technique used in the current study is APT. This instrument provides the
three dimensional distribution of phosphorus and carbon atoms at GB at atomic scale.
However, the concentration profiles of carbon and phosphorus atoms across GB are biased by
160
Conclusion and Perpectives
some aberrations due to the field evaporation. The measured width of phosphorus
intergranular segregation (8 atomic layers) is more than expected for equilibrium segregation
(one or two atomic layers). It is supposed that the enlargement of the phosphorus intergranular
segregation width is mainly caused by reconstruction artefacts. The lower evaporation field of
Fe atoms at GB leads to an apparent higher atom density near GBs. At the same time, the
higher evaporation field of solute atoms (phosphorus and carbon) results in an asymmetrical
concentration profile across GBs. This interpretation of experimental observations was
confirmed by the simulation of the field evaporation of a needle containing a GB. In order to
minimize the influence of APT artifacts, the Gibbsian interfacial excess was measured and
converted to a fraction of a monolayer, assuming that the phosphorus atoms reside in a single
close-packed (110) plane of a BCC α-iron.
The APT samples were prepared using SEM/FIB dual beam and TKD. The
combination of the three-dimensional APT reconstruction with the TKD indexing allows to
determine the five macroscopic degrees of freedom of a GB which are sufficient to give a
complete geometrical description by the notation 𝜃𝜃°[𝑛𝑛𝑢𝑢𝑢𝑢](ℎ1𝑘𝑘1𝑙𝑙1)/(ℎ2𝑘𝑘2𝑙𝑙2).
The chapter 3 is dedicated to equilibrium segregation of phosphorus and atoms to GBs
in the Fe-0.034 at.% P-0.01 at.% C model alloy at 650°C (SRHT) and 450°C (thermal
ageing). The APT analysis of the samples after annealing at 650° has established that:
• The equilibrium phosphorus segregation to HAGBs at 650°C is 0.12 ± 0.01
monolayer coverage. The time needed to reach the equilibrium GB segregation is less
than or equal to 2h.
• The carbon atoms can segregate to GBs during air-cooling from the high
temperature (650°C), if the specimen size is big enough to decrease the cooling rate.
The carbon intergranular segregation after air-cooling of the samples with the sizes of
20 × 20 × 20 mm3 and 4 × 4 × 20 mm3 is 0.30 ± 0.01 and 0.03 ± 0.01 monolayer
coverage, respectively.
The measured phosphorus GB segregation after 1000 h of thermal ageing at 450°C is
0.14 ± 0.01 monolayer. To know how far we are from equilibrium GB concentration the
Guttmann’s model of equilibrium GB segregation was used. The thermodynamic parameters
were taken from the works of Lejček and co-workers [1]. The model was first verified at
650°C. The predicted equilibrium phosphorus GB segregation at 650°C (0.21 ± 0.01
monolayer) was much higher than the experimentally observed (0.10 ± 0.01 monolayer).
Since the parameters given by Lejček were obtained by AES experiments, while APT was
used in the current work, it was decided to use both techniques to measure the GB segregation
161
Conclusion and Perpectives
in the same material. The comparative study of phosphorus intergranular segregation after
SRHT at 650°C using APT and Auger Electron Spectroscopy (AES) has shown that the mean
value of phosphorus GB segregation measured by AES is equal to (1.4 ± 0.5)1014
atoms/cm2, which is in good agreement with the mean segregation of phosphorus at HAGBs
obtained by APT ((1.6 ± 0.7) 1014 atoms/cm2). These results confirm that the intergranular
cracking in AES follows the GBs with the highest phosphorus segregation (i.e. the HAGB). ).
Based on that fact, it was supposed that the difference between theoretical prediction and
experimental data is a result of GB segregation quantification. In the current work, the
Gibbsian interfacial excess measured by APT is converted to a fraction of a monolayer,
assuming that the phosphorus atoms reside in a single close-packed (110) plane of BCC α-
iron, while Lejcek et al. have estimated the atomic density of GB plane from AES analysis of
pure iron surface [2]. Since the (110) plane is the highest density plane in a bcc iron, our
assumption underestimates the phosphorus GB segregation.
The Guttmann’s model for equilibrium intergranular segregation in multicomponent
system was applied to the Fe-0.034 at.% P-0.01 at.% C model alloy. The thermodynamic
parameters were calculated using Lejcek’s model for the segregation enthalpy and entropy at
different GBs (special, vicinal, general). The final expression for temperature dependence of
the free Gibbs energy of phosphorus segregation at general GBs in BCC iron is ∆𝐺𝐺𝑃𝑃 =
concentration at GB and in the bulk, respectively. The phosphorus-carbon interaction
coefficient was taken from the literature. The interaction is reported as repulsive. However,
the nature of this repulsive interaction isn’t clear. Is it the chemical repulsive forces or site
competition between phosphorus and carbon atoms? Since there is no experimental high-
resolution observation of the phosphorus segregation at GB in BCC iron, allowing us to
distinguish undoubtedly the position of phosphorus atoms (interstitial or substitutional) the
problem remains open. The atomic-scale simulation of phosphorus segregation at GBs in
BCC iron using the Quasi particle Approach (QA) [3] performed by Antoine Vaugeois (GPM,
Rouen) has shown that the phosphorus atoms initially situated in the lattice positions can
move to the interstitial sites close to the GB. Thus, the simulation showed us that the
phosphorus can segregate interstitially. However, other questions are still open. Does the
position of phosphorus atoms in GB depend on the annealing temperature? Could phosphorus
atoms situated both at substitutional and interstitials sites? How they interact with carbon
atoms?
162
Conclusion and Perpectives
However, as the repulsive interaction between phosphorus and carbon atoms at GB
was repeatedly observed in the literature [4–9] and since, according to the QA simulation, the
interstitial segregation of phosphorus is energetically favorable, both repulsive interaction and
site competition between phosphorus and carbon atoms at GB were taken into account in
modeling. The theoretical value of equilibrium GB segregation of phosphorus at 450°C is
equal to 0.17 ± 0.02 monolayer, which is slightly higher that the values measured by APT
after 1000 h of ageing (0.14 ± 0.01 monolayer). This observation is coherent with the
calculations of phosphorus intergranular segregation kinetics which has shown that the time
needed to reach the equilibrium phosphorus GB segregation at 450°C in the Fe-0.034 at.% P-
0.01 at.% C model alloy is about 3000h (or 125 days).
The study of equilibrium phosphorus segregation after SRHT and thermal ageing at
irradiation temperature was important to separate the different contributions of phosphorus
intergranular segregation in irradiated samples.
The Chapter 4 reports on the characterization of intergranular segregation of
phosphorus after self-ion irradiation of Fe-0.034 at.% P-0.01 at.% C model alloy up to 0.75
dpa and its possible relationship with GB crystallography.
The APT analysis of the model alloys after ion irradiation up to 0.75 dpa has shown
that:
• The mean level of phosphorus segregated at GB increases with irradiation dose
(repectively 0.22 ± 0.05, 0.29 ± 0.08 and 0.36 ± 0.14 monolayer for 0.075 dpa, 0.38
dpa and 0.75 dpa).
• Irradiation dose has no effect on the level of carbon GB segregation (0.20 ±
0.05, 0.20 ± 0.06 and 0.19 ± 0.04 monolayer after irradiation to 0.075 dpa, 0.38 dpa
and 0.75 dpa, respectively)
The phosphorus segregation at high-angle GBs in all irradiated samples is larger than
the equilibrium GB segregation of phosphorus at the same temperature (0.17 ± 0.02
monolayer). The excess of phosphorus atoms over the equilibrium GB segregation would
suggest the presence and influence of flux coupling between supersaturated point defects and
phosphorus atoms, i.e. a radiation-induced segregation (RIS) mechanism.
A few APT experiments revealed phosphorus clustering and segregation on
dislocation lines. STEM study has shown that during 10 MeV Fe5+ ion irradiation at 450°C of
the Fe-0.034 at.% P-0.01 at.% C model alloy up to 0.75 dpa, irradiation damage becomes
apparent in the form of a dislocation array and voids down to 2 µm depth. The number density
163
Conclusion and Perpectives
of dislocations and voids were measured and included in the total sink strength, which
appears in the radiation-induced segregation model.
Further modeling of RIS in the Fe-0.034 at.% P-0.01 at.% C model alloy under given
irradiation conditions has demonstrated that:
• The radiation-induced segregation (RIS) caused by phosphorus-interstitial
complex diffusion is absolutely dominant below approximately 500°C and the
radiation-enhanced segregation dominates above this temperature. The segregation
peak occurs in a temperature range between 400 and 450°C.
• The irradiation at 450°C using 10 MeV Fe5+ ions at a dose rate 3.0 ×
10−5 𝑑𝑑𝑑𝑑𝑑𝑑/𝑠𝑠 results in the RIS of phosphorus to GB, however, the radiation-enhanced
mechanism also participate.
RIS model of Faulkner together with experimental data from thermally aged samples
allows to us to distinguish the nature of phosphorus segregation at GBs. For instance, the total
amount of phosphorus segregation at 43°[100] (11-1)/(3-50) GB is ~ 0.36 monolayers.
Among them, ~ 0.12 monolayers (~ 30% from the total amount) was segregated during stress
relieve heat treatment, ~ 0.04 monolayers (~ 10% from the total amount) is the radiation-
enhanced segregation via the vacancy mechanism, and ~ 0.20 monolayers (~ 60% from the
total amount) is radiation-induced segregation via phosphorus-interstitial complex diffusion.
The experimental evidence of higher RIS of phosphorus at curved GBs than at straight
one was shown. Also, it was demonstrated that larger phosphorus segregation occurs at GBs
with high Miller index planes, while the segregation is low for those with low index planes.
Based on a literature review and our experimental results, it can be said that there is no
simple rule to link a GB geometrical parameter to its segregation level. The complicated
structure of real GBs in polycrystal (5 DOFs, GB curvature, faceting) requires more powerful
instruments, such as computer simulation, which can reconstruct any structure and give large
statistics. But to support or assess these predictions, experimental studies at the same scale,
i.e. atomic scale, of grain boundaries with complete description of their structures and
chemistries are needed. We believe that this work is one of these supports, and the
methodology to perform systematic analysis of grain boundaries (GB structure, quantitative
measurement of segregations) will be applied to the further works.
164
Conclusion and Perpectives
References
[1] P. Lejček, Grain Boundary Segregation in Metals, Springer Berlin Heidelberg, Berlin, Heidelberg, 2010.
[2] P. Lejček, Characterization of grain boundary segregation in an Fe-Si alloy, Anal. Chim. Acta. 297 (1994) 165–178. doi:10.1016/0003-2670(93)E0388-N.
[3] M. Lavrskyi, H. Zapolsky, A.G. Khachaturyan, Quasiparticle approach to diffusional atomic scale self-assembly of complex structures: from disorder to complex crystals and double-helix polymers, Npj Comput. Mater. 2 (2016). doi:10.1038/npjcompumats.2015.13.
[4] H. Hänsel, H.J. Grabke, Grain boundary segregation of phosphorus and carbon in ferritic iron, Scr. Metall. 20 (1986) 1641–1644. doi:10.1016/0036-9748(86)90411-4.
[5] H.J. Grabke, Surface and Grain Boundary Segregation on and in Iron and Steels, ISIJ Int. 29 (1989) 529–538. doi:10.2355/isijinternational.29.529.
[6] H. Erhart, H.J. Grabke, Equilibrium segregation of phosphorus at grain boundaries of Fe–P, Fe–C–P, Fe–Cr–P, and Fe–Cr–C–P alloys, Met. Sci. 15 (1981) 401–408. doi:10.1179/030634581790426877.
[7] W. Wei, H.J. Grabke, The effect of alloying elements on the grain boundary segregation of phosphorus in iron and the intergranular corrosion of the Fe-P system, Corros. Sci. 26 (1986) 223–236. doi:10.1016/0010-938X(86)90057-0.
[8] K. Ebihara, M. Yamaguchi, Y. Nishiyama, K. Onizawa, H. Matsuzawa, Effect of carbon on irradiation-induced grain-boundary phosphorus segregation in reactor pressure vessel steels using first-principles-based rate theory model, J. Nucl. Mater. 414 (2011) 328–335. doi:10.1016/j.jnucmat.2011.05.001.
[9] S. Suzuki, M. Obata, K. Abiko, H. Kimura, Effect of carbon on the grain boundary segregation of phosphorus in α-iron, Scr. Metall. 17 (1983) 1325–1328. doi:10.1016/0036-9748(83)90225-9.
165
Appendices
Appendices
Appendix 1. Field evaporation model
A model simulating the field evaporation of surface atoms of thin needle and their
subsequent trajectories from toward a detector was developed at GPM by F. Vurpillot and M.
Gruber [1,2]. It represents the atom probe tip as a stack of atoms in the shape of cylinder
terminated by a hemispherical cap of radius R. The tip is subjected to an electric potential, 𝑀𝑀0.
Far from the tip, an electrode is placed with a potential equal to 0.
The distribution of the electric potential around simulated volume can be calculated by
numerically solving the Laplace equation using a finite difference algorithm:
∆𝑀𝑀 = 0 (123)
The space between the tip and electrode is divided into a regular cubic grid of discrete
points. Each points is defined by its coordinates 𝐶𝐶, 𝑗𝑗 and 𝑘𝑘. The potential in each point is noted
𝑀𝑀𝑖𝑖,𝑗𝑗,𝑘𝑘. For each point, the local Laplace equation is solved. Thus, the value of the potential at
each point is determined by the six first neighbors of this point,
More details about the model can be found in ref [1,2,4].
The ion trajectories allow to calculate the coordinates of the impact on the virtual
detector. So that a dataset similar to the one of a real APT analysis is obtained and can be
treated with the same tools that for actual experiments.
167
Appendices
Appendix 2: Nanoscale secondary ion mass spectrometry
This study combines Atom Probe Tomography and Transmission Kikuchi Diffraction
techniques to reveal the GB structure – solute segregation relationship in a Fe-0.034 at.%P-
0.01 at.%C model alloy. TKD is used to characterize the grain boundary geometry. APT is
used to characterize GB segregation in three dimensions at near-atomic scale. However, APT
is limited by a small analysis volume (~ 100 × 100 × 300 𝑛𝑛𝑐𝑐3) and the difficult and time-
consuming specimen preparation (using dual-beam focused-ion-beam (FIB)/scanning electron
microscope (SEM)), which restricts the number of investigated GBs.
Nanoscale Secondary Ion Mass Spectrometry (NanoSIMS) technique is supposed to
be used for improving the statistics of measurments. NanoSIMS has an advantage of
analyzing a larger surface (tens of square micrometers) with very high sensitivity (down to
atom ppb in favorable cases) and high resolution (down to 50 nm).
The physical principle of SIMS is presented in Fig. A.1. NanoSIMS directs a focused
ion beam (typically in the 0.1-50 keV range [5]) at the solid’s surface of interest. These ions,
defined as primary ions, create a collision cascade in the target. As a result, atoms near the
surface are sputtered. A small fraction of sputtered atoms (between 10-5 to 10-2 [6]) are
ionized. The sputtered and ionized atoms are referred as “secondary ions”.
Fig. A.1. The physical principle of SIMS. Impacting primary ions on a sample surface create the collision
cascade with displaced atoms. Some of these secondary atoms are ionised and leave the surface [7]
These are focused by a magnetic field and directed into a mass spectrometer. Thus, for
a given number of primary ions impacting the surface per second, a number of secondary ions
of a given isotope reaches the detector and is counted each second [6].
168
Appendices
In this work, NanoSIMS analyses were performed using the Cameca NanoSIMS 50. A
focused 16 keV Cs+ primary ion beam scanned over the surface of the sample and sputtered
negative secondary ions. Secondary ions were detected on four detectors simultaneously for
the four following ions: 16O-, 12C-, 31P- and 54Fe16O-.
In order to get quantitative information, the method proposed by F. Christien and co-
workers was used [8]. They investigated the sulphur segregation in Ni-S alloy and found a
linear correlation between the sulphur bulk concentration and the measured intensity of the 32S- ion. Thus, the concentration of solute in a GB, 𝐶𝐶𝐺𝐺𝐵𝐵, can be found using one standard
sample and the following proportional equation:
𝐶𝐶𝐺𝐺𝐵𝐵 =𝐼𝐼𝐺𝐺𝐵𝐵𝐼𝐼𝑠𝑠𝑛𝑛𝑑𝑑
𝐶𝐶𝑠𝑠𝑛𝑛𝑑𝑑 (128)
where 𝐼𝐼𝐺𝐺𝐵𝐵 is the signal intensity at GB, 𝐶𝐶𝑠𝑠𝑛𝑛𝑑𝑑 is the known solute concentration of the standard
material and 𝐼𝐼𝑠𝑠𝑛𝑛𝑑𝑑 is in the signal intensity obtained from the standard material.
According to this method, the signal of 31P- ion were acquired on the three Fe-xP
model alloys (where x = 0.016, 0.034, 0.074 at.%). The summed counts for individual raster
scans (raster size is 20 × 20 𝜇𝜇𝑐𝑐) were recorded until steady-state of the signal reached (Fig.
A.2).
Fig. A.2. Intensity of 31P- signal as a function of time on the Fe- xP alloys (x=0.016,0.034,0.074 at.%). Sputtered
area: 20 × 20 𝜇𝜇𝑐𝑐. Primary beam current: 90 pA
The correlation graph between steady-state 31P- intensity (counts/sec) and phosphorus
concentration (at. %) in a bulk was plotted (Fig. A.3). It was found the reasonable
proportionality between phosphorus bulk concentration and 31P- steady-state signal averaged
over different grains.
Fe – 0.074%P Fe – 0.034%P Fe – 0.009%P
169
Appendices
Fig. A.3. Steady-state 31P- intensity versus P concentration obtained from NanoSIMS measurement for Fe-xP
model alloys with 𝑥𝑥 = 0.016, 0.034, 0.074 at.%
Since the dependence of the signal intensity from the bulk concentration is linear,
concentration of phosphorus at GB can be found using equation (128). In our case the
standard and analysed samples are the same, thus equation (128) transform to
𝐶𝐶𝐺𝐺𝐵𝐵 =𝐼𝐼𝐺𝐺𝐵𝐵𝐼𝐼𝑠𝑠𝑠𝑠𝑘𝑘𝑘𝑘
𝐶𝐶𝑠𝑠𝑠𝑠𝑘𝑘𝑘𝑘 (129)
where 𝐶𝐶𝑠𝑠𝑠𝑠𝑘𝑘𝑘𝑘 is the bulk concentration
In order to quantify the GB segregation, the NanoSIMS mapping was done. A 256 ×
256 pixel images were acquired by rastering the primary beam over the sample surface,
recording the number of secondary ion counts within the defined dwell time at each pixel. The
images of GB area were recorded with different sets of parameters (dwell time (0.5…15
was carried out using ImageJ software (U.S. National Institutes of Health, Bethesda, MD),
using the OpenMIMS plugin (National Resource for Imaging Mass Spectometry, Harvard
University, Cambridge, MA), to extract deadtime-corrected data from linear profiles drawn
onto the images.
However, no segregation of phosphorus or carbon could be detected in the GB,
indicating that the segregation of phosphorus is below the detection limit of NanoSIMS at this
condition. Despite of that, we suppose that the similar approach can be used to study and
quantify the intergranular segregation in microscale.
170
Appendices
References
[1] F. Vurpillot, Etude de la fonction de transfert pointe -image en sonde atomique tomographique. PhD thesis, Université de Rouen, 2001.
[2] M. Gruber, Etude de l’evaporation par effet de champ en sonde atomique tomographique: application à la métrologie de l’instrument. PhD thesis, Université de Rouen, 2012.
[3] A.B. Bortz, M.H. Kalos, J.L. Lebowitz, A new algorithm for Monte Carlo simulation of Ising spin systems, J. Comput. Phys. 17 (1975) 10–18. doi:10.1016/0021-9991(75)90060-1.
[4] D. Blavette, F. Vurpillot, P. Pareige, A. Menand, A model accounting for spatial overlaps in 3D atom-probe microscopy, Ultramicroscopy. 89 (2001) 145–153. doi:10.1016/S0304-3991(01)00120-6.
[5] P. van der Heide, Secondary Ion Mass Spectrometry: An Introduction to Principles and Practices, John Wiley & Sons, Hoboken, USA, 2014. doi:10.1002/9781118916780.
[6] P. Hoppe, S. Cohen, A. Meibom, NanoSIMS: technical aspects and applications in cosmochemistry and biological geochemistry, Geostand. Geoanalytical Res. 37 (2013) 111–154.
[7] D.S. McPhail, Applications of Secondary Ion Mass Spectrometry (SIMS) in Materials Science, J. Mater. Sci. 41 (2006) 873–903. doi:10.1007/s10853-006-6568-x.
[8] F. Christien, C. Downing, K.L. Moore, C.R.M. Grovenor, Quantification of grain boundary equilibrium segregation by NanoSIMS analysis of bulk samples, Surf. Interface Anal. 44 (2012) 377–387. doi:10.1002/sia.4806.
171
Résumé
L’objectif principal de ce travail de thèse était de développer et de combiner des outils
théoriques et des méthodes expérimentales pour quantifier expérimentalement, comprendre les
mécanismes et modéliser la ségrégation intergranulaire du phosphore dans les alliages
ferritiques en fonction de la nature des joints de grains (GB) et des conditions de vieillissement
(vieillissement thermique ou irradiation). Pour une meilleure compréhension, et pour faciliter
l’identification des paramètres pertinents, un alliage modèle ternaire (Fe-0.034 at.% P-0.01 at.%
C) a été étudié. Pour étudier efficacement les mécanismes de ségrégation intergranulaire, il est
nécessaire de combiner des techniques complémentaires permettant une description précise et
représentative des joints de grains avant et après vieillissement. Il s’agit de l’objectif principal
de la thèse. Le second objectif est d’appliquer l’approche ainsi développée à l’étude de
l’influence des conditions de vieillissement et de la géométrie des joints de grains sur la
ségrégation intergranulaire dans l'alliage modèle vieilli thermiquement ou irradié aux ions. Le
troisième objectif est d’étudier la ségrégation intergranulaire du phosphore à l’équilibre et hors-
équilibre afin d'améliorer la prédictibilité de la fragilisation sous irradiation des aciers de cuve
des réacteurs à eau sous pression (PWR).
Tous les échantillons ont préalablement été recuits à 650°C pendant 2h. Ce traitement
vise à simuler un traitement thermique de relaxation des contraintes (SHRT), utilisé sur les
aciers de cuve des PWR. Pour s’assurer que l’équilibre est atteint après 2h, un traitement
thermique dans les mêmes conditions, mais de 24h, a été réalisé. Après ça, une partie des
échantillons a été irradiée aux ions. Les irradiations ont été réalisées à 450°C avec des ions
Fe5+ de 10 MeV sous un flux de (1.2 ± 0.4) × 1011 ions/cm2/s. Trois durées d’irradiation ont
été retenues (2500s, 12500s, 25000s) correspondant respectivement à des doses de 0.075, 0.36
et 0.75 dpa à une profondeur d’environ 750 nm. Pour permettre une meilleure différenciation
entre la contribution de la température et celle de l'irradiation à la ségrégation intergranulaire,
une autre partie des échantillons a subi un vieillissement thermique à la température
d’irradiation (450°C) pendant 1000 h.
Le chapitre 1 décrit tout d'abord de manière générale les mécanismes d'endommagement
sous irradiation dans le fer et alliages ferreux. La structure de joints de grains dans les
polycristaux est ensuite présentée. Enfin, le chapitre se concentre sur les principes physiques
des différentes techniques d'analyse utilisées dans ce travail: Sonde Atomique Tomographique
(APT), Microscopie Électronique en Transmission à Balayage (STEM), Microscopie
Électronique à Balayage (SEM), Faisceau d’Ions Focalisés (FIB), Diffraction des Électrons
Rétrodiffusés (EBSD) et Diffraction de Kikuchi en Transmission (TKD).
La technique principale de ce travail est l’APT. Cet instrument permet d’obtenir une
représentation à l’échelle atomique en 3 dimensions de la distribution du phosphore et du
carbone aux joints de grains. Les échantillons d’APT sont préparés en utilisant un SEM/FIB
couplées à la TKD. La combinaison de la reconstruction 3D obtenues par APT avec l’indexation
des grains déterminée par TKD permet de déterminer les cinq degrés de liberté macroscopiques
d’un joint de grain, ce qui suffit à avoir une description géométrique complète. Un GB est ainsi
défini par la notation 𝜃𝜃°[𝑢𝑢𝑢𝑢𝑢𝑢](ℎ1𝑘𝑘1𝑙𝑙1)/(ℎ2𝑘𝑘2𝑙𝑙2).
Le chapitre 3 est dédié à la ségrégation intergranulaire du phosphore à l’équilibre dans
l’alliage modèle Fe-0.034 at.% P-0.01 at.% à 650°C (SRHT) et à 450°C (vieillissement
thermique). L’analyse par APT des échantillons après recuit à 650°C montre que le taux de
recouvrement d'une monocouche par le phosphore dans les joints de forte désorientation est de
0.12 ± 0.01 à 650°C. Les résultats de sonde atomique obtenus sur les GB de forte
désorientation à 650°C ont été comparés à des mesures de Spectroscopie des Electrons Auger
(AES). Les valeurs mesurées par AES et APT sont en très bon accord, respectivement (1.4 ±
0.5)1014 atomes/cm2 et (1.6 ± 0.7) 1014 atomes/cm2).
Le modèle de Guttman a ensuite été utilisé pour déterminer le taux de ségrégation du
phosphore à l'équilibre à 450°C. Les paramètres thermodynamiques de ce modèle ont été ajustés
sur des données de la littérature obtenues par (AES). La valeur théorique de ségrégation à
l’équilibre du phosphore dans les joints de grains à 450°C est égale à 0.17 ± 0.02 monocouche,
ce qui est significativement plus élevé que les valeurs mesurées par APT après 1000 h de
vieillissement (0.14 ± 0.01 monocouche). Cette observation est cohérente avec les calculs de la
cinétique de ségrégation intergranulaire du phosphore qui montrent que le temps nécessaire
pour atteindre l’équilibre à 450°C dans l’alliage modèle Fe-0.034 at.% P-0.01 at.% C est
d’environ 3000h (125 jours).
L’étude de la ségrégation à l’équilibre du phosphore après SRHT et vieillissement
thermique à température d’irradiation était importante pour séparer les différentes contributions
à la ségrégation intergranulaire du phosphore dans les échantillons irradiés.
Le chapitre 4 présente les résultats obtenus sur la ségrégation intergranulaire du
phosphore après irradiation aux ions fer de l’alliage modèle Fe-0.034 at.% P-0.01 at.% C
jusqu’à 0.75 dpa. Les relations entre le taux de ségrégation hors équilibre et la géométrie des
joints de grains sont également abordées.
L’analyse APT de l’alliage modèle après irradiation ionique jusqu’à 0.75 dpa a montré
que le niveau moyen de ségrégation du phosphore dans les joints de grains augmente avec la
dose d’irradiation. La dose d’irradiation n’a pas d’effet sur le niveau de ségrégation du carbone.
La ségrégation du phosphore aux joints de grains de forte désorientation dans les
échantillons irradiés est systématiquement plus importante que la ségrégation du phosphore à
l’équilibre à la même température (0.17 ± 0.02 monocouche). L’excès d’atomes de phosphore
suggère l'existence d'un couplage entre les flux de défauts ponctuels sursaturés et des atomes
de phosphore. Autrement dit, un mécanisme de ségrégation induite par l'irradiation (RIS)
semble contribuer à la ségrégation intergranulaire du phosphore dans ces conditions
d'irradiation.
Pour avoir une meilleure compréhension des mécanismes de ségrégation
intergranulaire, le modèle de RIS développer par Faulkner a été appliqué à l’alliage modèle Fe-
0.034 at.% P-0.01 at.% C irradié aux ions. La modélisation a montré que la RIS résultant de la
diffusion du complexe phosphore-interstitiel est largement dominante pour des températures
inférieures à 500°C, dans les conditions d'irradiation utilisées ici. Le maximum de ségrégation
apparaît dans une gamme de température située entre 400 et 450°C.
Compte tenu des données de la littérature et de nos résultats expérimentaux, il apparaît
qu’il n’y a pas de règle simple pour relier un paramètre géométrique du joint de grains à son
taux de ségrégation. La structure complexe des joints de grains (5 degrés de liberté, courbature,
facettage) requiert des instruments tels que la simulation numérique afin prédire au mieux la
ségrégation intergranulaire en fonction de la structure des GB. Ces calculs doivent s'appuyer
sur des études expérimentales à la même échelle, fournissant à la fois une description complète
de la structure des GB et leur chimie. Nous pensons que ce travail est un de ces supports, et que
la méthodologie pour réaliser des études systématiques des joints de grains (structure, mesures
quantitatives de ségrégation) sera utilisée dans de futurs travaux.