Algebra I Texas Mathematics: Unpacked Content What is the purpose of this document? To increase student achievement by ensuring educators understand specifically what the new standards expect a student know, understand and be able to do. This document may also be used to facilitate discussion among teachers and curriculum staff and to encourage coherence in the sequence, pacing, and units of study for grade-level curricula. This document, along with on-going professional development, is one of many resources used to understand and teach the new math standards. What is in the document? Descriptions of what each standard expects a student to know, understand, and be able to do. The “unpacking” of the standards done in this document is an effort to answer a simple question “What does this standard mean that a student must know and be able to do?” and to ensure the description is helpful, specific and comprehensive for educators.
Transcript
Algebra I Texas Mathematics: Unpacked Content What is the purpose of this document? To increase student achievement by ensuring educators understand specifically what the new standards expect a student know, understand and be able to do. This document may also be used to facilitate discussion among teachers and curriculum staff and to encourage coherence in the sequence, pacing, and units of study for grade-level curricula. This document, along with on-going professional development, is one of many resources used to understand and teach the new math standards. What is in the document? Descriptions of what each standard expects a student to know, understand, and be able to do. The “unpacking” of the standards done in this document is an effort to answer a simple question “What does this standard mean that a student must know and be able to do?” and to ensure the description is helpful, specific and comprehensive for educators.
At A Glance: New to Grade:
● Write and solve equations involving direct variation (8th grade) ● Graph the solution set of systems of two linear inequalities in two variables on the coordinate plane ● Calculate, using technology, the correlation coefficient between two quantitative variables and interpret this quantity as a measure of the
strength of the linear association ● Compare and contrast association and causation in real-world problems (AP Statistics) ● Write equations of quadratic functions given the vertex and another point on the graph, write the equation in vertex form from (f(x)=a(x-h)2
+k), and rewrite the equation from vertex form to standard form (f(x)=ax2 + bx + c) (Algebra II) ● Graph quadratic functions on the coordinate plane and use the graph to identify key attributes, if possible, including x-intercept, y-intercept,
zeros, maximum value, minimum values, vertex, and the equation of the axis of symmetry (Algebra II) ● Describe the relationship between the linear factors of quadratic expressions and the zeros of the associated quadratic functions ● Interpret the meaning of the values of a and b in exponential functions of the form f(x)=abx in real-world problems (Algebra II) ● Decide if a binomial can be written as the difference of two squares and, if possible, use the structure of a difference of two squares to
rewrite it ● Simplify numerical radical expressions involving square roots ● Identify terms of arithmetic and geometric sequences when the sequences are given in function form and given in recursive form ● Write a formula for the nth term of arithmetic and geometric sequences, given the value of several of their terms ● Solve mathematical and scientific formulas, and other literal equations, for a specified variable
Moved from Grade:
● Describe independent and dependent quantities in functional relationships (to 6th grade) ● Gather and record data and use data sets to determine functional relationships between quantities (to 8th grade) ● Describe functional relationships for given problem situations and write equations or inequalities to answer questions arising from the
situations (to 7th grade) ● Represent relationships among quantities using concrete models, tables, graphs, diagrams, verbal descriptions, equations, and inequalities
(to 8th grade) ● Identify and sketch the general forms of linear (y=x) and quadratic (y=x2) parent functions ● Use symbols to represent unknowns and variables ● Look for patterns and represent generalizations algebraically ● Determine whether or not given situations can be represented by linear functions ● Interpret the meaning of slope and intercepts in situations using data, symbolic representations, or graphs ● Analyze data and represent situations involving inverse variation using concrete models, tables, graphs, or algebraic methods
Instructional Implications for 2015-16: ● Algebra I students will need to have a stronger foundation in quadratic functions before moving onto Geometry and Algebra II. ● Asymptotes need to be introduced next year in Algebra I when graphing exponential functions. ● When graphing quadratic functions the following need to be introduced: x-intercept, y-intercept, zeros, maximum value, minimum values,
vertex, and the equation of the axis of symmetry. ● The concept of arithmetic and geometric sequences must be taught in Algebra I. Students need to realize the difference and recognize each
pattern. ● Inverse variation will be taught, using graphs and tables. ● Statistical analysis will be used when solving real world problems.
Professional Learning Implications for 2015-16: 8th grade math and Algebra II teachers will need to work with Algebra I teachers to decide the best way to teach the standards that are being moved to the Algebra I curriculum. 8th grade will start teaching some of the Algebra I standards next year, so that the following year, Algebra I will be able to start implementing Algebra II standards.
Algebra I Primary Focal Areas: The Primary Focal Areas are designed to bring focus to the standards at each grade by describing the big ideas that educators can use to build their curriculum and to guide instruction. 1. The desire to achieve educational excellence is the driving force behind the Texas Essential Knowledge and Skills for mathematics, guided by the College and Career Readiness Standards. By embedding statistics, probability, and finance, while focusing on fluency and solid understanding, Texas will lead the way in mathematics education and prepare all Texas students for the challenges they will face in the 21st century. 2. The process standards are integrated at every grade level and course. When possible, students will apply mathematics to problems arising in everyday life, society, and the workplace. Students will use a problem-solving model that incorporates analyzing given information, formulating a plan or strategy, determining a solution, justifying the solution, and evaluating the problem-solving process and the reasonableness of the solution. Students will select appropriate tools such as real objects, manipulatives, paper and pencil, and technology and techniques such as mental math, estimation, and number sense to solve problems. Students will effectively communicate mathematical ideas, reasoning, and their implications using multiple representations such as symbols, diagrams, graphs, and language. Students will use mathematical relationships to generate solutions and make connections and predictions. Students will analyze mathematical relationships to connect and communicate mathematical ideas. Students will display, explain, or justify mathematical ideas and arguments using precise mathematical language in written or oral communications. 3. In Algebra I, students will build on the Texas Essential Knowledge and Skills (TEKS) for Grades 6-8 Mathematics, which provide a foundation in linear relationships, number and operations, and proportionality. Students will study linear, quadratic, and exponential functions and their related transformations, equations, and associated solutions. Students will connect functions and their associated solutions in both mathematical and real-world situations. Students will use technology to collect and explore data and analyze statistical relationships. In addition, students will study polynomials of degree one and two, radical expressions, sequences, and laws of exponents. Students will generate and solve linear systems with two equations and two variables and will create new functions through transformations. 4. Statements that contain the word “including” reference content that must be mastered, while those containing the phrase “such as” are intended as possible illustrative examples.
Mathematical Process Standards 1(A) apply mathematics to problems arising in everyday life, society, and the workplace;
Apply
1(B) use a problem-‐solving model that incorporates analyzing given information, formulating a plan or strategy, determining a solution, justifying the solution, and evaluating the problem-‐solving process and the reasonableness of the solution;
Use, Formulate, Determine, Justify, Evaluate
1(C) select tools, including real objects, manipulatives, paper and pencil, and technology as appropriate, and techniques, including mental math, estimation, and number sense as appropriate, to solve problems;
Select, Solve
1(D) communicate mathematical ideas, reasoning, and their implications using multiple representations, including symbols, diagrams, graphs, and language as appropriate;
Communicate
1(E) create and use representations to organize, record, and communicate mathematical ideas;
Create, Use
1(F) analyze mathematical relationships to connect and communicate mathematical ideas; and
Analyze
1(G) display, explain, and justify mathematical ideas and arguments Display, Explain, Justify
using precise mathematical language in written or oral communication. Linear Functions, Equations, and Inequalities. The student applies the mathematical process standards when using properties of linear functions to write and represent in multiple ways, with and without technology, linear equations, inequalities, and systems of equations. The student is expected to: 2(A) determine the domain and range of a linear function in mathematical problems; determine reasonable domain and range values for real-‐world situations, both continuous and discrete; and represent domain and range using inequalities;
Including, but not limited to: 1. Use the definition of a function to determine whether a relationship is a function given a table, graph or words. 2. Given the function f(x), identify x as an element of the domain, the input, and f(x) is an element in the range, the output. 3. Know that the graph of the function, f, is the graph of the equation y=f(x). 4. When a relation is determined to be a function, use f(x) notation. 5. Evaluate functions for inputs in their domain. 6. Interpret statements that use function notation in terms of the context in which they are used. 7. Given the graph of a function, determine the practical domain of the function as it relates to the numerical relationship it describes.
2(B) write linear equations in two variables in various forms, including y = mx + b, Ax + By = C, and y -‐ y1 = m(x -‐ x1), given one point and the slope and given two points;
1. Students identify the rate of change (slope) and initial value (y-‐intercept) from tables, graphs, equations or verbal descriptions to write a function (linear equation). 2. Students understand that the equation represents the relationship between the x-‐value and the y-‐value; what math operations are performed with the x-‐value to give the y-‐value. Slopes could be undefined slopes or zero slopes. Tables: Students recognize that in a table the y-intercept is the y-value when x
is equal to 0. The slope can be determined by finding the ratio y/x between the change in two y-values and the change between the two corresponding x-values. Example 1: Write an equation that models the linear relationship in the table below.
Solution: The y-intercept in the table below would be (0, 2). The distance between 8 and -1 is 9 in a negative direction -9; the distance between -2 and 1 is 3 in a positive direction. The slope is the ratio of rise to run or y/x or -9/3 = -3. The equation would be y = -3x + 2 Graphs: Using graphs, students identify the y-intercept as the point where the line crosses the y-axis and the slope as the rise/run. Example 2: Write an equation that models the linear relationship in the graph below.
Solution: The y-intercept is 4. The slope is ¼, found by moving up 1 and right 4; going from (0, 4) to (4, 5). The linear equation would be y = ¼ x + 4.
Equations: In a linear equation the coefficient of x is the slope and the constant is the y-intercept. Students need to be given the equations in formats other than y = mx + b, such as y = ax + b (format from graphing calculator), y = b + mx (often the format from contextual situations), etc. Point and Slope: Students write equations to model lines that pass through a given point with the given slope. Example 1: A line has a zero slope and passes through the point (-5, 4). What is the equation of the line? Solution: y = 4 Example 2: Write an equation for the line that has a slope of ½ and passes through the point (-2, 5) Solution: y = ½ x + 6 Students could multiply the slope ½ by the x-coordinate -2 to get -1. Six (6) would need to be added to get to 5, which gives the linear equation. Students also write equations given two ordered pairs. Note that point-slope form is not an expectation at this level. Students use the slope and y-intercepts to write a linear function in the form y = mx +b. Contextual Situations: In contextual situations, the y-intercept is generally the starting value or the value in the situation when the independent variable is 0. The slope is the rate of change that occurs in the problem. Rates of change can often occur over years. In these situations it is helpful for the years to be “converted” to 0, 1, 2, etc. For example, the years of 1960, 1970, and 1980 could be represented as 0 (for 1960), 10 (for 1970) and 20 (for 1980).
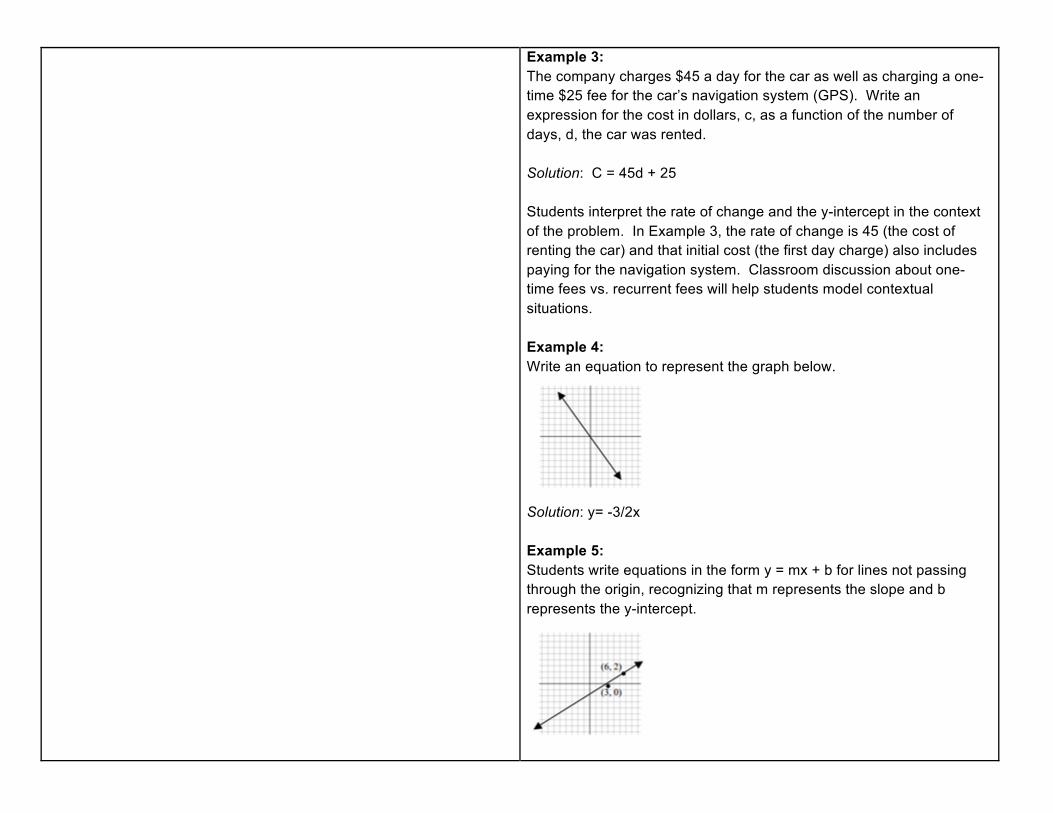
Example 3: The company charges $45 a day for the car as well as charging a one-time $25 fee for the car’s navigation system (GPS). Write an expression for the cost in dollars, c, as a function of the number of days, d, the car was rented. Solution: C = 45d + 25 Students interpret the rate of change and the y-intercept in the context of the problem. In Example 3, the rate of change is 45 (the cost of renting the car) and that initial cost (the first day charge) also includes paying for the navigation system. Classroom discussion about one-time fees vs. recurrent fees will help students model contextual situations. Example 4: Write an equation to represent the graph below.
Solution: y= -3/2x Example 5: Students write equations in the form y = mx + b for lines not passing through the origin, recognizing that m represents the slope and b represents the y-intercept.
Solution: y= 2/3x - 2
2(C) write linear equations in two variables given a table of values, a graph, and a verbal description;
Understand that all solutions to an equation in two variables are contained on the graph of that equation. Example 1: The graph below represents the cost of gum packs as a unit rate of $2 dollars for every pack of gum. The unit rate is represented as $2/pack. Represent the relationship using a table and an equation.
Equation: d = 2g, where d is the cost in dollars and g is the packs of gum. Misconception: A common error is to reverse the position of the variables when writing equations. Students may find it useful to use variables specifically
related to the quantities rather than using x and y. Constructing verbal models can also be helpful. A student might describe the situation as “the number of packs of gum times the cost for each pack is the total cost in dollars”. They can use this verbal model to construct the equation. Students can check their equation by substituting values and comparing their results to the table. The checking process helps student revise and recheck their model as necessary. The number of packs of gum times the cost for each pack is the total cost. (g x 2 = d)
2(D) write and solve equations involving direct variation; 1. Students build on their work with unit rates from 6th grade and
proportional relationships in 7th grade to compare graphs, tables and equations of proportional relationships. 2. Students identify the unit rate (or slope) in graphs, tables and equations to compare two proportional relationships represented in different ways. Example: Compare the scenarios to determine which represents a greater speed. Explain your choice including a written description of each scenario. Be sure to include the unit rates in your explanation.
Solution: Scenario 1 has the greater speed since the unit rate is 60 miles per hour. The graph shows this rate since 60 is the distance traveled in one hour. Scenario 2 has a unit rate of 55 miles per hour
shown as the coefficient in the equation. Given an equation of a proportional relationship, students draw a graph of the relationship. Students recognize that the unit rate is the coefficient of x and that this value is also the slope of the line.
2(E) write the equation of a line that contains a given point and is parallel to a given line;
Triangles are similar when there is a constant rate of proportionality between them. Using a graph, students construct triangles between two points on a line and compare the sides to understand that the slope (ratio of rise to run) is the same between any two points on a line. Example: The triangle between A and B has a vertical height of 2 and a horizontal length of 3. The triangle between B and C has a vertical height of 4 and a horizontal length of 6. The simplified ratio of the vertical height to the horizontal length of both triangles is 2 to 3, which also represents a slope of ⅔ for the line, indicating that the triangles are similar.
Given an equation in slope-‐intercept form, students graph the line represented. Students write equations in the form y = mx for lines going through the
origin, recognizing that m represents the slope of the line. 2(F) write the equation of a line that contains a given point and is perpendicular to a given line;
Example: Given the following graph, write an equation that is perpendicular to the line and goes through the point (4,-5).
Solution: y = -x - 1 Students must find the slope from the given graph, find the slope that is perpendicular to it, and use the point given to write a linear equation.
2(G) write an equation of a line that is parallel or perpendicular to the X or Y axis and determine whether the slope of the line is zero or undefined;
Students use their knowledge of parallel and perpendicular slopes and their knowledge of linear equations to write an equation of a line that is either parallel or perpendicular to the X or Y axis. Example 1:
a. Write a linear equation of the line that is parallel to the y-axis. b. Write a linear equation of the line that is parallel to the x-axis. Example 2 What would be the slope of a line that is perpendicular to the x-axis? Solution: undefined or no slope
2(H) write linear inequalities in two variables given a table of values, a graph, and a verbal description; and
Students will need to relate writing linear inequalities with writing linear equations, understanding which inequality symbol should be used. Example 1
Write a linear inequality that represents the graph above. Solution: y≥-x+1 Example 2 Tracy is selling purses and shoes to make at least $300.00 to put towards her summer trip. The purses cost $15.00 each and a pair of shoes cost $12.00. Write a linear inequality that represents the amount of purses and shoes that Tracy needs to sell. Solution: 15x+12y ≥ 300
2(I) write systems of two linear equations given a table of values, a graph, and a verbal description.
1. Students will write and use a system of equations and/or inequalities to solve a real world problem. 2. They will need to recognize that the equations and inequalities represent the constraints of the problem. Example 1
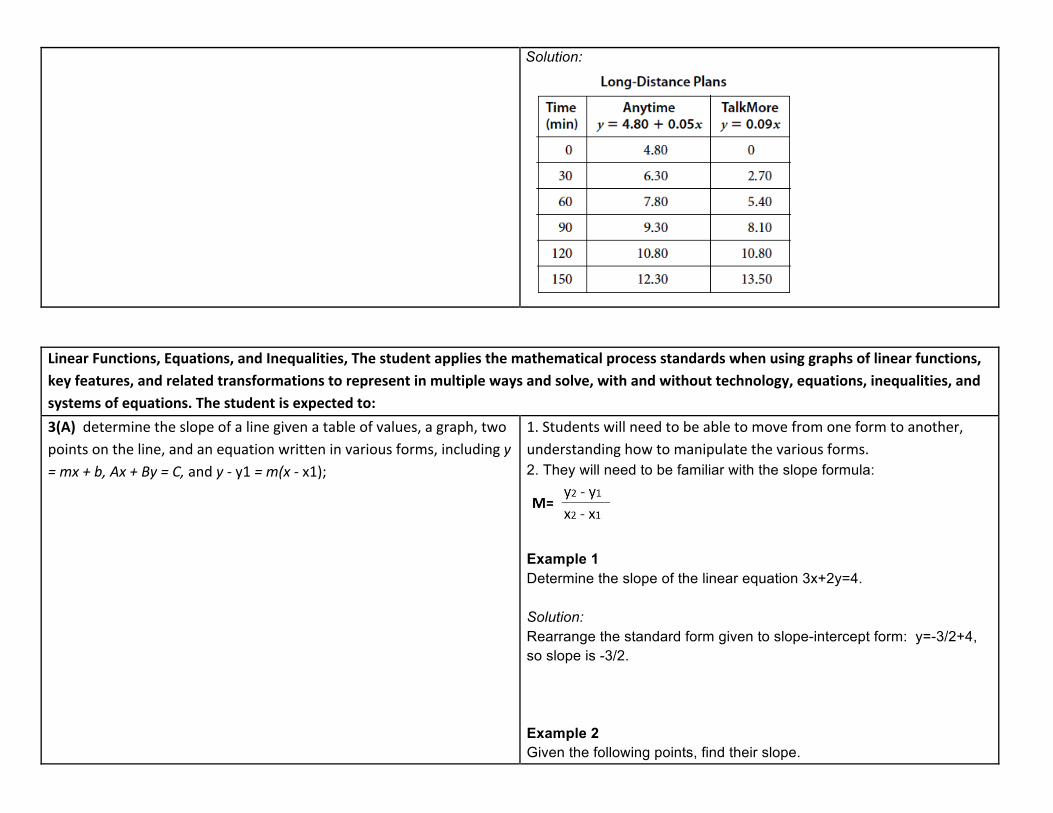
Using the graph above, write the system of two equations. Solution: Red line: y=-x+2 Blue line: y=4x-3 Example 2 The Anytime long-distance plan charges $4.80 per month plus 5¢ a minute. The Talk More plan charges 9¢ a minute and no monthly fee. For what number of minutes are the charges for the two plans the same? a. Write a system of two equations to model this situation. b. Solve the system by creating a table.
Solution:
Linear Functions, Equations, and Inequalities, The student applies the mathematical process standards when using graphs of linear functions, key features, and related transformations to represent in multiple ways and solve, with and without technology, equations, inequalities, and systems of equations. The student is expected to: 3(A) determine the slope of a line given a table of values, a graph, two points on the line, and an equation written in various forms, including y = mx + b, Ax + By = C, and y -‐ y1 = m(x -‐ x1);
1. Students will need to be able to move from one form to another, understanding how to manipulate the various forms. 2. They will need to be familiar with the slope formula:
Example 1 Determine the slope of the linear equation 3x+2y=4. Solution: Rearrange the standard form given to slope-intercept form: y=-3/2+4, so slope is -3/2. Example 2 Given the following points, find their slope.
(2,-5) and (3,4). Solution: Using slope formula, m=(3+5)/(4-2)=8/2=4.
3(B) calculate the rate of change of a linear function represented tabularly, graphically, or algebraically in context of mathematical and real-‐world problems;
Example 1 Compare the following functions to determine which has the greater rate of change. Function 1: y = 2x + 4 Function 2:
Solution: The rate of change for function 1 is 2; the rate of change for function 2 is 3. Function 2 has the greater rate of change. Example 2 Compare the two linear functions listed below and determine which has a negative slope. Function 1: Gift Card Samantha starts with $20 on a gift card for the bookstore. She spends $3.50 per week to buy a magazine. Let y be the amount remaining as a function of the number of weeks, x.
Function 2: Calculator rental The school bookstore rents graphing calculators for $5 per month. It also collects a non-refundable fee of $10.00 for the school year. Write the rule for the total cost (c) of renting a calculator as a function of the number of months (m). c = 10 + 5m Solution: Function 1 is an example of a function whose graph has a negative slope. Both functions have a positive starting amount; however, in function 1, the amount decreases 3.50 each week, while in function 2, the amount increases 5.00 each month.
3(C) graph linear functions on the coordinate plane and identify key features, including x-‐ intercept, y-‐intercept, zeros, and slope, in mathematical and real-‐world problems;
Students will need to not only graph linear functions, but also identify the linear function when given the graph of a line. Example Write an equation that models the linear relationship in the graph below.
Solution: The y-intercept is 4. The slope is 1/4 , found by moving up 1 and right 4 going from (0, 4) to (4, 5). The linear equation would be y = 1/4x + 4. The x-intercept can be found by plugging in 0 for the y-value in y = 1/4x + 4. So, 0 = 1/4x + 4 -4 -4 -4 = 1/4x
-4(4) = ¼(4)x -16 = x So, the x-intercept is -16.
3(D) graph the solution set of linear inequalities in two variables on the coordinate plane;
Students will use knowledge of graphing linear equations to graph linear inequalities. Example 1
Determine the linear inequality that is graphed above. Solution: y<-‐x+1 The inequality symbol < is used instead of ≤ because of the dashed line. Example 2 Graph the following linear inequality and shade the half-‐plane that represents the solution set.
y ≥ −5/4x + 3
Solution:
Graph the linear inequality as if it were a linear equation, using y-‐intercept and slope. The line is solid because our inequality is “greater than or equal to”, and we shade above the line because of the “greater than”.
3(E) determine the effects on the graph of the parent function f(x) = x when f(x) is replaced by
af(x), f(x) + d, f(x -‐ c), f(bx) for specific values of a, b, c, and d;
Experiment with cases and illustrate an explanation of the effects on the graph using technology. Include recognizing even and odd functions from their graphs and algebraic expressions for them. Example
The function of this graph is represented by f(x)=x2 How would the parent function change if the y-intercept was 3 instead of 0?
Solution:
If 3 is the y-intercept, then f(x)=x2 + 3. 3(F) graph systems of two linear equations in two variables on the coordinate plane and determine the solutions if they exist;
Students will need to graph the solution set of two inequalities, but they should also be able to read a graph of the solution set. Example
Determine the two linear inequalities that are graphed above. Solution: y ≤ 2/3x− 3 and y < −2/3x+ 4
3(G) estimate graphically the solutions to systems of two linear equations with two variables in real-‐world problems; and
Students need to understand that the solution to a system of two linear equations is their point of intersection.
Example 1 Graph and find the solution of the following two linear equations: y=-‐2x+8 and y=x-‐1 Solution:
Their point of intersection (solution) is (3,2).
3(H) graph the solution set of systems of two linear inequalities in two variables on the coordinate plane.
Students will need to graph the solution set of two inequalities, but they should also be able to read a graph of the solution set. Example 1
Determine the two linear inequalities that are graphed above. Solution: y ≤ 2/3x− 3 and y < −2/3x+ 4 Example 2 Graph the following inequalities and shade their solution. y≤2x+1 and y>-1/3x+2 Solution:
Linear Functions, Equations, and Inequalities. The student applies the mathematical process standards to formulate statistical relationships and evaluate their reasonableness based on real-‐world data. The student is expected to: 4(A) calculate, using technology, the correlation coefficient between two quantitative variables and interpret this quantity as a measure of the strength of the linear association;
Use a calculator or computer to find the correlation coefficient for a linear association. Interpret the meaning of the value in the context of the data.
Example: The correlation coefficient measures the “tightness” of the data points about a line fitted to data, with a limiting value of 1 (or -1) if all points lie precisely on a line of positive (or negative) slope. For the line fitted to cricket chirps and temperature (figure 1), the correlation is 0.84, and for the line fitted to boys’ height (figure 2), it is about 1.0. However, the quadratic model for tree growth (figure 3) is non-linear, so the value of its correlation coefficient has no direct interpretation
Figure 1
Figure 2
Figure 3
4(B) compare and contrast association and causation in real-‐world problems; and
Explain the difference between correlation and causation in real world problems. Example:
In situations where the correlation coefficient of a line fitted to data is close to or 1, the two variables in the situation are said to have a high correlation. Students must see that one of the most common misinterpretations of correlation is to think of it as a synonym for causation. A high correlation between two variables (suggesting a statistical association between the two) does not imply that one causes the other. It is not a cost increase that causes calories to increase in pizza, and it is not a calorie increase per slice that causes cost to increase; the addition of other expensive ingredients cause both to increase simultaneously.Students should look for examples of correlation being interpreted as cause and sort out why that reasoning is incorrect. Examples may include medications versus disease symptoms and teacher pay or class size versus high school graduation rates. One good way of establishing cause is through the design and analysis of randomized experiments.
4(C) write, with and without technology, linear functions that provide a reasonable fit to data to estimate solutions and make predictions for real-‐world problems.
1. Create a scatter plot from two quantitative variables. 2. Describe the form, strength and direction of the relationship. 3. Categorize data as linear or not. Use algebraic methods and technology to fit a linear function to the data. Use the function to
predict values. 4. Explain the meaning of the slope and y-‐intercept in context. Example:
1. If you have a keen ear and some crickets, can the cricket chirps help you predict the temperature? What does 20 cricket chirps tell you? 2. The model is used to draw conclusions: The line estimates that, on average, each added chirp predicts an increase of about 3.29 degrees Fahrenheit. What does this represent?
Linear Functions, Equations, and Inequalities. The student applies the mathematical process standards to solve, with and without technology, linear equations and evaluate the reasonableness of their solutions. The student is expected to
5(A) solve linear equations in one variable, including those for which the application of the distributive property is necessary and for which variables are included on both sides;
Students solve one-‐variable equations including those with the variables being on both sides of the equals sign. Students recognize that the solution to the equation is the value(s) of the variable, which make a true equality when substituted back into the equation. Equations should include rational numbers, distributive property and combining like terms. Example 1: Equations have one solution when the variables do not cancel out. For example, 10x – 23 = 29 – 3x can be solved to x = 4. This means that
when the value of x is 4, both sides will be equal. If each side of the equation were treated as a linear equation and graphed, the solution of the equation represents the coordinates of the point where the two lines would intersect. In this example, the ordered pair would be (4, 17). 10 • 4 – 23 = 29 – 3 • 4 40 – 23 = 29 – 12 17 = 17 Example 2: Equations having no solution have variables that will cancel out and constants that are not equal. This means that there is not a value that can be substituted for x that will make the sides equal. -‐x + 7 – 6x = 19 – 7x Combine like terms -‐7x + 7 = 19 – 7x Add 7x to each side 7 ≠ 19 This solution means that no matter what value is substituted for x the final result will never be equal to each other. If each side of the equation were treated as a linear equation and graphed, the lines would be parallel. Example 3: An equation with infinitely many solutions occurs when both sides of the equation are the same. Any value of x will produce a valid equation. For example the following equation, when simplified will give the same values on both sides.
−12(36a − 6) =
34(4 − 24a)
–18a + 3 = 3 – 18a If each side of the equation were treated as a linear equation and graphed, the graph would be the same line. Students write equations from verbal descriptions and solve.
Example 4: Two more than a certain number is 15 less than twice the number. Find the number. Solution: n + 2 = 2n – 15 17 = n
5(B) solve linear inequalities in one variable, including those for which the application of the distributive property is necessary and for which variables are included on both sides; and
Students solve one-‐variable inequalities including those with the variables being on both sides of the inequality sign. Inequalities should include rational numbers, distributive property and combining like terms. Example 1:
3(4x− 6) ≥ 6(x+ 2) Example 2:
−�(�+ �) < ��− �
5(C) solve systems of two linear equations with two variables for mathematical and real-‐world problems.
1. Systems of linear equations can have one solution, infinitely many solutions or no solutions. Students will discover these cases as they graph systems of linear equations and solve them algebraically. 2. Students graph a system of two linear equations, recognizing that the ordered pair for the point of intersection is the x-‐value that will generate the given y-‐value for both equations. 3. Students recognize that graphed lines with one point of intersection (different slopes) will have one solution, parallel lines (same slope, different y-‐intercepts) have no solutions, and lines that are the same (same slope, same y-‐intercept) will have infinitely many solutions. 4. By making connections between algebraic and graphical solutions and the context of the system of linear equations, students are able to make sense of their solutions. Students need opportunities to work with equations and context that include whole number and/or
decimals/fractions. 5. Students should define variables and create a system of linear equations in two variables from given word problems. Example 1: 1. Plant A and Plant B are on different watering schedules. This affects their rate of growth. Compare the growth of the two plants to determine when their heights will be the same. Solution: Let W = number of weeks Let H = height of the plant after W weeks
2. Based on the coordinates from the table, graph lines to represent each plant. Solution:
3. Write an equation that represents the growth rate of Plant A and Plant B. Solution: Plant A H = 2W + 4 Plant B H = 4W + 2 4. At which week will the plants have the same height? Solution: 2W + 4 = 4W + 2 Set height of Plant A equal to height of Plant B
Solve for W 1 = W After one week, the height of Plant A and Plant B are both 6 inches. Check: 2(1) + 4 = 4(1) + 2 2 + 4 = 4 + 2 6 = 6
Quadratic Functions and Equations. The student applies the mathematical process standards when using properties of quadratic functions to write and represent in multiple ways, with and without technology, quadratic equations. The student is expected to: 6(A) determine the domain and range of quadratic functions and represent the domain and range using inequalities;
Determine domain and range from a graph, table, equation, or verbal situation. Represent in the form of an inequality. Example:
Solution: Domain: All real numbers or all real solutions Range: y ≥ 6.2 or {y| y ≥ 6.2}
6(B) write equations of quadratic functions given the vertex and 1. Connect all quadratic graphs to the parent function.
another point on the graph, write the equation in vertex form (f(x) =
a(x− h)2 + k ), and rewrite the equation from vertex form to standard form (f(x) = ax2 + bx+ cf(x)); and
2. Connect the x-‐value of the vertex (h) to -‐b/2a. 3. Recognize that c is the y-‐intercept. 4. Use completing the square to transform the standard form (y = ax^2 + bx + c) to vertex form (y = a(x-‐h)^2+k). 5. Square the binomial in y = a(x-‐h)^2 + k and simplify to find the standard form as shown above. 6. Connect the x-‐value of the vertex to h and the y-‐value of the vertex with k. 7. Identify the line of symmetry and write its equation. 8. Use the value of “a” to determine whether the function opens up or down. 9. Connect the y-‐value of the vertex as the maximum or minimum value of the function. Example: The vertex of a quadratic function is (3,4) and another point on the graph is (1,12), determine the equation in: a) vertex form b) standard form Solution: a) y = a(x− 3)2 + 4
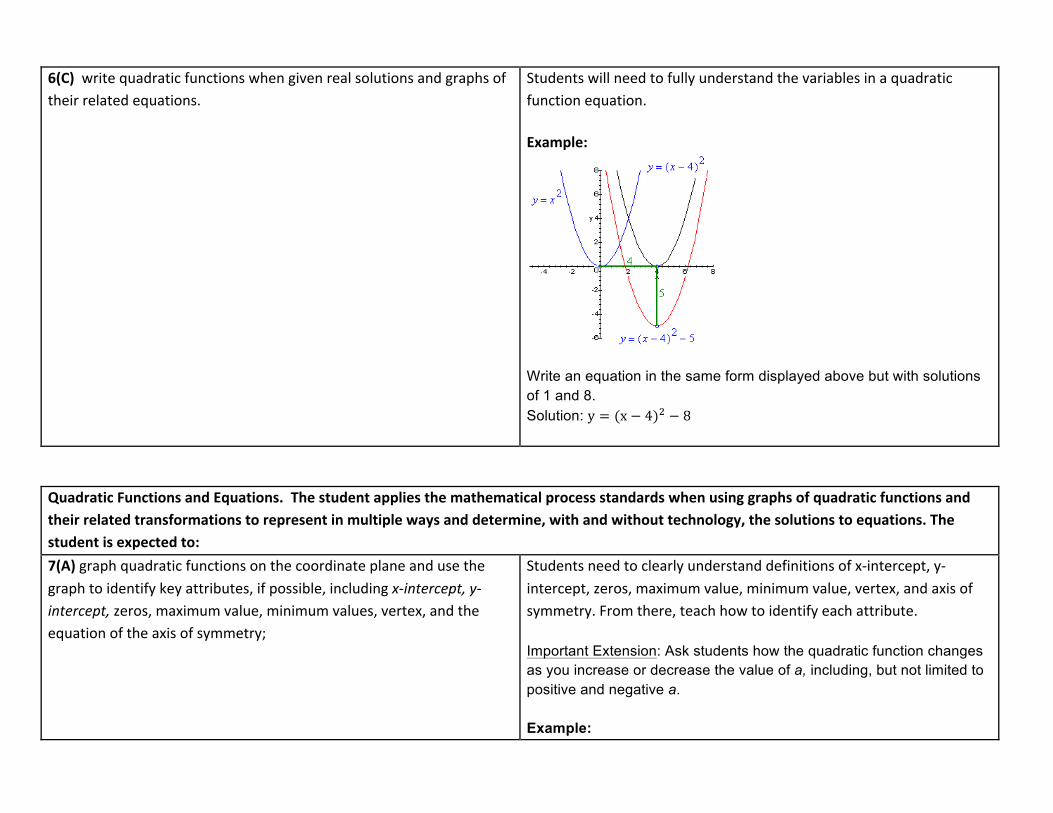
6(C) write quadratic functions when given real solutions and graphs of their related equations.
Students will need to fully understand the variables in a quadratic function equation. Example:
Write an equation in the same form displayed above but with solutions of 1 and 8. Solution: y = (x − 4)! − 8
Quadratic Functions and Equations. The student applies the mathematical process standards when using graphs of quadratic functions and their related transformations to represent in multiple ways and determine, with and without technology, the solutions to equations. The student is expected to: 7(A) graph quadratic functions on the coordinate plane and use the graph to identify key attributes, if possible, including x-‐intercept, y-‐intercept, zeros, maximum value, minimum values, vertex, and the equation of the axis of symmetry;
Students need to clearly understand definitions of x-‐intercept, y-‐intercept, zeros, maximum value, minimum value, vertex, and axis of symmetry. From there, teach how to identify each attribute. Important Extension: Ask students how the quadratic function changes as you increase or decrease the value of a, including, but not limited to positive and negative a. Example:
Solution: Vertex: (2,-1) Y-intercept: (0,3) X-intercepts or zeros: (1,0) and (3,0) Minimum Value: -1
Axis of symmetry: x = !!!"
x =42= 2
7(B) describe the relationship between the linear factors of quadratic expressions and the zeros of their associated quadratic functions; and
Linear factors are the zeros of the quadratic function, such as (x+3)(x+2), where -‐3 and -‐2 are your x-‐intercepts (or zeros). Example: y=(x+4)(x-5) Set both linear factors equal to zero. x+4=0 x=-4 x-5=0 x=5
7(C) determine the effects on the graph of the parent function f(x) = x2 when f(x) is replaced by af(x), f(x) + d, f(x -‐ c), f(bx) for specific values of a, b, c, and d.
Students need to know how the parent function will change as a, b, c, and d change in the quadratic equation. It would be beneficial for the teacher to initiate a classroom discussion on this standard. Example: Original equation: f(x) = x!
How does the graph change when f(x) = x! − 2? Solution: Graph will shift two units down and the vertex will be (0,-2). There will be two x-intercepts, but since the value of a did not change the parabola is not wider or narrower than the original.
Quadratic Functions and Equations. The student applies the mathematical process standards to solve, with and without technology, quadratic equations and evaluate the reasonableness of their solutions. The student formulates statistical relationships and evaluates their reasonableness based on real-‐world data. The student is expected to: 8(A) solve quadratic equations having real solutions by factoring, taking square roots, completing the square, and applying the quadratic formula; and
Students need to be familiar with all forms of solving quadratic equations, and be able to recognize when one form is more appropriate over another.
Example 1 Find the solutions to the following quadratic equation: x! + 5x + 6 = 0 Solution:
x! + 5x + 6 = 0 x! + 5x + 6 = (x + 3)(x + 2)
0 = (x + 3)(x + 2) 0 = x + 3 or 0 = x + 2
x = −3 or x = −2 Example 2 Find the solutions to the following quadratic equation: (x − 4)! = 5 Solution:
(x − 4)! = 5 (x − 4)!= 5
x − 4 = 5 x = 4 ± 5
x = 4 + 5 and x = 4 − 5 Example 3 Find the solutions to the following quadratic equation: x! + 6x − 7 = 0 Solution:
Example 4 Find the solutions to x! + 3x − 4 = 0 using the quadratic formula. Solution:
So, our solutions are x=-4 and x=1.
Quadratic Functions and Equations Unpacking
What does this standard mean that a student will know and be able to do?
8(B) write, using technology, quadratic functions that provide a reasonable fit to data to estimate solutions and make predictions for real-‐world problems.
Students need to be familiar with how to use a graphing calculator to write quadratic functions. Example: 1. Create a scatter plot from two quantitative variables. 2. Describe the form, strength and direction of the relationship. 3. Categorize data as quadratic or not. Use algebraic methods and technology to fit a quadratic function to the data. Use the function to predict values. 4. Explain the meaning of the x-‐intercepts in concept.
Exponential Functions and Equations. The student applies the mathematical process standards when using properties of exponential
functions and their related transformations to write, graph, and represent in multiple ways exponential equations and evaluate, with and without technology, the reasonableness of their solutions. The student formulates statistical relationships and evaluates their reasonableness based on real-‐world data. The student is expected to: 9(A) determine the domain and range of exponential functions of the form �(�) = �� � and represent the domain and range using inequalities;
Students need to recognize the difference between linear and exponential functions and how the domain and range will differ. Example
Determine the domain and range of the exponential function. Solution: Domain: All Reals or −∞ < x < ∞ Range: y > 0
9(B) interpret the meaning of the values of a and b in exponential functions of the form f(x) = abx in real-‐world problems;
Example A tree frog population doubles every three weeks. Suppose that currently, there are 10 tree frogs in your backyard. How many tree frogs will there be in 6 months, assuming that there are four weeks each month? Solution: 1. Identify the values of a and b. a = initial value = 10 b = rate at which the population is being multiplied = 2 2. Substitute in values f(x) = 10 ⋅ 2!. (It is very important that students do not multiply 10 and 2 to make the function 𝑓(𝑥) = 20!. They must follow the order of operations.)
3. We want to know the tree frog population after 6 months (24 weeks). Since the population doubles every 3 weeks, we must divide the 24 weeks by 3, which gives us 8 weeks. This means within the 6 months the tree frog population will double 8 times. f(x) = 10 ⋅ 2! = 10 ⋅ 2! = 10 ⋅ 256 = 2,560 tree frogs.
9(C) write exponential functions in the form f(x) = abx (where b is a rational number) to describe problems arising from mathematical and real-‐world situations, including growth and decay;
Students need to be familiar with growth and decay functions y =a(1± r) t. Example (Growth) The price P (in dollars) of a pound of flour was $.26 in 2001. The price has increased by about 3% each year. Let t be the number of years since 2001. Write an exponential function that can be used to find the price of a pound of flour in 2012. Solution: 1. Determine the values of a and b.
a = 0.26 Since the cost of flour is increasing each year, b = 1 + .03 = 1.03
2. Substitute the values into the function P(t) = ab ! P(t) = 0.26(1.03) !
3. The question asked to know the cost of a pound of flour in 2012. There are 11 years between 2001 and 2012, so we use t=11 in our function. P(t) = 0.26(1.03) !!= 0.359 = $.36
9(D) graph exponential functions that model growth and decay and identify key features, including y-‐intercept and asymptote, in mathematical and real-‐world problems; and
Example 1:
Identify the y-intercept and asymptote in the graph above. Solution: 1. The y-intercept is always the a value in the function f(x) = ab!.The value of a is always the y-intercept (where the function crosses the y-axis). 2. The asymptote is the line on the graph that is being approached, but is never reached. In this case it is the x-axis, so y=0 is the asymptote.
9 (E) write, using technology, exponential functions that provide a reasonable fit to data and make predictions for real-‐world problems.
Use scientific calculator to solve the following problem. Example: The owner of a 1953 Hudson Hornet convertible sold the car at an auction. The owner bought it in 1984 when its value was $11,000. The value of the car increased at a rate of 6.9% per year. Write a function that models the value of the car over time. Solution: This is an exponential growth word problem, so we will use y = a(1 +r)!. a = initial value = 11,000 r = growth rate = 0.069 So, y = 11,000(1.069)!.
Number and Algebraic Methods. The student applies the mathematical process standards and algebraic methods to rewrite in equivalent forms and perform operations on polynomial expressions. The student is expected to: 10(A) add and subtract polynomials of degree one and degree two; Students need to be familiar with polynomials and the rules when
adding and subtracting terms with like and unlike variables. Example: Combine 2x2 + 5x− 4and 3x2 − 2x+ 3
Solution: Combine like variables, so
5x2 + 3x− 1 10(B) multiply polynomials of degree one and degree two; Need an understanding of the distributive property.
Example 1 (Degree one):
10(C) determine the quotient of a polynomial of degree one and polynomial of degree two when divided by a polynomial of degree one and polynomial of degree two when the degree of the divisor does not exceed the degree of the dividend;
Students will need to refer back to simple long division to complete division of polynomials. Example:
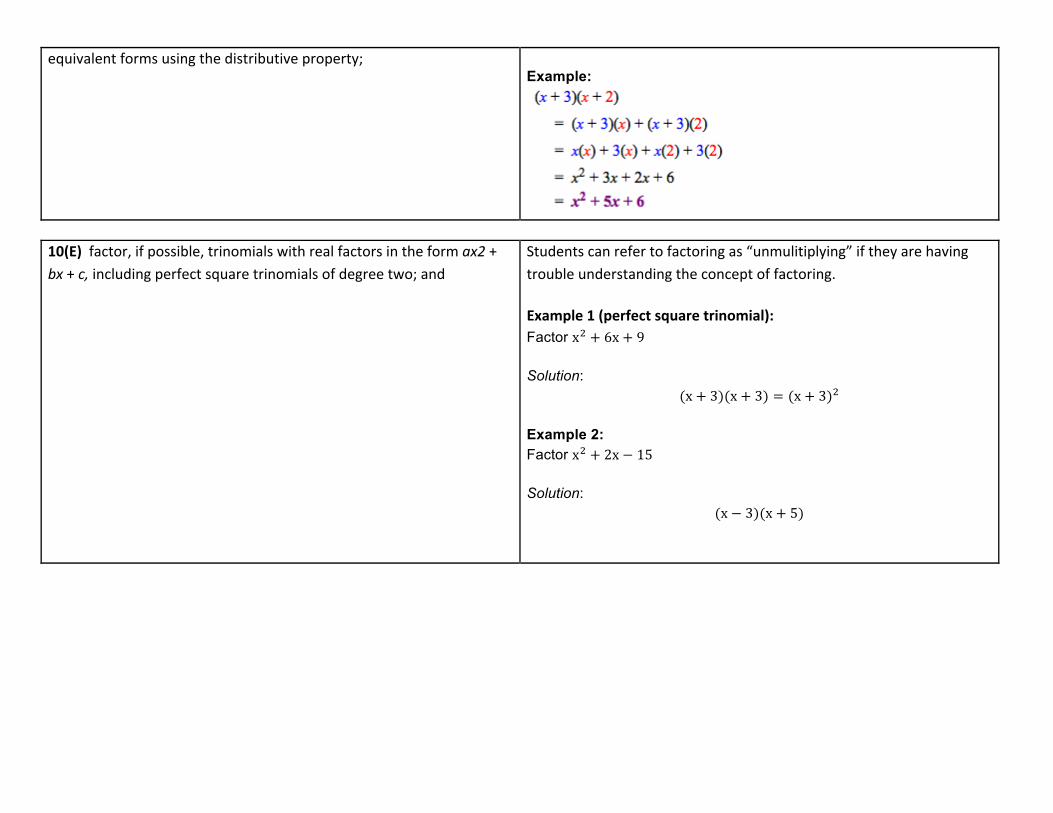
10(D) rewrite polynomial expressions of degree one and degree two in Students need to be very familiar with the distributive property.
equivalent forms using the distributive property; Example:
10(E) factor, if possible, trinomials with real factors in the form ax2 + bx + c, including perfect square trinomials of degree two; and
Students can refer to factoring as “unmulitiplying” if they are having trouble understanding the concept of factoring. Example 1 (perfect square trinomial): Factor x! + 6x + 9 Solution:
10(F) decide if a binomial can be written as the difference of two squares and, if possible, use the structure of a difference of two squares to rewrite the binomial.
To factor a difference of squares, students must be able to recognize if a term is a square or not. Example 1:
x! − 64 Solution:
(x − 8)(x + 8) Example 2:
9y! − 121x! Solution:
(3y − 11x)(3y + 11x) Example 3:
x! − 81 Solution:
(x! − 9)(x! + 9) (x − 3)(x + 3)(x! + 9)
If students have a hard time understanding why this pattern works each time when factoring a difference of squares, have them FOIL out the factored solution. They will end up with the original binomial.
Number and Algebraic Methods. The student applies the mathematical process standards and algebraic methods to rewrite algebraic expressions into equivalent forms. The student is expected to: 11(A) simplify numerical radical expressions involving square roots; and
Example: 81!/! = 81! = 531,441 = 729
11(B) simplify numeric and algebraic expressions using the laws of exponents, including integral and rational exponents.
The following examples are only a few types of problems that students should encounter throughout Algebra I. Example 1:
(3x!)(2x!y!) = 6x!y! Example 2: !"!!!!
!"!!= !"!!
Example 3:
(14)!! = 16
Number and Algebraic Methods. The student applies the mathematical process standards and algebraic methods to write, solve, analyze, and evaluate equations, relations, and functions. The student is expected to: 12(A) decide whether relations represented verbally, tabularly, graphically, and symbolically define a function;
Clear concept of “function” needs to be understood. For every input (x) there is exactly one output (y). Example 1: A tree grows 20 cm every year. The following table compares the tree’s age to it’s height. Does this represent a function?
Age (years) Height (cm)
0 0
1 20
3.2 64
Solution: Yes. h(age) = age x 20
Example 2: Does the following graph represent a function?
Solution: No, because for each input (x) there are two outputs (y).
12(B) evaluate functions, expressed in function notation, given one or more elements in their domains;
Misconception: When students see f(x)=3, they want to plug in different values for x, such as x=2, x=5, etc., and claim that f(2)=2, f(5)=5. Example 1: Evaluate the range of the following function when the domain is -2,-1,0,1, and 2.
g(x) = 2x + 1
Domain Range
-2 2(-2) + 1 = -3
-1 2(-1) + 1 = -1
0 2(0) + 1 = 1
1 2(1) + 1 = 3
2 2(2) + 1 = 5
12(C) identify terms of arithmetic and geometric sequences when the sequences are given in function form using recursive processes;
Example 1 (Arithmetic): f(x) = 3x − 2
Find the values of the sequence if the domain is x > 0. Solution: The first term is a! = 1 The second term is a! = 4 The third term is a! = 7 With each increase of 1 in the domain, the range is increasing by 3. Example 2 (Geometric):
g(x) = 5 ⋅ 2! Find the values of the sequence if the domain is x > 0. Solution: The first term is a! = 10 The second term is a! = 20 The third term is a! = 40 The fourth term is a! = 80 With each increase of 1 in the domain, the range is doubled.
12(D) write a formula for the nth term of arithmetic and geometric sequences, given the value of several of their terms; and
Example 1 (Geometric): Write a function that could be modeled by the following sequence. 128, 64, 32, 16, 8,... Solution:
Because the ratios between the terms is constant, the sequence is geometric. The common ratio is ½. The next term of the sequence is a! = a! ⋅
!!= 4.
Example 2 (Arithmetic): Write a function that could be modeled by the following sequence. 3,6,9,12,15,... Solution: The common difference between the terms is 3, so the sequence is arithmetic. The next term is a! = a! + 3 = 18.
12(E) solve mathematic and scientific formulas, and other literal equations, for a specified variable.
Students should be familiar enough with solving equations, that they can solve for a single variable when there are two or more variables in an equation. Example 1: y = mx + b Solve for x.
−b − b y − bm
=mxm
y − bm
= x
Example 2: C = 2πr Solve for r. Divide both sides by 2π.