Alinna Brown MCS 100 June 2, 2016 Basketball’s Cinderella Stories: What Makes a Successful Underdog in the NCAA Tournament? Every year, countless fans gather around televisions, arenas, and computers to watch the NCAA tournament. According to the American Gaming Association, 40 million Americans will fill out 70 million brackets for a total of $9 billion dollars wagered (Purdum). While a large part of creating a bracket is choosing among traditionally strong teams such as Kentucky or Duke, the NCAA tournament is unique in the annual spotlight it brings to underdogs. As Washington Post journalist Neil Greenberg writes, “Picking favorites in the NCAA tournament is the smart play, but it’s the upsets and Cinderella teams that make it memorable…and help you get the edge needed to win your bracket pool and earn the accompanying bragging rights.” Cultural portrayals of underdogs, such as Hoosiers or Glory Road often attribute their successes to abstract factors such as team chemistry, grit, or resilience. Research on the statistical aspects of what makes a successful underdog, on the other hand, is much more limited. In an article in statistician Nate Silver’s FiveThirtyEight, sports journalist Stephen Pettigrew uses play-by-play data to track the underdog’s probability of winning, given the score differential at each point in the game. He writes, “At the opening tipoff, the underdog has a 29 percent chance of winning the game. But if the game is tied, or the underdog is ahead within five minutes remaining in the first half, the probability of an upset is higher than 50 percent” (Pettigrew). Another article points out the importance of risk in underdog strategy, writing, “When winning is unlikely, you need to be willing to sacrifice from the average outcome in order to improve the best possible outcome. Or, as a more general principle, an underdog must be willing to accept greater-than-average risk” (Brian, Gravity and Levity). The graph below illustrates the various strategies, highlighting that a higher overlap of larger point values is beneficial. https://gravityandlevity.wordpress.com/2010/12/21/risk-is-the-ally-of-the-underdog/ The idea of employing a riskier strategy is advocated by Dean Oliver in his book Basketball on Paper, which has been hailed as the basketball version of Moneyball. In exploring the idea of underdog upsets, he maintains that risky strategies such as playing a zone, taking extra three pointers or sending guards to get offensive rebounds are often successful. He asserts that slowing down the game often serves to increase variability of
Transcript
Alinna Brown MCS 100 June 2, 2016
Basketball’s Cinderella Stories: What Makes a Successful Underdog in the NCAA Tournament?
Every year, countless fans gather around televisions, arenas, and computers to watch the NCAA tournament. According to the American Gaming Association, 40 million Americans will fill out 70 million brackets for a total of $9 billion dollars wagered (Purdum). While a large part of creating a bracket is choosing among traditionally strong teams such as Kentucky or Duke, the NCAA tournament is unique in the annual spotlight it brings to underdogs. As Washington Post journalist Neil Greenberg writes, “Picking favorites in the NCAA tournament is the smart play, but it’s the upsets and Cinderella teams that make it memorable…and help you get the edge needed to win your bracket pool and earn the accompanying bragging rights.”
Cultural portrayals of underdogs, such as Hoosiers or Glory Road often attribute their successes to abstract factors such as team chemistry, grit, or resilience. Research on the statistical aspects of what makes a successful underdog, on the other hand, is much more limited. In an article in statistician Nate Silver’s FiveThirtyEight, sports journalist Stephen Pettigrew uses play-by-play data to track the underdog’s probability of winning, given the score differential at each point in the game. He writes, “At the opening tipoff, the underdog has a 29 percent chance of winning the game. But if the game is tied, or the underdog is ahead within five minutes remaining in the first half, the probability of an upset is higher than 50 percent” (Pettigrew). Another article points out the importance of risk in underdog strategy, writing, “When winning is unlikely, you need to be willing to sacrifice from the average outcome in order to improve the best possible outcome. Or, as a more general principle, an underdog must be willing to accept greater-than-average risk” (Brian, Gravity and Levity). The graph below illustrates the various strategies, highlighting that a higher overlap of larger point values is beneficial.
The idea of employing a riskier strategy is advocated by Dean Oliver in his book Basketball on Paper, which has been hailed as the basketball version of Moneyball. In exploring the idea of underdog upsets, he maintains that risky strategies such as playing a zone, taking extra three pointers or sending guards to get offensive rebounds are often successful. He asserts that slowing down the game often serves to increase variability of
the outcome, and can be a good strategy (Lyons). Although Oliver is widely respected for his work on possession manipulation, a recent analysis by The Harvard Sports Analysis Collective found the opposite of Miller’s assertion. Out of a data set of 35 upsets from 2004 to 2009, “the average tempo of [upset] games was 67.77, while the average tempo of the games in which the underdog lost was only 64.93,” and furthermore, “an underdog having an extra possession increased that team’s odds of an upset by 7.7 percent” (Ezekowitz and Cohen). As a result, there is no clear evidence to support Oliver’s theory. In light of the uneven results of research regarding underdog strategy, I decided to do my own research on what factors are correlated with an underdog victory in the NCAA tournament. Using data from Kaggle.com’s March Madness Machine Learning Mania from the 2003-2016 men’s basketball NCAA regular seasons and 2003-2015 NCAA tournaments, as well as data from ESPN.com on the 2016 NCAA tournament which I manually entered into a CSV file, I examined the correlation of per game averages for each team and each season of offensive rebounds, defensive rebounds, steals, turnovers, blocks, assists, personal fouls, and three pointers made. These are all statistics that I believe to be underrated in a basketball world that focuses largely on points and shooting percentages. They are also all highly correlated with the pace of the game and the control of possessions. For example, a team that gets an offensive rebound creates an extra possession for itself, whereas a team that turns the ball over gives one up. Teams can use fouls to stall the pace of the game near the end, but fouls can also be a sign of carelessness and create a turnover. Additionally, steals can often be a sign of a high-pressure defense, and assists often point to successful team chemistry and ball movement on offense. In order to get a sense of the relative importance of each of these statistics, I ran a binomial linear regression model correlating all of the above factors (plus underdog seed and seed difference) with wins. I placed the season averages for each statistic for the underdog for the particular game in a matrix, and trained my model on the 2003-2011 seasons. I then tested it on the 2011-2015 data, and it predicted 70.4% of games correctly. Listed in the table below are the regression coefficients for my model. Seed Difference -0.1517 Underdog Seed 0.0473 Offensive Rebounds -0.0163 Defensive Rebounds 0.0134 Steals 0.1117 Blocks 0.0342 Turnovers -0.0460 Assists 0.0477 Personal Fouls -0.0259 Three Pointers Made -0.0223 The coefficient with the largest magnitude was seed difference, which is not surprising. Logically, it is much easier for a 9 seed to upset an 8 seed than for a 16 seed to upset a 1 seed. What is somewhat surprising, however, is that the coefficient with the second largest magnitude was steals. While all the other factors, such as offensive rebounds, defensive rebounds, etc, had coefficients with magnitudes less than 0.1, the magnitude of
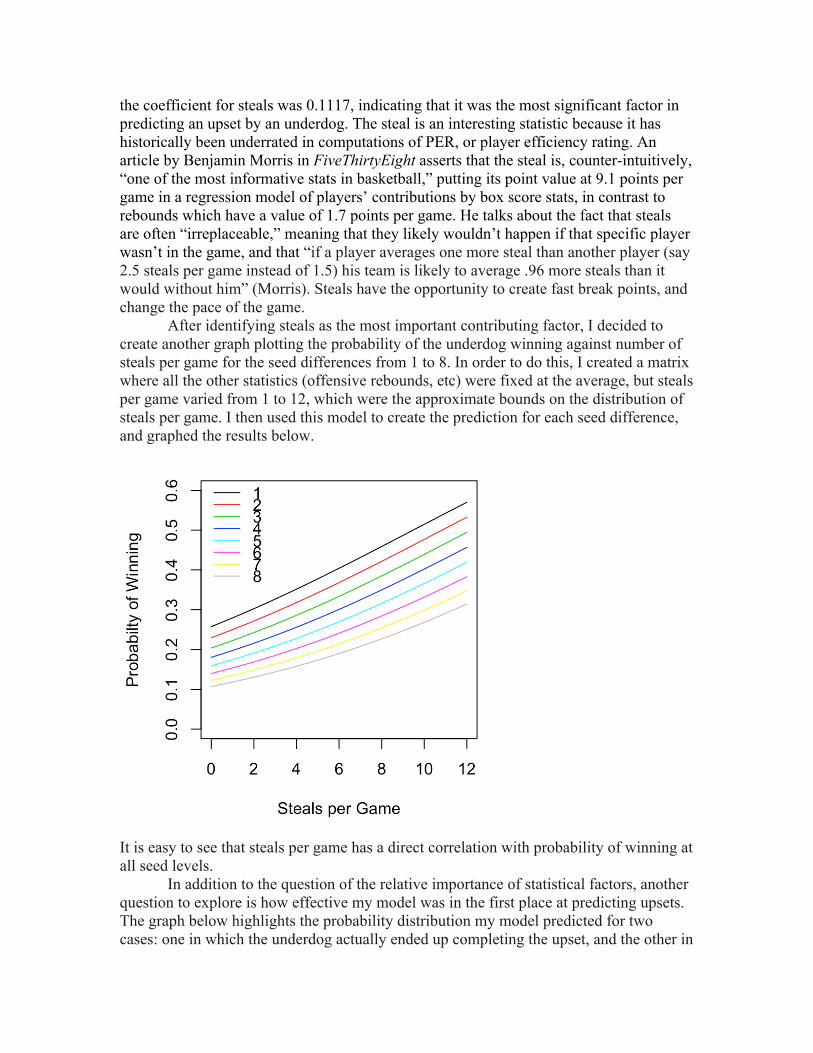
the coefficient for steals was 0.1117, indicating that it was the most significant factor in predicting an upset by an underdog. The steal is an interesting statistic because it has historically been underrated in computations of PER, or player efficiency rating. An article by Benjamin Morris in FiveThirtyEight asserts that the steal is, counter-intuitively, “one of the most informative stats in basketball,” putting its point value at 9.1 points per game in a regression model of players’ contributions by box score stats, in contrast to rebounds which have a value of 1.7 points per game. He talks about the fact that steals are often “irreplaceable,” meaning that they likely wouldn’t happen if that specific player wasn’t in the game, and that “if a player averages one more steal than another player (say 2.5 steals per game instead of 1.5) his team is likely to average .96 more steals than it would without him” (Morris). Steals have the opportunity to create fast break points, and change the pace of the game. After identifying steals as the most important contributing factor, I decided to create another graph plotting the probability of the underdog winning against number of steals per game for the seed differences from 1 to 8. In order to do this, I created a matrix where all the other statistics (offensive rebounds, etc) were fixed at the average, but steals per game varied from 1 to 12, which were the approximate bounds on the distribution of steals per game. I then used this model to create the prediction for each seed difference, and graphed the results below.
It is easy to see that steals per game has a direct correlation with probability of winning at all seed levels. In addition to the question of the relative importance of statistical factors, another question to explore is how effective my model was in the first place at predicting upsets. The graph below highlights the probability distribution my model predicted for two cases: one in which the underdog actually ended up completing the upset, and the other in
which the underdog lost. Although my model only predicted the underdog to win 9 out of the 230 games in my test set when in reality the underdog won 69 times, the average probabilities for the games which underdogs actually won were slightly higher than those for which they lost, and the graphs of games won and games lost are offset.
As a result, it is possible that my model overvalued seed difference, and that there were other factors contributing to underdog victories that it did not pick up on. After creating and assessing my model, I used it to make predictions for the 2016 NCAA tournament. I manually entered the data for the tournament, and created a new matrix to run the model on. Running the regression produced the probability of an upset in each of the games that were played in the tournament. From this data, I was able to make a list of the top ten upsets that my model predicted. 1. #9 Cincinnati vs. #8 St. Joe’s (0.419) (Actual Score: 78-76 L) 2. #9 Providence vs. #8 USC (0.381) (Actual Score: 70-69 W) 3. #9 Connecticut vs. #8 Colorado (0.367) (Actual Score: 74-67 W) 4. #9 Butler vs. #8 Texas Tech (0.366) (Actual Score: 71-61 W) 5. #11 Gonzaga vs. #6 Seton Hall (0.364) (Actual Score: 68-52 W) 6. #10 VA Commonwealth vs. #7 Oregon State (0.352) (Actual Score: 75-67 W) 7. #10 Syracuse vs. #7 Dayton (0.348) (Actual Score: 70-51 W) 8. #10 Pittsburgh vs. #7 Wisconsin (0.344) (Actual Score: 47-43 L) 9. #3 Texas A&M vs. #2 Oklahoma (0.340) (Actual Score: 77-63 L) 10. #10 Temple vs. #7 Iowa (0.336) (Actual Score: 72-70 L) These rankings show that my model ranked likeliness of an upset in terms of seed difference, with the exception of the Gonzaga vs. Seton Hall game. It is interesting to wonder what caused this game to rank so highly, given that Gonzaga’s average of 5 steals per game during the 2016 season was actually below the average of all of the teams, which was 6.63 steals per game. While four out of the five teams my model picked as the most likely to upset did end up actually winning, this is not really impressive because the difference between 9th seed and 8th seed is very small, and an “upset” often occurs under
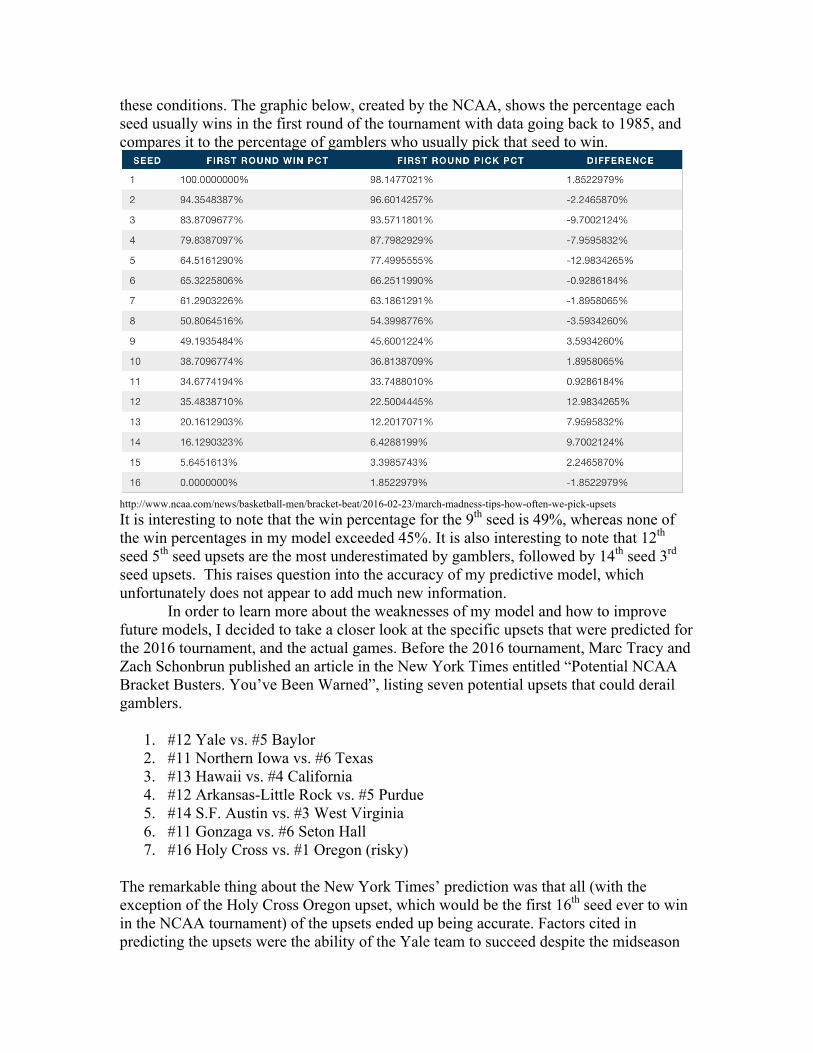
these conditions. The graphic below, created by the NCAA, shows the percentage each seed usually wins in the first round of the tournament with data going back to 1985, and compares it to the percentage of gamblers who usually pick that seed to win.
http://www.ncaa.com/news/basketball-men/bracket-beat/2016-02-23/march-madness-tips-how-often-we-pick-upsets It is interesting to note that the win percentage for the 9th seed is 49%, whereas none of the win percentages in my model exceeded 45%. It is also interesting to note that 12th seed 5th seed upsets are the most underestimated by gamblers, followed by 14th seed 3rd seed upsets. This raises question into the accuracy of my predictive model, which unfortunately does not appear to add much new information. In order to learn more about the weaknesses of my model and how to improve future models, I decided to take a closer look at the specific upsets that were predicted for the 2016 tournament, and the actual games. Before the 2016 tournament, Marc Tracy and Zach Schonbrun published an article in the New York Times entitled “Potential NCAA Bracket Busters. You’ve Been Warned”, listing seven potential upsets that could derail gamblers.
1. #12 Yale vs. #5 Baylor 2. #11 Northern Iowa vs. #6 Texas 3. #13 Hawaii vs. #4 California 4. #12 Arkansas-Little Rock vs. #5 Purdue 5. #14 S.F. Austin vs. #3 West Virginia 6. #11 Gonzaga vs. #6 Seton Hall 7. #16 Holy Cross vs. #1 Oregon (risky)
The remarkable thing about the New York Times’ prediction was that all (with the exception of the Holy Cross Oregon upset, which would be the first 16th seed ever to win in the NCAA tournament) of the upsets ended up being accurate. Factors cited in predicting the upsets were the ability of the Yale team to succeed despite the midseason
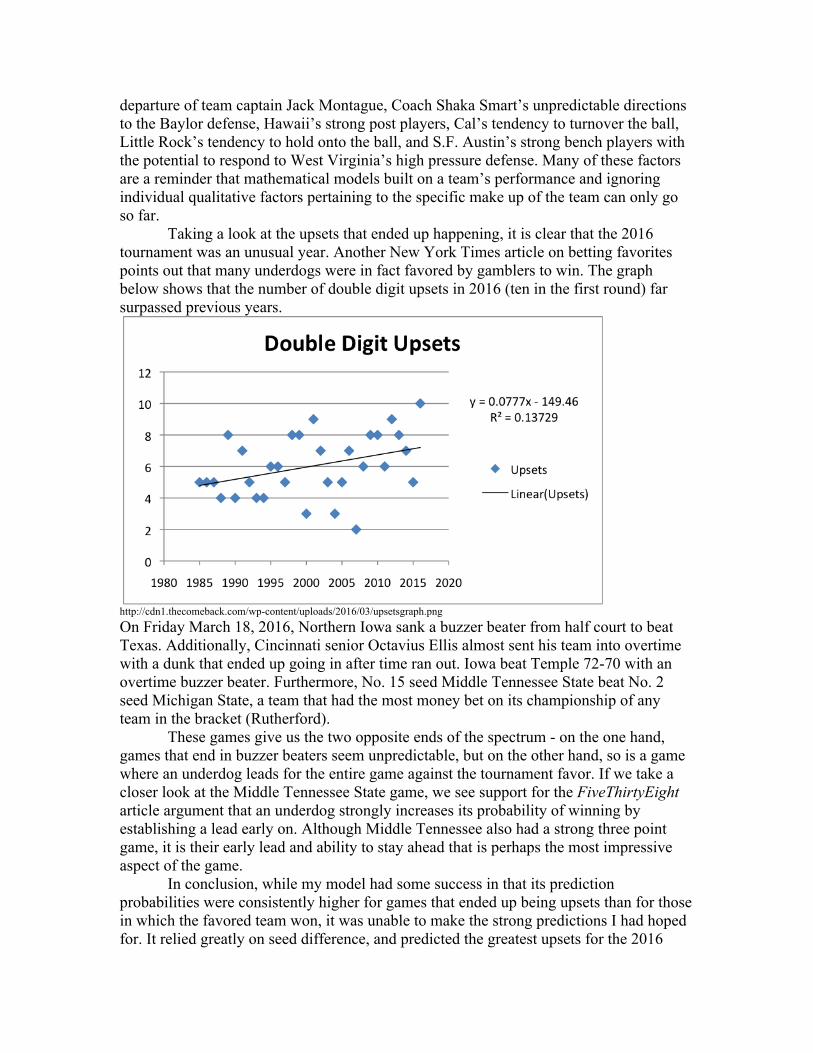
departure of team captain Jack Montague, Coach Shaka Smart’s unpredictable directions to the Baylor defense, Hawaii’s strong post players, Cal’s tendency to turnover the ball, Little Rock’s tendency to hold onto the ball, and S.F. Austin’s strong bench players with the potential to respond to West Virginia’s high pressure defense. Many of these factors are a reminder that mathematical models built on a team’s performance and ignoring individual qualitative factors pertaining to the specific make up of the team can only go so far. Taking a look at the upsets that ended up happening, it is clear that the 2016 tournament was an unusual year. Another New York Times article on betting favorites points out that many underdogs were in fact favored by gamblers to win. The graph below shows that the number of double digit upsets in 2016 (ten in the first round) far surpassed previous years.
http://cdn1.thecomeback.com/wp-content/uploads/2016/03/upsetsgraph.png On Friday March 18, 2016, Northern Iowa sank a buzzer beater from half court to beat Texas. Additionally, Cincinnati senior Octavius Ellis almost sent his team into overtime with a dunk that ended up going in after time ran out. Iowa beat Temple 72-70 with an overtime buzzer beater. Furthermore, No. 15 seed Middle Tennessee State beat No. 2 seed Michigan State, a team that had the most money bet on its championship of any team in the bracket (Rutherford). These games give us the two opposite ends of the spectrum - on the one hand, games that end in buzzer beaters seem unpredictable, but on the other hand, so is a game where an underdog leads for the entire game against the tournament favor. If we take a closer look at the Middle Tennessee State game, we see support for the FiveThirtyEight article argument that an underdog strongly increases its probability of winning by establishing a lead early on. Although Middle Tennessee also had a strong three point game, it is their early lead and ability to stay ahead that is perhaps the most impressive aspect of the game. In conclusion, while my model had some success in that its prediction probabilities were consistently higher for games that ended up being upsets than for those in which the favored team won, it was unable to make the strong predictions I had hoped for. It relied greatly on seed difference, and predicted the greatest upsets for the 2016
tournament as those with only a one point seed difference. Although it did highlight the importance of steals, it generally made “safe” predictions and did not capture the degree of nuance I would have liked. However, I do believe that my investment in a statistical model is a good start for the field of NCAA basketball predictions. In considering directions for future research, one aspect I would like to see explored is that of the impact of round on the tournament for probability of an upset. Featured below are a table of the 2016 upsets by round, and a chart showing the historical percentage of upsets by round, both with and without one seed differences as a part of the data. First Round Second
Round Sweet Sixteen
Elite Eight Final Four Championship
13 3 0 3 0 1
https://www.washingtonpost.com/news/wonk/wp/2015/03/17/where-to-expect-upsets-on-your-ncaa-bracket/ Additionally, I would like to explore the psychological impact of factors such as player injuries, starting the game behind, and shooting streakiness. I believe that there is more to underdog success than just box score statistics can predict. As one betting website says, “Teams playing relaxed that have nothing to lose are very dangerous” (SportsBettingAcumen). Although these factors are not easily quantifiable, I think that attempting to quantify more of the abstract concepts behind the psychology of the underdog could give a more accurate representation of where and when upsets actually occur.
BIBLIOGRAPHY:
Brian. “Risk is the ally of the underdog.” Gravity and Levity. 21 Dec. 2010. Web. 2 June 2016. <https://gravityandlevity.wordpress.com/2010/12/21/risk-is-the-ally-of-the-underdog/>
Bump, Philip. “Where to expect upsets on your NCAA bracket.” Washington Post. 17 Mar. 2015. Web. 2 June 2016. <https://www.washingtonpost.com/news/wonk/wp/2015/03/17/where-to-expect-upsets-on-your-ncaa-bracket/> Ezekowitz, John, and Andrew Cohen. “Putting Theories to the Test: Does Slow Tempo Aid NCAA Tournament Upsets?” The Harvard Sports Analysis Collective. 11 Feb. 2010. Web. 2 June 2016. <https://harvardsportsanalysis.wordpress.com/2010/02/11/putting-theories-to-the-test-does-slow-tempo-aid-ncaa-tournament-upsets/>. Greenberg, Neil. “2016 NCAA tournament: The most likely upsets for the first round.” Washington Post. 13 Mar. 2016. Web. 2 June 2016. <https://www.washingtonpost.com/news/fancy-stats/wp/2016/03/13/2016-ncaa-tournament-the-most-likely-upsets-for-the-first-round/> Lyons, Tom. “What wins Basketball Games: Review of “Basketball on Paper: Rules and Tools for Performance Analysis” By Dean Oliver.” Strauss Factor Laing & Lyons. Web. 2 June 2016. <http://www.sfandllaw.com/Articles/What-Wins-Basketball-Games-a-Review-of-Basketball-on-Paper-Rules-and-Tools-for-Performance-Analysis.shtml> “March Madness: Upsets, Upsets, and More Upsets.” The New York Times. 18 Mar. 2016. Web. 2 June 2016. <http://www.nytimes.com/interactive/projects/cp/sports/2016-ncaa-tournament/michigan-state-loses-to-middle-tennessee>. Mathis-Lilly, Ben. “Understanding the Underdog: How Gladwell Got Basketball Wrong.” New York Magazine. 11 May 2009. Web. 2 June 2016. <http://nymag.com/daily/intelligencer/2009/05/malcolm_gladwell_isnt_a_basket.html> Morris, Benjamin. “The Hidden Value of the NBA Steal.” FiveThirtyEight. 25 Mar. 2014. Web. 2 June 2016. http://fivethirtyeight.com/features/the-hidden-value-of-the-nba-steal/ Oliver, Dean. Basketball on Paper. Web. 2 June 2016. <http://www.basketballonpaper.com>. Pettigrew, Stephen. “How To Tell If A March Madness Underdog Is Going to Win.” FiveThirtyEight.19 Mar. 2015. <http://fivethirtyeight.com/features/how-to-tell-if-a-march-madness-underdog-is-going-to-win/>.
Purdum, David. “Estimated 40 million fill out brackets.” ESPN. 12 Mar. 2015. Web. 2 June 2016. <http://espn.go.com/chalk/story/_/id/12465741/estimated-70-million-brackets-9-million-bets-ncaa-tournament> Rutherford, Mike. “NCAA Tournament 2016: The best and worst from the wildest day in March Madness History.” SB Nation. 19 Mar. 2016. Web. 2 June 2016. <http://www.sbnation.com/college-basketball/2016/3/19/11267698/ncaa-tournament-2016-march-madness-scores-upsets-highlights-schedule-bracket> Tracy, Marc, and Zach Schonbrun. “Potential NCAA Bracket Busters. You’ve Been Warned.” New York Times. 14 Mar. 2015. Web. 2 June 2016. <http://www.nytimes.com/interactive/2016/03/14/sports/march-madness-upsets-ncaa-tournament-bracket.html>