The Centers for Medicare & Medicaid Services' Office of Research, Development, and Information (ORDI) strives to make information available to all. Nevertheless, portions of our files including charts, tables, and graphics may be difficult to read using assistive technology. Persons with disabilities experiencing problems accessing portions of any file should contact ORDI at [email protected]. Medicare/Medicaid Research and Demonstration Task Order Contract (MRAD/TOC) HHSM-500-2005-00027I, T.O. 4 ALTERNATIVE APPROACHES TO MEASURING PHYSICIAN RESOURCE USE Appendices April 9, 2012 Submitted by Bryan Dowd, PhD Robert Kane, MD Shriram Parashuram, MPH Tami Swenson, MS University of Minnesota Robert F. Coulam, PhD Simmons College CMS Project Officer: Jesse Levy, PhD
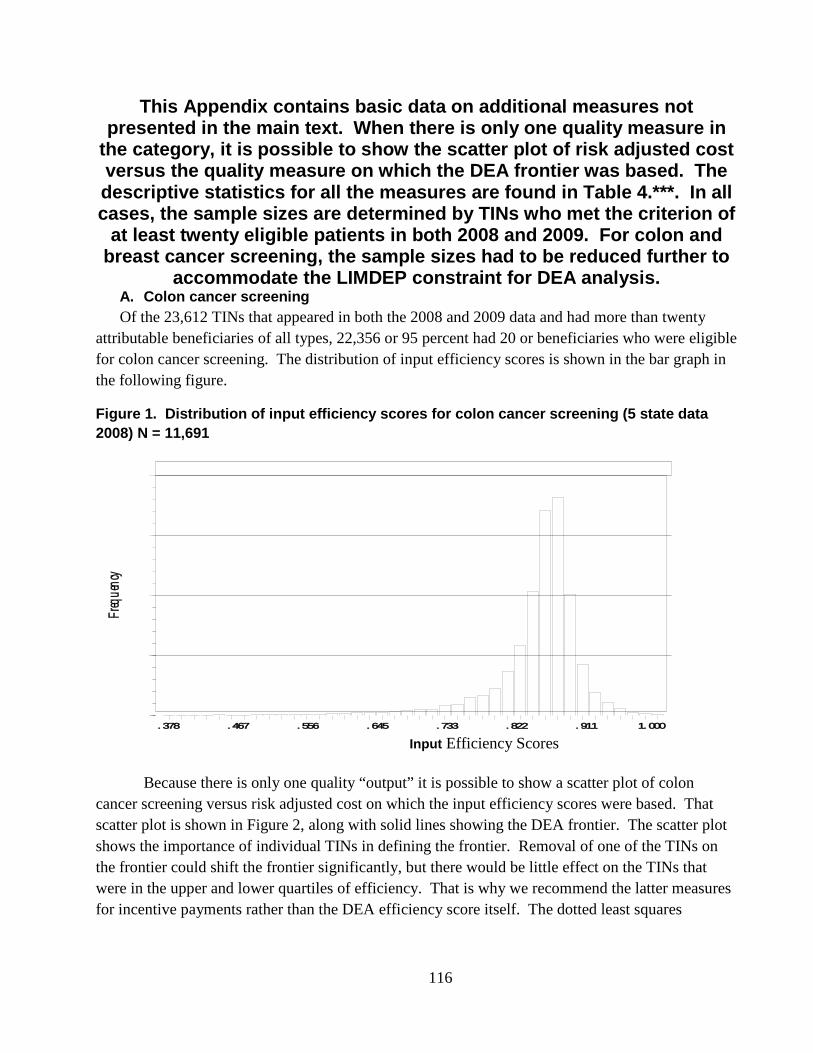
Transcript
The Centers for Medicare & Medicaid Services' Office of Research, Development, and Information (ORDI) strives to make information available to all. Nevertheless, portions of our files including charts, tables, and graphics may be difficult to read using assistive technology. Persons with disabilities experiencing problems accessing portions of any file should contact ORDI at [email protected].
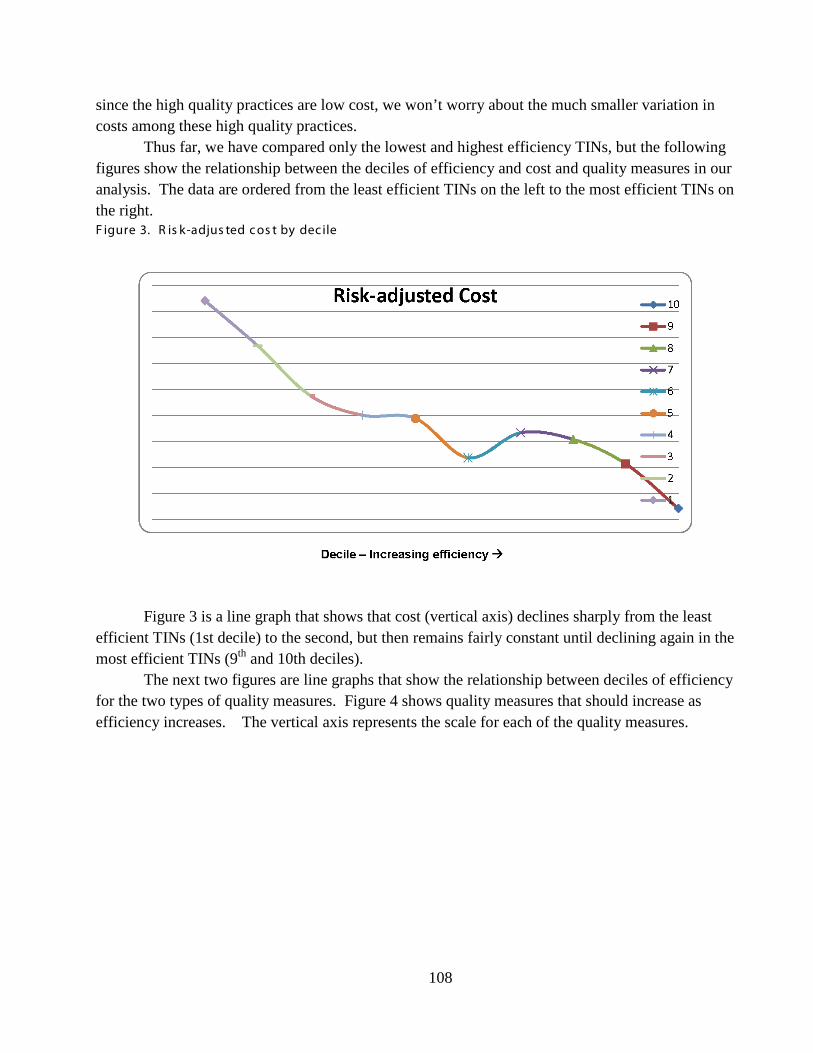
Medicare/Medicaid Research and Demonstration Task Order Contract (MRAD/TOC)
HHSM-500-2005-00027I, T.O. 4
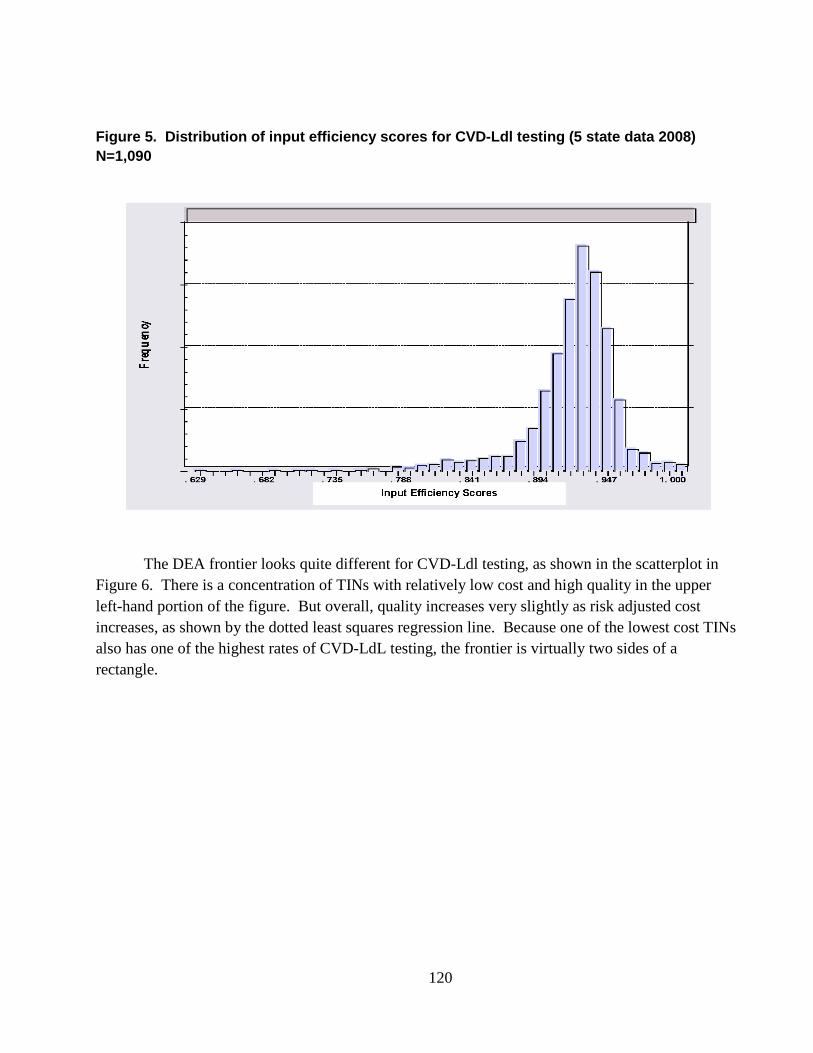
ALTERNATIVE APPROACHES TO MEASURING PHYSICIAN RESOURCE USE
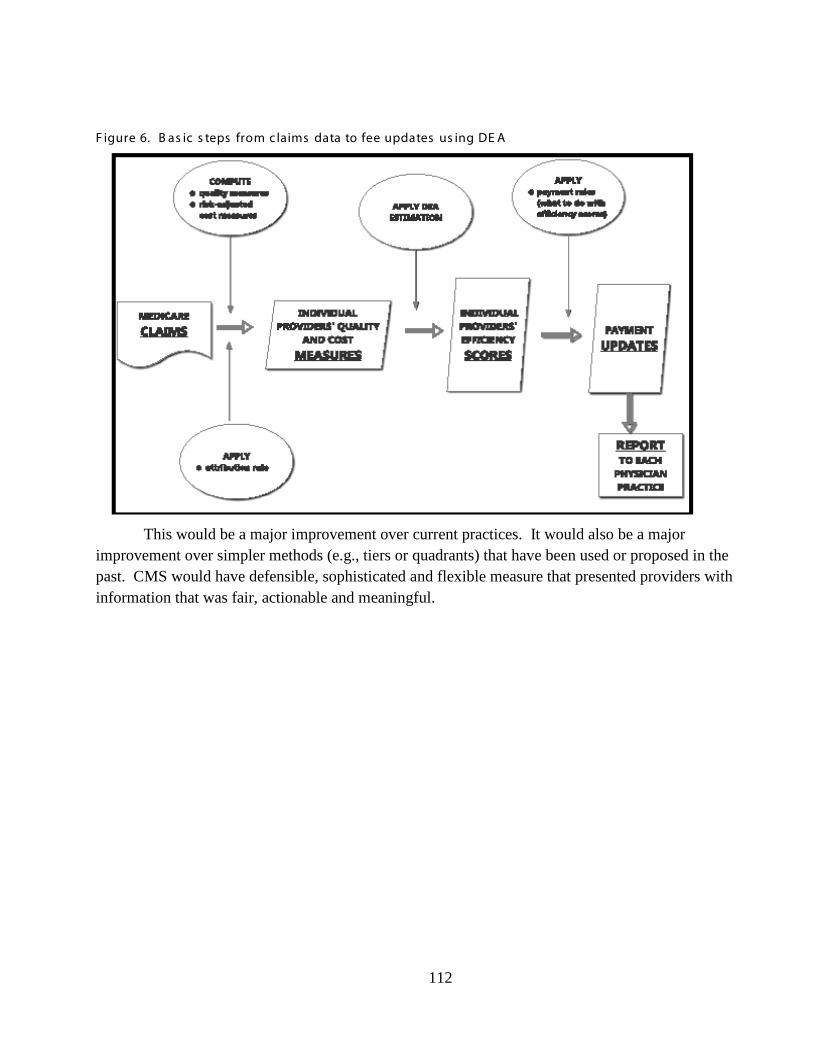
Appendix 1: List of Medical and Surgical MS DRGs for Selected Conditions ...............................3 Appendix 2: Match Rates among Different Physicians Listed on Claims Associated With Index Hospitalization .......................................................................................................................11 Appendix 3: Summary of MS-DRG Episodes from Multistate Data ...............................................17 Appendix 4: TIN Characteristics and Covariates .............................................................................20 Appendix 5: Hospital Level Quality measures and Results From MS-DRG TEP Weighting Exercise ................................................................................................................24 Appendix 6: Episode Level Quality Measures .................................................................................30 Appendix 7: Hospital Compare Measures ........................................................................................43 Appendix 8: AHRQ Patient Safety Indicators ..................................................................................47 Appendix 9: Hospital Compare Measures Included in Quality Composite for MS-DRG conditions ...............................................................................................................................41 Appendix 10: Patient Safety Indicators Included in Quality Composite for MS-DRG Conditions .............................................................................................................................43 Appendix 11: Quality Composite for MS-DRG Conditions.............................................................45 Appendix 12: The Medicare Physician Quality Reporting System (PQRS): Quality Measurement and Beneficiary Attribution .............................................................................48 Appendix 13: Using Avoidable Emergency Department (ED) Visits as a Performance Measure for Medicare Physicians’ Practices .........................................................................65 Appendix 14: Using Data Envelopment Analysis in a Value-based Modifier Payment System for Physicians ............................................................................................................89 Appendix 15: Additional DEA Histograms and Plots of Quality Measures vs. Cost .......................109 Appendix 16: Distribution of TINs and Risk Adjusted Cost across Risk Adjusted Quality Tiers in Different TIN Peer Groups ........................................................................118 Appendix 17: Stability of TINs Risk Adjusted Quality Tiers and Performance Scores between 30 and 60 day Episodes..........................................................................................................125 Appendix 18: Regression Results from Beneficiary Cost Analyses ..................................................130 Appendix 19: Regression Results from MS-DRG Cost Analyses .....................................................162 Appendix 20: Regression Results from MS-DRG Quality Analyses Measure for Medicare Physicians’ Review ................................................................................................................225
3
APPENDIX 1 LIST OF MEDICAL AND SURGICAL MS-DRGs FOR SELECTED
CONDITIONS
4
APPENDIX 1: LIST OF MEDICAL AND SURGICAL MS DRGs FOR SELECTED CONDTIONS
I. ACUTE MYOCARDIAL INFARCTION
TABLE 1 A.: MS DRGS FOR MEDICAL AMI *
MS DRG MDC TYPE MS DRG TITLE 280 05 MED Acute myocardial infarction, discharged alive w MCC
281 05 MED Acute myocardial infarction, discharged alive w CC
282 05 MED Acute myocardial infarction, discharged alive w/o CC/MCC
* To be included only if there is an accompanying ICD-9 code for AMI
TABLE 1 B.: MS DRGS FOR AMI WITH PERCUTANEOUS TRANSLUMINAL CORONARY ANGIOPLASTY (PTCA)*
MS DRG MDC TYPE MS DRG TITLE 246 05 SURG Perc cardiovasc proc w drug-eluting stent w MCC or 4+ vessels/stents
247 05 SURG Perc cardiovasc proc w drug-eluting stent w/o MCC
248 05 SURG Perc cardiovasc proc w non-drug-eluting stent w MCC or 4+ ves/stents
249 05 SURG Perc cardiovasc proc w non-drug-eluting stent w/o MCC
* To be included only if there is an accompanying ICD-9 code for AMI
TABLE 1 C.: MS DRGS FOR AMI WITH CORONARY ARTERY BYPASS GRAFT (PTCA)*
MS DRG MDC TYPE MS DRG TITLE 231 05 SURG Coronary bypass w PTCA w MCC
232 05 SURG Coronary bypass w PTCA w/o MCC
233 05 SURG Coronary bypass w cardiac cath w MCC
234 05 SURG Coronary bypass w cardiac cath w/o MCC
* To be included only if there is an accompanying ICD-9 code for AMI
5
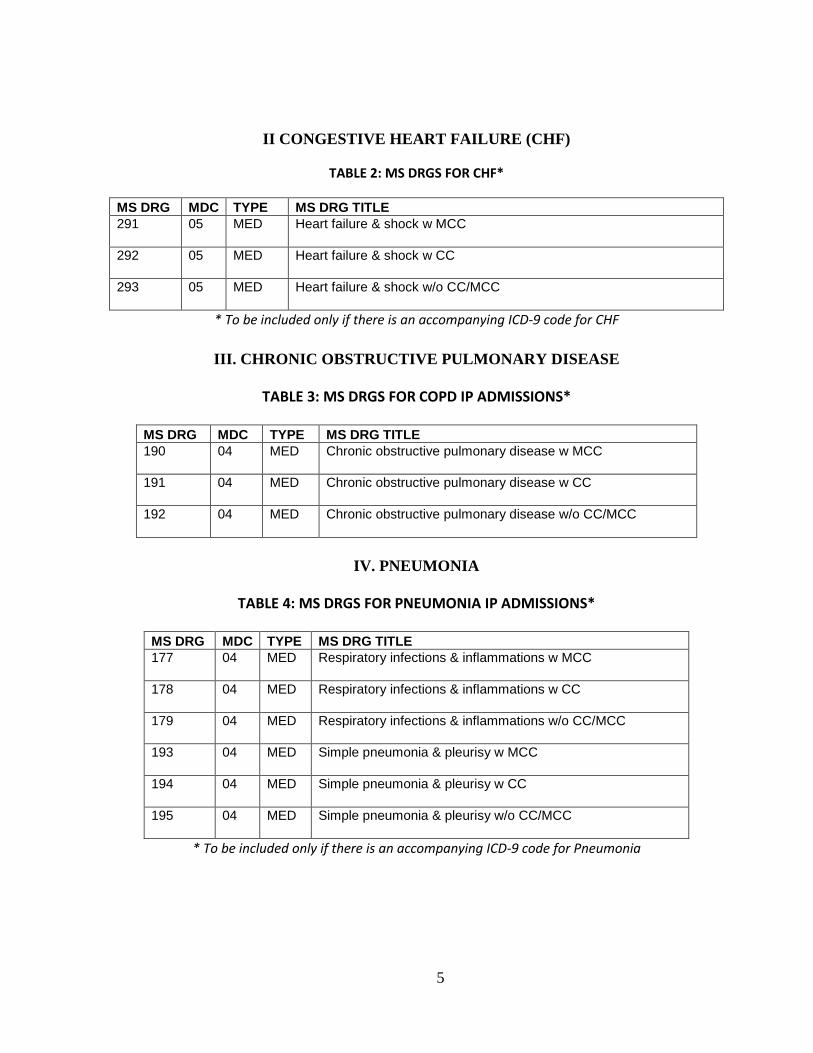
II CONGESTIVE HEART FAILURE (CHF)
TABLE 2: MS DRGS FOR CHF*
MS DRG MDC TYPE MS DRG TITLE 291 05 MED Heart failure & shock w MCC
292 05 MED Heart failure & shock w CC
293 05 MED Heart failure & shock w/o CC/MCC
* To be included only if there is an accompanying ICD-9 code for CHF
III. CHRONIC OBSTRUCTIVE PULMONARY DISEASE
TABLE 3: MS DRGS FOR COPD IP ADMISSIONS*
MS DRG MDC TYPE MS DRG TITLE 190 04 MED Chronic obstructive pulmonary disease w MCC
191 04 MED Chronic obstructive pulmonary disease w CC
192 04 MED Chronic obstructive pulmonary disease w/o CC/MCC
IV. PNEUMONIA
TABLE 4: MS DRGS FOR PNEUMONIA IP ADMISSIONS*
MS DRG MDC TYPE MS DRG TITLE 177 04 MED Respiratory infections & inflammations w MCC
178 04 MED Respiratory infections & inflammations w CC
179 04 MED Respiratory infections & inflammations w/o CC/MCC
193 04 MED Simple pneumonia & pleurisy w MCC
194 04 MED Simple pneumonia & pleurisy w CC
195 04 MED Simple pneumonia & pleurisy w/o CC/MCC
* To be included only if there is an accompanying ICD-9 code for Pneumonia
6
V. BRONCHITIS
TABLE 5: MS DRGS FOR BRONCHITIS IP ADMISSIONS*
MS DRG MDC TYPE MS DRG TITLE 202 04 MED Bronchitis & asthma w CC/MCC
203 04 MED Bronchitis & asthma w/o CC/MCC
* To be included only if there is an accompanying ICD-9 code for Bronchitis
VI. STROKE
TABLE 6 A: MS DRGS FOR ACUTE ISCHEMIC STROKE
MS DRG MDC TYPE MS DRG TITLE 061 01 MED Acute ischemic stroke w use of thrombolytic agent w MCC
062 01 MED Acute ischemic stroke w use of thrombolytic agent w CC
063 01 MED Acute ischemic stroke w use of thrombolytic agent w/o CC/MCC
TABLE 6 B: MS DRGS FOR STROKE WITH CEREBRAL INFARCTION
MS DRG MDC TYPE MS DRG TITLE 064 01 MED Intracranial hemorrhage or cerebral infarction w MCC
065 01 MED Intracranial hemorrhage or cerebral infarction w CC
066 01 MED Intracranial hemorrhage or cerebral infarction w/o CC/MCC
VII. HIP FRACTURE
TABLE 7: MS DRGS HIP FRACTURE*
MS DRG MDC TYPE MS DRG TITLE 535 08 MED Fractures of hip & pelvis w MCC
536 08 MED Fractures of hip & pelvis w/o MCC
* To be included only if there is an accompanying ICD-9 code for hip fracture
7
VIII. HIP REPLACEMENT
TABLE 8: MS DRGS FOR HIP REPLACEMENT*
MS DRG MDC TYPE MS DRG TITLE 469 08 SURG Major joint replacement or reattachment of lower extremity w MCC
470 08 SURG Major joint replacement or reattachment of lower extremity w/o MCC
* To be included only if there is an accompanying ICD-9 code for hip replacement
IX. KNEE REPLACEMENT
TABLE 9: MS DRGS FOR KNEE REPLACEMENT *
MS DRG MDC TYPE MS DRG TITLE 469 08 SURG Major joint replacement or reattachment of lower extremity w MCC
470 08 SURG Major joint replacement or reattachment of lower extremity w/o MCC
* To be included only if there is an accompanying ICD-9 code for knee replacement
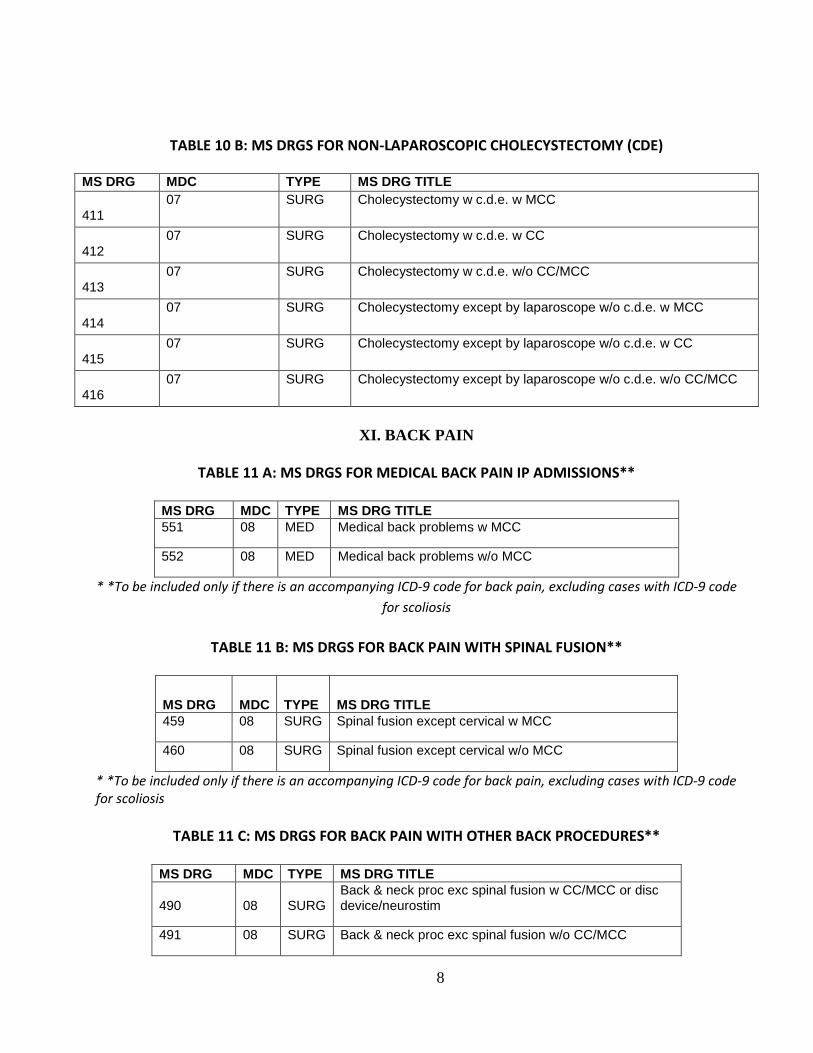
X. CHOLECYSTECTOMY
TABLE 10 A: MS DRGS FOR LAPAROSCOPIC CHOLECYSTECTOMY (CDE)
MS DRG MDC TYPE MS DRG TITLE
417 07 SURG Laparoscopic cholecystectomy w/o c.d.e. w MCC
418 07 SURG Laparoscopic cholecystectomy w/o c.d.e. w CC
* *To be included only if there is an accompanying ICD-9 code for back pain, excluding cases with ICD-9 code for scoliosis
10
APPENDIX 2 MATCH RATES AMONG DIFFERENT PHYSICIANS LISTED ON CLAIMS
ASSOCIATED WITH INDEX HOSPITALIZATION
11
Table 1: ATTENDING AND OPERATING PHYSICIAN MATCHING FOR MEDICAL MS-DRGs AND PERCENT OF PART B PAYMENT FOR INITIAL HOSPITALIZATION BILLED TO ATTENDING PHYSICIAN
Dx/Tx MS-DRG Description TYPE Percent Match OP and AT Phys (Part A)
Percent Index Part B Payment Billed to Part A at PHYS
Percent Match AT Phys (Part A) and Top Part B billing phys
AMI 280 AMI w MCC MED 80% 22% 42%
AMI 281 AMI w CC MED 85% 29% 47%
AMI 282 AMI w/o MCC/CC MED 83% 27% 51%
CHF 291 Heart failure & shock w MCC
MED 83% 27% 38%
CHF 292 Heart failure & shock w CC
MED 88% 31% 41%
CHF 293 Heart failure & shock w/o CC/MCC
MED 92% 34% 46%
COPD 190 COPD w MCC MED 62% 29% 46%
COPD 191 COPD w CC MED 62% 35% 48%
COPD 192 COPD w/o MCC/CC MED 57% 37% 52%
12
TABLE 2: PART A ATTENDING, PART A OPERATING, AND PART B PRIMARY OPERATING PHYSICIAN MATCHING FOR SURGICAL MS-DRGS
Dx/Tx MS-DRG Description Type Column A percent Match OP and AT Phys (Part A)
Column B percent Match OP Part A and Primary OP Part B Phys
Column C percent Match AT Part A and Pri OP Part B Phys
AMI with CABG
231, CABG+PTCA w MCC
SURG 83% 33% 50%
AMI 232 CABG+PTCA w/o MCC
SURG 67% 33% 4%
AMI 233 CABG+CATH w MCC
SURG 72% 56% 39%
AMI 234 CABG+CATH w/o MCC
SURG 73% 57% 38%
AMI 246 PTCA (DES) w MCC
SURG 79% 55% 36%
AMI 247 PTCA (DES) w/o MCC
SURG 86% 58% 48%
AMI 248 PTCA (BMS) w MCC
SURG 77% 59% 39%
AMI 249 PTCA (BMS) w/o MCC
SURG 84% 68% 54%
TOTAL HIP
462 Total Hip Repl. Multiple Joint w/o MCC
SURG 100% 67% 67%
TOTAL HIP
469 Total Hip Repl w MCC
SURG 99% 66% 64%
TOTAL HIP
470 Total Hip Repl w/o MCC
SURG 99% 72% 72%
HIP FRAC.
535 Fractures of hip & pelvis w MCC
SURG 69% 10% 13%
HIP FRAC.
536 Fractures of hip & pelvis w/o MCC
SURG 71% 7% 11%
CHOLE. 411 Cholecystectomy w c.d.e. w MCC
SURG 100% 60% 60%
CHOLE. 412 Cholecystectomy w c.d.e. w CC
SURG 78% 29% 14%
13
Dx/Tx MS-DRG Description Type Column A percent Match OP and AT Phys (Part A)
Column B percent Match OP Part A and Primary OP Part B Phys
Column C percent Match AT Part A and Pri OP Part B Phys
CHOLE. 413 Cholecystectomy w c.d.e. w/o CC/MCC
SURG 100% 83% 83%
CHOLE. 414 Cholecystectomy except by laparoscope w/o c.d.e. w MCC
SURG 81% 45% 27%
CHOLE. 415 Cholecystectomy except by laparoscope w/o c.d.e. w CC
SURG 85% 47% 38%
CHOLE. 416 Cholecystectomy except by laparoscope w/o c.d.e. w/o CC/MCC
SURG 94% 62% 59%
CHOLE. 417 Laparoscopic cholecystectomy w/o c.d.e. w MCC
SURG 74% 43% 24%
CHOLE. 418 Laparoscopic cholecystectomy w/o c.d.e. w CC
*Costs are not risk adjusted for beneficiary level covariates
18
APPENDIX 4 TIN CHARACTERISTICS AND COVARIATES
19
TABLE 1: TIN CHARACTERISTICS ASSOCIATED WITH LOW EPISODE VOLUME, LOW EPISODE PROPORTION AND LOW FULL TIME EPISODES FOR AMI
Condition MS-DRG
TIN Characteristics Associated with Low Episode Volume Pr( jn =1)=1
TIN Characteristics Associated with Low Episode Proportion
Pr((∑=
jn
iijp
1/ jn ) ≤ 0.10)=1
TIN Characteristics Associated with Low FTEs
Pr( (∑=
jn
iijp
1)≤ 1) =1
Medical AMI (# of TINs: 15,732)
280, 281, 282
% TINs: 31% Single Specialty TINs TINs w Low # of NPIs, and Ortho; TINs w/o Cardiology , Internal Med, Critical Med, Med. Spec. & Radiology
% TINs: 26% Single Specialty TINs; Non-Rural TINs; TINs w Radiology, Anesth., Surgery, Ortho. & Surgical Spec.
% TINs: 65% Single Specialty TINs; Non-Rural TINs; TINs w Radiology, Anesth. & Surgery; TIN's w/o Cardiology, Internal Med. & Med. Spec.
CABG w or w/o PTCA (# of TINs: 4,763)
231, 232, 233, 234
% TINs: 46% Single Specialty TINs; Rural TINs; TINs w Low # of NPIs, Med. Spec. and Ortho; TINs w/o Cardiac. Surgery, Surgical Spec., Cardiology, Internal Med, Critical Med, Radiology & Anesth.
% TINs: 64% Single Specialty TINs; TINs w Radiology, Surgery,& Other Med.; TINs w/o Cardiac Surgery, Surgical Spec., Cardiology, Internal Med & Anesth.
% TINs: 89% Single Specialty TINs; TINs w Radiology; TINs w/o Cardiac Surgery, Surgical Spec., Cardiology & Anesth.
PTCA (# of TINs: 7,991)
246, 247, 248, 249
%TINs: 45% Single Specialty TINs; Rural TINs; TINs w Low # of NPIs, Surgery, Surgical Spec., Anesth. & Ortho; TINs w/o Cardiology , Internal Med, Critical Med., Radiology and Cardiac Surgery
%TINs: 44% Single Specialty TINs; TINs w Radiology, Surgery, & Anesth.; TINs w/o Cardiology, Internal Med & Critical Med.
%TINs: 82% Single Specialty TINs; TINs w Radiology, Surgery & Anesth.; TINs w/o Cardiology & Critical Med.
20
TABLE 2: RISK ADJUSTED 30 AND 60 DAY EPISODE COSTS, NUMBER, PROPORTION AND FULL TIME EPISODES FOR POOLED AMI
Condition # of
Episodes # of TINs
TIN's Risk Adjusted
30-day Episode
Cost: Mean (Std)
TIN's Risk Adjusted
60-day Episode
Cost: Mean (Std)
# of episodes
attributed to TINs
( jn )
MEDIAN
# of episodes attributed to
TINs ( jn )
MIN
# of episodes attributed to
TINs ( jn )
MAX
Avg. proportion of Episode Attributed
to TINs
(∑=
jn
iijp
1/ jn )
Mean (Std)
# of Full Time Episodes Attributed
to TINs
(∑=
jn
iijp
1)
Mean (Std)
Pooled AMI 50,432 17,538 114
(2,764) 155
(3,613) 3 1 525 0.22 (0.18)
2.88 (10.63)
21
TABLE 3: TIN CHARACTERISTICS ASSOCIATED WITH LOW EPISODE VOLUME, LOW EPISODE PROPORTION AND LOW FULL TIME EPISODES FOR POOLED AMI
Condition
with Low Episode Volume Pr( n j =1)=1
Episode Proportion n
Pr((∑j
pij / n j ) ≤ 0.10)=1 i=1
TIN Characteristics Associated with Low FTEs n
Pr( (∑j
pij )≤ 1) =1 i=1
TIN Characteristics Associated TIN Characteristics Associated with Low
Pooled AMI (# of TINs:
17,538)
% TINs: 28% Single Specialty TINs; TINs w Low # of NPIs, Surgical Spec., Other Surg. and Ortho; TINs w/o Cardiology , Internal Med, Critical Med, Med. Spec., Cardiac Surg. & Radiology
% TINs: 24% Single Specialty TINs; Non-Rural TINs; TINs w Radiology, Anesth. , Ortho, & Surgery; TIN's w/o Cardiology, Internal Med. & Critical Med, Cardiac Surg. & Medical Spec.
% TINs: 58% Non-Rural TINs; TINs w Radiology, Anesth. & Surgery; TIN's w/o Cardiology, Internal Med. & Other Medical.
22
APPENDIX 5 HOSPITAL LEVEL QUALITY MEASURES AND RESULTS FROM MS-DRG
TEP WEIGHTING EXERCISE
23
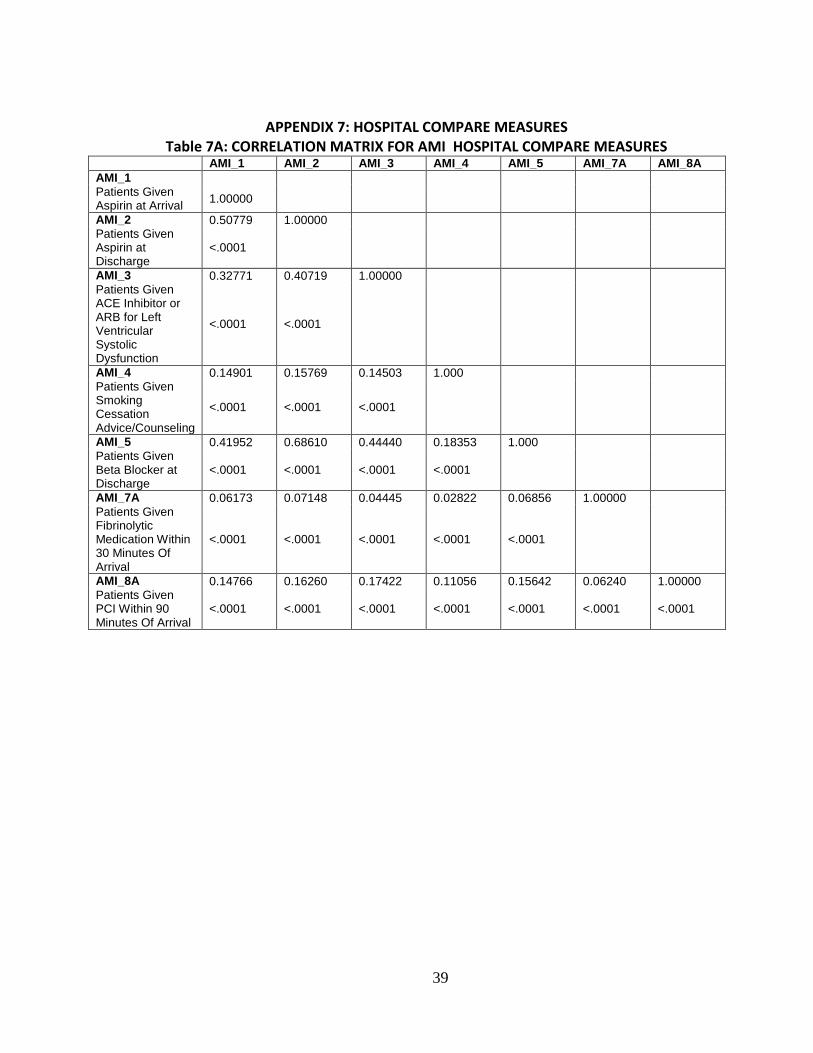
Table 5.1 (a): Hospital Compare Process Measure Set for AMI
Acronym Measure ( Total Measures =7) AMI 1 Patients Given Aspirin at Arrival AMI 2 Patients Given Aspirin at Discharge AMI 3 Patients Given ACE Inhibitor or ARB for Left Ventricular Systolic Dysfunction
(LVSD) AMI 4 Patients Given Smoking Cessation Advice/Counseling AMI 5 Patients Given Beta Blocker at Discharge AMI 7 Patients Given Fibrinolytic Medication Within 30 Minutes Of Arrival AMI 8 Patients Given PCI Within 90 Minutes Of Arrival
Table 5.1 (b): Hospital Compare Process Measure Set for CHF
Acronym Measure (Total Measures =4) HF 1 Patients Given Discharge Instructions HF 2 Patients Given An Evaluation of Left Ventricular Systolic (LVS) Function HF 3 Patients Given ACE Inhibitor or ARB for Left Ventricular Systolic Dysfunction
(LVSD) HF 4 Patients Given Smoking Cessation Advice/Counseling
Table 5.1 (c): Hospital Compare Process Measure Set for Pneumonia
Acronym Measure (Total Measures =7) PN 1 Patients Given Oxygenation Assessment PN 2 Patients Assessed and Given Pneumococcal Vaccination PN 3 Patients Whose Initial Emergency Room Blood Culture Was Performed Prior
to the Administration of the First Hospital Dose of Antibiotics PN 4 Patients Given Smoking Cessation Advice/Counseling PN 5 Patients Given Initial Antibiotic(s) within 6 Hours After Arrival PN 6 Patients Given the Most Appropriate Initial Antibiotic(s) PN 7 Pneumonia Patients Assessed and Given Influenza Vaccination
24
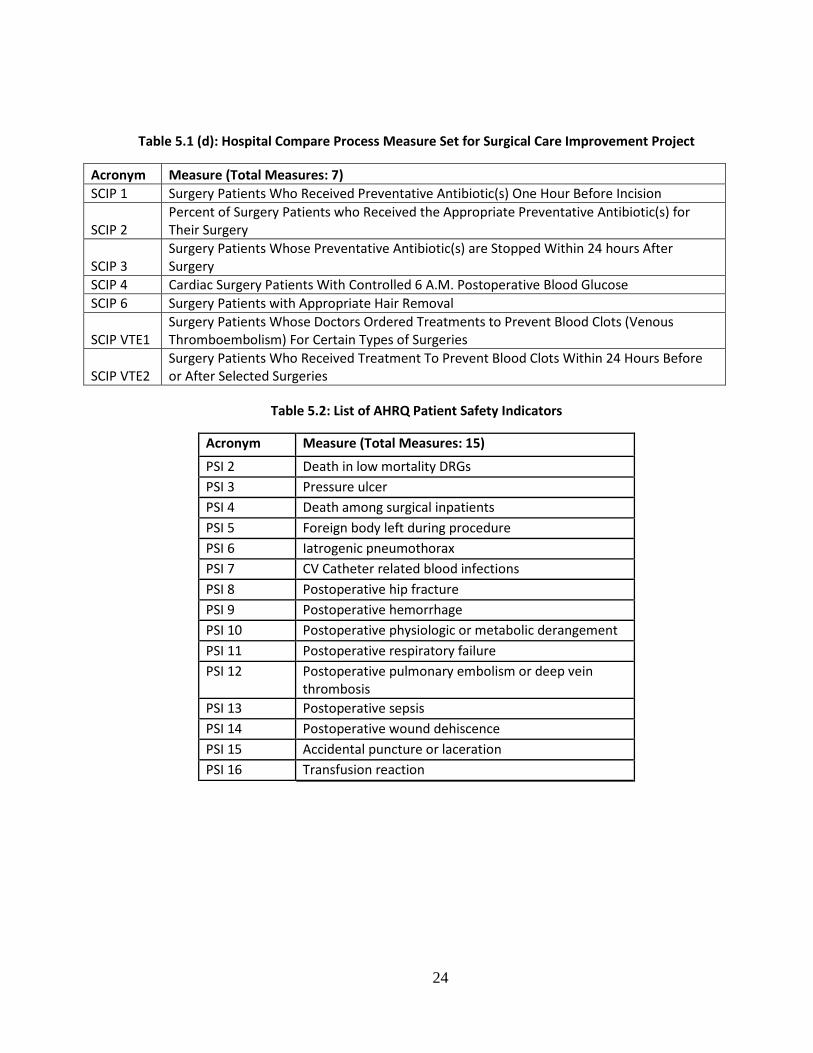
Table 5.1 (d): Hospital Compare Process Measure Set for Surgical Care Improvement Project
Acronym Measure (Total Measures: 7) SCIP 1 Surgery Patients Who Received Preventative Antibiotic(s) One Hour Before Incision
SCIP 2 Percent of Surgery Patients who Received the Appropriate Preventative Antibiotic(s) for Their Surgery
SCIP 3 Surgery Patients Whose Preventative Antibiotic(s) are Stopped Within 24 hours After Surgery
SCIP 4 Cardiac Surgery Patients With Controlled 6 A.M. Postoperative Blood Glucose SCIP 6 Surgery Patients with Appropriate Hair Removal
SCIP VTE1 Surgery Patients Whose Doctors Ordered Treatments to Prevent Blood Clots (Venous Thromboembolism) For Certain Types of Surgeries
SCIP VTE2 Surgery Patients Who Received Treatment To Prevent Blood Clots Within 24 Hours Before or After Selected Surgeries
Table 5.2: List of AHRQ Patient Safety Indicators
Acronym Measure (Total Measures: 15) PSI 2 Death in low mortality DRGs PSI 3 Pressure ulcer PSI 4 Death among surgical inpatients PSI 5 Foreign body left during procedure PSI 6 Iatrogenic pneumothorax PSI 7 CV Catheter related blood infections PSI 8 Postoperative hip fracture PSI 9 Postoperative hemorrhage PSI 10 Postoperative physiologic or metabolic derangement PSI 11 Postoperative respiratory failure PSI 12 Postoperative pulmonary embolism or deep vein
The following chart is a bar graph, showing the distribution of TINs’ average probability of no avoidable ED utilization per 30-day COPD episode for COPD TINs. Figure 6.1 (c): DISTRIBUTION OF TINs’ AVERAGE PROBABILITY OF NO AVOIDABLE ED UTILIZATION PER 30-DAY COPD
TIN's Average Probability of 30-day No Avoidable ED Utilization per Episode The following chart is a bar graph, showing the distribution of TINs’ risk adjusted 30-day survival likelihood for Pneumonia TINs.
30
FIGURE 6.2 (a): DISTRIBUTION OF TINs’ RISK ADJUSTED 30-DAY SURVIVAL LIKELIHOOD FOR PNEUMONIA TINs
30-Day Adjusted Survival likelihood Percent per TIN
31
The following chart is a bar graph, showing the distribution of TINs’ risk adjusted 30-day potentially preventable rehospitalization free likelihood for Pneumonia TINs. FIGURE 6.2 (b): DISTRIBUTION OF TINs’ RISK ADJUSTED 30-DAY POTENTIALLY PREVENTABLE REHOSPITALIZATION FREE LIKELIHOOD FOR PNEUMONIA TINs
30-Day Adjusted PPR-free likelihood Percent per TIN
The following chart is a bar graph, showing the distribution of TINs’ average probability of no avoidable ED utilization per 30-day CHF episode for Pneumonia TINs. Figure 6.2 (c): DISTRIBUTION OF TINs’ AVERAGE PROBABILITY OF NO AVOIDABLE ED UTILIZATION PER 30-DAY CHF EPISODE FOR PNEUMONIA TINs
30-Day Adjusted Survival likelihood Percent per TIN
33
The following chart is a bar graph, showing the distribution of TINs’ risk adjusted 30-day potentially preventable rehospitalization free likelihood for Hip Replacement TINs.
FIGURE 6.3 (b): DISTRIBUTION OF TINs’ RISK ADJUSTED 30-DAY POTENTIALLY PREVENTABLE REHOSPITALIZATION FREE LIKELIHOOD FOR HIP REPLACEMENT TINs
30-Day Adjusted PPR-free likelihood Percent per TIN
34
The following chart is a bar graph, showing the distribution of TINs’ average probability of no avoidable ED utilization per 30-day Hip Replacement episode for Hip Replacement TINs.
Figure 6.3 (c): DISTRIBUTION OF TINs’ AVERAGE PROBABILITY OF NO AVOIDABLE ED UTILIZATION PER 30-DAY HIP REPLACEMENT EPISODE FOR HIP REPLACEMENT TINs
30-Day Adjusted Survival likelihood Percent per TIN The following chart is a bar graph, showing the distribution of TINs’ risk adjusted 30-day potentially preventable rehospitalization free likelihood for Knee Replacement TINs.
FIGURE 6.4 (b): DISTRIBUTION OF TINs’ RISK ADJUSTED 30-DAY POTENTIALLY PREVENTABLE REHOSPITALIZATION FREE LIKELIHOOD FOR KNEE REPLACEMENT TINs
30-Day Adjusted PPR-free likelihood Percent per TIN
37
The following chart is a bar graph, showing the distribution of TINs’ average probability of no avoidable ED utilization per 30-day Knee Replacement episode for Knee Replacement TINs.
Figure 6.4 (c): DISTRIBUTION OF TINs’ AVERAGE PROBABILITY OF NO AVOIDABLE ED UTILIZATION PER 30-DAY KNEE REPLACEMENT EPISODE FOR KNEE REPLACEMENT TINs
Surg_VTE_1 0.38047 0.29064 0.41441 0.27268 0.21655 1.000 Patients who received Tx to prevent blood clots after surgery
<.0001 <.0001 <.0001 <.0001 <.0001
Surg_VTE_2 0.35546 0.29513 0.42491 0.25561 0.21278 0.94669 1.0000 Surg-VTE-2: Patients who got Tx at the right time to prevent blood clots after surgery
<.0001 <.0001 <.0001 <.0001 <.0001 <.0001
41
TABLE 7C: CORRELATION MATRIX FOR PNEUMONIA HOSPITAL COMPARE MEASURES
COMPOSITE QUALITY SCORE FOR 60-DAY EPISODES OF HIP REPLACEMENT
52
APPENDIX 12 THE MEDICARE PHYSICIAN QUALITY REPORTING SYSTEM (PQRS):
QUALITY MEASUREMENT AND BENEFICIARY ATTRIBUTION
53
The Medicare Physician Quality Reporting System (PQRS): Quality Measurement and Beneficiary Attribution
January 2012
Bryan Dowd1
Chia-hsuan Li2
Tami Swenson1
Dave Knutson3
Robert Kane1 Shri Parashuram1 Medha Karmarker4
Robert Coulam5
Craig Caplan6
Jesse Levy6
1 University of Minnesota: Minneapolis, Minnesota
2 Healthcore, Incorporated: Wilmington, Delaware 3 Division on Health Care Quality and Outcomes, Assistant Secretary for Planning and Evaluation,
U.S. Department of Health and Human Services: Washington, D.C. and the University of Minnesota
4 North Memorial Hospital: Robbinsdale, Minnesota
5 Simmons College: Boston, Massachusetts 6 Centers for Medicare and Medicaid Services: Baltimore, Maryland
Acknowledgment This work was completed under Medicare/Medicaid Research and Demonstration Task Order Contract (MRAD/TOC) HHSM-500-2005-000271 Task Order 0004. Project Officer: Craig Caplan.
54
The Medicare Physician Quality Reporting System (PQRS): Quality Measurement and Beneficiary Attribution
Abstract The purpose of this paper is to present data on physician participation in Medicare’s Physician Quality Reporting System (PQRS) and to explore the potential for PQRS reporting to provide a basis for attributing the cost and quality of care of Medicare beneficiaries to specific physicians. Using data from five states for the years 2008 (the first full year of the program) and 2009, we examined the number and type of physicians who are reporting PQRS measures and the types of measures that are reported. PQRS reporting is increasing rapidly for all types of physicians. Practitioner assistants have the highest participation rates, but most of the reports are submitted by medical specialists. We compared the PQRS reporting physician to the physician who provided the plurality of the beneficiary’s non-hospital evaluation and management (NH-E&M) visits. Although PQRS reporting physicians provide only 17 percent of the beneficiary’s NH-E&M visits in 2009, the physician who provided the plurality of visits provided only 50 percent of such visits. PQRS-reporting alone cannot solve the essential problem of attribution in FFS Medicare, but as PQRS participation increases, it could help improve both attribution and the quality of health care services delivered to Medicare beneficiaries.
I. Introduction Under the Patient Protection and Affordable Care Act of 2010 (abbreviated ACA), the
Medicare program is required to incorporate measures of “value” into the payment systems for health care providers including physicians and hospitals in traditional fee-for-service (FFS) Medicare. Considerable progress has been made in recent years developing measures of health care quality that are computable from claims data. Examples are appropriate screening, performance of monitoring tests for the chronically ill, preventable emergency department visits, hospitalizations and readmissions. However, many quality measures, including many measures of health outcomes and functional status are not claims-computable, nor are many process measures of quality for which physicians cannot submit a bill.
In mid-2007 physicians were given the opportunity to report a new set of quality measures for Medicare beneficiaries under the Centers for Medicare and Medicaid Services (CMS) Physician Quality Reporting System or PQRS.1
We analyze data from the first two full years of PQRS reporting (2008 and 2009) in five states to address the following questions:
These measures include both process quality measures and outcome measures such as the patient’s blood pressure and HbA1c level. Although PRRS participation currently is voluntary, it provides a model of what could be done on a larger universal basis.
1. What types of physicians report PQRS measures?
2. What types of measures do they report?
3. What are the trends in reporting from 2008 to 2009?
1 Note that, when first introduced, PQRS was termed the Physician Quality Reporting Initiative, a name that was changed in 2011 to Physician Quality Reporting System. For simplicity, we will use PQRS refer to both versions throughout this report.
55
We also discuss the possibility of using PQRS reporting as the basis for attributing care to specific physicians, asking: 1. Are multiple physicians reporting on the same beneficiary? 2. Are physicians selectively reporting on beneficiaries?
3. What percent of their primary care do PQRS-reported beneficiaries receive from the PQRS-reporting physicians?
4. How does the PQRS reporting physician compare to the physician seen most frequently by the beneficiary?
II. The PQRS system
Recent efforts for greater accountability in the U.S. healthcare system include increased collection, and in some cases public dissemination, of data on health care quality at the health plan, hospital and physician level (McIntyre, Rogers and Heier, 2001).
Early quality reporting efforts included hospital-specific mortality data reported by CMS (Daley, et al., 1988), and the Healthcare Effectiveness Data and Information Set (HEDIS) for beneficiaries enrolled in private health plans in Medicare. CMS has expanded quality reporting to include the Outcome and Assessment Information Set (OASIS) system for home health2 and the Minimum Data Set (MDS) system for nursing homes.3 Quality reporting systems at the individual physician level have been slower to develop. New York State published data on mortality rates for cardiovascular surgeons (Mukamel and Mushlin, 1998) and those data currently are available for eight states.4
Until recently, information on the quality of health care services at the individual physician level in the Medicare program was limited to measures based on administrative claims data.
5 The 2006 Tax Relief and Health Care Act (TRHCA) (P.L. 109-432) authorized CMS to establish the PQRS, which enables physicians and other eligible “professionals”6
The PQRS measures are developed and approved by organizations such as the National Quality Form (NQF) and National Committee for Quality Assurance (NCQA).
to report additional data on health care quality and health outcomes beyond the measures available in traditional administrative (e.g., claims) data. The reporting system is voluntary. The first reporting period was the second half of 2007 (CMS, 2008a).
7
• Diabetes Mellitus: Hemoglobin A1c Poor Control in Diabetes Mellitus. Developed by the NCQA. A patient aged 18 through 75 years with diabetes mellitus whose most recent hemoglobin A1c was greater than nine percent.
Examples include:
2 http://www.cms.hhs.gov/OASIS/02_Background.asp#TopOfPage 3 http://www.cms.hhs.gov/NursingHomeQualityInits/01_Overview.asp#TopOfPage 4 http://www.healthcarechoices.org/profile.htm 5 The material that follows in this section is taken from the CMS website http:/www.cms.hhs.gov/pqri/ 6 Throughout the paper we use the term “ physician” to refer to the reporting unit, but “eligible professionals” include Doctor of Medicine, Doctor of Osteopathy, Doctor of Podiatric Medicine, Doctor of Optometry, Doctor of Oral Surgery, Doctor of Dental Medicine, Doctor of Chiropractic, Physician Assistant, Nurse Practitioner, Clinical Nurse Specialist, Certified Registered Nurse Anesthetist (and Anesthesiologist Assistant), Certified Nurse Midwife, Clinical Social Worker, Clinical Psychologist, Registered Dietician, Nutrition Professional, Audiologists (as of 1/1/2009), Physical Therapist, Occupational Therapist, Qualified Speech-Language Therapist (as of 7/1/2009). (http://www.cms.hhs.gov/PQRI/Downloads/EligibleProfessionals.pdf) 7 A list of the 267 measures for 2012 can be found at http://www.cms.gov/PQRS/15_MeasuresCodes.asp#TopOfPage
• Coronary Artery Disease (CAD): Oral Antiplatelet Therapy Prescribed for Patients with CAD. Developed by the American Medical Association-sponsored Physician Consortium on Performance Improvement. A patient aged 18 years and older with a diagnosis of CAD who was prescribed oral antiplatelet therapy.
These examples illustrate that the PQRS quality measures address both process and health outcomes. Some measures (e.g., the diabetes measure, above) represent undesirable outcomes, while others (e.g., the CAD measure, above) represent desirable outcomes. New measures are added each year and measures from previous years occasionally are deleted.
Currently, physicians earn an incentive payment simply for reporting PQRS measures. There are no rewards or penalties tied to the care described by the PQRS measures. In 2008, physicians who successfully completed the reporting requirements received an incentive payment equal to 1.5 percent of their total estimated Medicare Part B Physician Fee Schedule (PFS) allowed charges for covered professional services furnished during that same reporting period. The percentage was increased to 2 percent in 2009 and 2010. In 2011 the payment was reduced to one percent of the physician’s estimated Part B billings for professional services. From 2012 to 2014 the incentive payment is reduced further to 0.5 percent. Beginning in 2015, physicians will be subject to a 1.5 percent penalty for not reporting PQRS measures and the penalty increases to 2 percent from 2016 on. In order to earn an incentive payment, physicians must report on at least three quality measures and must report on at least eighty percent of the beneficiaries who were eligible for each measure.
Initially, PQRS measures were reported by individual physicians, but beginning in 2010, group practices had the option to report at the group level,8 with the same incentive award applied to the Part B allowed charges furnished by the group. In 2009, physicians could report PQRS measures in two different ways: through their Part B claims9
Attributing quality measures to physicians
or through a PQRS-qualified registry. Starting in 2010, practices also could report PQRS measures through electronic health records.
As CMS and other payers move towards value-based purchasing, it becomes necessary to link quality measures to specific physicians and practices. There is little point in developing elaborate measures of health care quality unless the care that beneficiaries receive (or fail to receive) can be attributed to a particular health care provider or set of providers. There are several types of attribution systems currently in use. In ex ante systems, the physicians know in advance which beneficiaries will be attributed to their practices, whereas in ex post systems, beneficiaries are assigned to physicians at the end of a reporting period. In active attribution systems, the physician and patient agree that the beneficiary’s care will be attributed to the specific physician, whereas in passive attribution systems, beneficiaries are assigned to physicians without either the beneficiary’s or physician’s consent. Assigning beneficiaries to the physician who provided the plurality of the beneficiary’s non-hospital E&M visits is an example of an ex post, passive attribution system.
8 Individual physician’s can choose to report either as individuals or part of a group practice, but not both. For further information on group practice reporting, see: http://www.cms.hhs.gov/PQRI/22_Group_Practice_Reporting_Option.asp. 9 An example of a Part B claim with a PQRS report can be found in the Implementation Guide at: https://www.cms.gov/PQRS/03_How_To_Get_Started.asp#TopOfPage.
The United Kingdom’s National Health Service is an example of an active, ex ante system, with efforts to link quality of care to payments (Roland, 2004). Examples of passive ex post attribution include the CMS Medicare Physician Group Practice Demonstration (CMS, 2009) and the CMS Resource Use Report initiative (CMS, 2008b).
Active, ex ante attribution is difficult in the traditional FFS Medicare program because beneficiaries are not restricted in their choice of physicians. The structure of the program invites uncoordinated care. But because PQRS reporting is physician-initiated, it has the potential to serve as a model for an active attribution system. In its current form, PQRS reporting is somewhat ex post, because physicians can decide whether or not to submit PQRS reports on specific measures and thus, to a degree, specific beneficiaries. An important question addressed in this analysis is whether physicians selectively choose beneficiaries on whom to report.
Physicians differ in the types of patients they treat and the settings in which they provide care. Some physicians treat patients primarily in inpatient settings, while others provide primary care in outpatient settings. The PQRS system includes measures that are applicable to both inpatient and outpatient care, and thus PQRS reporting has the potential to serve as the basis for attribution for both types of physicians.
There are many possible attribution rules. For example, the care of Medicare beneficiaries could be attributed to the physician from whom the beneficiary obtained most of her office visits or largest dollar volume of her Medicare claims (a plurality rule). Alternatively, every physician who submitted a bill for a beneficiary could be assigned a part of the responsibility for the beneficiary’s cost and quality of care based on the proportion of dollars or visits attributable to each physician (a proportionate rule). Mehrotra, et al. (2010) compared eleven different attribution algorithms and found that assignment of physicians to cost categories is sensitive to the choice of algorithm. In our analysis, we compare two methods of assigning beneficiaries to physicians: (1) the physician who accounted for the plurality of the beneficiary’s non-hospital evaluation and management (NH-E&M) visits; and (2) beneficiaries on whom the physician reported a PQRS measure.
III. Data and results
Our analysis is based on a 100 percent sample of 2008 and 2009 Medicare claims data from five states: California, Colorado, New Jersey, North Dakota, and Florida. The states were chosen by CMS for use in a larger analysis of Medicare physician payment policy and represent a mix of regions, average levels of utilization and cost and urbanicity.
We obtained PQRS data directly from the Part B claims submitted by physicians, rather than from registry data. The registry data were deemed by CMS to be less reliable during 2008 and we excluded registry data in 2009 to maintain consistency across the two years’ results.
Throughout this analysis we refer to the entities that report PQRS measures as “physicians.” In fact, PQRS data are reported by national provider identifiers or NPIs, which might represent anything from a cardiovascular surgeon to a nurse practitioner, a clinical lab or a grocery store (e.g., an in-store clinic). For claims payment purposes, including the PQRS incentive payments, NPIs are grouped into TINs (tax identification numbers). The mapping of NPIs into TINs is not necessarily unique. An individual NPI can bill under more than one TIN. In this analysis we report our results by NPI rather than TIN, because the PQRS measures are reported at the NPI level.
In some analyses, it is helpful to characterize a “visit” to a physician. However, claims data, and thus PQRS reports represent “services” rather than “visits,” per se. In order to apply the “plurality of NH-E&M visits attribution rule, we aggregated claims into visits using the rule that all claims with the same dates of service made to the same provider constituted one visit.
58
A. Descriptive analysis
Table 1 shows the percent of physicians who submitted PQRS reports in 2008 and 2009. Physicians were classified into four categories (primary care, medical specialist, surgical specialist, and practitioner assistant) based on the specialty codes in claims data. (The number of NPIs falling outside these categories was less than 0.01 percent in both 2008 and 2009.) Practitioner assistants had the highest participation rates in both years, but the percentage of physicians filing PQRS reports increased substantially in all four groups, particularly among primary care physicians (and surgeons).
59
Table 1: Percent of NPIs filing at least one PQRS report
Type of NPI
Percent of all NPIs reporting a PQRS
measure: 2008
Percent of PQRS-reporting NPIs by type of
physician: 2009
Primary care 9.0 22.3 Medical specialist 16.0 23.9 Surgical specialist 6.8 14.8 Practitioner assistant 20.3 29.0 Total 13.8 23.0
Table 2 shows that medical specialists accounted for the majority of PQRS reports in both 2008 and 2009. However, primary care physicians10
Table 2: Percent of all PQRS reporting NPIs by type of physician
increased their percentage of all reports by seven percentage points from 2008 to 2009. A table showing greater detail on the types of physicians reporting PQRS measures can be found in the Appendix.
Type of NPI Percent of PQRS-reporting NPIs by type of physician: 2008
Percent of PQRS-reporting NPIs by type of physician: 2009
Primary care 14.0 21.0 Medical specialist 67.0 59.1 Surgical specialist 5.9 7.7 Practitioner assistant 13.1 12.2
Total percent 100.0 100.0 Total number of PQRS-reporting NPIs
24,154 40,428
Table 3 shows the fifteen most frequently reported non-hospital PQRS measures cross-tabulated by the type of provider.
10 Primary care providers include: general practice, family practice and internal medicine. Medical specialists include: allergy/immunology, otolaryngology, anesthesiology, cardiology, dermatology, interventional pain management, gastroenterology, osteopathic manipulative therapy, neurology, ophthalmology, pathology, physical medicine and rehabilitation, psychiatry, pulmonary disease, diagnostic radiology, chiropractic, nuclear medicine, nephrology, optometry, infectious disease, endocrinology, podiatry, psychologist, audiologist, physical therapist, rheumatology, occupational therapist, registered dietician, pain management, addiction medicine licensed clinical social worker, critical care, hematology, hematology/oncology, preventive medicine, neuropsychiatry, radiation oncology, emergency medicine, interventional radiology, optician, gynecologist/oncologist, and medical oncology. Surgical specialists include: general surgery, obstetrics gynecology, oral surgery, orthopedic surgery, plastic and reconstructive surgery, colorectal surgery, thoracic surgery, urology, hand surgery, peripheral vascular disease, vascular surgery, cardiac surgery, maxillofacial surgery, and surgical oncology. Practitioner assistants include: anesthesiologist assistance, certified nurse midwife, CRNA, clinical laboratory, certified clinical nurse specialist, physician assistant, and nurse practitioner.
60
61
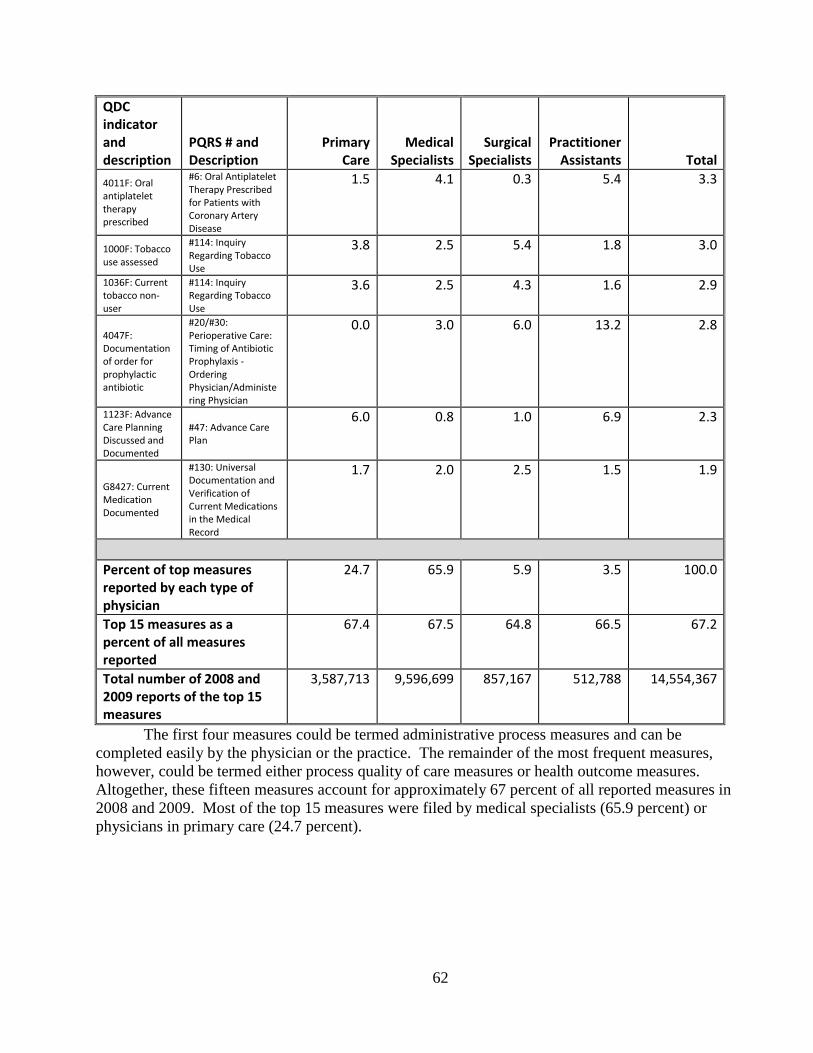
Table 3: Most frequently reported PQRS Quality Data Codes (QDC) in 2008 and 2009 and Percent of PQRS Reports Filed By Each Type of Physician
QDC indicator and description
PQRS # and Description
Primary Care
Medical Specialists
Surgical Specialists
Practitioner Assistants Total
G8445: No prescriptions were generated during encounter
#125: HIT - Adoption/Use of e-Prescribing
37.6 35.7 50.5 19.3 36.4
G8447: Patient encounter was documented using a CCHIT certified EMR
#124: HIT - Adoption/Use of Health Information Technology (Electronic Health Records)
10.0 8.8 12.3 7.9 9.3
G8446: Some or all prescriptions generated during encounter were handwritten or phoned in
#125: HIT - Adoption/Use of e-Prescribing
17.0 5.5 7.5 6.4 8.5
G8443: All prescriptions created during encounter were generated using a qualified e-Prescribing system
#125: HIT - Adoption/Use of e-Prescribing
16.8 5.1 5.6 5.2 8.0
2027F: Optic nerve head evaluation performed
#12: Primary Open Angle Glaucoma: Optic Nerve Evaluation
1123F: Advance Care Planning Discussed and Documented
#47: Advance Care Plan
6.0 0.8 1.0 6.9 2.3
G8427: Current Medication Documented
#130: Universal Documentation and Verification of Current Medications in the Medical Record
1.7 2.0 2.5 1.5 1.9
Percent of top measures reported by each type of physician
24.7 65.9 5.9 3.5 100.0
Top 15 measures as a percent of all measures reported
67.4 67.5 64.8 66.5 67.2
Total number of 2008 and 2009 reports of the top 15 measures
3,587,713 9,596,699 857,167 512,788 14,554,367
The first four measures could be termed administrative process measures and can be completed easily by the physician or the practice. The remainder of the most frequent measures, however, could be termed either process quality of care measures or health outcome measures. Altogether, these fifteen measures account for approximately 67 percent of all reported measures in 2008 and 2009. Most of the top 15 measures were filed by medical specialists (65.9 percent) or physicians in primary care (24.7 percent).
63
B. PQRS reporting as an attribution algorithm
As noted earlier, reporting a PQRS quality measure on a beneficiary could be interpreted as an indication that the physician is willing to take responsibility for at least one aspect of the beneficiary’s care. In this section we examine questions related to PQRS as a potential basis for beneficiary attribution.
The first question is whether there is a one-to-one relationship between a physician and a beneficiary with a PQRS report or whether multiple physicians are reporting on the same beneficiary.
Table 4: Number of different NPIs submitting PQRS reports on the same beneficiary
Number of NPIs submitting a PQRS report on the same beneficiary 2008
(Percent) 2009
(Percent) 1 73.4 52.8 2 18.0 25.1 3 5.4 11.6 4 1.9 5.4 5 or more 1.3 5.1
Total Percent 100.0 100.0 Total number of beneficiaries 1,213,249 2,906,515 Average Number of NPIs 1.41 1.90
Note: The unit of analysis is the beneficiary. Table 4 shows that the percentage of beneficiaries receiving PQRS reports from multiple
physicians increased from 2008 to 2009. Overall, 53 percent of all beneficiaries who had a PQRS report in both 2008 and 2009 had at least one report from the same NPI in both years (data not shown). Based on this short time trend, it appears that PQRS reporting, like many other attribution rules such as proportional attribution, will not provide unique pairings of beneficiaries and physicians. However, PQRS reporting remains an active attribution method on the part of the physician and thus still could be a useful way to assign the same beneficiary to multiple physicians.
Next we examine whether physicians selectively are reporting on some beneficiaries and not others. Table 5 compares the age, sex and Hierarchical Condition Category (HCC) risk scores11
Table 5: Comparison of PQRS reported and non-reported beneficiaries: 2008 and 2009
of reported beneficiaries to beneficiaries who saw PQRS reporting providers but on whom no PQRS measure was submitted. The results show that reported beneficiaries were slightly older and more likely to male. They also were less likely to be non-white and dual eligible.
Variable
2008: Non-reported beneficiaries
2008: Reported
beneficiaries
Difference
2009: Non-reported beneficiaries
2009: Reported
beneficiaries Difference Age (years) 74.83 76.55 1.72 75.12 76.00 0.87 Male (percent) 41.19 42.70 1.52 41.91 40.93 -0.98
Non-White 15.18 13.84 -1.34 15.27 13.40 -1.87
11 The HCC risk scores are used to adjust payments to private health plans (Medicare Advantage) contracting with the Medicare program.
Note: All differences are statistically significant at the 0.05 minimum with the exception of the CHF and stroke HCC scores in 2009.
One would expect the sample of beneficiaries on whom a report is filed to be in worse health, on average, than non-reported beneficiaries because many PQRS measures are appropriate only for beneficiaries who have a chronic health condition. The data on HCC risk scores in Table 5 shows that is indeed the case. Both the overall HCC risk score and the disease-specific scores are uniformly higher for reported than non-reported beneficiaries.
We compared PQRS-reporting to another popular attribution rule: the physician providing the plurality of non-hospital evaluation and management visits to the beneficiary, which we refer to as the “plurality rule.” The plurality rule results in the assignment of a beneficiary to one and only one physician in contrast to a proportionate assignment rule that allocates performance measures to all the physicians who treated the patients based on the proportion of the beneficiary’s total billings or visits from each physician.
Our first comparison is the percent of a beneficiary’s NH-E&M visits provided by the PQRS-reporting NPI versus the plurality NPI (Table 6). The percent of NH-E&M visits provided by the plurality NPI is virtually certain to be higher than the percent provided by the PQRS-reporting NPI, but the former provides a useful benchmark percentage for FFS Medicare beneficiaries.
65
Table 6: Average percent of visits by type of NPI provided by the PQRS-reporting and plurality NPIs, with attribution overlap – 2008 and 2009
2008: primary
care
2008: medical
specialist
2008: surgical
specialist
2008: practitioner
assistant Total
2009: primary
care
2009: medical
specialist
2009: surgical
specialist
2009: practitioner
assistant Total Average percent of NH-E&M visits provided by the PQRS-reporting NPI 28.4 7.9 15.4 6.9 10.9 38.9 11.1 17.7 8.8 17.0 Number of beneficiary/PQRS NPI combinations 219,556 1,323,682 85,401 85,731 1,714,370 1,110,993 3,792,557 387,436 235,768 5,526,754 Average percent of NH-E&M visits provided by the plurality NPI 59.3 41.5 47.3 42.9 50.5 58.6 40.9 46.7 43.2 50.0 Number of beneficiary/plurality NPI combinations 3,584,333 3,113,751 646,006 219,101 7,563,191 3,495,845 2,957,612 622,020 237,334 7,312,811 Overlap of PQRS and plurality NPI (percent) 50.2 24.9 33.6 16.1 28.2 55.0 26.4 26.7 12.7 31.5
66
The unit of analysis in Table 6 is a beneficiary-NPI combination, because the beneficiary could have received a PQRS report or NH-E&M visits from more than one physician. Overall, the PQRS-reporting physician (NPI) provided 10.9 percent of NH-E&M visits for their attributed beneficiaries in 2008 and 17.0 in 2009. The highest percentage in 2009 was for primary care physicians (38.9 percent) and the lowest was for practitioner assistants (8.8 percent). Interestingly, only about half of all NH-E&M visits are provided by the plurality NPI in both 2008 and 2009, reflecting the diversity of physicians that Medicare beneficiaries see for their basic care.
For some beneficiaries the PQRS report is the only information submitted by a physician on a beneficiary. For example, in results not shown in Table 6, we found that 31 percent of beneficiaries with a PQRS report from a primary care physician had no other NH-E&M visits to that physician in 2008.
The last row in Table 6 shows the overlap of PQRS reporting with the plurality assignment rule. For primary care physicians, 50.2 percent of the beneficiaries on whom the physician reported a PQRS measures also saw that physician for the plurality of their NH-E&M visits. That percentage increases for primary care and medical specialists in 2009 versus 2008, but decreases for surgical specialists and practitioner assistants.
We also examined the total number of NPIs who would have attributed beneficiaries under the PQRS and plurality of NH-E&M visits rules. We found that in 2008, 80.5 percent of NPIs would have attributed beneficiaries under plurality of NH-E&M visits rule versus only 13.8 percent under PQRS-based attribution.12
IV. Conclusions
The same percentages for 2009 were 80.7 percent for the plurality rule and 23.0 percent for PQRS-based attribution. Thus, if the attribution rule is to be used to profile physicians for payment purposes, the plurality rule currently covers far more physicians than PQRS-reporting.
The PQRS system represents an important intervention that has the potential to improve the quantity and quality of data on the health care services that are provided to Medicare beneficiaries. The measures were developed and endorsed by national organizations. Many of the PQRS measures are not computable from administrative data. If PQRS reporting expands in the future, its effect likely will extend beyond FFS Medicare, because commercial insurers have been quick to adopt other successful innovations in the Medicare program such as prospective hospital payment and relative-value-based physician reimbursement.
At this point, the PQRS system still is in its infancy. Participation was limited in 2008, the first full year of the program but increased from 13.8 to 23.0 percent of physicians (NPIs) from 2008 to 2009 in our five state samples. In 2008, medical specialists were the most frequent reporters, but the percentage of reporters who were primary care physicians increased seven percentage points from 2008 to 2009. Currently, the most frequently reported measures are “administrative” process measures involving health information technology and e-prescribing, but a number of process quality and health outcome measures also are found in the fifteen most frequently reported measures.
Currently, there does not seem to be strong evidence of physician’s “cherry-picking” patients on which to report PQRS measures, though that issue bears close monitoring in the future. As expected, HCC risk scores generally are higher for reported beneficiaries than non-reported beneficiaries.
12 The latter percentage is shown in Table 1.
67
Even in 2009, the PQRS reporting physician provided only 17 percent of the beneficiary’s NH-E&M visits. However, that low percentage must be kept in perspective, as only half of the beneficiary’s NH-E&M visits were provided by the physician who provided the plurality of such visits to the beneficiary.
PQRS-based attribution alone cannot solve the essential problem of attribution in FFS Medicare. In a health insurance plan like FFS Medicare, all attribution systems represent an attempt to impose some type of responsibility structure on an uncoordinated care system in which no physician is held accountable for the beneficiary’s overall care.
It would be a mistake to draw any firm conclusions regarding either problems or opportunities represented by the PQRS system at this point. Taking the longer view, it is important to appreciate the accomplishment of having 267 consensus-based quality measures available for reporting at the individual physician level in 2012.
An attribution system that incorporated PQRS reporting would have the advantage of being an active (physician/patient-initiated) attribution system and could evolve into a true active, ex ante system in which the physician takes responsibility for a beneficiary’s care at the beginning of a reporting period. PQRS-based attribution will require much higher levels of participation than the 23 percent we found in 2009 data, but participation is likely to increase for physicians who see a substantial number of Medicare beneficiaries when the reward for participation converts to a penalty for non-participation in 2015. Incorporating PQRS results into physician payment reform in Medicare also would spur participation. Any attempt to improve the quality of health care services in the U.S. requires data on quality, and PQRS reporting is an important step in that direction.
68
V. References
Billings, John, Parikh, Nina, and Tod Mijanovich. “Emergency room use: the New York story.” Issue Brief: Commonwealth Fund. Number 434 (November 2000) 1–12.
Bindman, Andrew B., Grumbach, Kevin, Osmond, Dennis, Komaromy, Miriam, Vranizan, Karen, Lurie, Nicole, Billings, John and Anita Stewart. “Preventable Hospitalizations and Access to Health Care.” Journal of the American Medical Association. 275:4 (1994) 305-311.
Centers for Medicare and Medicaid Services (CMS). “PGP Fact Sheet.” https://www.cms.gov/DemoProjectsEvalRpts/downloads/PGP_Fact_Sheet.pdf (2009).
Centers for Medicare and Medicaid Services (CMS). Physician Quality Reporting Initiative: 2007 Reporting Experience. Department of Health and Human Services: Washington, D.C. (December 3, 2008a). http://www1.cms.gov/PQRI/Downloads/PQRI2007ReportFinal12032008CSG.pdf
Centers for Medicare and Medicaid Services (CMS). “CMS’ Progress Toward Implementing Physician Resource Use Reports,” www.acc.org/.../CMS_PRU%20ACC%202008-10-30_CMS.ppt (2008b).
Daley, Jennifer, Jencks, Stephen, Draper, David, Lenhart, Gregory, Thomas, Neal, and Janice Walker. “Predicting Hospital-Associated Mortality for Medicare Patients: A Method for Patients With Stroke, Pneumonia, Acute Myocardial Infarction, and Congestive Heart Failure.” Journal of the American Medical Association. 260:24 (1988) 3617-3624.
McIntyre, Dennis, Rogers, Lise and Ellen Jo Heier. “Overview, History, and Objectives of Performance Measurement.” Health Care Financing Review. 22:3 (Spring 2001) 7-22.
Mehrotra, Ateev, Adams, John L., Thomas, William and Elizabeth Mcglynn. “The Effect of Different Attribution Rules on Individual Physician Cost Profiles,” Annals of Internal Medicine 152 (2010) 649-654.
Mukamel, Dana B. and Alvin I. Mushlin. “Quality of Care Information Makes a Difference: An Analysis of Market Share and Price Changes After Publication of New York State Cardiac Surgery Mortality Reports.” Medical Care. 36:7 (1998) 945-954.
Roland, Martin. “Linking Physicians’ Pay to the Quality of Care — A Major Experiment in the United Kingdom.” New England Journal of Medicine. 351:14 (September 30, 2004) 1448-1454.
(Percent) Emergency medicine MS 20.91 13.41 Internal medicine PC 7.45 11.00 Anesthesiology MS 11.30 9.18 Family practice PC 5.33 8.76 Diagnostic radiology MS 6.65 5.43 Physician assistant PA 5.05 4.53 Ophthalmology MS 4.82 4.43 Cardiology MS 2.96 4.24 CRNA PA 5.31 3.81 Nurse practitioner PA 2.55 3.73 Optometry MS 2.96 2.57 Physical therapist MS 4.08 2.41 Orthopedic surgery SS 1.40 2.13 Pathology MS 3.05 2.05 Dermatology MS 0.28 1.66 Obstetrics/gynecology SS 0.41 1.53 Hematology/oncology MS 1.54 1.44 Gastroenterology MS 0.48 1.40 General surgery SS 1.35 1.30 Urology SS 1.12 1.28 Pulmonary disease MS 0.61 1.12 Neurology MS 0.63 1.11 Podiatry MS 0.26 1.07 Other 13.95 17.64 Total 100.00 100.00
13 PC=Primary care; MS = Medical specialty; SS = surgical specialty; PA = physician assistant
70
APPENDIX 13 USING AVOIDABLE EMERGENCY DEPARTMENT (ED) VISITS AS A
PERFORMANCE MEASURE FOR MEDICARE PHYSICIANS’ PRACTICES
71
Using Avoidable Emergency Department (ED) Visits as a Performance Measure for Medicare Physicians’ Practices
Medicare/Medicaid Research and Demonstration Task Order Contract (MRAD/TOC)
HHSM-500-2005-00027I, T.O. 4 University of Minnesota14
May 16, 2011
I. Background A. Introduction Visits to the emergency department (ED) are extremely costly and, because some of them
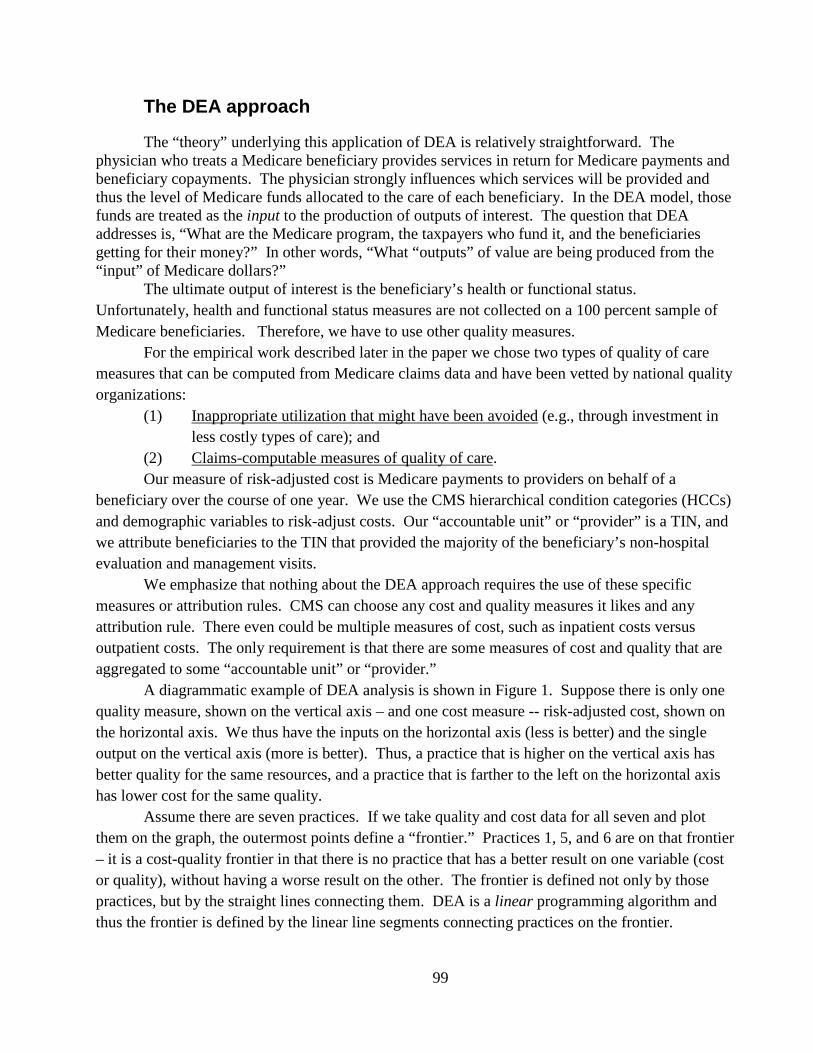
potentially are avoidable, ED visits also may be indicative of poor care management. Billings, et al. (2000) developed an algorithm15
In this report, we explain how the Billings algorithm works, and we apply it to individual physician practices (represented by tax identification numbers or TINs). We then present illustrative data from one year in one state, using three different rules to attribute beneficiaries to TINs. The discussion is limited to the Billings algorithm itself. We do not conduct empirical analyses of other important issues including risk-adjusting quality measures, the year-to-year stability of the measure, the predictive accuracy of the measure (e.g., shrinkage estimators) or its importance relative to other performance measures. Those topics are discussed in other reports associated with this project.
to analyze ED visits and assign probabilities that the visit falls into several categories of appropriateness. The algorithm has been used to assess the appropriateness of ED visits at the community or facility level, but to our knowledge has not been applied previously to individual physicians or physician practices.
B. How the Billings algorithm works Each ED visit has at least one diagnosis code, but may have multiple diagnosis codes.16
I. Non-emergent – Cases where immediate care is not required within 12 hours.
Based on clinical judgment, the Billings algorithm takes each of 640 diagnosis codes and assigns probabilities to the following four categories of appropriateness of the ED:
II. Emergent – primary care treatable – Care is needed within 12 hours, but care could be provided in a typical primary care setting.
III. Emergent – ED care needed, but preventable /avoidable – Immediate care in an ED setting is needed, but the condition potentially could have been prevented or avoided with timely and effective ambulatory care.
IV . Emergent – ED care needed, and not preventable/avoidable – Immediate care in an ED setting is needed, and the condition could not have been prevented/avoided with ambulatory
14 Contributing authors in alphabetical order were Robert Coulam (Simmons College), Bryan Dowd, Robert Kane, Medha Karmarker, Dave Knutson, Shri Parashuram and Tami Swenson. 15 Downloaded from http://www.ahrq.gov/data/safetynet/toolsoft.htm May 2009. 16 We explain how multiple diagnoses were treated later in the text.
The probabilities across the four categories sum to 1.0 for any given diagnosis. Diagnoses with insufficient sample size were assigned by Billings, et al. to an “unclassified” category. In addition, there are diagnoses that fall under injuries, mental health, alcohol and substance abuse. Those diagnoses are relatively infrequent and are not assigned probabilities. In our analyses, they are excluded entirely from the performance measure calculations. The categories of appropriateness are shown diagrammatically in Figure 1.
73
Figure 1: Algorithm for Classifying Emergency Department Utilization, New York University-United Health Fund of New York
Some examples of diagnoses and probabilities assigned by the Billings algorithm are shown below. These probabilities were derived using New York City ED data. Discharge diagnoses were used to identify the classification of the visit. (More details are available at http://wagner.nyu.edu/chpsr/index.html?p=25.)
74
Table 1: Examples of diagnoses and associated appropriateness probabilities assigned by the Billings algorithm
Non-emergent
Emergent – primary care treatable
Emergent – ED care needed, but preventable /avoidable
Emergent – ED care needed, and not preventable / avoidable
Sum of probabilities
Acute myocardial infarction, not otherwise specified, initial (diagnosis code 410.91)
0.00 0.00 0.00 1.00 1.00
Angina pectoris NEC/NOs (diagnosis code 413.9)
0.00 0.00 1.00 0.00 1.00
Hypertension, not otherwise specified (diagnosis code 401.9)
0.61 0.17 0.21 0.00 1.00
Diabetic ketoacidosis (diagnosis code 250.1)
0.00 0.00 0.00 1.00 1.00
Carpal tunnel syndrome (diagnosis code 354.0)
1.00 0.00 0.00 0.00 1.00
We used Medicare inpatient and outpatient claims to identify emergency room visits and their accompanying diagnoses. Using only outpatient claims would have resulted in missed ED visits that resulted in a hospitalization.17
http://www.resdac.org/ddvh/NewFilesCodeRefLimiations/REV_CNTR_TB.htm We used the revenue codes recommended by ResDAC
( ) to identify emergency room claims. Claims with revenue codes 0450 (emergency room-general classification), 0451(emergency room-emtala emergency medical screening services, effective 10/96); 0452(emergency room-ER beyond emtala screening, effective 10/96); 0456 (emergency room-urgent care, effective 10/96); 0459 (emergency room-other); and 0981 (emergency room – professional fee) were designated as emergency room claims. Claims on the same day in the same site (all inpatient or all outpatient) were treated as a single visit, but if a beneficiary had both an inpatient ED claim and an outpatient ED claim on the same day, it was considered as two ED visits. Once a claim was identified as having an ED component, the diagnoses were taken from the claims data.
We applied the Billings algorithm to the ED visit’s diagnosis codes to determine the probabilities of each of the four types of appropriateness for each diagnosis. The diagnosis with the highest score for “emergent-ED care needed: not preventable/avoidable (injuries included)” was identified as the diagnosis for the remainder of the analysis. This approach minimized the likelihood that a TIN would be penalized for an ED visit that truly was appropriate. In case of ties, the diagnosis scoring highest for “emergent-ED care needed: preventable/avoidable,” “emergent-primary care treatable,” and “non-emergent,” in descending order, was used for the remainder of the analysis. Using the single diagnosis derived in this manner, each visit was assigned probabilities for each level of appropriateness. This approach generated four probability “scores” for each ED visit. For any single visit the scores (probabilities) sum to one. (See illustrative example, below.)
From these data, we developed two scores for each tax identification number (TIN): 1. The number of ED visits per beneficiary assigned to the TIN; and
17 We also attempted to identify ED visits by place-of-service codes in physcian/carrier data. Out of 8,773 beneficiaries with ED visits in any of the claims sets (physician/carrier, inpatient, outpatient), only 76 beneficiaries appeared only in physician/carrier data. We were concerned about the reliability of place-of-service codes to identify ED visits and thus relied exclusively on the inpatient and outpatient claims.
2. The four average scores per ED visit for the TIN. The first score is simply the total number of ED visits by beneficiaries assigned to the TIN
divided by the total number of beneficiaries assigned to the TIN. To arrive at the second set of scores, we added the probability scores in each category of appropriateness across all the beneficiaries assigned to the TIN and divided by the total number of ED visits by beneficiaries assigned to the TIN.
The Billings algorithm is diagnosis specific and the assignment of appropriateness is based on a single diagnosis, without considering the presence of additional diagnoses. In our application, the presence of an additional diagnosis that would have caused the visit to be rated more appropriate is not a problem because we chose the diagnosis that gave the visit the maximum probability of being rated appropriate. Thus, the potential problem is confined to the case in which multiple inappropriate diagnoses, when combined, could result in the visit being deemed appropriate. Examining this latter possibility is one of our recommendations at the end of this report. II. A simple numerical example
A simple numerical example will help to clarify our analysis of ED visits. Consider a single TIN with four beneficiaries attributed to it. Suppose that Beneficiary 1 has two ED visits (Visits A and B), Beneficiary 2 has one ED visit (Visit C) and Beneficiaries 3 and 4 have no ED visits during the observation period. Visits A and C have two diagnoses each, while visit B has only one diagnosis.
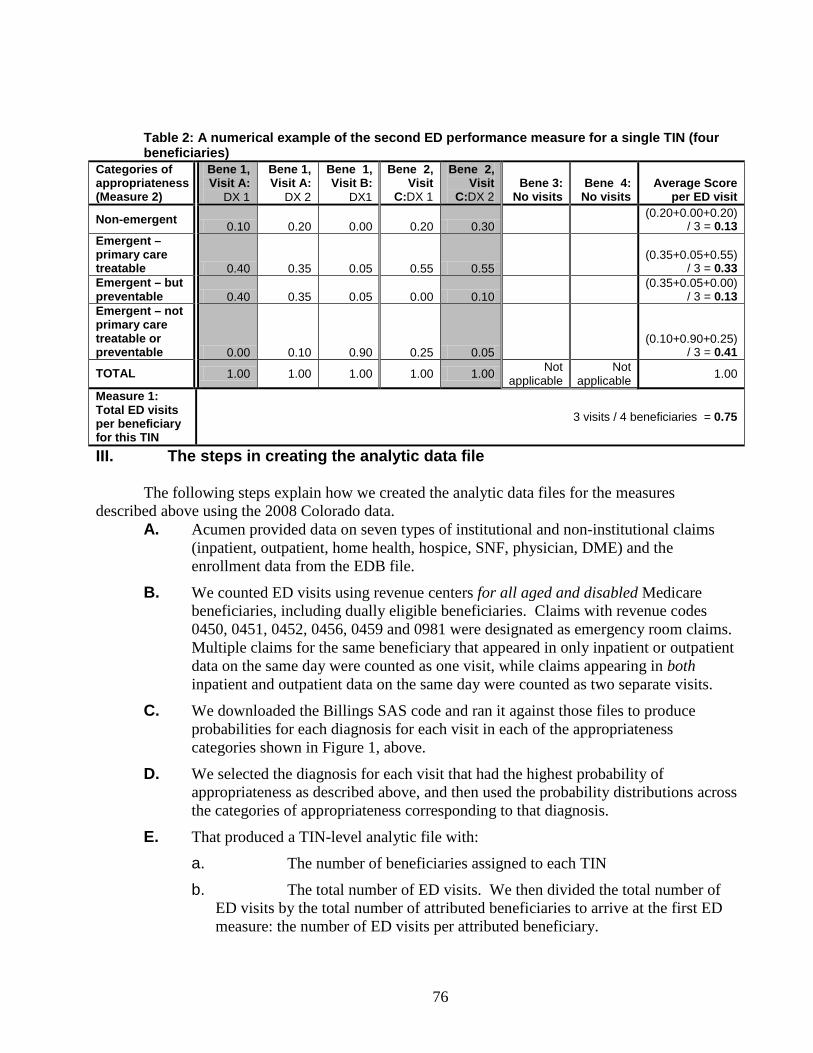
The first measure of ED use is calculated by dividing the three ED visits by Beneficiaries 1 and 2 by the total of four beneficiaries attributed to the practice. The result is 0.75 ED visits per beneficiary for this TIN. The following table shows how the second measure is calculated. First, Diagnosis 1 (DX 1) is eliminated for Visit A because Diagnosis 2 has a higher probability of “emergent – not primary care treatable or preventable.” Diagnosis 2 is eliminated for Visit C for the same reason. The eliminated diagnoses are shown by the shaded columns in the table. That leaves one diagnosis per visit on which the probabilities of the four categories of appropriateness for each visit are based. The probabilities for each visit are summed across the three visits and divided by three (visits) to obtain the average probability score for each category for that TIN, as shown in the far right-hand column.
76
Table 2: A numerical example of the second ED performance measure for a single TIN (four beneficiaries)
Emergent – but preventable 0.40 0.35 0.05 0.00 0.10
(0.35+0.05+0.00) / 3 = 0.13
Emergent – not primary care treatable or preventable 0.00 0.10 0.90 0.25 0.05
(0.10+0.90+0.25) / 3 = 0.41
TOTAL 1.00 1.00 1.00 1.00 1.00 Not applicable
Not applicable 1.00
Measure 1: Total ED visits per beneficiary for this TIN
3 visits / 4 beneficiaries = 0.75
III. The steps in creating the analytic data file
The following steps explain how we created the analytic data files for the measures described above using the 2008 Colorado data.
A. Acumen provided data on seven types of institutional and non-institutional claims (inpatient, outpatient, home health, hospice, SNF, physician, DME) and the enrollment data from the EDB file.
B. We counted ED visits using revenue centers for all aged and disabled Medicare beneficiaries, including dually eligible beneficiaries. Claims with revenue codes 0450, 0451, 0452, 0456, 0459 and 0981 were designated as emergency room claims. Multiple claims for the same beneficiary that appeared in only inpatient or outpatient data on the same day were counted as one visit, while claims appearing in both inpatient and outpatient data on the same day were counted as two separate visits.
C. We downloaded the Billings SAS code and ran it against those files to produce probabilities for each diagnosis for each visit in each of the appropriateness categories shown in Figure 1, above.
D. We selected the diagnosis for each visit that had the highest probability of appropriateness as described above, and then used the probability distributions across the categories of appropriateness corresponding to that diagnosis.
E. That produced a TIN-level analytic file with:
a. The number of beneficiaries assigned to each TIN
b. The total number of ED visits. We then divided the total number of ED visits by the total number of attributed beneficiaries to arrive at the first ED measure: the number of ED visits per attributed beneficiary.
77
c. The total probability score across all ED visits for each category of appropriateness. We then divided the total probability score for each category of appropriateness by the number of ED visits by beneficiaries attributed to the TIN to arrive at the second ED measure: the appropriateness of ED use conditional on having some ED use.
F. These two measures can be computed at the TIN level using any attribution algorithm. We tested three different attribution algorithms as described in the Appendix.
IV. Results from the 2008 Colorado data: ED visits using different methods of attribution We applied the methods described above to the 2008 Colorado data using three different
attribution rules: The three rules are: 1. Plurality of evaluation and management (E&M) visits; 2. Proportionate attribution based on the proportion of E&M visits (output not shown in
this draft); and 3. Full attribution of cost and quality to any TIN billing for the patient.
We explain the results under the first attribution rule – plurality of E&M visits. The interpretation is the same for the other two attribution rules. The results are discussed in the last section.
78
A. Attribution based on a plurality of E&M visits Table 3: Plurality attribution rule
Total attributed beneficiaries 257,198 Beneficiaries with ED visits 105,543 Total TINs 2,525 TINS having beneficiaries with ED visits 2,158 TINS having no beneficiaries with ED visits 367 Total ED visits 239,286
Figure 2: Measure 1: ED visits per attributed beneficiary per TIN {TINs with no ED visits per attributed beneficiary = 367} [Mean= 0.92, SEM=0.02, Range=0-16]
Figure 2 is a bar graph showing the distribution of ED visits attributed per beneficiary per
TIN. The graph is interpreted as follows: 1. The vertical axis measures the percent of TINs corresponding to each level of ED visits per
beneficiary.
2. The bar on the far left represents the 367 TINs with no ED visits.
3. There are some TINs on the far right with an extraordinary number of ED visits per beneficiary. These likely are TINS with a small number of attributed beneficiaries who made frequent use of the ED.
79
Figure 3: Measure 2: Score of [non emergent visits] per ED visit per TIN (TINs with score of 0= 316) [mean =0.17, SEM=0.003, Range=0-1]
Figure 3 is a bar graph showing the score of non emergent visits per ED visit per TIN. The
graph is interpreted as follows: 1. The vertical axis measures the percent of TINs corresponding
to each level (percentage) of non-emergent ED visits per ED visit (per TIN).
2. The bar on the far left represents the 316 TINs with no non-emergent ED visits.
3. The horizontal axis is the percent of ED visits that were non-emergent according to the Billings algorithm.
80
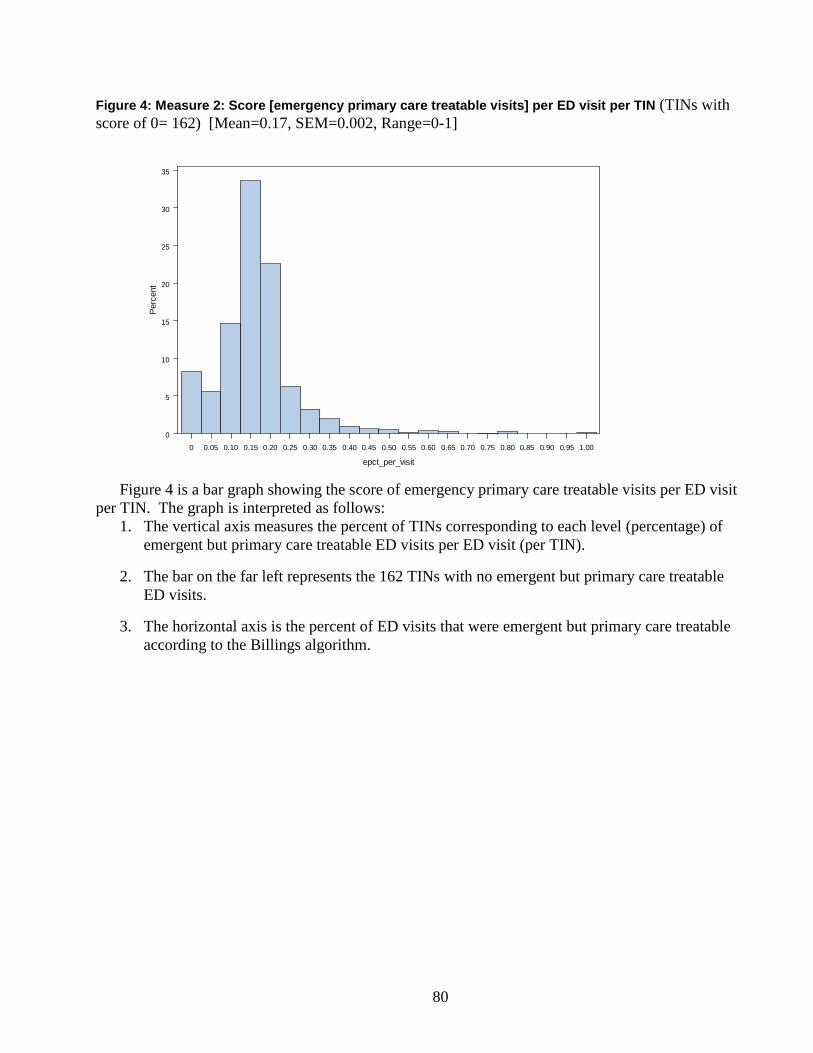
Figure 4: Measure 2: Score [emergency primary care treatable visits] per ED visit per TIN (TINs with score of 0= 162) [Mean=0.17, SEM=0.002, Range=0-1]
Figure 4 is a bar graph showing the score of emergency primary care treatable visits per ED visit
per TIN. The graph is interpreted as follows: 1. The vertical axis measures the percent of TINs corresponding to each level (percentage) of
emergent but primary care treatable ED visits per ED visit (per TIN).
2. The bar on the far left represents the 162 TINs with no emergent but primary care treatable ED visits.
3. The horizontal axis is the percent of ED visits that were emergent but primary care treatable according to the Billings algorithm.
81
Figure 5: Measure 2: Score [emergent care needed-preventable or avoidable visits] per ED visit per TIN (TINs with score of 0= 533) [Mean=0.08, SEM=0.002, Range=0-1]
Figure 5 is a bar graph showing the score of emergent care needed-preventable or avoidable
visits per ED visit per TIN. The graph is interpreted as follows: 1. The vertical axis measures the percent of TINs corresponding to each level (percentage) of
emergent but preventable/avoidable ED visits per ED visit (per TIN).
2. The bar on the far left represents the 533 TINs with no emergent but preventable/avoidable ED visits.
3. The horizontal axis is the percent of ED visits that were emergent but preventable/avoidable according to the Billings algorithm.
82
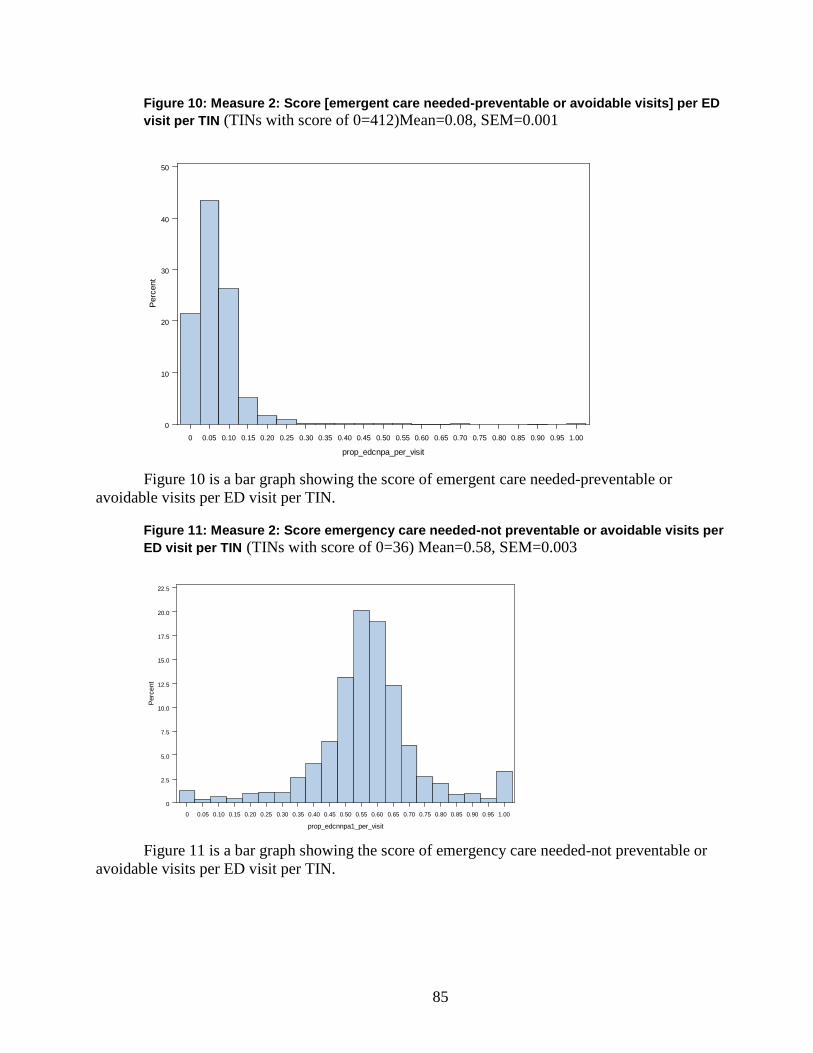
Figure 6: Measure: Score emergency care needed-not preventable or avoidable visits per ED visit per TIN (TINs with score of 0=39) [Mean= 0.58, SEM= 0.004, Range=0-1]
Figure 6 is a bar graph showing the score of emergency care needed-not preventable or
avoidable visits per ED visit per TIN. The graph is interpreted as follows:
1. The vertical axis measures the percent of TINs corresponding to each level (percentage) of emergent and not primary care treatable or preventable/avoidable ED visits per ED visit (per TIN)
2. The bar on the far left represents the 533 TINs with no emergent and not primary care treatable/avoidable ED visits.
3. The horizontal axis is the percent of ED visits that were emergent and not primary care treatable or preventable/avoidable according to the Billings algorithm.
83
B. Attribution based on the proportion of E&M visits
Table 4: Proportionate attribution rule Total attributable beneficiaries 257198 Beneficiaries with ED visits 105543 Total TINs 3095 TINS having beneficiaries with ED visits 2895 TINS having no beneficiaries with ED visits 200 Total ED visits 239386
Figure 7: Measure 1: ED visits per attributed beneficiary per TIN {TINs with no ED visits per
attributable beneficiaries are 200} [Mean=0.95, SEM=0.02]
Figure 10 is a bar graph showing the score of emergent care needed-preventable or
avoidable visits per ED visit per TIN.
Figure 11: Measure 2: Score emergency care needed-not preventable or avoidable visits per ED visit per TIN (TINs with score of 0=36) Mean=0.58, SEM=0.003
Figure 11 is a bar graph showing the score of emergency care needed-not preventable or
avoidable visits per ED visit per TIN.
86
C. Attribution based on any E&M bill for the patient Table 5: Attribution based on “any E&M bill”
Total attributed beneficiaries 257198 Beneficiaries with ED visits 105543 Total TINs 3095 TINS having beneficiaries with ED visits 2895 TINS having no beneficiaries with ED visits 200 Total ED visits 239286
Figure 12: Measure 1: ED visits per attributed beneficiary per TIN18 {TINs with no ED visits per attributed beneficiary are 200} [Mean= 1.23, SEM= 0.02, Range= 0.13-17.5]
Figure 12 is a bar graph showing the distribution of ED visits attributed per beneficiary per
TIN.
18 The “any bill” attribution rule (#3) is not useful for calculating ED visits per beneficiary because the same visit appears in the numerator of every TIN that billed an E&M visit for the beneficiary with no recognition of the proportion of E&M visits accounted for by the provider.
87
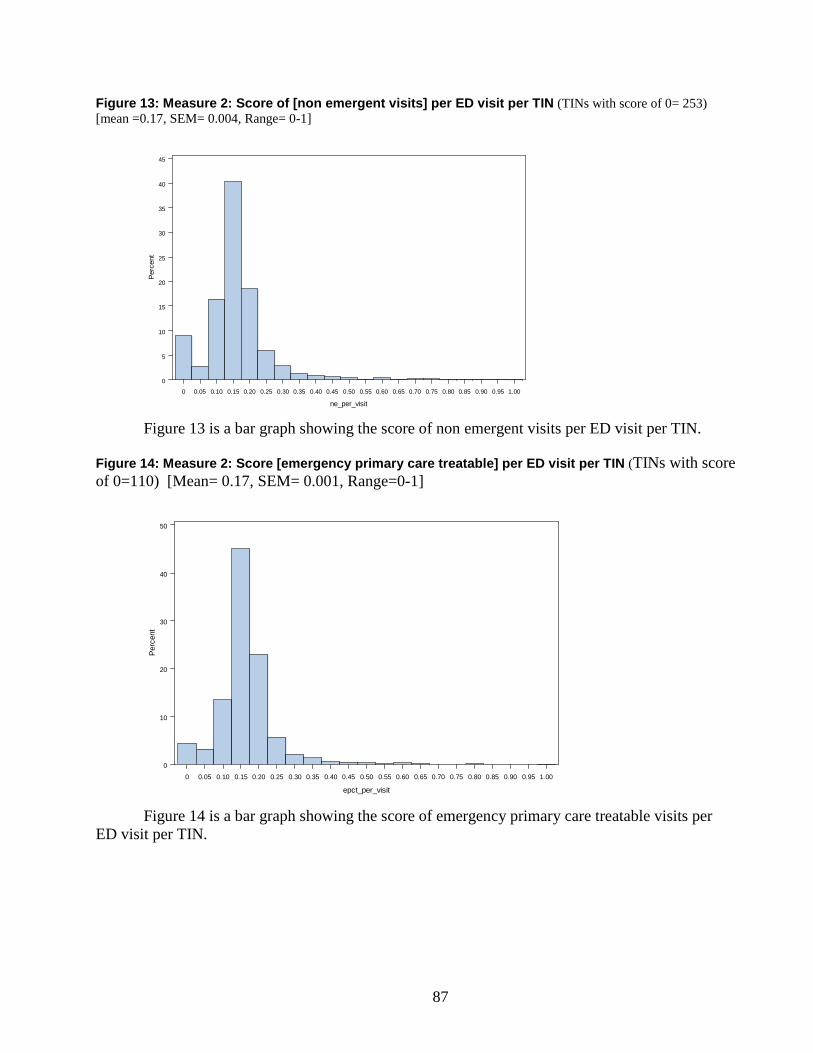
Figure 13: Measure 2: Score of [non emergent visits] per ED visit per TIN (TINs with score of 0= 253) [mean =0.17, SEM= 0.004, Range= 0-1]
Figure 14 is a bar graph showing the score of emergency primary care treatable visits per
ED visit per TIN.
88
Figure 15: Measure 2: Score [emergent care needed-preventable or avoidable visits] per ED visit per TIN (TINs with score of 0=412) [Mean= 0.08, SEM= 0.001, Range=0-1]
Figure 15 is a bar graph showing the score of emergent care needed-preventable or avoidable visits per ED visit per TIN. Figure 16: Measure 2: Score emergency care needed-not preventable or avoidable visits per ED visit
per TIN (TINs with score of 0=36) [Mean= 0.58, SEM=0.003, Range=0-1]
Figure 16 is a bar graph showing the score of emergency care needed-not preventable or
avoidable visits per ED visit per TIN.
89
V. Policy discussion A. Empirical results
1. General There were 257,198 beneficiaries represented in the 2008 Colorado data. Under the
“plurality of E&M visits” attribution rule, 2,525 TINs had some beneficiaries assigned to them. Under the proportionate and “any E&M bill” attribution rules, 3,095 TINs had some beneficiaries attributed to them. Thus, the plurality rule reduces the number of TINs that are profiled by about 18.4 percent from 3,095 to 2,525.
2. Measure 1: ED visits per attributed beneficiary
Although approximately 40 percent of the Medicare beneficiaries in our sample had no ED visits, the remainder made frequent use of emergency departments. Only about 6.5 percent of the TINs in the Colorado data had no beneficiaries with ED visits and the average number of ED visits per beneficiary was 0.92 under the plurality attribution rule, or almost one ED visit per attributed Colorado beneficiary in 2008.19
Is the number of ED visits per beneficiary a useful measure for a value-based modifier? Certainly many factors influence use of the ED that are beyond the physician’s control. Some market areas may have greater access to EDs or their close, but less expensive substitutes, e.g., urgent care clinics. Although a single physician might not be able to affect the market-wide supply of those lower cost alternatives to the ED, including ED visits in a value-based modifier might give the physician community an incentive to press for greater access to those lower cost alternatives.
A more difficult situation arises if some beneficiary populations have inherently higher rates of ED use for reasons beyond the physician’s control.20
3. Measure 2: Appropriateness of ED visits – Four measures
This is a subset of the general problem of risk-adjusting quality measures. Suppose that beneficiaries in low income areas are more likely to use the ED. If ED use is not adjusted for beneficiary income, then physicians serving low-income beneficiaries will be penalized by higher ED use in their attributed beneficiary population. However, it would be unfortunate if the adjustment for income became equivalent to accepting higher ED use as an intractable characteristic of lower income beneficiaries. That equivalency would be even more objectionable if the quality measure was a health outcome or process-of-care measure requiring adherence to medication, for example, and adherence was characteristically lower in lower income populations.
a. Non-emergent visits Under all three attribution rules, the average probability that an ED visit was non-emergent
was 0.17. However, examination of the histograms reveals that different attribution rules produce small differences in the distribution of TINs across probabilities. That is true for any of the appropriate categories under Measure 2.
Extrapolated to the population level, a rough interpretation is that 17 percent of ED visits to these Colorado TINs were judged to be non-emergent by the Billings algorithm. Under the plurality attribution rule, there were 2,209 TINs (87.5 percent) that had at least one beneficiary with a non-emergent ED visit. That number rises to 2,842 under the proportionate or “any ED bill” attribution
19 As noted earlier, the “any bill” attribution rule (#3) is not useful for calculating ED visits per beneficiary because the same visit appears in the numerator of every TIN that billed an E&M visit for the beneficiary. 20 The issue of physician control is exacerbated by the use of our post-hoc attribution rules in which patients are assigned to physicians without the consent or foreknowledge of either the physician or the patient.
90
rules. b. Emergent but primary care treatable
The average probability of emergent, but primary care treatable, ED visits also was 0.17 across all three attribution rules. Under the plurality attribution rule, there were 2,363 TINs who had at least one beneficiary with an emergent, but primary care treatable ED visit. That number rises to 2,985 under the proportionate or “any ED bill” attribution rules.
c. Emergent but preventable or avoidable The average probability of emergent, but primary care treatable, ED visits was 0.08 across
all three attribution rules. Under the plurality attribution rule, there were 1,992 TINs who had at least one beneficiary with an emergent, but preventable or avoidable ED visit. That number rises to 2,683 under the proportionate or “any ED bill” attribution rules.
d. Emergent and neither primary care treatable nor preventable or avoidable
The average probability of emergent and neither primary care treatable nor preventable or avoidable ED visits also was 0.58 across all three attribution rules. Under the plurality attribution rule, there were only 39 TINs whose ED visits all were judged as inappropriate by the Billings algorithm. That number falls to 36 under the proportionate or “any ED bill” attribution rules.
VI. Summary Nearly 60 percent of all ED visits by Medicare beneficiaries to Colorado physicians (TINs)
in 2008 were in some sense appropriate, that is, they were truly emergent and not primary care treatable or preventable or avoidable. However, that leaves approximately 40 percent of these expensive visits that were in some sense inappropriate as judged by the Billings algorithm.
Overall, the most problematic ED visits are those that were non-emergent, or emergent but the condition could have been treated in a primary care setting rather than the ED. Each of these categories accounted for approximately 17 percent of all ED visits, while emergent visits that were preventable or avoidable accounted for only 8 percent of all visits.
While better management of the patient’s medical condition is a laudable goal, it appears from these analyses that the greatest short-term reduction in inappropriate ED use could be achieved by directing patients away from the ED for the care they need at that point in time, rather than better management of their medical condition. Non-emergent and emergent but primary care treatable ED visits account for approximately 80 percent of all inappropriate ED use.21
We found that the attribution rule makes a small difference in the number of ED visits per TIN, but no difference in the mean probabilities across the four categories of appropriateness. However, the distribution of probability scores across practices is affected to a degree by the choice of attribution rule.
Our findings suggest that ED visits meet several useful criteria for a physician performance measure.
1. ED use and inappropriate ED use are important outcomes from both a financial and patient safety perspective.
2. Better access to non-ED treatment sites has the potential to reduce non-emergent ED visits and emergent ED visits that are primary care treatable. These two categories account for approximately 80 percent of all inappropriate ED use.
3. Physicians and the hospitals in which they practice are in a position to provide and 21 We add 17 percent for non-emergent ED visits, plus 17 percent for emergent but primary care treatable ED visits and divide by 42 percent of ED visits that are inappropriate for all reasons.
91
encourage better access to non-ED treatment sites. 4. Inclusion of ED use and inappropriate ED use in a value-based modifier would
provide an incentive for physicians to engage in activities that improve access to non-ED treatment sites.
If the Billings algorithm were considered for inclusion in a value-based modifier, there are several validity checks that we would suggest. The Billings algorithm was based on data from New York City EDs. The criteria for a preventable/avoidable ED visit in New York might be quite different than for the same visit in rural Wyoming. We would recommend that a panel of experts consider whether the algorithm needs to be recalibrated for different parts of the country.
Second, the Billings algorithm considers one diagnosis at a time when considering the appropriateness of the ED visits. We would recommend that a panel of experts consider whether the presence of multiple diagnosis should alter the appropriateness scoring of the ED visits for some combinations of diagnoses.
92
Appendix
Attribution Algorithms Attribution of patients to physician practices (represented by tax identification numbers or TINs in our analyses) can be a complex problem, both conceptually and computationally. Those problems are made more complex when working with less that full geographic sample, for example, the 2008 Colorado data that was the basis for our early analyses or the 2008 and 2009 five or ten state samples that are the basis for our later analyses. In the beneficiary level analysis we have tested three attribution rules, not including our initial analyses of PQRS-based attribution. The three rules are: 4. Plurality of evaluation and management (E&M) visits;
5. Proportionate attribution based on the proportion of E&M visits; and
6. Full attribution of cost and quality to any TIN billing for an E&M visit for the patient.
A numerical example is shown below. Consider three beneficiaries whose E&M visits are distributed across three TINs in the following proportions: \ Table A1: Proportion of E&M visits by beneficiaries to each TIN
TIN 1 TIN 2 TIN 3 Number of ED visits Beneficiary 1 0.0 0.2 0.8 2 Beneficiary 2 0.1 0.4 0.5 1 Beneficiary 3 0.9 0.1 0.0 0
Now consider the first attribution rule (plurality of ED visits). The shaded cells in the table below show the assignment of beneficiaries to TINs under that rule (based on the results in the table above). Table A2: Measure 1 scores under the first (plurality) attribution rule
Under the first attribution rule, TIN 3 would be charged with both ED visits for Beneficiary 1, as well as the one ED visit by Beneficiary 2. Beneficiary 3 would be attributed to TIN 1, but Beneficiary 3 had no ED visits. Notice that there will be fewer TINs in the analysis under attribution rule #1, but the same total number of beneficiaries.
Next consider the second (proportionate) attribution rule, shown in Table A2. Under the proportionate attribution rule, TIN 1 is charged with 0.1 of Beneficiary 2’s ED visit; TIN 2 is charged with 0.2 of Beneficiary 1’s two ED visit and 0.4 of Beneficiary 2’s ED visit; and TIN 3 is charged with 0.8 of Beneficiary 1’s two ED visits and 0.5 of Beneficiary 2’s
93
ED visit. TIN 1 has 0.1 + 0.9 = 1.0 beneficiaries in its denominator, while TIN 2 has 0.2 + 0.4 + 0.1 = 0.7 beneficiaries in its denominator. TIN 3 has 1.3 beneficiaries in its denominator. Table A2: Measure 1 scores under the second (proportionate) attribution rule
Finally, consider the third (any E&M bill) attribution rule. Notice that in Table A3, the proportions have been replaced by entries of 1.0 if the TIN had any E&M bill for the beneficiary, and zero otherwise.
Table A3: Measure 1 scores under the third (any E&M bill) attribution rule
(2 x 1.0) + (1 x 1.0) + (0 x 0.0) = 3.0 / 2 attributed
beneficiaries = 1.5
Under the “any E&M bill” attribution rule, TINs 2 and 3 would be charged with the two ED visits for Beneficiary 1, and all TINs would be charged with the visit for Beneficiary 2. Incomplete geographic coverage in our analytic samples
Our analytic samples cover only Colorado or a sample of five states, not the entire U.S. The difficulty that surfaces with incomplete geography is that some beneficiaries seeing TINs in states from which our samples were drawn also see TINs located outside that geographic unit. In other words, some beneficiaries seeing TINs in Colorado in 2008 also received care from TINs outside Colorado.
Our sampling frame for the 2008 Colorado data was all TINs located in Colorado, based on the TIN’s billing address. We then collected all the claims for all the beneficiaries see by those Colorado TINs Visits to non-Colorado TINs were excluded when calculating the TIN that accounts for the most (plurality) of the beneficiary’s E&M visits under attribution rule #1, and the proportion of E&M visits under attribute rule #2. Non-Colorado TINs were excluded
Page left blank intentionally.
95
APPENDIX 14 USING DATA ENVELOPMENT ANALYSIS IN A VALUE-BASED MODIFIER
PAYMENT SYSTEM FOR PHYSICIANS
96
Twin Cities Campus Division of Health Policy and Management School of Public Health 420 Delaware Street S.E. Minneapolis, MN 55455
Alternative Approaches to Measuring Physician Resource Use
Medicare/Medicaid Research and Demonstration Task Order Contract (MRAD/TOC)
HHSM-500-2005-00027I, T.O. 4
USING DATA ENVELOPMENT ANALYSIS
IN A VALUE-BASED MODIFIER PAYMENT SYSTEM
FOR PHYSICIANS Revised: December 16, 2011
by Bryan Dowd, Ph.D. Robert Kane, M.D.
Shriram Parashuram, M.P.H. Tami Swenson, M.S.
UNIVERSITY OF MINNESOTA Robert Coulam, Ph.D. SIMMONS COLLEGE Craig Caplan, M.A.
CMS PROJECT OFFICER
University of Minnesota
97
Table of Contents
I. Introduction ....................................................................................................... 98
II. The DEA approach ............................................................................................ 99
III. An Empirical Example ..................................................................................... 103
IV. Results ............................................................................................................ 104
V. What the DEA measures tell us: Comparison of efficient and inefficient TINs .. 106
VI. Turning DEA input efficiency into payment policy ............................................ 110
VII. References ...................................................................................................... 113
List of Figures Figure 1. An example of DEA analysis and definition of input and output efficiency ............... 100 Figure 2. Distribution of input efficiency scores ...................................................................... 105 Figure 3. Risk-adjusted cost by decile .................................................................................... 108 Figure 4. Quality measures that should increase with efficiency ............................................. 109 Figure 5. Quality measures that should decrease with efficiency ........................................... 110 Figure 6. Basic steps from claims data to fee updates using DEA .......................................... 112 List Tables
Table 1. Means and standard deviations of cost and quality variables (N=1,201) ...... 104
Table 2. DEA output ................................................................................................... 106
Table 3. Comparison of means of quality and cost of most efficient and least efficient TINs ........................................................................................ 107
98
Using Data Envelopment Analysis in a Value-Based Modifier Payment System for Physicians
Medicare/Medicaid Research and Demonstration Task Order Contract (MRAD/TOC)
HHSM-500-2005-00027I, T.O. 4 University of Minnesota
December 16, 2011
Introduction
The value-based modifier (VBM) payment system is designed to reward high performing physicians and physician practices.22
The Centers for Medicare and Medicaid Services (CMS) has selected appropriate measures of risk-adjust cost and quality of care.
The concepts of “value” and “high performance” involve consideration of both the quality of care provided by the physician and the associated cost of caring for beneficiaries. Individual cost and quality measures must be aggregated into a composite index of performance. In order to focus on that task, this paper begins with several key assumptions:
CMS has selected an algorithm by which beneficiaries, along with their cost and quality measures, are attributed to individual physicians, tax identification numbers (TINS), group practices, or other accountable units.
CMS has decided how the data on individual beneficiaries will be aggregated into a measure at the “accountable” level, e.g., a physician, TIN or group practice.
At that point, the question is how the individual measures of cost and quality should be combined to produce a single metric of performance for the VBM payment system. Data envelopment analysis, or DEA, provides one approach. DEA has been used in hundreds of studies of efficiency. The majority of these studies focus on hospital efficiency (Mutter, et al. (2011)), but there have been applications to physician practices as well (Andes, et al., 2002).
Please note that in the text that follows, we combine all quality measures together in the examples. We did this for simplicity’s sake, when we were developing this work. However, our final payment reform proposals, detailed in the main text of this Final Report, insist on condition-specific measures and incentives. The examples that follow are thus illustrative of the DEA method, but inconsistent with our final proposals in this one respect.
22 Throughout the paper we use the terms “physician” and “practice” interchangeably. DEA analysis could be applied to either physicians or practices given satisfactory measures of cost and quality at the appropriate level, which could be individual physicians or group practices. In our empirical work we use the tax identification number or TIN as the unit of analysis, which enables us to analyze data at the level of group practices.
99
The DEA approach
The “theory” underlying this application of DEA is relatively straightforward. The physician who treats a Medicare beneficiary provides services in return for Medicare payments and beneficiary copayments. The physician strongly influences which services will be provided and thus the level of Medicare funds allocated to the care of each beneficiary. In the DEA model, those funds are treated as the input to the production of outputs of interest. The question that DEA addresses is, “What are the Medicare program, the taxpayers who fund it, and the beneficiaries getting for their money?” In other words, “What “outputs” of value are being produced from the “input” of Medicare dollars?”
The ultimate output of interest is the beneficiary’s health or functional status. Unfortunately, health and functional status measures are not collected on a 100 percent sample of Medicare beneficiaries. Therefore, we have to use other quality measures.
For the empirical work described later in the paper we chose two types of quality of care measures that can be computed from Medicare claims data and have been vetted by national quality organizations:
(1) Inappropriate utilization that might have been avoided (e.g., through investment in less costly types of care); and
(2) Claims-computable measures of quality of care. Our measure of risk-adjusted cost is Medicare payments to providers on behalf of a
beneficiary over the course of one year. We use the CMS hierarchical condition categories (HCCs) and demographic variables to risk-adjust costs. Our “accountable unit” or “provider” is a TIN, and we attribute beneficiaries to the TIN that provided the majority of the beneficiary’s non-hospital evaluation and management visits.
We emphasize that nothing about the DEA approach requires the use of these specific measures or attribution rules. CMS can choose any cost and quality measures it likes and any attribution rule. There even could be multiple measures of cost, such as inpatient costs versus outpatient costs. The only requirement is that there are some measures of cost and quality that are aggregated to some “accountable unit” or “provider.”
A diagrammatic example of DEA analysis is shown in Figure 1. Suppose there is only one quality measure, shown on the vertical axis – and one cost measure -- risk-adjusted cost, shown on the horizontal axis. We thus have the inputs on the horizontal axis (less is better) and the single output on the vertical axis (more is better). Thus, a practice that is higher on the vertical axis has better quality for the same resources, and a practice that is farther to the left on the horizontal axis has lower cost for the same quality.
Assume there are seven practices. If we take quality and cost data for all seven and plot them on the graph, the outermost points define a “frontier.” Practices 1, 5, and 6 are on that frontier – it is a cost-quality frontier in that there is no practice that has a better result on one variable (cost or quality), without having a worse result on the other. The frontier is defined not only by those practices, but by the straight lines connecting them. DEA is a linear programming algorithm and thus the frontier is defined by the linear line segments connecting practices on the frontier.
100
F igure 1. An example of DE A analys is and definition of input and output effic ienc y
The DEA problem takes the following form: 23
Minimize with respect to θi , λ: θi
Subject to: ∑=
≥−N
siss yy
10λ
∑=
≥−N
sssii xx
10λθ
∑=
≥N
ss
10λ
Where s = 1,.i.., N indexes the practice
y is a vector of 1,…,M outputs
x is vector of 1,…,K inputs
θ = input efficiency. In the case of one input and one output, input efficiency for the sth practice simply is the
intersection of the horizontal line extending left from the practice’s point in the cost/quality space with the frontier line, which can be computed with high-school algebra. When a second quality 23 This formulation assumes variable returns to scale.
101
measures is added, the frontier becomes a two-dimensional plane. More quality measures create a multi-dimensional output surface, but the principle is the same.
Practices 1, 5 and 6 are producing the maximum amount of quality for their given level of risk-adjusted cost. Although Practice 7 is on the frontier, Practice 6 is producing the same level of quality at lower cost, and our preferred measure of efficiency (input efficiency, explained below) will distinguish these two practices for precisely that reason. Relationships of the practices inside the frontier are more easily distinguished from frontier practices:
Practice 2 is not on the frontier because Practice 1 is producing the same level of quality at lower cost.
Practice 3 is not on the frontier, either. Even though there is no actual practice producing the same level of quality at lower cost, an important assumption underlying DEA is that the frontier defined by Practices 1, 4, 5, 6 and 7 is continuous,24 and thus there is a hypothetical Practice 4 that could produce the same level of quality as Practice 3 but at the cost indicated by Practice 4.25
DEA analysis produces two measures of efficiency: input efficiency and output efficiency.
Input efficiency measures the degree to which a practice could reduce its risk-adjusted cost while maintaining the same level of quality. That is, for any given level of quality – a horizontal line on Figure 1 – what is the ratio of cost of a frontier practice to the cost of a specific actual practice. Practice 3, for example, has the same quality as (hypothetical) Practice 4. Practice 3’s input efficiency is defined as the ratio of Practice 4’s cost to Practice 3’s cost, or Distance A divided by Distance B in the figure. Thus, practices on the frontier have an input efficiency of 1.0, because, by definition of the frontier, there is no practice farther west along a given horizontal line defining a particular level of quality.
Output efficiency measures the degree to which a practice could increase quality, holding risk-adjusted cost constant. That is, for any given level of risk-adjusted cost – a vertical line on Figure 1 – what is the ratio of the quality of an actual practice to the level of quality of a frontier practice? Practice 3, for example, has the same cost as Practice 6 in Figure 1. Practice 3’s output efficiency is defined as the ratio of Practice 3’s quality to Practice 6’s quality, or Distance C divided by Distance D in the figure.
Thus, input efficiency measures the degree to which costs could be reduced without reducing the level of quality. Output efficiency measures the degree to which quality could be 24 Another important assumption underlying DEA is that the frontier is convex: that is, the frontier must curve upward and to the right as risk-adjusted cost increases. As cost increases, at some point an additional dollar of risk-adjusted cost buys less additional quality than the previous dollar, and further dollars continue to buy less and less. 25 When there is only one input and one output, the distance from Practice 3 to Practice 4 along the horizontal axis can be computed with high-school algebra. One simply writes down the equation for the line that connects Practices 1 and 5, substitutes Practice 3’s value of quality, and solves for risk-adjusted cost, which is Distance A. If there were two quality measures (outputs), then the distances that define input efficiency would be distances to a plane, rather than distances to a line.
102
increased given the practice’s level of costs for practices on the frontier where the slope of the frontier is positive.
In this application, input efficiency clearly is the preferred measure of a practice’s performance. The reason is that output efficiency cannot distinguish between practices 6 and 7. For both practices, output efficiency is equal to 1.0 because they both are on the upper part of the frontier (each of them is getting as much quality as is possible for their given cost – that’s what it means for them to be on the frontier). However, input efficiency is greater for Practice 6 than Practice 7 because both are producing the same level of quality, but Practice 6 has lower risk-adjusted cost. Practice 7 is said to be on the “flat of the curve” with respect to quality – spending more money but producing no higher quality than Practice 6.
Even input efficiency poses an important challenge, however, because input efficiency makes no distinction between high and low levels of quality – a practice can be rated highly efficient by producing low quality care at relatively low cost, or high quality care at relatively high cost. In principle, this would lead to a further question: how much efficient improvement in quality is CMS willing to pay for? (In Figure 1 above, note how much cheaper Practice 1 is versus Practice 6 – is the additional, efficiently produced quality worth the additional cost?) This might be a difficult issue to resolve in principle, but our preliminary results, presented later in the paper, suggest that practices with higher input efficiency scores tend to have both lower costs and higher quality than practices with lower efficiency scores.
The example discussed above involved only one input (cost) and one output (one quality measure). That is of course unrealistic for any actual CMS effort to measure the performance of physician practices. Fortunately, one of the important advantages of the DEA model over many other models (e.g., stochastic frontier models) is that it is not limited to one input and one output. There can be multiple inputs and multiple outputs. In this application, that means that there can be multiple cost and quality measures – that is, we can make policy decisions about which cost and quality measures we think should be used to measure the performance of physicians, and the DEA model will permit us to combine the inputs or outputs we have chosen.26
Dropping or adding a quality measure could change the rank of a physician relative to other physicians in the peer group. (Not surprisingly, if we dropped or added a measure on which a physician did particularly well or poorly, the physician’s relative performance would change.) However, linear transformations of any quality measure will not change the relative rank of the physician. Thus, for example, standardizing a quality measure by subtracting its mean and dividing by its standard deviation would not affect the results of DEA analysis. “Importance weights” derived, for example, by weighting each quality measure by the total number of beneficiaries (as opposed to the number in each practice) affected by the measure also would have no effect on the results from DEA analysis.
27
Nonetheless, there are ways that CMS could give more weight to individual quality
26 The LIMDEP computer program that we are using for the analysis currently limits the number of inputs and outputs to a total of 19 variables. 27 However, transformations that differ from one physician to another such as shrinkage estimators will change the relative rankings.
103
measures. CMS could create composite measures prior to the DEA analysis that give greater weight to some measures. For example, if CMS wanted to give greater weight to diabetes care rather than colon cancer screening, CMS could create a composite measure that did that, then run DEA on the composite measure. Alternatively, CMS could establish minimum floor levels of quality for some measures, denying payment updates to providers who did not meet the minimum quality levels. Conversely, CMS could give bonus payments to providers who scored well on individual quality measures, in addition to, or even regardless of, the provider’s input efficiency score from the DEA analysis.
An Empirical Example
We applied DEA analysis to a sample of Medicare claims data from the state of Colorado in 2008. Data were analyzed at the tax identification number (TIN) level. We began with a 100 percent sample of beneficiaries in Colorado in 2008, but limited the DEA analysis to TINs that had patients eligible for all of the quality measures in the analysis. That meant that the TIN had to have at least one diabetic patient, for example. There were 1,201 TINs in our dataset.
The input – risk-adjusted cost – is the residual from two beneficiary-level cost regressions – inpatient and outpatient costs.28
The quality measures we selected have two critical properties: (1) they are practical for Medicare to derive from claims data for each TIN; and (2) they enjoy a broad consensus among authoritative clinical and policy audiences. The measures we have selected. are:
As noted earlier, the regressors (risk adjustment variables) are the HCC categories and demographic variables used by CMS to pay private Medicare Advantage health plans in the Medicare program.
a. Avoidable emergency department (ED) visits (Billings, Parikh and Mijanovich, 2000) o Non-emergent ED visits per beneficiary o Primary care treatable ED visits per beneficiary o Preventable/avoi-dable ED visits per beneficiary29
b. Ambulatory care sensitive (ACS) admissions per admission (AHRQ, 2011)
c. Potentially preventable rehospitalizations per admission (Goldfeld, et al., 2007)
d. Claims-computable quality measures (CMS, 2011):30
a. Colon cancer per eligible beneficiary
b. Breast cancer screening per eligible beneficiary c. Outpatient diabetes per eligible beneficiary d. HbA1c screening per eligible beneficiary
28 Inpatient and outpatient costs are analyzed separately because we use a different set of risk adjustment variables in the two equations. The outpatient cost equation includes diagnoses related to the ambulatory care sensitive (ACS) hospitalization conditions, while the inpatient cost equation excludes them. 29 Bryan E. Dowd, et al., “Using Avoidable Emergency Department (ED) Visits as a Performance Measure for Medicare Physicians’ Practices, (DRAFT)” paper submitted by the University of Minnesota pursuant to Medicare/Medicaid Research and Demonstration Task Order Contract (MRAD/TOC) HHSM-500-2005-00027I, T.O. 4, May 16, 2011. 30 These measures were adjusted to the appropriate denominators.
104
e. LDL-C screening per eligible beneficiary f. Medical attention for nephropathy per eligible beneficiary.
We used a simple and common attribution rule: the cost and quality of a beneficiary’s care are attributed to the TIN from whom the beneficiary received a plurality of his/her evaluation and management visits. The DEA analysis was run in LIMDEP 9.0 (Greene, 2011).
The DEA algorithm requires all quality measures to be coded so that larger numbers represent higher quality or more desirable outcomes. Thus, avoidable emergency department (ED) admissions, ambulatory care sensitive (ACS) admissions, and potentially preventable rehospitalizations all were “reverse” coded so that larger numbers represent avoided undesirable events. The algorithm also requires that all inputs and outputs be positive, which is accomplished simply by adding a sufficiently large constant to each transformed quality measure and risk-adjusted cost. As noted above, none of these linear transformations have any effect on calculation of input efficiency scores. They simply facilitate implementation of the algorithm.
Results
The means and standard deviations of the variables in the analysis are shown in Table 1. These data are for the original variables prior to the transformations described above that are required for the DEA analysis.
Table 1. Means and standard deviations of cost and quality variables (N=1,201)
Variable Mean Standard Deviation
INPUT
Risk-adjusted (residual) cost 958.36 3264.16
OUTPUTS
Non-emergent ED visits per beneficiary 0.144 0.146
Primary care treatable ED visits per beneficiary 0.149 0.124
Preventable/avoidable ED visits per beneficiary 0.0653 0.062 Ambulatory care sensitive (ACS) admissions per admission 0.1070 0.113
Potentially preventable readmissions per admission 0.176 0.198
Colon cancer screening per eligible beneficiary31 0.120 0.106
Breast cancer screening per eligible beneficiary 0.216 0.195
Diabetes measures32
HbA1c Screening per eligible beneficiary 0.688 0.351
LDL-C screening per eligible beneficiary 0.549 0.360 Medical attention for nephropathy per eligible beneficiary 0.564 0.301
31 Measures are calculated for one year. Measures for events that should take place every two years, for example, would need to be doubled to estimate the rate of compliance. 32 The diabetes measures were added together to form a single composite variable. See Dowd, et al. (2011) for a discussion of the equal weights.
105
The output from DEA analysis differs from regression analysis. There are no “explanatory”
variables and no coefficients with standard errors. Instead, for each TIN there is an input efficiency score indicating its relative distance to the frontier. The distribution of input efficiency scores from our sample of data is shown in the bar graph in Figure 2, below. F igure 2. Dis tribution of input effic ienc y s cores
In this graph, the variable DEAEFF_1 is the input efficiency score, while the vertical axis shows the frequency with which each score occurs. TINs with an input efficiency score of 1.0 are on the frontier. Smaller scores (<1.0) reflect the distance from the frontier for individual TINs. How does one compute a confidence interval around a TIN’s efficiency score? Confidence intervals may be important if DEA efficiency scores are to be used in a VBM payment system, if for no other reason than that CMS might well want to insist that efficiency scores for each TIN must be significantly different from the threshold to which payment consequences are attached.
The topic of confidence intervals for DEA efficiency scores is somewhat controversial (Ferrier and Hirschberg, 1997, 1998; Simar and Wilson, 1999). Unlike parametric statistical methods such as ordinary least squares (OLS) regression, DEA is a non-parametric method. There is no counterpart in DEA analysis to the assumption in OLS regression that the error term in the regression is normally distributed. Nonetheless, Simar and Wilson (1998) have proposed computing confidence intervals for efficiency scores using bootstrap methods. Bootstrap estimates of standard errors are used in many applications where the variance of an estimated coefficient or prediction function is not easily computed.33
The following table shows the confidence intervals for the input efficiency scores for the
33 The bootstrap approach proceeds by drawing repeated samples of data with replacement from the original sample of data. The function (in this case the input efficiency for the sth TIN) is computed for each bootstrap sample and the bootstrap estimate of the standard error is the square root of the variance of the estimates across the bootstrap samples.
106
first ten TINs in the 2008 Colorado data based on 100 replications of the DEA analysis. Table 2. DEA output
10 1155 0.0854 -0.0002 0.0856 0.0094 0.0695 0.1005 The input efficiency “point” estimate (column 3) is taken directly from the DEA estimation
analogous to Figure 1.34 If the corrected efficiency measure (lower or upper) is greater than 1, it is set equal to 1. The confidence intervals are the five and ninety-five percentile values of the distribution of bootstrap results.35
What the DEA measures tell us: Comparison of efficient and inefficient TINs
The results of the DEA analysis can be used to divide TINs into high and low efficiency TINs. Recall that input efficiency is a simple ratio: for any given level of quality – a horizontal line on Figure 1 – what is the ratio of cost of a frontier practice to the cost of a specific actual practice? We can take calculations of input efficiencies and put them into groups of the “most efficient” (the upper decile of input efficiency scores) and least efficient (the lowest decile of input efficiency scores). Table 3 compares the means of the quality and cost variables for practices that are in the highest and lowest deciles (10 percent) of input efficiency. The variables are in their original scales as in Table 1, rather than the linear transformations required for the DEA analysis.
34 The bias (column 4) arises from use of the bootstrap approach to calculate confidence intervals. The bias is equal to the mean input efficiency estimated across the bootstrap samples (not shown) minus the point estimate (column 3). Note that the bias is negative, so we are subtracting a negative number. The bias-corrected efficiency measure (column 5) is equal to the point estimate (shown in Table 1) minus the estimated bias. As explained above, the standard deviation is the square root of the variance of the estimated efficiency scores for that practice across the 100 bootstrap samples. 35 The confidence intervals are centered on the corrected efficiency estimates.
107
Table 3. Comparison of means of quality and cost of most efficient and least efficient TINs
Lowest input efficiency (Decile #1)
N=121
Highest input efficiency (Decile #10)
N=120
Risk-adjusted cost residual $ 3,204.19
(above average cost) $ -791.20
(below average cost)
Quality measure
Non-emergent ED visits per beneficiary 0.2372 0.1123
Primary care treatable ED visits per beneficiary 0.2439 0.1015
Preventable/avoidable ED visits per beneficiary 0.1315 0.0252
ACS admissions per admission 0.2465 0.0494 Potentially Preventable Readmissions per admission 0.2904 0.1120
Colon cancer screening per eligible beneficiary 0.0772 0.2747
Breast cancer screening per eligible beneficiary 0.0810 0.2286
Diabetes measures
HbA1c Screening per eligible beneficiary 0.5340 0.7688
LDL-C screening per eligible beneficiary 0.3606 0.6955 a. Medical attention for nephropathy
per eligible beneficiary 0.4333 0.6933 The results in Table 3 show that – compared to low-efficiency TINS – high efficiency TINs
have: a. Uniformly lower average rates of avoidable ED visits, ACS admissions and potentially
preventable readmissions;
b. Uniformly higher average rates of preventive care (screening); and
c. Average risk adjusted costs that are over $4,000 ($3,204.19 – (-791.20)) per year lower. These results constitute an important determination for any VBM system. The results
permit us to give cost-quality scores to physician TINS and to say with some justification that a given practice is achieving less additional quality for the additional costs it imposes on the Medicare system. We know this because there are other practices – on the frontier – providing the same level of quality at lower cost.
For practices on the DEA frontier, higher risk-adjusted costs necessarily are associated with higher quality. The problem can exist for some practices inside the frontier if the distribution of practices inside the frontier was similar to Practices 3 and 7 in Figure 1. Practices 3 and 7 produce higher quality than Practice 1, but they are less efficient than Practice 1.
However, the DEA results described above suggest that input efficiency combines cost and quality in a way that – as it happens in this empirical example – largely sidesteps the tradeoff of cost and quality. In these data, lower cost practices are also higher quality in our sample. The results show that DEA efficiency scores have identified a set of TINs that have both lower risk-adjusted costs per beneficiary and higher quality scores than their inefficient counterparts. Given that the highly efficient practices are also the high quality practices, we might well conclude that so much of the cost-quality problem has been resolved (in relation to the inefficient practices), that we won’t worry about any variation in costs within the group of highly efficient practices. Put differently,
108
since the high quality practices are low cost, we won’t worry about the much smaller variation in costs among these high quality practices.
Thus far, we have compared only the lowest and highest efficiency TINs, but the following figures show the relationship between the deciles of efficiency and cost and quality measures in our analysis. The data are ordered from the least efficient TINs on the left to the most efficient TINs on the right. F igure 3. R is k-adjus ted c os t by dec ile
Figure 3 is a line graph that shows that cost (vertical axis) declines sharply from the least
efficient TINs (1st decile) to the second, but then remains fairly constant until declining again in the most efficient TINs (9th and 10th deciles).
The next two figures are line graphs that show the relationship between deciles of efficiency for the two types of quality measures. Figure 4 shows quality measures that should increase as efficiency increases. The vertical axis represents the scale for each of the quality measures.
109
F igure 4. Quality meas ures that s hould increas e with effic ienc y
Colon = rate of colon cancer screening per eligible beneficiary Breast = rate of breast cancer screening per eligible beneficiary HbA1c = rate of HbA1c screening per eligible beneficiary Ldl-C = rate of Ldl-C screening per eligible beneficiary Neph = rate of medical attention for nephropathy per eligible beneficiary
Figure 4 shows that: The three diabetes measures (HbA1c, Ldl-C and medical attention for nephropathy)
generally increase steadily as efficiency increases. Ldl-C exhibits the largest deviation from a steady increase.
Colon and breast cancer screenings are more even throughout the efficiency range, but are lowest among the least efficient TINs.
Figure 5 is a line graph that shows the measures of inappropriate utilization that should decrease as efficiency increases. There is reasonably steady improvement in these quality measures as efficiency increases.
110
F igure 5. Quality meas ures that s hould decreas e with effic iency
ACS = ambulatory care sensitive admissions per admission Readmit = potentially preventable readmissions per admission NE ED = non-emergent emergency department visits per beneficiary PCT-ED = primary care treatable emergency department visits per beneficiary PA-ED = preventable or avoidable emergency department visits per beneficiary
The high values of inappropriate utilization in the lowest decile of efficiency are not surprising, since inappropriate utilization also can have dramatic increase on the TIN’s risk-adjusted cost. That fact raises the question, “Does the inclusion of inappropriate utilization unfairly penalize a TIN twice – once for having higher risk adjusted cost and again for having lower quality?” In fact, the TIN is penalized twice, but that may not be inappropriate, since unnecessary ED visits and hospitalizations actually penalize the Medicare program and beneficiaries twice – once for incurring unnecessary costs and again for exposing the beneficiary to the risks associated with any visit to the ED or any hospital admission.
Turning DEA input efficiency into payment policy
How can the results of DEA analysis be converted into value-based payment policy? There are several alternatives. First, the input efficiency score could be used as a continuous measure on which to compute the fee update. Like the RBRVU and DRG weights, this continuous variable
111
(with an upper bound of 1) could be multiplied by a feasible dollar figure that conformed to the current budget constraint on increased Medicare spending on physician services, to determine the fee increase for individual TINs. In this manner, CMS would give a greater reward to the extent a practice is closer to the best practices. Performance measurement here is not a threshold to be achieved, but a continuous incentive across the full range of the practices.
A second alternative is to divide the input efficiency scores into deciles as in Table 3 and base fee updates on the TIN’s decile – simply a discretized version of the first option – or choose a cutoff decile and give increases to TINs that were at or above that decile. 36
Third, information from the DEA analysis could be combined with incentives linked to individual cost or quality measures as discussed earlier in the paper – perhaps denying updates to TINs whose performance on a given quality measure is lower than a predetermined minimum, or giving extra incentive payments to TINs that perform well on specific measures.
Any of these approaches results in information that is easily interpreted by providers. Providers do not have to be familiar with, or even aware of, the DEA methodology (though obviously their interest will increase if the DEA scores are linked to payment policy). The DEA score can be presented as a performance score that combines cost and quality, and each provider could be presented with its decile or other ranking on individual cost and quality measures. In that way, the provider could see immediately which cost or quality measure contributed the most to its overall efficiency ranking.
Regardless of the way in which the DEA results are linked to payment policy, it is important to emphasize that all of these approaches would reward practices that are producing relatively higher quality care at relatively lower cost using a methodology that:
can include multiple measures of cost and quality;
permits complete flexibility in the measures chosen;
is practical to implement from current data;
permits reports to physicians/TINS that identify clearly why overall efficiency scores are high or low.
Figure 6 below shows the basic steps in an implementation of DEA analysis for computing the fee updates and reporting to physicians.
36 If CMS desired instead to avoid penalizing practices that aren’t “too different” from the best practices, it could adopt a rule allowing some distance from the frontier before penalties applied: e.g., give fee increases to practices whose input efficiencies were not statistically different from the frontier value of 1.0. Such a rule would treat DEA results in a manner similar to the hospital mortality and readmission data reported by CMS.
112
F igure 6. B as ic s teps from c laims data to fee updates us ing DE A
This would be a major improvement over current practices. It would also be a major
improvement over simpler methods (e.g., tiers or quadrants) that have been used or proposed in the past. CMS would have defensible, sophisticated and flexible measure that presented providers with information that was fair, actionable and meaningful.
113
References
Agency for Health Research and Quality (AHRQ). Algorithm dowloadable from http://wagner.nyu.edu/faculty/billings/acs-algorithm.php (last accessed May 31, 2011).
Andes, S., Metzger, L.M., Kralewski, J. and Dave Gans. “Measuring efficiency of physician practices using data envelopment analysis,” Managed Care 11:11 (November 2002 ) 48-54.
Billings, J., N. Parikh, , and T. Mijanovich. “Emergency room use: the New York story.” Issue Brief: Commonwealth Fund. Number 434 (November 2000) 1–12.
Center for Medicare and Medicaid Services. Generating Medicare Physician Quality Performance Measurement Results (GEM) Project 2007 specifications http://www.cms.gov/GEM/Downloads/GEMMeasureFunctionalSpecs2007.pdf (accessed May 31, 2011)
Dowd, B., Kane, R. Parashuram, S., Swenson, T., Coulam, R., “Combining Quality Measures in a Value Based Modifier (VBM) Payment System,” paper submitted pursuant to Medicare/Medicaid Research and Demonstration Task Order Contract (MRAD/TOC) HHSM-500-2005-00027I, T.O. 4, June 8, 2011.
Ferrier, Gary D. and Joseph G. Hirschberg. “Can We Bootstrap DEA Scores?” Journal of Productivity Analysis 11 (1999) 81-92.
Goldfield, N. I., E. C. McCullough, J. S. Hughes, A. M. Tang, B. Eastman, L. K. Rawlins, and R. F. Averill. “Identifying Potentially Preventable Readmissions,” Health Care Financing Review30:1 (June 2007) 75-91.
Granneman, Thomas W., Brown, Randall S. and Mark V. Pauly. “Estimating Hospital Costs: A Multiple-Output Analysis,” Journal of Health Economics (1986) 107-127.
Greene, William. LIMEP: Version 9, Volume 2. (2007) E33-111.
Mutter, Ryan L., Rosko, Michael D., Greene, William H., and Paul W. Wilson. “Translating Frontiers into Practice: Taking the Next Steps Toward Improving Hospital Efficiency,” Medical Care Research and Review Supplement to 68(1) (January 2011) 35-195.
Silber, Jeffrey H., Rosenbaum, Paul R., Brachet, Tanguy J., Ross, Richard N., Bressler, Laura J., Even-Shoshan, Orit, Lorch, Scott A. and Kevin G. Volpp. “The Hospital Copmare Mortality Model and the Volume-Outcome Relationship,” Health Services Research 45:5 Part 1 (2010) 1148-1167.
Simar, Leopold and Paul W. Wilson. “Sensitivity Analysis of Efficiency Scores: How to Bootstrap in Nonparametric Frontier Models,” Management Science 44:1 (January 1998) 49-61.
114
Simar, Leopold and Paul W. Wilson. “Of Course We Can Bootstrap DEA Scores! But Does It Mean Anything? Logic Trumps Wishful Thinking,” Journal of Productivity Analysis 11 (1999) 93-97.
115
APPENDIX 15 ADDITIONAL DEA HISTOGRAMS AND PLOTS OF QUALITY MEASURES
VERSUS COST
116
This Appendix contains basic data on additional measures not presented in the main text. When there is only one quality measure in
the category, it is possible to show the scatter plot of risk adjusted cost versus the quality measure on which the DEA frontier was based. The descriptive statistics for all the measures are found in Table 4.***. In all cases, the sample sizes are determined by TINs who met the criterion of
at least twenty eligible patients in both 2008 and 2009. For colon and breast cancer screening, the sample sizes had to be reduced further to
accommodate the LIMDEP constraint for DEA analysis. A. Colon cancer screening Of the 23,612 TINs that appeared in both the 2008 and 2009 data and had more than twenty
attributable beneficiaries of all types, 22,356 or 95 percent had 20 or beneficiaries who were eligible for colon cancer screening. The distribution of input efficiency scores is shown in the bar graph in the following figure.
Figure 1. Distribution of input efficiency scores for colon cancer screening (5 state data 2008) N = 11,691
Because there is only one quality “output” it is possible to show a scatter plot of colon cancer screening versus risk adjusted cost on which the input efficiency scores were based. That scatter plot is shown in Figure 2, along with solid lines showing the DEA frontier. The scatter plot shows the importance of individual TINs in defining the frontier. Removal of one of the TINs on the frontier could shift the frontier significantly, but there would be little effect on the TINs that were in the upper and lower quartiles of efficiency. That is why we recommend the latter measures for incentive payments rather than the DEA efficiency score itself. The dotted least squares
Input Efficiency Scores
117
regression line shows that colon cancer screening rates generally decline as risk adjusted cost increases.
Figure 2. DEA frontier for colon cancer screening (5 state data 2008)
B. Breast cancer screening Of the 23,612 TINs that appeared in both the 2008 and 2009 data and had more than twenty
attributable beneficiaries of all types, 18,489 or 78percent had 20 or beneficiaries who were eligible for breast cancer screening. The distribution of input efficiency scores for breast cancer screening is shown in the bar graph in Figure 3.
118
Figure 3. Distribution of input efficiency scores for breast cancer screening (5 state data 2008) N=11,622
The DEA frontier for breast cancer screening is shown in the scatterplot in Figure 4 below. In this case, the fronttier is even more dependent on a few TINs than the frontier for colon cancer screening, once again illustrating the importance of using quartiles of efficiency rather than the DEA efficiency measure itself. The dotted least squares regression line shows that breast cancer screening rates generally decline as risk adjusted cost increases.
119
Figure 4. DEA frontier for breast cancer screening (5 state data 2008) N=11,622
C. CVD-Ldl Of the 23,612 TINs that appeared in both the 2008 and 2009 data and had more than twenty
attributable beneficiaries of all types, only 1,090 or five percent had 20 or beneficiaries who were eligible for CVD-Ldl testing. The distribution of input efficiency scores is shown in the bar graph in Figure 5 below.
120
Figure 5. Distribution of input efficiency scores for CVD-Ldl testing (5 state data 2008) N=1,090
The DEA frontier looks quite different for CVD-Ldl testing, as shown in the scatterplot in Figure 6. There is a concentration of TINs with relatively low cost and high quality in the upper left-hand portion of the figure. But overall, quality increases very slightly as risk adjusted cost increases, as shown by the dotted least squares regression line. Because one of the lowest cost TINs also has one of the highest rates of CVD-LdL testing, the frontier is virtually two sides of a rectangle.
121
Figure 6. DEA frontier for CVD-Ldl testing (5 state data 2008) N = 1,090
D. Lipid Testing Of the 23,612 TINs that appeared in both the 2008 and 2009 data and had more than twenty
attributable beneficiaries of all types, 4,736 or 20 percent had 20 or beneficiaries who were eligible for lipid testing. The distribution of input efficiency scores is shown in the bar graph in Figure 7 below.
Figure 7. Distribution of input efficiency scores for lipid testing (5 state data 2008) N=1,090
The DEA frontier is shown in a scatterplot of risk adjusted cost versus quality in Figure 8. This frontier looks somewhat similar to that for CVD-Ldl testing, except for lipid testing, quality generally declines as cost increases, as indicated by the dotted least squares regression line. Among lower cost TINs, the concentration appears to be in the higher quality range. As in the case of CVD-Ldl testing the presence of a few lowest cost, higher quality TINs results in a nearly rectangular frontier.
122
Figure 8. DEA frontier for lipid testing (5 state data 2008) N=4,736
E. Potentially preventable readmissions Of the 23,612 TINs that appeared in both the 2008 and 2009 data and had more than twenty
attributable beneficiaries, 10,026 or 42 percent had 20 or hospitalized beneficiaries who thus were eligible for the potentially preventable rehospitalization measure. The distribution of input efficiency scores is shown in the bar graph in Figure 9 below.
123
Figure 9. Distribution of input efficiency scores for potentially preventable readmissions (5 state data 2008) N=10,026
Reshopitalization were measured over three different periods following the initial hospitalization and thus there were three rehospitalization measures. Thus, it is not possible to plot cost versus quality in a two-dimensional graph.
124
APPENDIX 16. DISTRIBUTION OF TINS AND RISK ADJUSTED COST ACROSS RISK
ADJUSTED QUALITY TIERS IN DIFFERENT TIN PEER GROUPS
125
Table 1 (a): CHF: Percentage distribution of TINs across Risk Adjusted Quality Tiers by Average Risk Adjusted 30-day episode cost z-score for Episode Proportion Peer Group 5 (Number of TINs=674)
% 3.5% 0.1% 100.0% Table 1 (b): CHF: Average Risk Adjusted 30-day Episode Cost for TINs across Risk Adjusted Quality Tiers by Average Risk Adjusted 30-day episode cost z-score for CHF Episode Proportion Peer Group 5 (Number of TINs=674)
Table 2 (a): CHF: Percentage distribution of TINs across Risk Adjusted Quality Tiers by Average Risk Adjusted 30-day episode cost z-score for Episode Proportion Peer Group 3 (Number of TINs=3,155)
Table 2 (b): CHF: Average Risk Adjusted 30-day Episode Cost for TINs across Risk Adjusted Quality Tiers by Average Risk Adjusted 30-day episode cost z-score for CHF Episode Proportion Peer Group 3 (Number of TINs=3,155)
Table 3 (a): CHF: Percentage distribution of TINs across Risk Adjusted Quality Tiers by Average Risk Adjusted 30-day episode cost z-score for Episode Proportion Peer Group 1 (Number of TINs=9,007)
Table 3 (b): CHF: Average Risk Adjusted 30-day Episode Cost for TINs across Risk Adjusted Quality Tiers by Average Risk Adjusted 30-day episode cost z-score for CHF Episode Proportion Peer Group 1 (Number of TINs=9,007)
Table 4 (a): Hip Replacement: Percentage distribution of TINs across Risk Adjusted Quality Tiers by Average Risk Adjusted 30-day episode cost z-score for Episode Proportion Peer Group 5 (Number of TINs=371)
Table 4 (b): Hip Replacement: Average Risk Adjusted 30-day Episode Cost for TINs across Risk Adjusted Quality Tiers by Average Risk Adjusted 30-day episode cost z-score for CHF Episode Proportion Peer Group 5 (Number of TINs=371)
Table 5 (a): Hip Replacement: Percentage distribution of TINs across Risk Adjusted Quality Tiers by Average Risk Adjusted 30-day episode cost z-score for Episode Proportion Peer Group 3 (Number of TINs=335)
Total 2.7% 8.4% 39.9% 37.2% 8.7% 3.0% 100.0% Table 5 (b): Hip Replacement: Average Risk Adjusted 30-day Episode Cost for TINs across Quality Tiers by Average Risk Adjusted 30-day episode cost z-score for CHF Episode Proportion Peer Group 3 (Number of TINs=335)
Table 6 (a): Hip Replacement: Percentage distribution of TINs across Risk Adjusted Quality Tiers by Average Risk Adjusted 30-day episode cost z-score for Episode Proportion Peer Group 1 (Number of TINs=7,487)
Table 6 (b): Hip Replacement: Average Risk Adjusted 30-day Episode Cost for TINs across Risk Adjusted Quality Tiers by Average Risk Adjusted 30-day episode cost z-score for CHF Episode Proportion Peer Group 1 (Number of TINs=7,487)
Total 1.6% 5.6% 53.3% 30.9% 6.0% 2.6% 100.0% *Cost is below expected
131
APPENDIX17. STABILITY OF TIN’s RISK ADJUSTED QUALITY TIERS AND
PERFORMANCE SCORES BETWEEN 30- AND 60-DAY EPISODES
132
Stability of TIN’s Risk Adjusted Quality Tiers and Performance Scores between 30- and 60-day episodes of CHF and Hip Replacement
For each of the two conditions, we examined the stability of TIN’s risk adjusted quality tiers and TIN performance score (with respect to both quality and cost) over 30- and 60-day episodes. The analysis was performed separately for each episode proportion peer group.
The first step was, for each peer group, to quantify the TINs’ risk adjusted quality tiers and risk adjusted cost z-scores into a single performance rank (index). The performance score rank assigned to TINs in each peer group, based on their risk adjusted quality tiers and risk adjusted cost z-scores is shown in Table 1 below. This table is an extension of Table 6-4. An important feature of this assignment of ranks, common to Table 6.4, is that quality trumps cost. In other words, even the highest cost TIN in a higher quality tier receives a higher performance score than the lowest cost TIN in a lower quality tier. Again, the weights used here are illustrative only.
We then used Spearman’s rank order correlation and frequency tables to examine the stability of TIN’s risk adjusted quality tier and performance rank between 30- and 60- day episodes for TINs across episode proportion peer group for CHF and hip replacement.
Table 1: TIN’s Performance Score Rank based on its Quality Tier and Risk-adjusted Cost z-score within a Peer Group
The correlation between a TIN’s risk adjusted quality tiers for 30- and 60- day episodes of CHF and hip replacement across all peer groups is shown in Tables 2 (a) and 2 (b) . It should be kept in mind that TINs remain in the same proportion peer group for both 30- and 60-day episodes. The correlation coefficients in Tables 2 (a) and 2 (b) show us how likely the TIN is to remain in the same quality tier within its peer group. The correlation coefficient of approximately 0.54 for CHF means that only 29 percent37
Table 3 (a) and 3 (b) below show the frequency of TINs in the highest episode proportion peer group, across 30- and 60- day episode risk adjusted quality tiers for CHF and hip fracture respectively. Going from 30- to 60- day episodes of CHF, only 39 percent
of the variation in TIN quality tiers is common between 30- and 60 day episodes of CHF. With a correlation coefficient of approximately 0.82, 67 percent of the variation in TIN quality tiers is common between 30- and 60- day episodes of hip fracture. Hence, TINs providing higher quality of care compared to their peers in 30-day episodes may not be providing higher quality for 60-day episodes. Similarly, lower quality TINs in 30-day episodes may not be lower quality in 60-day episodes. This is more likely for CHF TINs than hip replacement TINs.
37 Note again that the square of the correlation coefficient (ρ2) gives the percentage variation that is common between the two variables of interest; while 1-(ρ2) is the percentage variation between the two variables that is unique.
134
of TINs in the highest episode proportion peer group remain in the same quality tier, while 31 percent move to higher tiers, and 30 percent move to lower quality tiers. In contrast, 68 percent of hip replacement TINs remain in the same quality tier, going from 30- to 60-day episodes. Meanwhile, 18 percent move to higher quality tiers, while 14 percent move to lower quality tiers. Between 30- and 60- day episodes, 32 percent hip replacement TINs change quality tiers compared to 61 percent CHF TINs, within the highest episode proportion peer group. Again, hip replacement TINs are more stable with respect to their risk adjusted quality tiers between 30- to 60- day episodes compared to CHF TINs (whose quality scores are more likely to change if mortality, avoidable readmissions and avoidable ED visits are higher for 60-day episodes. CHF TINs that are low quality in 30-day episodes need not be low quality in 60-day episodes, and vice versa.
Table 3(a). Stability of TIN’s Risk Adjusted Quality Tiers between 30- and 60-day Episodes of CHF for TINs in the Highest Episode Proportion Peer Group
(showing number of TINs in peer group, with percent of TINs in parentheses)
TINs in 30-Day Episode Risk Adjusted Quality
Tiers
TINs in 60-Day
Risk Adjusted Quality Tiers:
1
TINs in 60-Day
Risk Adjusted Quality Tiers:
2
TINs in 60-Day
Risk Adjusted Quality Tiers:
3
TINs in 60-Day
Risk Adjusted Quality Tiers:
4
TINs in 60-Day
Risk Adjusted Quality Tiers:
5 Total
1 80 32 18 4 0 134
(11.9) (4.8) (2.7) (0.6) (0.0) 19.9
2 29 42 33 22 8 134
(4.3) (6.2) (4.9) (3.3) (1.2) 19.9
3 13 38 35 31 19 136
(1.9) (5.6) (5.2) (4.6) (2.8) 20.2
4 8 15 32 37 43 135
(1.2) (2.2) (4.8) (5.5) (6.4) 20.0
5 6 7 16 40 66 135
(0.9) (1.0) (24.0) (5.9) (9.8) 20.0
Total 136 134 134 134 136 674
135
Table 3(b). Stability of TIN’s Risk Adjusted Quality Tiers between 30- and 60-day Episodes of Hip Replacement for TINs in the Highest Episode Proportion Peer Group (showing number of TINs in peer group, with percent of TINs in parentheses)
TINs in 30-Day Episode Risk
Adjusted Quality Tiers
TINs in 60-Day
Risk Adjusted Quality Tiers:
1
TINs in 60-Day
Risk Adjusted Quality Tiers:
2
TINs in 60-Day
Risk Adjusted Quality Tiers:
3
TINs in 60-Day
Risk Adjusted Quality Tiers:
4
TINs in 60-Day
Risk Adjusted Quality Tiers:
5 Total
1 56 16 2 0 0 74
(15.1) (4.3) (0.5) (0.0) (0.0) 20.0
2 12 44 18 0 0 74
(3.2) (11.9) (4.9) (0.0) (0.0) 20.0
3 4 9 45 15 2 75
(1.1) (2.4) (12.1) (4.0) (0.5) 20.2
4 2 4 6 49 13 74
(0.5) (1.1) (1.6) (13.2) (3.5) 20.0
5 0 1 4 10 59 74
(0.0) (0.3) (1.1) (2.7) (15.9) 20.0
Total 74 74 75 74 74 371
The correlation between 30- day and 60-day episode TIN performance rank scores for CHF and hip replacement across all peer groups was no different from that observed for quality tiers . Hence, changes in TIN’s performance score ranks, going from 30- to 60- day episodes were more likely to come from changes in TIN’s risk adjusted quality tiers than changes in TIN’s risk adjusted cost z-scores. Costs are therefore more stable than quality between 30- and 60-day episodes. For surgical MS-DRGs like hip replacement, knee replacement, cholecystectomy, back pain etc., there is relatively better stability between 30- and 60-day quality measures (data not shown). But for medical MS-DRGs like CHF, COPD, AMI, Pneumonia, etc., the stability between quality measures or tiers is much poorer between 30- and 60-day episodes. Moreover, 60-day episodes for MS-DRG capture more variation in both cost and quality at the TIN level and would hence be more useful for measuring TIN performance.
The stability of TIN performance measures between 30- and 60-day episodes in part depends on the number of performance score ranks chosen. With fewer performance score ranks, less variation would be captured across cost and quality, but there would be better stability between 30- and 60-day episodes.
We therefore recommend that CMS use 60-day episodes, as they capture more variation in cost, quality and performance across TINs.
136
137
APPENDIX 18 REGRESSION RESULTS FROM BENEFICIARY COST ANALYSES
138
Appendix Table 1: Regression of Non-Inpatient Medicare Expenditures, 2008, 5 State Data
Variable Parameter Estimate
Standard Error t Value
Significance Level
Intercept -4013.1410 51.5088 -77.91 <.0001 HCC1:HIV/AIDS 1872.7697 52.8595 35.43 <.0001 HCC2:Septicemia/Shock 1586.2575 27.9458 56.76 <.0001 HCC5:Opportunistic Infections 1245.2402 60.7164 20.51 <.0001 HCC7:Metastatic Cancer and Acute Leukemia 11509.0000 29.5854 389.01 <.0001 HCC8:Lung, Upper Digestive Tract, and Other Severe Cancers 4244.7535 33.8277 125.48 <.0001 HCC9:Lymphatic, Head and Neck,Brain and Other Major Cancers 4369.5404 25.5851 170.78 <.0001 HCC10:Breast, Prostate, Colorectal and Other Cancers and Tumors 1294.1345 12.3968 104.39 <.0001 HCC15:Diabetes with Renal or Periperal Circulatory Manifestation 3411.6830 18.8531 180.96 <.0001 HCC16:Diabetes with Neurologic or Other Specified Manifestation 2442.8708 19.9991 122.15 <.0001 HCC17:Diabetes with Acute Complications 1694.8273 83.7550 20.24 <.0001 HCC18:Diabetes with Ophthalmologic or Unspecified Manifestation 1448.3270 27.1503 53.34 <.0001 HCC19:Diabetes without Complication 867.9566 9.8396 88.21 <.0001 HCC21:Protein-Calorie Malnutrition 1284.4532 33.3310 38.54 <.0001 HCC25:End-Stage Liver Disease 1730.1151 60.5201 28.59 <.0001 HCC26:Cirrhosis of Liver 964.1681 51.4428 18.74 <.0001 HCC27:Chronic Hepatitis 986.6432 47.0538 20.97 <.0001 HCC31:Intestinal Obstruction/Perforation 877.0318 25.2661 34.71 <.0001 HCC32:Pancreatic Disease 1308.4536 29.2450 44.74 <.0001 HCC33:Inflammatory Bowel Disease: 1139.8479 36.4844 31.24 <.0001 HCC37:Bone/Joint/Muscle Infections/Necrosis 2375.3517 33.4964 70.91 <.0001 HCC38:Rheumatoid Arthritis and Inflammatory Connective Tissue Disease 1932.6650 15.7859 122.43 <.0001 HCC44:Severe Hematological Disorders 5410.3937 33.4490 161.75 <.0001 HCC45:Disorders of Immunity 5057.6082 36.6540 137.98 <.0001 HCC51:Drug/Alcohol Psychosis 1274.3841 44.7917 28.45 <.0001 HCC52:Drug/Alcohol Dependence 813.6742 38.7151 21.02 <.0001 HCC54:Schizophrenia 1474.0653 27.8146 53.00 <.0001 HCC55:Major Depressive, Bipolar, and Paranoid Disorders 2082.0958 16.3432 127.40 <.0001 HCC67:Quadriplegia, Other Extensive Paralysis 5171.9078 69.7595 74.14 <.0001 HCC68:Paraplegia 5168.7879 80.3944 64.29 <.0001 HCC69:Spinal Cord Disorders/Injuries 2300.5307 40.6913 56.54 <.0001 HCC70:Muscular Dystrophy 2237.4914 152.1078 14.71 <.0001
HCC161:Traumatic Amputation 4490.7121 87.7170 51.20 <.0001 HCC164:Major Complications of Medical Care and Trauma 2465.1049 18.9675 129.96 <.0001 HCC174:Major Organ Transplant Status 2676.6412 70.7004 37.86 <.0001 HCC176:Artificial Openings for Feeding or Elimination 2392.4598 36.8032 65.01 <.0001 HCC177:Amputation Status, Lower Limb/Amputation Complications 3316.5549 61.1490 54.24 <.0001 Female, age 35-44 174.4941 58.0574 3.01 0.0027 Female, age 45-54 353.1985 52.9319 6.67 <.0001 Female, age 55-59 942.5016 55.8763 16.87 <.0001 Female, age 60-64 1583.3279 54.6267 28.98 <.0001 Female, age 65-69 3084.7920 58.2739 52.94 <.0001 Female, age 70-74 3513.8629 58.6372 59.93 <.0001 Female, age 75-79 4024.8466 58.8254 68.42 <.0001 Female, age 80-84 4618.3774 59.1150 78.13 <.0001 Female, age 85-89 5162.9198 60.0448 85.98 <.0001 Female, age 90-94 5333.2527 63.1913 84.40 <.0001 Female, age 95 and older 4745.8615 73.8872 64.23 <.0001 Male, Infant - age 34 -51.0127 65.4571 -0.78 0.4358 Male, age 35-44 269.3770 57.7872 4.66 <.0001 Male, age 45-54 237.6909 52.9874 4.49 <.0001 Male, age 55-59 588.2119 56.6669 10.38 <.0001 Male, age 60-64 936.4716 55.3870 16.91 <.0001 Male, age 65-69 2791.3170 58.4879 47.72 <.0001 Male, age 70-74 3253.2558 59.0192 55.12 <.0001 Male, age 75-79 3658.6175 59.3767 61.62 <.0001 Male, age 80-84 4032.1907 60.0709 67.12 <.0001 Male, age 85-89 4251.2795 62.0442 68.52 <.0001 Male, age 90-94 4327.9768 70.1963 61.66 <.0001 Male, age 95 and older 3711.7544 106.3274 34.91 <.0001 African American 1312.9163 14.7102 89.25 <.0001 Other Race/Ethnicity -1047.9140 28.6967 -36.52 <.0001 Asian -1779.7571 23.3213 -76.31 <.0001 Hispanic 143.4678 22.9154 6.26 <.0001 Native American -747.6035 55.2557 -13.53 <.0001 Disabled Medicare Entitled 2926.0109 33.4827 87.39 <.0001 Medicaid Enrolled 1006.1763 11.0012 91.46 <.0001
145
Analysis of Variance Sum of Mean Source DF Squares Square F Value Pr > F Model 100 4.054134E14 4.054134E12 25160.5 <.0001 Error 1.07E7 1.718504E15 161130811 Corrected Total 1.07E7 2.123918E15 Root MSE 12694 R-Square 0.1909 Dependent Mean 8054.69209 Adj R-Sq 0.1909 Coeff Var 157.59424
146
Appendix Table 3: Inpatient Medicare Expenditures, Two-Part Model of Probit of Any Inpatient Expenditures and Regression of Positive Expenditures, 2008, 5 State Data Part 1 – Probit
HCC78:Respiratory Arrest 9102.5260 364.9704 24.94 <.0001 HCC81:Acute Myocardial Infarction 2119.8387 105.3801 20.12 <.0001 HCC92:Specified Heart Arrhythmias: 404.9418 42.0245 9.64 <.0001 HCC95:Cerebral Hemorrhage 2252.0543 178.4627 12.62 <.0001 HCC96:Ischemic or Unspecified Stroke 407.0904 64.2315 6.34 <.0001 HCC100:Hemiplegia/Hemiparesis 743.8959 114.6578 6.49 <.0001 HCC101:Cerebral Palsy and Other Paralytic Syndromes 513.5209 256.1991 2.00 0.0450 HCC104:Vascular Disease with Complications 3468.3804 77.8034 44.58 <.0001 HCC105:Vascular Disease 1003.7289 40.1175 25.02 <.0001 HCC107:Cystic Fibrosis 15714.0000 751.9837 20.90 <.0001 HCC111:Aspiration and Specified Bacterial Pneumonias 3176.6108 114.1141 27.84 <.0001 HCC119:Proliferative Diabetic Retinopathy and Vitreous Hemorrhage 2419.2969 121.2054 19.96 <.0001 HCC130:Dialysis Status 10978.0000 98.9186 110.98 <.0001 HCC131:Renal Failure 3501.9876 47.1860 74.22 <.0001 HCC132:Nephritis 1561.6298 279.3390 5.59 <.0001 HCC148:Decubitus Ulcer of Skin 2847.1394 100.9628 28.20 <.0001 HCC149:Chronic Ulcer of Skin, Except Decubitus 1796.3259 79.8419 22.50 <.0001 HCC150:Extensive Third-Degree Burns 12922.0000 0.5221 24750.10 <.0001 HCC154:Severe Head Injury 3819.2263 905.1852 4.22 <.0001 HCC155:Major Head Injury -111.4068 158.5240 -0.70 0.4822 HCC157:Vertebral Fractures without Spinal Cord Injury 387.6743 103.7321 3.74 0.0002 HCC158:Hip Fracture/Dislocation 169.4987 101.9438 1.66 0.0964 HCC161:Traumatic Amputation 1277.9376 271.7693 4.70 <.0001 HCC164:Major Complications of Medical Care and Trauma 1420.6905 64.9149 21.89 <.0001 HCC174:Major Organ Transplant Status 9931.6624 235.1386 42.24 <.0001 HCC176:Artificial Openings for Feeding or Elimination 1996.2250 126.6161 15.77 <.0001 HCC177:Amputation Status, Lower Limb/Amputation Complications 2383.6777 187.5694 12.71 <.0001 Female, age 35-44 -615.8349 222.1024 -2.77 0.0056 Female, age 45-54 -146.5679 201.1024 -0.73 0.4661 Female, age 55-59 656.4500 212.0415 3.10 0.0020 Female, age 60-64 1356.9967 206.8694 6.56 <.0001 Female, age 65-69 812.5352 212.3047 3.83 0.0001 Female, age 70-74 431.5516 213.0823 2.03 0.0428 Female, age 75-79 38.6573 212.9762 0.18 0.8560 Female, age 80-84 -940.4199 213.2058 -4.41 <.0001
151
Variable Parameter Estimate
Standard Error t Value
Significance Level
Female, age 85-89 -2287.0520 215.4240 -10.62 <.0001 Female, age 90-94 -3773.6089 224.4837 -16.81 <.0001 Female, age 95 and older -4982.0201 258.1718 -19.30 <.0001 Male, Infant - age 34 2584.5324 258.4660 10.00 <.0001 Male, age 35-44 1600.0789 222.2605 7.20 <.0001 Male, age 45-54 2647.1943 200.9060 13.18 <.0001 Male, age 55-59 3669.0413 214.2200 17.13 <.0001 Male, age 60-64 3945.5394 209.8190 18.80 <.0001 Male, age 65-69 3521.2321 213.2717 16.51 <.0001 Male, age 70-74 2816.4908 214.6993 13.12 <.0001 Male, age 75-79 2475.4650 215.1280 11.51 <.0001 Male, age 80-84 1305.8693 216.6907 6.03 <.0001 Male, age 85-89 -321.5741 221.8663 -1.45 0.1472 Male, age 90-94 -2209.9430 244.7424 -9.03 <.0001 Male, age 95 and older -3529.1267 348.5028 -10.13 <.0001 African American 3776.0094 54.9764 68.68 <.0001 Other Race/Ethnicity 3395.4452 143.0239 23.74 <.0001 Asian 3942.0327 120.3369 32.76 <.0001 Hispanic 2445.9490 98.5347 24.82 <.0001 Native American 309.8605 208.1736 1.49 0.1366 Disabled Medicare Entitled 645.2862 110.8287 5.82 <.0001 Medicaid Enrolled 1254.5543 41.4289 30.28 <.0001 HCC19:Diabetes without Complication (w/o ASC diagnoses) 91.8765 42.1183 2.18 0.0292 HCC79:Cardio-Respiratory Failure and Shock (w/o ASC diagnoses) 3256.8809 62.8155 51.85 <.0001 HCC80:Congestive Heart Failure (w/o ASC diagnoses) 2655.5322 41.8248 63.49 <.0001 HCC82:Unstable Angina and Other Acute Ischemic Heart Disease (w/o ASC diagnoses) 1303.8367 74.9445 17.40 <.0001 HCC83:Angina Pectoris/Old Myocardial Infarction (w/o ASC diagnoses) -125.0894 58.0735 -2.15 0.0312 HCC108:Chronic Obstructive Pulmonary (w/o ASC diagnoses) 119.2921 38.2382 3.12 0.0018 HCC112:Pneumococcal Pneumonia, Emphysema, Lung Abscess (w/o ASC diagnoses) 1570.2906 171.0283 9.18 <.0001
152
Model Fit Summary Number of Endogenous Variables 2 Number of Observations 10665376 Log Likelihood -38198796 Maximum Absolute Gradient 90.97123 Number of Iterations 94 Optimization Method Quasi-Newton AIC 76397980 Schwarz Criterion 76400732
153
Appendix Table 4: Inpatient Medicare Expenditures, Two-Part Model of Probit of Any Inpatient Expenditures and Regression of Positive Expenditures, 2009, 5 State Data Part 1 - Probit
Model Fit Summary Number of Endogenous Variables 2 Number of Observations 10665376 Log Likelihood -37562647 Maximum Absolute Gradient 110.08431 Number of Iterations 90 Optimization Method Quasi-Newton
Level Trauma in Episode HCC67:Quadriplegia, Other Extensive Paralysis 0.3792 0.1137 -3.34 0.0008 Trauma in Episode HCC68:Paraplegia 0.3055 0.0987 -3.1 0.002 Trauma in Episode HCC69:Spinal Cord Disorders/Injuries 0.4205 0.0724 -5.81 <.0001 Trauma in Episode HCC75:Coma, Brain Compression/Anoxic Damage 0.6032 0.0532 -11.34 <.0001 Trauma in Episode HCC154:Severe Head Injury 0.8021 0.4157 -1.93 0.0537 Trauma in Episode HCC155:Major Head Injury 0.2944 0.0617 -4.77 <.0001 Trauma in Episode HCC157:Vertebral Fractures without Spinal Cord Injury 0.1386 0.0498 -2.78 0.0054 Trauma in Episode HCC158:Hip Fracture/Dislocation 0.3805 0.0469 -8.11 <.0001 Trauma in Episode HCC161:Traumatic Amputation 0.6112 0.1419 -4.31 <.0001 Trauma in Episode HCC164:Major Complications of Medical Care and Trauma 0.8817 0.0252 -35.04 <.0001 Trauma in Episode HCC177:Amputation Status, Lower Limb/Amputation Complications 0.2284 0.0923 -2.47 0.0134 Female, Infant - age 34 -2.16 0.3995 5.41 <.0001 Female, age 35-44 -0.7626 0.3415 2.23 0.0255 Female, age 45-54 -0.9986 0.3164 3.16 0.0016 Female, age 55-59 -1.0683 0.3145 3.4 0.0007 Female, age 60-64 -0.7679 0.3049 2.52 0.0118 Female, age 65-69 0.2362 0.0698 -3.39 0.0007 Female, age 70-74 0.2951 0.0654 -4.51 <.0001 Female, age 75-79 0.2703 0.0624 -4.33 <.0001 Female, age 80-84 0.1999 0.0608 -3.29 0.001 Female, age 85-89 0.1584 0.0602 -2.63 0.0085 Female, age 90-94 0.0754 0.0605 -1.25 0.2123 Female, age 95 and older 0.0202 0.0659 -0.31 0.7596 Male, Infant - age 34 -1.1251 0.4308 2.61 0.009 Male, age 35-44 -0.8631 0.3569 2.42 0.0156 Male, age 45-54 -0.9798 0.311 3.15 0.0016 Male, age 55-59 -0.7081 0.3189 2.22 0.0264 Male, age 60-64 -0.6282 0.3063 2.05 0.0403 Male, age 65-69 0.4193 0.0658 -6.37 <.0001 Male, age 70-74 0.3853 0.0644 -5.99 <.0001 Male, age 75-79 0.3859 0.0627 -6.15 <.0001 Male, age 80-84 0.2873 0.062 -4.64 <.0001 Male, age 85-89 0.1255 0.0616 -2.04 0.0415 Male, age 90-94 0.0571 0.0639 -0.89 0.3715 Male, age 95 and older 0 0 . . Disability 1.2912 0.323 -4 <.0001 Dual Eligible -0.0064 0.0157 0.41 0.6847
173
Parameter Estimate Standard
Error Z Value Significance
Level Medicare-Aged -0.1822 0.08 -2.28 0.0228 Medicare-Disabled 0.1261 0.1313 0.96 0.3367 Medicare-ESRD 0 0 . . MS-DRG: Complications and Comorbidity -0.0612 0.0189 3.24 0.0012 MS-DRG:Major Complications and Comorbidity 0.1046 0.0179 -5.84 <.0001 Number of IP visits in last 12 months for condition 0.0036 0.0037 0.98 0.3292 Number of ED visits in last 12 months for condition -0.0612 0.0482 -1.27 0.2035
174
Table 2 : AMI with PTCA- Regression of 30-day Episode Costs for AMI with PTCA Episodes (N=13,679)
Parameter Estimate Standard
Error Z Value Significance
Level Intercept 11.716 6.3841 1.84 0.0665 HCC1:HIV/AIDS -0.0165 0.1147 0.14 0.8854 HCC2:Septicemia/Shock 0.0148 0.0686 -0.22 0.8288 HCC5:Opportunistic Infections 0.0151 0.1203 -0.13 0.9003 HCC7:Metastatic Cancer and Acute Leukemia 0.2265 0.0775 -2.92 0.0035 HCC8:Lung, Upper Digestive Tract, and Other Severe Cancers 0.0197 0.0718 -0.27 0.7836 HCC9:Lymphatic, Head and Neck,Brain and Other Major Cancers -0.0421 0.0587 0.72 0.473 HCC10:Breast, Prostate, Colorectal and Other Cancers and Tumors -0.0236 0.0372 0.64 0.5245 HCC15:Diabetes with Renal or Peripheral Circulatory Manifestation 0.1389 0.045 -3.09 0.002 HCC16:Diabetes with Neurologic or Other Specified Manifestation 0.1027 0.0457 -2.25 0.0247 HCC17:Diabetes with Acute Complications 0.1849 0.2154 -0.86 0.3905 HCC18:Diabetes with Ophthalmologic or Unspecified Manifestation 0.2776 0.0694 -4 <.0001 HCC19:Diabetes without Complication 0.051 0.0315 -1.62 0.1046 HCC21:Protein-Calorie Malnutrition -0.0204 0.0743 0.27 0.7839 HCC25:End-Stage Liver Disease -0.0178 0.1643 0.11 0.9138 HCC26:Cirrhosis of Liver 0.0426 0.1716 -0.25 0.8039 HCC27:Chronic Hepatitis 0.0476 0.1209 -0.39 0.694 HCC31:Intestinal Obstruction/Perforation 0.0284 0.0571 -0.5 0.6193 HCC32:Pancreatic Disease -0.0409 0.0655 0.63 0.5318 HCC33:Inflammatory Bowel Disease: 0.0297 0.0909 -0.33 0.7437 HCC37:Bone/Joint/Muscle Infections/Necrosis -0.0641 0.0726 0.88 0.3776 HCC38:Rheumatoid Arthritis and Inflammatory Connective Tissue Disease 0.075 0.0472 -1.59 0.1121 HCC44:Severe Hematological Disorders 0.0552 0.0831 -0.66 0.5071 HCC45:Disorders of Immunity 0.1185 0.0867 -1.37 0.1718 HCC51:Drug/Alcohol Psychosis -0.0221 0.1067 0.21 0.8357 HCC52:Drug/Alcohol Dependence 0.2113 0.0956 -2.21 0.027 HCC54:Schizophrenia 0.0531 0.1267 -0.42 0.6749 HCC55:Major Depressive, Bipolar, and Paranoid Disorders 0.0798 0.0537 -1.49 0.1374 HCC67:Quadriplegia, Other Extensive Paralysis 0.1724 0.2751 -0.63 0.5309 HCC68:Paraplegia 0.4646 0.2232 -2.08 0.0374 HCC69:Spinal Cord Disorders/Injuries 0.0246 0.0996 -0.25 0.8048 HCC70:Muscular Dystrophy 0.5949 0.5815 -1.02 0.3063 HCC71:Polyneuropathy: 0.0196 0.0384 -0.51 0.6101 HCC72:Multiple Sclerosis 0.0951 0.1692 -0.56 0.5743 HCC73:Parkinsons and Huntingtons Diseases 0.2837 0.0748 -3.8 0.0001 HCC74:Seizure Disorders and Convulsions 0.12 0.0545 -2.2 0.0275
175
Parameter Estimate Standard
Error Z Value Significance
Level HCC75:Coma, Brain Compression/Anoxic Damage 0.1367 0.1529 -0.89 0.3715 HCC77:Respirator Dependence/Tracheostomy Status 0.2008 0.2171 -0.92 0.355 HCC78:Respiratory Arrest 0.0661 0.2503 -0.26 0.7918 HCC79:Cardio-Respiratory Failure and Shock 0.0978 0.045 -2.17 0.0298 HCC80:Congestive Heart Failure 0.0389 0.0296 -1.31 0.1897 HCC81:Acute Myocardial Infarction -0.0802 0.0381 2.1 0.0354 HCC82:Unstable Angina and Other Acute Ischemic Heart Disease -0.1451 0.0407 3.56 0.0004 HCC83:Angina Pectoris/Old Myocardial Infarction -0.1391 0.0352 3.95 <.0001 HCC92:Specified Heart Arrhythmias: 0.0488 0.0315 -1.55 0.1208 HCC95:Cerebral Hemorrhage -0.0098 0.1509 0.06 0.9483 HCC96:Ischemic or Unspecified Stroke 0.1543 0.042 -3.68 0.0002 HCC100:Hemiplegia/Hemiparesis 0.1356 0.066 -2.05 0.0399 HCC101:Cerebral Palsy and Other Paralytic Syndromes 0.0228 0.1561 -0.15 0.8841 HCC104:Vascular Disease with Complications 0.1075 0.0493 -2.18 0.0294 HCC105:Vascular Disease 0.1231 0.0309 -3.99 <.0001 HCC107:Cystic Fibrosis 0.9992 0.3769 -2.65 0.008 HCC108:Chronic Obstructive Pulmonary Disease 0.1018 0.0295 -3.46 0.0005 HCC111:Aspiration and Specified Bacterial Pneumonias 0.0681 0.0837 -0.81 0.4161 HCC112:Pneumococcal Pneumonia, Emphysema, Lung Abscess 0.0546 0.1333 -0.41 0.6818 HCC119:Proliferative Diabetic Retinopathy and Vitreous Hemorrhage 0.0349 0.0764 -0.46 0.6474 HCC130:Dialysis Status 0.1029 0.1154 -0.89 0.3727 HCC131:Renal Failure 0.0941 0.0355 -2.65 0.0081 HCC132:Nephritis 0.1059 0.1898 -0.56 0.577 HCC148:Decubitus Ulcer of Skin 0.1745 0.0816 -2.14 0.0326 HCC149:Chronic Ulcer of Skin, Except Decubitus 0.1665 0.0533 -3.12 0.0018 HCC154:Severe Head Injury -1.9738 0.1937 10.19 <.0001 HCC155:Major Head Injury 0.1383 0.1263 -1.09 0.2736 HCC157:Vertebral Fractures without Spinal Cord Injury -0.1675 0.0595 2.81 0.0049 HCC158:Hip Fracture/Dislocation 0.2868 0.0919 -3.12 0.0018 HCC161:Traumatic Amputation 0.0528 0.2629 -0.2 0.8409 HCC164:Major Complications of Medical Care and Trauma 0.1369 0.0521 -2.63 0.0087 HCC174:Major Organ Transplant Status 0.1875 0.1674 -1.12 0.2628 HCC176:Artificial Openings for Feeding or Elimination -0.2911 0.1192 2.44 0.0146 HCC177:Amputation Status, Lower Limb/Amputation Complications -0.146 0.1203 1.21 0.225 Trauma in Episode HCC67:Quadriplegia, Other Extensive Paralysis 0.7674 0.2135 -3.59 0.0003 Trauma in Episode HCC68:Paraplegia 0.8442 0.3452 -2.45 0.0145 Trauma in Episode HCC69:Spinal Cord Disorders/Injuries 0.2713 0.1347 -2.01 0.044 Trauma in Episode HCC75:Coma, Brain Compression/Anoxic Damage 0.5756 0.1269 -4.53 <.0001 Trauma in Episode HCC154:Severe Head Injury 0.6927 0.3071 -2.26 0.0241 Trauma in Episode HCC155:Major Head Injury 0.8342 0.1694 -4.92 <.0001
176
Parameter Estimate Standard
Error Z Value Significance
Level Trauma in Episode HCC157:Vertebral Fractures without Spinal Cord Injury 0.2868 0.1122 -2.56 0.0106 Trauma in Episode HCC158:Hip Fracture/Dislocation 0.8945 0.119 -7.52 <.0001 Trauma in Episode HCC161:Traumatic Amputation 0.7036 0.276 -2.55 0.0108 Trauma in Episode HCC164:Major Complications of Medical Care and Trauma 0.3708 0.0439 -8.45 <.0001 Trauma in Episode HCC177:Amputation Status, Lower Limb/Amputation Complications 0.0765 0.1784 -0.43 0.668 Female, Infant - age 34 -0.9837 0.4419 2.23 0.026 Female, age 35-44 -0.5578 0.4529 1.23 0.2181 Female, age 45-54 -0.81 0.4055 2 0.0458 Female, age 55-59 -0.6689 0.4022 1.66 0.0963 Female, age 60-64 -0.3102 0.4108 0.76 0.4501 Female, age 65-69 -0.4085 0.2591 1.58 0.1149 Female, age 70-74 -0.4169 0.2578 1.62 0.1058 Female, age 75-79 -0.2321 0.2569 0.9 0.3663 Female, age 80-84 -0.1029 0.2568 0.4 0.6888 Female, age 85-89 -0.0731 0.2578 0.28 0.7768 Female, age 90-94 -0.0337 0.263 0.13 0.8981 Female, age 95 and older -0.0757 0.297 0.25 0.7989 Male, Infant - age 34 0.4899 0.6446 -0.76 0.4472 Male, age 35-44 -1.0625 0.4091 2.6 0.0094 Male, age 45-54 -0.6531 0.4009 1.63 0.1033 Male, age 55-59 -0.8228 0.3981 2.07 0.0388 Male, age 60-64 -0.6204 0.3902 1.59 0.1119 Male, age 65-69 -0.3758 0.2589 1.45 0.1467 Male, age 70-74 -0.3582 0.2575 1.39 0.1643 Male, age 75-79 -0.2438 0.2591 0.94 0.3468 Male, age 80-84 -0.2447 0.2573 0.95 0.3417 Male, age 85-89 -0.2351 0.259 0.91 0.3639 Male, age 90-94 -0.0933 0.2699 0.35 0.7296 Male, age 95 and older 0 0 . . Disability 0.4971 0.2364 -2.1 0.0355 Dual Eligible 0.1251 0.0335 -3.74 0.0002 Medicare-Aged -0.1935 0.1444 -1.34 0.1802 Medicare-Disabled 0.1553 0.1914 0.81 0.4173 Medicare-ESRD 0 0 . . MS-DRG: DRUG ELUTING STENT -0.0888 0.038 2.34 0.0194 MS-DRG:Major Complications and Comorbidity 0.3967 0.0346 -11.47 <.0001 Number of IP visits in last 12 months for condition 0.0221 0.0076 2.92 0.0035 Number of ED visits in last 12 months for condition 0.0062 0.078 0.08 0.937
177
Table 3 : AMI with CABG- Regression of 30-day Episode Costs for AMI with CABG Episodes (N=2,559)
Parameter Estimate Standard
Error Z
Value Significance
Level Intercept 34.6825 3.3307 10.41 <.0001 HCC1:HIV/AIDS -0.0026 0.4578 0.01 0.9955 HCC2:Septicemia/Shock -0.041 0.1042 0.39 0.6941 HCC5:Opportunistic Infections -0.7674 0.1533 5.01 <.0001 HCC7:Metastatic Cancer and Acute Leukemia 0.1111 0.1705 -0.65 0.5146 HCC8:Lung, Upper Digestive Tract, and Other Severe Cancers -0.1196 0.1596 0.75 0.4535 HCC9:Lymphatic, Head and Neck,Brain and Other Major Cancers 0.0808 0.1051 -0.77 0.442 HCC10:Breast, Prostate, Colorectal and Other Cancers and Tumors 0.1071 0.0469 -2.28 0.0223 HCC15:Diabetes with Renal or Peripheral Circulatory Manifestation 0.1218 0.0648 -1.88 0.0604 HCC16:Diabetes with Neurologic or Other Specified Manifestation 0.0783 0.0736 -1.06 0.2873 HCC17:Diabetes with Acute Complications 0.2332 0.1631 -1.43 0.1527 HCC18:Diabetes with Ophthalmologic or Unspecified Manifestation 0.1195 0.1057 -1.13 0.2582 HCC19:Diabetes without Complication 0.037 0.035 -1.06 0.2906 HCC21:Protein-Calorie Malnutrition 0.1129 0.1551 -0.73 0.4666 HCC25:End-Stage Liver Disease 0.009 0.2987 -0.03 0.9758 HCC26:Cirrhosis of Liver -0.3462 0.2032 1.7 0.0884 HCC27:Chronic Hepatitis -0.1521 0.2153 0.71 0.4799 HCC31:Intestinal Obstruction/Perforation 0.0229 0.1065 -0.21 0.8299 HCC32:Pancreatic Disease 0.0579 0.1119 -0.52 0.6051 HCC33:Inflammatory Bowel Disease: -0.0394 0.1201 0.33 0.743 HCC37:Bone/Joint/Muscle Infections/Necrosis 0.027 0.1375 -0.2 0.8443 HCC38:Rheumatoid Arthritis and Inflammatory Connective Tissue Disease 0.0674 0.0547 -1.23 0.218 HCC44:Severe Hematological Disorders -0.0906 0.1018 0.89 0.3738 HCC45:Disorders of Immunity -0.0062 0.108 0.06 0.9545 HCC51:Drug/Alcohol Psychosis 0.128 0.1943 -0.66 0.5101 HCC52:Drug/Alcohol Dependence -0.1749 0.155 1.13 0.2591 HCC54:Schizophrenia -0.0513 0.1368 0.38 0.7076 HCC55:Major Depressive, Bipolar, and Paranoid Disorders 0.0366 0.089 -0.41 0.6811 HCC67:Quadriplegia, Other Extensive Paralysis 1.0256 0.2355 -4.36 <.0001 HCC68:Paraplegia 0.177 0.212 -0.83 0.404 HCC69:Spinal Cord Disorders/Injuries 0.1152 0.1918 -0.6 0.5482 HCC70:Muscular Dystrophy 0.3755 0.2089 -1.8 0.0723 HCC71:Polyneuropathy: 0.0115 0.0551 -0.21 0.8343 HCC72:Multiple Sclerosis 0.1543 0.2032 -0.76 0.4476 HCC73:Parkinsons and Huntingtons Diseases 0.247 0.1291 -1.91 0.0557 HCC74:Seizure Disorders and Convulsions 0.0641 0.1074 -0.6 0.5504
178
Parameter Estimate Standard
Error Z
Value Significance
Level HCC75:Coma, Brain Compression/Anoxic Damage 0.1148 0.3167 -0.36 0.7169 HCC77:Respirator Dependence/Tracheostomy Status -0.2403 0.3163 0.76 0.4474 HCC78:Respiratory Arrest 0.1198 0.2826 -0.42 0.6715 HCC79:Cardio-Respiratory Failure and Shock 0.0928 0.0748 -1.24 0.2148 HCC80:Congestive Heart Failure 0.0754 0.0444 -1.7 0.0892 HCC81:Acute Myocardial Infarction -0.004 0.0515 0.08 0.9388 HCC82:Unstable Angina and Other Acute Ischemic Heart Disease -0.0102 0.0476 0.22 0.8297 HCC83:Angina Pectoris/Old Myocardial Infarction -0.0398 0.0471 0.85 0.3978 HCC92:Specified Heart Arrhythmias: 0.0393 0.0514 -0.77 0.4442 HCC95:Cerebral Hemorrhage 0.0128 0.2114 -0.06 0.9517 HCC96:Ischemic or Unspecified Stroke 0.1446 0.0685 -2.11 0.0346 HCC100:Hemiplegia/Hemiparesis 0.2879 0.1124 -2.56 0.0104 HCC101:Cerebral Palsy and Other Paralytic Syndromes 0.0959 0.2338 -0.41 0.6817 HCC104:Vascular Disease with Complications 0.0902 0.079 -1.14 0.2538 HCC105:Vascular Disease 0.0449 0.0386 -1.16 0.2442 HCC108:Chronic Obstructive Pulmonary Disease 0.0621 0.0415 -1.5 0.134 HCC111:Aspiration and Specified Bacterial Pneumonias -0.1973 0.1602 1.23 0.2183 HCC112:Pneumococcal Pneumonia, Emphysema, Lung Abscess -0.1029 0.1586 0.65 0.5165 HCC119:Proliferative Diabetic Retinopathy and Vitreous Hemorrhage 0.1219 0.0908 -1.34 0.1793 HCC130:Dialysis Status 0.2062 0.1953 -1.06 0.2911 HCC131:Renal Failure 0.051 0.0491 -1.04 0.2995 HCC132:Nephritis -0.338 0.1433 2.36 0.0183 HCC148:Decubitus Ulcer of Skin 0.3957 0.2412 -1.64 0.1009 HCC149:Chronic Ulcer of Skin, Except Decubitus 0.3591 0.1043 -3.44 0.0006 HCC154:Severe Head Injury -0.4227 0.3301 1.28 0.2004 HCC155:Major Head Injury -0.0431 0.1632 0.26 0.7915 HCC157:Vertebral Fractures without Spinal Cord Injury 0.0182 0.1384 -0.13 0.8953 HCC158:Hip Fracture/Dislocation 0.1221 0.1283 -0.95 0.3411 HCC161:Traumatic Amputation 0.5017 0.2589 -1.94 0.0527 HCC164:Major Complications of Medical Care and Trauma -0.0602 0.0714 0.84 0.3992 HCC174:Major Organ Transplant Status -0.0782 0.154 0.51 0.6115 HCC176:Artificial Openings for Feeding or Elimination -0.164 0.2129 0.77 0.441 HCC177:Amputation Status, Lower Limb/Amputation Complications 0.061 0.226 -0.27 0.7872 Trauma in Episode HCC67:Quadriplegia, Other Extensive Paralysis 0.3581 0.1419 -2.52 0.0116 Trauma in Episode HCC68:Paraplegia 0.8864 0.1911 -4.64 <.0001 Trauma in Episode HCC69:Spinal Cord Disorders/Injuries 0.5489 0.2911 -1.89 0.0593 Trauma in Episode HCC75:Coma, Brain Compression/Anoxic Damage 0.5564 0.1176 -4.73 <.0001 Trauma in Episode HCC155:Major Head Injury 0.7389 0.1841 -4.01 <.0001 Trauma in Episode HCC157:Vertebral Fractures without Spinal Cord Injury 0.4316 0.1581 -2.73 0.0063
179
Parameter Estimate Standard
Error Z
Value Significance
Level Trauma in Episode HCC158:Hip Fracture/Dislocation -0.3259 0.2631 1.24 0.2155 Trauma in Episode HCC161:Traumatic Amputation 0.7733 0.3308 -2.34 0.0194 Trauma in Episode HCC164:Major Complications of Medical Care and Trauma 0.2217 0.0346 -6.41 <.0001 Trauma in Episode HCC177:Amputation Status, Lower Limb/Amputation Complications -0.5425 0.2849 1.9 0.0569 Female, Infant - age 34 0.1846 0.4716 -0.39 0.6954 Female, age 35-44 0.5613 0.2768 -2.03 0.0426 Female, age 45-54 1.1524 0.3123 -3.69 0.0002 Female, age 55-59 0.6528 0.242 -2.7 0.007 Female, age 60-64 0.6822 0.1637 -4.17 <.0001 Female, age 65-69 0.9526 0.129 -7.39 <.0001 Female, age 70-74 1.1025 0.1221 -9.03 <.0001 Female, age 75-79 1.1739 0.1238 -9.48 <.0001 Female, age 80-84 1.2852 0.1224 -10.5 <.0001 Female, age 85-89 1.4721 0.1322 -11.13 <.0001 Female, age 90-94 1.2308 0.309 -3.98 <.0001 Male, Infant - age 34 0.3421 0.2816 -1.21 0.2244 Male, age 35-44 0.3549 0.2743 -1.29 0.1958 Male, age 45-54 0.4919 0.2282 -2.16 0.0311 Male, age 55-59 0.5683 0.2221 -2.56 0.0105 Male, age 60-64 0.4596 0.2122 -2.17 0.0303 Male, age 65-69 0.968 0.1187 -8.16 <.0001 Male, age 70-74 1.101 0.122 -9.03 <.0001 Male, age 75-79 1.1601 0.1212 -9.57 <.0001 Male, age 80-84 1.2523 0.1214 -10.32 <.0001 Male, age 85-89 1.2867 0.1353 -9.51 <.0001 Male, age 90-94 1.4839 0.3437 -4.32 <.0001 Male, age 95 and older 0 0 . . Disability 0.0319 0.2784 -0.11 0.9088 Dual Eligible 0.0114 0.0399 -0.29 0.7748 Medicare-Aged 0.0973 0.1908 0.51 0.6098 Medicare-Disabled -0.3431 0.2076 -1.65 0.0985 Medicare-ESRD 0 0 . . MS-DRG: PTCA 0.1861 0.0744 -2.5 0.0123 MS-DRG:Major Complications and Comorbidity 0.5714 0.0909 -6.28 <.0001 Number of IP visits in last 12 months for condition 0.015 0.0185 0.81 0.4187 Number of ED visits in last 12 months for condition -0.0617 0.0895 -0.69 0.4911 Death in episode window 0.1861 0.0744 -2.5 0.0123
180
Table 4: CHF- Regression of 30-day Episode Costs for CHF Episodes (N=107,185)
Trauma in Episode HCC154:Severe Head Injury -0.6522 0.3205 4.14 0.0418
Trauma in Episode HCC155:Major Head Injury -0.6524 0.0617 111.8 <.0001
Trauma in Episode HCC157:Vertebral Fractures without Spinal Cord Injury -0.3705 0.0379 95.48 <.0001
Trauma in Episode HCC158:Hip Fracture/Dislocation -0.763 0.047 263.73 <.0001
Trauma in Episode HCC161:Traumatic Amputation -0.5004 0.1012 24.46 <.0001 Trauma in Episode HCC164:Major Complications of Medical Care and Trauma -1.0625 0.0208 2605.04 <.0001 Trauma in Episode HCC177:Amputation Status, Lower Limb/Amputation Complications -0.1718 0.0533 10.4 0.0013
Female, Infant - age 34 -0.359 0.2175 2.72 0.0988
Female, age 35-44 -0.3015 0.1942 2.41 0.1206
Female, age 45-54 -0.3359 0.1872 3.22 0.0728
Female, age 55-59 -0.2874 0.1873 2.35 0.1249
Female, age 60-64 -0.3686 0.1852 3.96 0.0466
Female, age 65-69 -0.062 0.0399 2.41 0.1205
Female, age 70-74 -0.0645 0.0385 2.8 0.094
Female, age 75-79 -0.0842 0.0377 4.98 0.0256
Female, age 80-84 -0.0861 0.0372 5.37 0.0204
Female, age 85-89 -0.0728 0.0371 3.85 0.0497
Female, age 90-94 -0.0807 0.0378 4.54 0.033
Female, age 95 and older -0.0441 0.0413 1.14 0.2859
Male, Infant - age 34 -0.5106 0.2056 6.17 0.013
Male, age 35-44 -0.3583 0.191 3.52 0.0607
Male, age 45-54 -0.4746 0.1862 6.5 0.0108
Male, age 55-59 -0.4144 0.1865 4.94 0.0263
Male, age 60-64 -0.4006 0.1836 4.76 0.0291
Male, age 65-69 -0.0908 0.0393 5.34 0.0208
Male, age 70-74 -0.0225 0.0384 0.34 0.558
Male, age 75-79 -0.0453 0.0378 1.44 0.2308
Male, age 80-84 -0.0495 0.0374 1.75 0.1863
Male, age 85-89 -0.0585 0.0377 2.41 0.1205
Male, age 90-94 -0.0072 0.0398 0.03 0.8567
Male, age 95 and older 0 0 . .
Disability 0.3818 0.1884 4.11 0.0427
Dual Eligible -0.0258 0.0079 10.78 0.001
183
Parameter Estimate Standard
Error
Wald Chi-
Square Significance
Level
Medicare-Aged -0.1047 0.0357 8.59 0.0034
Medicare-Disabled -0.0282 0.0567 0.25 0.6183
Medicare-ESRD 0 0 . .
MS-DRG: Complications and Comorbidity -0.1909 0.0086 492.16 <.0001
MS-DRG:Major Complications and Comorbidity -0.3522 0.0089 1558.6 <.0001
Number of IP visits in last 12 months for condition 0.0133 0.0042 10.14 0.0015
Number of ED visits in last 12 months for condition -0.0027 0.0038 0.51 0.4748
Death in episode window 0.5577 0.0125 1979.69 <.0001
184
Table 5: COPD- Regression of 30-day Episode Costs for COPD Episodes (N=78,760)
Trauma in Episode HCC154:Severe Head Injury 0.7758 0.0497 15.6 <.0001
Trauma in Episode HCC155:Major Head Injury 0.6995 0.0847 8.26 <.0001
Trauma in Episode HCC157:Vertebral Fractures without Spinal Cord Injury 0.5239 0.0411 12.74 <.0001
Trauma in Episode HCC158:Hip Fracture/Dislocation 1.0286 0.0548 18.76 <.0001
Trauma in Episode HCC161:Traumatic Amputation 0.4913 0.0321 15.32 <.0001 Trauma in Episode HCC164:Major Complications of Medical Care and Trauma 0.9689 0.0333 29.12 <.0001 Trauma in Episode HCC177:Amputation Status, Lower Limb/Amputation Complications 0.0978 0.1117 0.88 0.3814
Female, Infant - age 34 -0.1521 0.2312 -0.66 0.5106
Female, age 35-44 -0.2348 0.2185 -1.07 0.2824
Female, age 45-54 -0.0651 0.2097 -0.31 0.7561
Female, age 55-59 0.0524 0.2096 0.25 0.8027
Female, age 60-64 0.0692 0.2055 0.34 0.7362
Female, age 65-69 -0.4186 0.0775 -5.4 <.0001
Female, age 70-74 -0.3814 0.0767 -4.98 <.0001
Female, age 75-79 -0.2593 0.0761 -3.41 0.0007
Female, age 80-84 -0.1795 0.0759 -2.37 0.018
Female, age 85-89 -0.0514 0.0762 -0.68 0.4996
Female, age 90-94 -0.028 0.0781 -0.36 0.7205
Female, age 95 and older 0.0534 0.0843 0.63 0.5268
Male, Infant - age 34 0.258 0.4469 0.58 0.5638
Male, age 35-44 -0.1612 0.2249 -0.72 0.4737
Male, age 45-54 -0.0143 0.2109 -0.07 0.9461
Male, age 55-59 0.0835 0.2128 0.39 0.6947
Male, age 60-64 0.1132 0.207 0.55 0.5844
Male, age 65-69 -0.4177 0.08 -5.22 <.0001
Male, age 70-74 -0.3767 0.0777 -4.85 <.0001
Male, age 75-79 -0.3042 0.0771 -3.94 <.0001
Male, age 80-84 -0.217 0.0767 -2.83 0.0046
Male, age 85-89 -0.1392 0.0778 -1.79 0.0736
Male, age 90-94 -0.1075 0.0823 -1.31 0.1917
Male, age 95 and older 0 0 - .
Disability -0.506 0.2366 -2.14 0.0325
Dual Eligible 0.1166 0.0119 9.79 <.0001
Medicare-Aged -0.3204 0.0937 -3.42 0.0006
Medicare-Disabled -0.2181 0.1444 -1.51 0.131
187
Parameter Estimate Standard
Error Z
Value Significance
Level
Medicare-ESRD 0 0 . .
MS-DRG: Complications and Comorbidity 0.2483 0.0134 18.52 <.0001
MS-DRG:Major Complications and Comorbidity 0.3189 0.0136 23.52 <.0001
Number of IP visits in last 12 months for condition 0.0381 0.0072 5.27 <.0001
Number of ED visits in last 12 months for condition 0.022 0.0038 5.76 <.0001
Death in episode window 0.1673 0.0237 7.07 <.0001
188
Table 6 : Pneumonia- Regression of 30-day Episode Costs for Pneumonia Episodes (N=86,869)
Parameter Estimate Standard
Error Z
Value Significance
Level Intercept 17.8243 2.3673 7.53 <.0001 HCC1:HIV/AIDS 0.0492 0.0833 0.59 0.5544 HCC2:Septicemia/Shock 0.0759 0.0164 4.62 <.0001 HCC5:Opportunistic Infections 0.0665 0.0396 1.68 0.093 HCC7:Metastatic Cancer and Acute Leukemia 0.091 0.022 4.14 <.0001 HCC8:Lung, Upper Digestive Tract, and Other Severe Cancers 0.0139 0.025 0.56 0.577 HCC9:Lymphatic, Head and Neck,Brain and Other Major Cancers 0.0795 0.029 2.74 0.0062 HCC10:Breast, Prostate, Colorectal and Other Cancers and Tumors 0.0271 0.016 1.69 0.0907 HCC15:Diabetes with Renal or Peripheral Circulatory Manifestation 0.1097 0.0176 6.25 <.0001 HCC16:Diabetes with Neurologic or Other Specified Manifestation 0.0863 0.0189 4.57 <.0001 HCC17:Diabetes with Acute Complications 0.119 0.1211 0.98 0.3258 HCC18:Diabetes with Ophthalmologic or Unspecified Manifestation 0.0688 0.0325 2.12 0.0343 HCC19:Diabetes without Complication 0.0217 0.0124 1.75 0.0801 HCC21:Protein-Calorie Malnutrition 0.0746 0.0175 4.26 <.0001 HCC25:End-Stage Liver Disease 0.0439 0.0602 0.73 0.4655 HCC26:Cirrhosis of Liver 0.0264 0.0508 0.52 0.6036 HCC27:Chronic Hepatitis 0.0228 0.0494 0.46 0.6444 HCC31:Intestinal Obstruction/Perforation 0.0555 0.0187 2.98 0.0029 HCC32:Pancreatic Disease 0.0424 0.0214 1.98 0.0475 HCC33:Inflammatory Bowel Disease: 0.0585 0.0449 1.3 0.1928 HCC37:Bone/Joint/Muscle Infections/Necrosis 0.0585 0.0276 2.12 0.0341 HCC38:Rheumatoid Arthritis and Inflammatory Connective Tissue Disease 0.0295 0.0166 1.77 0.0763 HCC44:Severe Hematological Disorders 0.0081 0.0226 0.36 0.7207 HCC45:Disorders of Immunity 0.0965 0.0258 3.75 0.0002 HCC51:Drug/Alcohol Psychosis 0.0549 0.0334 1.64 0.1006 HCC52:Drug/Alcohol Dependence 0.1655 0.0459 3.61 0.0003 HCC54:Schizophrenia 0.3429 0.0294 11.68 <.0001 HCC55:Major Depressive, Bipolar, and Paranoid Disorders 0.1421 0.0159 8.93 <.0001 HCC67:Quadriplegia, Other Extensive Paralysis 0.071 0.0401 1.77 0.0768 HCC68:Paraplegia 0.1653 0.0586 2.82 0.0048 HCC69:Spinal Cord Disorders/Injuries 0.0774 0.029 2.67 0.0076 HCC70:Muscular Dystrophy 0.2197 0.1443 1.52 0.128 HCC71:Polyneuropathy: 0.0415 0.0141 2.95 0.0032 HCC72:Multiple Sclerosis 0.2228 0.0676 3.29 0.001 HCC73:Parkinsons and Huntingtons Diseases 0.1789 0.0189 9.46 <.0001 HCC74:Seizure Disorders and Convulsions 0.0594 0.0174 3.41 0.0007 HCC75:Coma, Brain Compression/Anoxic Damage 0.0719 0.0403 1.78 0.0746
189
Parameter Estimate Standard
Error Z
Value Significance
Level HCC77:Respirator Dependence/Tracheostomy Status 0.2962 0.0502 5.9 <.0001 HCC78:Respiratory Arrest 0.1234 0.0727 1.7 0.0896 HCC79:Cardio-Respiratory Failure and Shock 0.0634 0.0126 5.05 <.0001 HCC80:Congestive Heart Failure 0.0499 0.0115 4.35 <.0001 HCC81:Acute Myocardial Infarction 0.0204 0.0245 0.83 0.4049 HCC82:Unstable Angina and Other Acute Ischemic Heart Disease 0.0313 0.0197 1.59 0.1122 HCC83:Angina Pectoris/Old Myocardial Infarction -0.0066 0.0162 -0.41 0.6836 HCC92:Specified Heart Arrhythmias: 0.0278 0.0118 2.36 0.0185 HCC95:Cerebral Hemorrhage 0.0768 0.0377 2.04 0.0413 HCC96:Ischemic or Unspecified Stroke 0.0833 0.0136 6.11 <.0001 HCC100:Hemiplegia/Hemiparesis 0.1303 0.0217 6 <.0001 HCC101:Cerebral Palsy and Other Paralytic Syndromes 0.1542 0.0725 2.13 0.0335 HCC104:Vascular Disease with Complications 0.0678 0.0194 3.5 0.0005 HCC105:Vascular Disease 0.0988 0.0106 9.35 <.0001 HCC107:Cystic Fibrosis 0.1858 0.1489 1.25 0.2121 HCC108:Chronic Obstructive Pulmonary Disease 0.0335 0.0107 3.12 0.0018 HCC111:Aspiration and Specified Bacterial Pneumonias 0.021 0.0192 1.09 0.2746 HCC112:Pneumococcal Pneumonia, Emphysema, Lung Abscess -0.0509 0.027 -1.88 0.0596 HCC119:Proliferative Diabetic Retinopathy and Vitreous Hemorrhage -0.0159 0.0377 -0.42 0.6723 HCC130:Dialysis Status 0.1024 0.044 2.33 0.02 HCC131:Renal Failure 0.0472 0.0126 3.75 0.0002 HCC132:Nephritis 0.0347 0.0694 0.5 0.6173 HCC148:Decubitus Ulcer of Skin 0.011 0.0178 0.61 0.5387 HCC149:Chronic Ulcer of Skin, Except Decubitus 0.0953 0.0205 4.64 <.0001 HCC150:Extensive Third-Degree Burns 0.1093 0.2708 0.4 0.6865 HCC154:Severe Head Injury 0.0281 0.1674 0.17 0.8669 HCC155:Major Head Injury 0.0639 0.0367 1.74 0.0817 HCC157:Vertebral Fractures without Spinal Cord Injury 0.0679 0.0195 3.48 0.0005 HCC158:Hip Fracture/Dislocation 0.1407 0.0186 7.56 <.0001 HCC161:Traumatic Amputation 0.0385 0.0219 1.76 0.0793 HCC164:Major Complications of Medical Care and Trauma 0.0586 0.0163 3.59 0.0003 HCC174:Major Organ Transplant Status 0.0256 0.0785 0.33 0.7446 HCC176:Artificial Openings for Feeding or Elimination -0.011 0.0286 -0.39 0.7002 HCC177:Amputation Status, Lower Limb/Amputation Complications 0.049 0.0477 1.03 0.304 Trauma in Episode HCC67:Quadriplegia, Other Extensive Paralysis 0.4651 0.0571 8.15 <.0001 Trauma in Episode HCC68:Paraplegia 0.5467 0.0963 5.68 <.0001 Trauma in Episode HCC69:Spinal Cord Disorders/Injuries 0.5791 0.0691 8.38 <.0001 Trauma in Episode HCC75:Coma, Brain Compression/Anoxic Damage 0.7273 0.0539 13.49 <.0001 Trauma in Episode HCC154:Severe Head Injury 1.1107 0.4588 2.42 0.0155 Trauma in Episode HCC155:Major Head Injury 0.5821 0.0731 7.96 <.0001
190
Parameter Estimate Standard
Error Z
Value Significance
Level Trauma in Episode HCC157:Vertebral Fractures without Spinal Cord Injury 0.3366 0.0368 9.14 <.0001 Trauma in Episode HCC158:Hip Fracture/Dislocation 0.8152 0.047 17.35 <.0001 Trauma in Episode HCC161:Traumatic Amputation 0.4557 0.0375 12.16 <.0001 Trauma in Episode HCC164:Major Complications of Medical Care and Trauma 0.7339 0.0237 31.01 <.0001 Trauma in Episode HCC177:Amputation Status, Lower Limb/Amputation Complications 0.2219 0.0644 3.44 0.0006 Female, Infant - age 34 -0.4 0.2627 -1.52 0.1278 Female, age 35-44 -0.2813 0.2517 -1.12 0.2638 Female, age 45-54 -0.2113 0.2417 -0.87 0.3821 Female, age 55-59 -0.1605 0.241 -0.67 0.5054 Female, age 60-64 -0.0803 0.2379 -0.34 0.7358 Female, age 65-69 -0.3253 0.0482 -6.75 <.0001 Female, age 70-74 -0.2678 0.0462 -5.8 <.0001 Female, age 75-79 -0.1518 0.0439 -3.46 0.0005 Female, age 80-84 -0.0496 0.0429 -1.15 0.2482 Female, age 85-89 0.0748 0.0423 1.77 0.077 Female, age 90-94 0.0572 0.0429 1.33 0.1829 Female, age 95 and older 0.0204 0.0466 0.44 0.6607 Male, Infant - age 34 -0.1097 0.2562 -0.43 0.6687 Male, age 35-44 -0.2555 0.2454 -1.04 0.2979 Male, age 45-54 -0.187 0.2404 -0.78 0.4366 Male, age 55-59 -0.0891 0.2411 -0.37 0.7116 Male, age 60-64 -0.0222 0.2363 -0.09 0.9252 Male, age 65-69 -0.2661 0.0498 -5.34 <.0001 Male, age 70-74 -0.2453 0.0463 -5.29 <.0001 Male, age 75-79 -0.1651 0.0444 -3.72 0.0002 Male, age 80-84 -0.1154 0.0435 -2.65 0.008 Male, age 85-89 -0.0632 0.0431 -1.47 0.1421 Male, age 90-94 0.0249 0.0456 0.55 0.5852 Male, age 95 and older 0 0 - . Disability -0.0336 0.2452 -0.14 0.891 Dual Eligible 0.1098 0.0118 9.27 <.0001 Medicare-Aged -0.2408 0.0599 -4.02 <.0001 Medicare-Disabled -0.0281 0.0853 -0.33 0.7419 Medicare-ESRD 0 0 . . MS-DRG: Complications and Comorbidity 0.4041 0.0149 27.19 <.0001 MS-DRG:Major Complications and Comorbidity 0.218 0.0128 17.05 <.0001 Number of IP visits in last 12 months for condition -0.0096 0.0122 -0.78 0.433 Number of ED visits in last 12 months for condition 0.0271 0.0097 2.8 0.0051
191
Parameter Estimate Standard
Error Z
Value Significance
Level Death in episode window -0.5221 0.0118 -44.28 <.0001
192
Table 7 : Bronchitis- Regression of 30-day Episode Costs for Bronchitis Episodes (N=13,780)
Trauma in Episode HCC155:Major Head Injury 0.4514 0.1431 3.15 0.0016 Trauma in Episode HCC157:Vertebral Fractures without Spinal Cord Injury 0.6767 0.1062 6.37 <.0001
Trauma in Episode HCC158:Hip Fracture/Dislocation 1.1999 0.1503 7.98 <.0001
Trauma in Episode HCC161:Traumatic Amputation 0.4443 0.0881 5.05 <.0001 Trauma in Episode HCC164:Major Complications of Medical Care and Trauma 1.2661 0.0886 14.29 <.0001 Trauma in Episode HCC177:Amputation Status, Lower Limb/Amputation Complications 0.5966 0.3774 1.58 0.1139
Female, Infant - age 34 -0.9949 0.4847 -2.05 0.0401
Female, age 35-44 -0.9422 0.4794 -1.97 0.0494
Female, age 45-54 -0.9226 0.4745 -1.94 0.0519
Female, age 55-59 -0.7277 0.4783 -1.52 0.1282
Female, age 60-64 -0.795 0.4726 -1.68 0.0925
Female, age 65-69 -0.6161 0.1443 -4.27 <.0001
Female, age 70-74 -0.4788 0.1412 -3.39 0.0007
Female, age 75-79 -0.3625 0.1392 -2.6 0.0092
Female, age 80-84 -0.2371 0.1372 -1.73 0.0838
Female, age 85-89 -0.0485 0.1369 -0.35 0.7232
Female, age 90-94 0.0937 0.1385 0.68 0.4985
Female, age 95 and older -0.0336 0.1529 -0.22 0.8262
Male, Infant - age 34 -1.3094 0.4939 -2.65 0.008
Male, age 35-44 -1.003 0.4865 -2.06 0.0392
Male, age 45-54 -0.8857 0.4782 -1.85 0.064
Male, age 55-59 -0.6295 0.4872 -1.29 0.1963
Male, age 60-64 -0.7248 0.4737 -1.53 0.126
Male, age 65-69 -0.541 0.1535 -3.53 0.0004
Male, age 70-74 -0.5064 0.151 -3.35 0.0008
Male, age 75-79 -0.3967 0.1449 -2.74 0.0062
Male, age 80-84 -0.2078 0.1459 -1.42 0.1545
Male, age 85-89 -0.1458 0.1469 -0.99 0.3207
Male, age 90-94 0.0398 0.1507 0.26 0.7917
Male, age 95 and older 0 0 - .
Disability 0.1713 0.5043 0.34 0.7341
Dual Eligible 0.1714 0.0295 5.8 <.0001
Medicare-Aged -0.3044 0.1457 -2.09 0.0367
Medicare-Disabled -0.1503 0.2292 -0.66 0.512
195
Parameter Estimate Standard
Error Z
Value Significance
Level
Medicare-ESRD 0 0 . .
MS-DRG:Major Complications and Comorbidity 0.2899 0.0265 10.96 <.0001
Number of IP visits in last 12 months for condition -0.0427 0.0244 -1.75 0.08
Number of ED visits in last 12 months for condition 0.0346 0.0134 2.58 0.0099
Death in episode window -0.2943 0.0437 -6.73 <.0001
196
Table 8 : Acute Ischemic Stroke- Regression of 30-day Episode Costs for Acute Ischemic Stroke Episodes (N=1,458)
Trauma in Episode HCC155:Major Head Injury 0.4678 0.1766 2.65 0.0081 Trauma in Episode HCC157:Vertebral Fractures without Spinal Cord Injury 0.0706 0.3105 0.23 0.82
Trauma in Episode HCC158:Hip Fracture/Dislocation 0.6525 0.2235 2.92 0.0035
Trauma in Episode HCC161:Traumatic Amputation -0.2754 0.1594 -1.73 0.084 Trauma in Episode HCC164:Major Complications of Medical Care and Trauma 0.3284 0.116 2.83 0.0046 Trauma in Episode HCC177:Amputation Status, Lower Limb/Amputation Complications 0.6879 0.3605 1.91 0.0564
Female, age 35-44 -3.0299 0.8224 -3.68 0.0002
Female, age 45-54 -3.293 0.4364 -7.55 <.0001
Female, age 55-59 -3.2255 0.4402 -7.33 <.0001
Female, age 60-64 -2.5788 0.4195 -6.15 <.0001
Female, age 65-69 -0.5139 0.2961 -1.74 0.0827
Female, age 70-74 -0.1276 0.2748 -0.46 0.6424
Female, age 75-79 -0.1081 0.268 -0.4 0.6867
Female, age 80-84 -0.0197 0.2669 -0.07 0.9411
Female, age 85-89 -0.0759 0.2632 -0.29 0.773
Female, age 90-94 -0.0583 0.2714 -0.21 0.83
Female, age 95 and older -0.4435 0.3138 -1.41 0.1575
Male, age 35-44 -3.0393 0.8383 -3.63 0.0003
Male, age 45-54 -3.4746 0.5902 -5.89 <.0001
Male, age 55-59 -2.7341 0.465 -5.88 <.0001
Male, age 60-64 -2.8343 0.3021 -9.38 <.0001
Male, age 65-69 -0.0358 0.2801 -0.13 0.8983
Male, age 70-74 -0.1796 0.2776 -0.65 0.5176
Male, age 75-79 -0.0579 0.2672 -0.22 0.8285
Male, age 80-84 0.0737 0.275 0.27 0.7886
Male, age 85-89 0.0349 0.2921 0.12 0.9049
Male, age 90-94 -0.3539 0.2872 -1.23 0.218
Male, age 95 and older 0 0 - .
Disability 3.1817 0.741 4.29 <.0001
Dual Eligible 0.1252 0.0746 1.68 0.0934
Medicare-Aged 0.3961 0.4914 0.81 0.4203
Medicare-Disabled 0.5019 0.8577 0.59 0.5584
Medicare-ESRD 0 0 . .
MS-DRG: Complications and Comorbidity 0.7831 0.0931 8.41 <.0001
199
Parameter Estimate Standard
Error Z
Value Significance
Level
MS-DRG:Major Complications and Comorbidity 0.6693 0.0773 8.66 <.0001
Number of IP visits in last 12 months for condition -0.0801 0.1159 -0.69 0.4896
Number of ED visits in last 12 months for condition 0.0502 0.3217 0.16 0.876
Death in episode window -1.6449 0.1208 -13.61 <.0001
200
Table 9. Stroke with Cerebral Infarct- Regression of 30-day Episode Costs for Acute Ischemic Stroke Episodes (N=43,246)
Trauma in Episode HCC154:Severe Head Injury 0.3132 0.2343 1.34 0.1814
Trauma in Episode HCC155:Major Head Injury 0.4317 0.0464 9.31 <.0001 Trauma in Episode HCC157:Vertebral Fractures without Spinal Cord Injury 0.2033 0.0505 4.03 <.0001
Trauma in Episode HCC158:Hip Fracture/Dislocation 0.4649 0.0455 10.22 <.0001
Trauma in Episode HCC161:Traumatic Amputation 0.5889 0.1208 4.87 <.0001 Trauma in Episode HCC164:Major Complications of Medical Care and Trauma 0.6298 0.0331 19.03 <.0001 Trauma in Episode HCC177:Amputation Status, Lower Limb/Amputation Complications 0.0819 0.0699 1.17 0.2414
Female, Infant - age 34 -0.2491 0.3296 -0.76 0.4497
Female, age 35-44 0.1127 0.2481 0.45 0.6497
Female, age 45-54 0.2054 0.2236 0.92 0.3582
Female, age 55-59 0.2674 0.2212 1.21 0.2266
Female, age 60-64 0.2151 0.2117 1.02 0.3096
Female, age 65-69 -0.0812 0.0905 -0.9 0.3695
Female, age 70-74 0.0002 0.0887 0 0.998
Female, age 75-79 0.0402 0.0879 0.46 0.6473
Female, age 80-84 0.0831 0.0875 0.95 0.3419
Female, age 85-89 0.063 0.0875 0.72 0.4713
Female, age 90-94 0.0393 0.0881 0.45 0.656
Female, age 95 and older -0.0661 0.0916 -0.72 0.4706
Male, Infant - age 34 0.0337 0.4302 0.08 0.9376
Male, age 35-44 0.1822 0.2505 0.73 0.4669
Male, age 45-54 0.1421 0.2249 0.63 0.5275
Male, age 55-59 0.15 0.2202 0.68 0.4956
Male, age 60-64 0.2361 0.2151 1.1 0.2723
Male, age 65-69 -0.068 0.0911 -0.75 0.4552
Male, age 70-74 -0.0459 0.0894 -0.51 0.6075
Male, age 75-79 -0.0227 0.0887 -0.26 0.7976
Male, age 80-84 0.0621 0.0884 0.7 0.4822
Male, age 85-89 0.1029 0.0886 1.16 0.2455
Male, age 90-94 0.0288 0.0915 0.31 0.753
Male, age 95 and older 0 0 - .
Disability -0.2467 0.2414 -1.02 0.3067
203
Parameter Estimate Standard
Error Z
Value Significance
Level
Dual Eligible 0.042 0.0127 3.3 0.001
Medicare-Aged 0.0051 0.0852 0.06 0.9523
Medicare-Disabled 0.0632 0.1475 0.43 0.6681
Medicare-ESRD 0 0 . .
MS-DRG: Complications and Comorbidity 0.4656 0.0171 27.18 <.0001
MS-DRG: Major Complications and Comorbidity 0.4354 0.0131 33.25 <.0001
Number of IP visits in last 12 months for condition -0.0153 0.0212 -0.72 0.469
Number of ED visits in last 12 months for condition 0.0174 0.0547 0.32 0.7506
Death in episode window -1.2213 0.0251 -48.61 <.0001
204
Table 10. Hip Replacement- Regression of 30-day Episode Costs for Hip Replacement Episodes (N=24,603)
Parameter Estimate Standard
Error Z
Value Significance
Level Intercept 10.9212 8.7153 1.25 0.2102 HCC1:HIV/AIDS -0.1007 0.0743 -1.36 0.1753 HCC2:Septicemia/Shock 0.0713 0.035 2.04 0.0418 HCC5:Opportunistic Infections -0.0902 0.0363 -2.48 0.013 HCC7:Metastatic Cancer and Acute Leukemia 0.1249 0.0407 3.07 0.0021 HCC8:Lung, Upper Digestive Tract, and Other Severe Cancers 0.0898 0.0426 2.11 0.0351 HCC9:Lymphatic, Head and Neck,Brain and Other Major Cancers -0.0034 0.0273 -0.12 0.9012 HCC10:Breast, Prostate, Colorectal and Other Cancers and Tumors 0.0265 0.0139 1.91 0.0567 HCC15:Diabetes with Renal or Peripheral Circulatory Manifestation 0.2276 0.0254 8.95 <.0001 HCC16:Diabetes with Neurologic or Other Specified Manifestation 0.2087 0.0252 8.28 <.0001 HCC17:Diabetes with Acute Complications -0.0338 0.101 -0.33 0.7379 HCC18:Diabetes with Ophthalmologic or Unspecified Manifestation 0.1627 0.0334 4.87 <.0001 HCC19:Diabetes without Complication 0.118 0.0116 10.18 <.0001 HCC21:Protein-Calorie Malnutrition -0.0231 0.0424 -0.55 0.5856 HCC25:End-Stage Liver Disease 0.0045 0.0573 0.08 0.9376 HCC26:Cirrhosis of Liver 0.1446 0.0785 1.84 0.0657 HCC27:Chronic Hepatitis 0.1136 0.0568 2 0.0456 HCC31:Intestinal Obstruction/Perforation 0.018 0.0301 0.6 0.5492 HCC32:Pancreatic Disease 0.0412 0.0416 0.99 0.3218 HCC33:Inflammatory Bowel Disease: 0.0019 0.0377 0.05 0.9598 HCC37:Bone/Joint/Muscle Infections/Necrosis 0.0316 0.0157 2.02 0.0437 HCC38:Rheumatoid Arthritis and Inflammatory Connective Tissue Disease 0.0637 0.0135 4.72 <.0001 HCC44:Severe Hematological Disorders 0.0683 0.0336 2.03 0.0423 HCC45:Disorders of Immunity 0.0359 0.0393 0.91 0.3612 HCC51:Drug/Alcohol Psychosis 0.0889 0.0488 1.82 0.0688 HCC52:Drug/Alcohol Dependence 0.0621 0.0452 1.37 0.1695 HCC54:Schizophrenia 0.2138 0.0585 3.66 0.0003 HCC55:Major Depressive, Bipolar, and Paranoid Disorders 0.1337 0.022 6.08 <.0001 HCC67:Quadriplegia, Other Extensive Paralysis 0.2317 0.1679 1.38 0.1674 HCC68:Paraplegia 0.0977 0.127 0.77 0.4418 HCC69:Spinal Cord Disorders/Injuries 0.1224 0.0497 2.47 0.0137 HCC70:Muscular Dystrophy 0.1994 0.2557 0.78 0.4354 HCC71:Polyneuropathy: 0.0575 0.0179 3.22 0.0013 HCC72:Multiple Sclerosis 0.2419 0.1059 2.28 0.0223 HCC73:Parkinsons and Huntingtons Diseases 0.2304 0.0377 6.11 <.0001 HCC74:Seizure Disorders and Convulsions 0.1099 0.034 3.23 0.0012
205
Parameter Estimate Standard
Error Z
Value Significance
Level HCC75:Coma, Brain Compression/Anoxic Damage -0.0401 0.083 -0.48 0.629 HCC77:Respirator Dependence/Tracheostomy Status 0.0148 0.148 0.1 0.9205 HCC78:Respiratory Arrest -0.0195 0.1405 -0.14 0.8895 HCC79:Cardio-Respiratory Failure and Shock 0.0552 0.0245 2.25 0.0242 HCC80:Congestive Heart Failure 0.0651 0.0138 4.72 <.0001 HCC81:Acute Myocardial Infarction 0.0326 0.0493 0.66 0.5091 HCC82:Unstable Angina and Other Acute Ischemic Heart Disease 0.0209 0.0227 0.92 0.3558 HCC83:Angina Pectoris/Old Myocardial Infarction 0.1044 0.0166 6.29 <.0001 HCC92:Specified Heart Arrhythmias: 0.056 0.0118 4.74 <.0001 HCC95:Cerebral Hemorrhage -0.0357 0.0669 -0.53 0.5934 HCC96:Ischemic or Unspecified Stroke 0.0763 0.0209 3.65 0.0003 HCC100:Hemiplegia/Hemiparesis 0.164 0.0554 2.96 0.0031 HCC101:Cerebral Palsy and Other Paralytic Syndromes 0.2286 0.0927 2.47 0.0137 HCC104:Vascular Disease with Complications 0.0329 0.0258 1.28 0.2021 HCC105:Vascular Disease 0.0827 0.0113 7.3 <.0001 HCC107:Cystic Fibrosis 0.2325 0.173 1.34 0.1791 HCC108:Chronic Obstructive Pulmonary Disease 0.0897 0.0115 7.81 <.0001 HCC111:Aspiration and Specified Bacterial Pneumonias 0.0205 0.0495 0.41 0.6786 HCC112:Pneumococcal Pneumonia, Emphysema, Lung Abscess 0.0161 0.0544 0.3 0.7676 HCC119:Proliferative Diabetic Retinopathy and Vitreous Hemorrhage 0.0324 0.0587 0.55 0.5808 HCC130:Dialysis Status 0.1321 0.0939 1.41 0.1596 HCC131:Renal Failure 0.0465 0.017 2.73 0.0063 HCC132:Nephritis 0.0463 0.0856 0.54 0.5889 HCC148:Decubitus Ulcer of Skin 0.1375 0.0383 3.59 0.0003 HCC149:Chronic Ulcer of Skin, Except Decubitus 0.1289 0.0266 4.84 <.0001 HCC154:Severe Head Injury -0.0857 0.1803 -0.48 0.6344 HCC155:Major Head Injury -1.0827 0.311 -3.48 0.0005 HCC157:Vertebral Fractures without Spinal Cord Injury 0.042 0.0524 0.8 0.4233 HCC158:Hip Fracture/Dislocation 0.0258 0.0246 1.05 0.293 HCC161:Traumatic Amputation 0.1723 0.0171 10.1 <.0001 HCC164:Major Complications of Medical Care and Trauma -0.026 0.0382 -0.68 0.4953 HCC174:Major Organ Transplant Status 0.0519 0.0186 2.79 0.0052 HCC176:Artificial Openings for Feeding or Elimination -0.1939 0.0977 -1.99 0.0471 HCC177:Amputation Status, Lower Limb/Amputation Complications -0.0326 0.0644 -0.51 0.612 Trauma in Episode HCC67:Quadriplegia, Other Extensive Paralysis -0.0009 0.1132 -0.01 0.9935 Trauma in Episode HCC68:Paraplegia 0.3699 0.1962 1.89 0.0594 Trauma in Episode HCC69:Spinal Cord Disorders/Injuries 0.5534 0.1694 3.27 0.0011 Trauma in Episode HCC75:Coma, Brain Compression/Anoxic Damage 0.2851 0.0597 4.78 <.0001 Trauma in Episode HCC154:Severe Head Injury 0.4902 0.1419 3.45 0.0006 Trauma in Episode HCC155:Major Head Injury 0.4364 0.0877 4.98 <.0001
206
Parameter Estimate Standard
Error Z
Value Significance
Level Trauma in Episode HCC157:Vertebral Fractures without Spinal Cord Injury 0.2895 0.0604 4.79 <.0001 Trauma in Episode HCC158:Hip Fracture/Dislocation 0.3869 0.0125 30.92 <.0001 Trauma in Episode HCC161:Traumatic Amputation 0.2926 0.0462 6.34 <.0001 Trauma in Episode HCC164:Major Complications of Medical Care and Trauma 0.4164 0.0171 24.42 <.0001 Trauma in Episode HCC177:Amputation Status, Lower Limb/Amputation Complications 0.2367 0.0799 2.96 0.0031 Female, Infant - age 34 -0.6487 0.4503 -1.44 0.1497 Female, age 35-44 -0.5 0.4318 -1.16 0.2468 Female, age 45-54 -0.2576 0.4258 -0.61 0.5451 Female, age 55-59 -0.2165 0.4256 -0.51 0.6109 Female, age 60-64 -0.2394 0.4231 -0.57 0.5715 Female, age 65-69 -0.4222 0.388 -1.09 0.2765 Female, age 70-74 -0.3575 0.3879 -0.92 0.3567 Female, age 75-79 -0.2114 0.3878 -0.55 0.5857 Female, age 80-84 -0.0971 0.3878 -0.25 0.8023 Female, age 85-89 -0.0001 0.3879 0 0.9998 Female, age 90-94 0.037 0.3891 0.1 0.9243 Female, age 95 and older -0.0699 0.3952 -0.18 0.8597 Male, Infant - age 34 -0.6717 0.4501 -1.49 0.1356 Male, age 35-44 -0.419 0.4323 -0.97 0.3324 Male, age 45-54 -0.4677 0.4256 -1.1 0.2718 Male, age 55-59 -0.2769 0.4273 -0.65 0.5169 Male, age 60-64 -0.3996 0.4229 -0.94 0.3447 Male, age 65-69 -0.6343 0.3881 -1.63 0.1022 Male, age 70-74 -0.5315 0.3881 -1.37 0.1708 Male, age 75-79 -0.3996 0.3879 -1.03 0.303 Male, age 80-84 -0.2247 0.3881 -0.58 0.5626 Male, age 85-89 -0.0737 0.3886 -0.19 0.8496 Male, age 90-94 -0.0137 0.3917 -0.04 0.972 Male, age 95 and older 0 0 - . Disability 0.0532 0.2675 0.2 0.8423 Dual Eligible 0.1311 0.0161 8.13 <.0001 Medicare-Aged -0.288 0.1271 -2.27 0.0235 Medicare-Disabled 0.104 0.2288 0.45 0.6495 Medicare-ESRD -0.104 0.2288 -0.45 0.6495 MS-DRG: Complications and Comorbidity 0.5927 0.2208 2.68 0.0073 MS-DRG:Muti Joint Procedure 0.7376 0.2155 3.42 0.0006 Number of IP visits in last 12 months for condition -0.0814 0.0205 -3.97 <.0001 Number of ED visits in last 12 months for condition 0 0 . .
207
Parameter Estimate Standard
Error Z
Value Significance
Level Death in episode window -0.5668 0.1106 -5.12 <.0001
208
Table 11. Knee Replacement- Regression of 30-day Episode Costs for Knee Replacement Episodes (N=53,647)
Parameter Estimat
e Standard Error
Z Value
Significance Level
Intercept 11.7091 4.7697 2.45 0.0141 HCC1:HIV/AIDS 0.177 0.1143 1.55 0.1215 HCC2:Septicemia/Shock -0.036 0.031 -1.16 0.2453 HCC5:Opportunistic Infections 0.0486 0.0357 1.36 0.1735 HCC7:Metastatic Cancer and Acute Leukemia 0.0543 0.0318 1.71 0.0875 HCC8:Lung, Upper Digestive Tract, and Other Severe Cancers 0.0204 0.0298 0.68 0.4934 HCC9:Lymphatic, Head and Neck,Brain and Other Major Cancers 0.0265 0.0214 1.24 0.2154 HCC10:Breast, Prostate, Colorectal and Other Cancers and Tumors 0.0172 0.0093 1.86 0.0628 HCC15:Diabetes with Renal or Peripheral Circulatory Manifestation 0.2118 0.0156 13.59 <.0001 HCC16:Diabetes with Neurologic or Other Specified Manifestation 0.1677 0.0151 11.1 <.0001 HCC17:Diabetes with Acute Complications 0.1527 0.0652 2.34 0.0191 HCC18:Diabetes with Ophthalmologic or Unspecified Manifestation 0.1543 0.021 7.33 <.0001 HCC19:Diabetes without Complication 0.1114 0.0072 15.37 <.0001 HCC21:Protein-Calorie Malnutrition 0.0839 0.0408 2.06 0.0398 HCC25:End-Stage Liver Disease 0.0852 0.0535 1.59 0.1114 HCC26:Cirrhosis of Liver -0.0171 0.0437 -0.39 0.6952 HCC27:Chronic Hepatitis 0.0947 0.0414 2.29 0.0222 HCC31:Intestinal Obstruction/Perforation 0.0689 0.0325 2.12 0.0337 HCC32:Pancreatic Disease 0.0137 0.0286 0.48 0.6322 HCC33:Inflammatory Bowel Disease: 0.0447 0.0288 1.55 0.121 HCC37:Bone/Joint/Muscle Infections/Necrosis 0.0016 0.019 0.09 0.9322 HCC38:Rheumatoid Arthritis and Inflammatory Connective Tissue Disease 0.0562 0.0091 6.15 <.0001 HCC44:Severe Hematological Disorders 0.1458 0.0449 3.25 0.0012 HCC45:Disorders of Immunity 0.0296 0.0277 1.07 0.2863 HCC51:Drug/Alcohol Psychosis -0.0111 0.0378 -0.29 0.7695 HCC52:Drug/Alcohol Dependence -0.0256 0.0365 -0.7 0.4833 HCC54:Schizophrenia 0.2996 0.0405 7.4 <.0001 HCC55:Major Depressive, Bipolar, and Paranoid Disorders 0.1163 0.0137 8.52 <.0001 HCC67:Quadriplegia, Other Extensive Paralysis 0.2053 0.1 2.05 0.0401 HCC68:Paraplegia 0.2618 0.1471 1.78 0.0752 HCC69:Spinal Cord Disorders/Injuries 0.1456 0.0319 4.56 <.0001 HCC70:Muscular Dystrophy -0.0771 0.1325 -0.58 0.5605 HCC71:Polyneuropathy: 0.0657 0.011 5.98 <.0001 HCC72:Multiple Sclerosis 0.0992 0.0556 1.78 0.0746 HCC73:Parkinsons and Huntingtons Diseases 0.2414 0.0257 9.4 <.0001 HCC74:Seizure Disorders and Convulsions 0.0764 0.0233 3.28 0.001
209
Parameter Estimat
e Standard Error
Z Value
Significance Level
HCC75:Coma, Brain Compression/Anoxic Damage 0.0311 0.0811 0.38 0.7014 HCC77:Respirator Dependence/Tracheostomy Status -0.0585 0.1198 -0.49 0.6253 HCC78:Respiratory Arrest -0.1177 0.1036 -1.14 0.2556 HCC79:Cardio-Respiratory Failure and Shock 0.0553 0.0196 2.82 0.0048 HCC80:Congestive Heart Failure 0.0787 0.0093 8.43 <.0001 HCC81:Acute Myocardial Infarction -0.0147 0.0372 -0.4 0.6928 HCC82:Unstable Angina and Other Acute Ischemic Heart Disease 0.0409 0.0157 2.59 0.0095 HCC83:Angina Pectoris/Old Myocardial Infarction 0.0778 0.0108 7.17 <.0001 HCC92:Specified Heart Arrhythmias: 0.0605 0.0082 7.36 <.0001 HCC95:Cerebral Hemorrhage 0.204 0.0865 2.36 0.0184 HCC96:Ischemic or Unspecified Stroke 0.0982 0.0166 5.92 <.0001 HCC100:Hemiplegia/Hemiparesis 0.2932 0.0451 6.5 <.0001 HCC101:Cerebral Palsy and Other Paralytic Syndromes 0.1331 0.0635 2.1 0.0359 HCC104:Vascular Disease with Complications 0.084 0.0208 4.04 <.0001 HCC105:Vascular Disease 0.0874 0.0075 11.58 <.0001 HCC107:Cystic Fibrosis 0.1066 0.1521 0.7 0.4834 HCC108:Chronic Obstructive Pulmonary Disease 0.09 0.0086 10.49 <.0001 HCC111:Aspiration and Specified Bacterial Pneumonias -0.0225 0.0476 -0.47 0.6363 HCC112:Pneumococcal Pneumonia, Emphysema, Lung Abscess -0.0062 0.0423 -0.15 0.884 HCC119:Proliferative Diabetic Retinopathy and Vitreous Hemorrhage -0.0279 0.0381 -0.73 0.4633 HCC130:Dialysis Status 0.217 0.0655 3.31 0.0009 HCC131:Renal Failure 0.0727 0.0114 6.36 <.0001 HCC132:Nephritis 0.0118 0.0499 0.24 0.8122 HCC148:Decubitus Ulcer of Skin 0.1316 0.0333 3.96 <.0001 HCC149:Chronic Ulcer of Skin, Except Decubitus 0.1096 0.0167 6.56 <.0001 HCC154:Severe Head Injury 0.1717 0.1563 1.1 0.272 HCC155:Major Head Injury -0.0013 0.0369 -0.03 0.9723 HCC157:Vertebral Fractures without Spinal Cord Injury 0.0805 0.0239 3.37 0.0008 HCC158:Hip Fracture/Dislocation 0.1165 0.0226 5.14 <.0001 HCC161:Traumatic Amputation 0.0151 0.0342 0.44 0.6601 HCC164:Major Complications of Medical Care and Trauma 0.028 0.0147 1.91 0.0561 HCC174:Major Organ Transplant Status 0.018 0.0838 0.21 0.8301 HCC176:Artificial Openings for Feeding or Elimination 0.0415 0.0538 0.77 0.44 HCC177:Amputation Status, Lower Limb/Amputation Complications 0.0493 0.0759 0.65 0.5163 Trauma in Episode HCC67:Quadriplegia, Other Extensive Paralysis 0.6146 0.2372 2.59 0.0096 Trauma in Episode HCC68:Paraplegia 0.59 0.1128 5.23 <.0001 Trauma in Episode HCC69:Spinal Cord Disorders/Injuries 0.3389 0.0365 9.29 <.0001 Trauma in Episode HCC75:Coma, Brain Compression/Anoxic Damage 0.7459 0.1219 6.12 <.0001 Trauma in Episode HCC154:Severe Head Injury 1.0488 0.3039 3.45 0.0006 Trauma in Episode HCC155:Major Head Injury -0.2153 0.0331 -6.5 <.0001
210
Parameter Estimat
e Standard Error
Z Value
Significance Level
Trauma in Episode HCC157:Vertebral Fractures without Spinal Cord Injury 0.4325 0.0862 5.02 <.0001 Trauma in Episode HCC158:Hip Fracture/Dislocation 0.4123 0.0331 12.45 <.0001 Trauma in Episode HCC161:Traumatic Amputation 0.3967 0.0276 14.39 <.0001 Trauma in Episode HCC164:Major Complications of Medical Care and Trauma 0.3852 0.0143 26.85 <.0001 Trauma in Episode HCC177:Amputation Status, Lower Limb/Amputation Complications 0.4142 0.0514 8.05 <.0001 Female, Infant - age 34 -1.1225 0.2942 -3.82 0.0001 Female, age 35-44 -0.8158 0.2715 -3 0.0027 Female, age 45-54 -0.8532 0.2631 -3.24 0.0012 Female, age 55-59 -0.7956 0.2626 -3.03 0.0025 Female, age 60-64 -0.6966 0.2615 -2.66 0.0077 Female, age 65-69 -0.2476 0.204 -1.21 0.2249 Female, age 70-74 -0.1665 0.204 -0.82 0.4143 Female, age 75-79 -0.0501 0.204 -0.25 0.8058 Female, age 80-84 0.0722 0.204 0.35 0.7234 Female, age 85-89 0.2067 0.2044 1.01 0.3119 Female, age 90-94 0.3012 0.2079 1.45 0.1473 Female, age 95 and older 0.2649 0.2443 1.08 0.2783 Male, Infant - age 34 -0.9913 0.3618 -2.74 0.0061 Male, age 35-44 -0.9708 0.2724 -3.56 0.0004 Male, age 45-54 -0.9677 0.2646 -3.66 0.0003 Male, age 55-59 -0.8078 0.2689 -3 0.0027 Male, age 60-64 -0.8545 0.2616 -3.27 0.0011 Male, age 65-69 -0.4255 0.2042 -2.08 0.0372 Male, age 70-74 -0.3415 0.2041 -1.67 0.0943 Male, age 75-79 -0.2314 0.2041 -1.13 0.2569 Male, age 80-84 -0.0963 0.2043 -0.47 0.6376 Male, age 85-89 0.0352 0.2049 0.17 0.8635 Male, age 90-94 0.2001 0.2125 0.94 0.3462 Male, age 95 and older 0 0 - . Disability 0.148 0.2292 0.65 0.5184 Dual Eligible 0.1433 0.0098 14.59 <.0001 Medicare-Aged -0.2216 0.1083 -2.05 0.0408 Medicare-Disabled -0.4019 0.1753 -2.29 0.0219 Medicare-ESRD 0 0 . . MS-DRG: Complications and Comorbidity 0.0266 0.0471 0.56 0.5723 MS-DRG:Muti Joint Procedure 0.3251 0.0486 6.69 <.0001 Number of IP visits in last 12 months for condition -0.0987 0.0118 -8.35 <.0001 Number of ED visits in last 12 months for condition 0 0 . .
211
Parameter Estimat
e Standard Error
Z Value
Significance Level
Death in episode window -0.1775 0.1258 -1.41 0.1581
212
Table 12. Hip Fracture- Regression of 30-day Episode Costs for Hip Fracture Episodes (N=3,098)
Parameter Estimate Standard
Error
Wald Chi-
Square Significance Level
Intercept 2.3795 8.2833 0.08 0.7739 HCC1:HIV/AIDS -0.0516 0.4725 0.01 0.913 HCC2:Septicemia/Shock 0.1234 0.0732 2.84 0.0921 HCC5:Opportunistic Infections -0.125 0.1186 1.11 0.2921 HCC7:Metastatic Cancer and Acute Leukemia 0.2615 0.0964 7.35 0.0067 HCC8:Lung, Upper Digestive Tract, and Other Severe Cancers 0.2117 0.1243 2.9 0.0884 HCC9:Lymphatic, Head and Neck,Brain and Other Major Cancers -0.1917 0.1082 3.14 0.0766 HCC10:Breast, Prostate, Colorectal and Other Cancers and Tumors 0.1244 0.0564 4.87 0.0273 HCC15:Diabetes with Renal or Peripheral Circulatory Manifestation 0.1516 0.0736 4.24 0.0395 HCC16:Diabetes with Neurologic or Other Specified Manifestation 0.0382 0.0758 0.25 0.6144 HCC17:Diabetes with Acute Complications -0.1264 0.2337 0.29 0.5885 HCC18:Diabetes with Ophthalmologic or Unspecified Manifestation 0.3167 0.1142 7.7 0.0055 HCC19:Diabetes without Complication 0.1238 0.044 7.93 0.0049 HCC21:Protein-Calorie Malnutrition -0.0413 0.0696 0.35 0.5525 HCC25:End-Stage Liver Disease 0.2028 0.1757 1.33 0.2485 HCC26:Cirrhosis of Liver -0.2433 0.2098 1.34 0.2462 HCC27:Chronic Hepatitis -0.3229 0.2242 2.07 0.1498 HCC31:Intestinal Obstruction/Perforation 0.1171 0.0816 2.06 0.151 HCC32:Pancreatic Disease 0.0997 0.0908 1.21 0.2722 HCC33:Inflammatory Bowel Disease: 0.0378 0.1472 0.07 0.7974 HCC37:Bone/Joint/Muscle Infections/Necrosis -0.0043 0.1074 0 0.9681 HCC38:Rheumatoid Arthritis and Inflammatory Connective Tissue Disease 0.1792 0.0606 8.74 0.0031 HCC44:Severe Hematological Disorders 0.2216 0.1025 4.67 0.0307 HCC45:Disorders of Immunity -0.0381 0.1345 0.08 0.777 HCC51:Drug/Alcohol Psychosis 0.0692 0.1229 0.32 0.5734 HCC52:Drug/Alcohol Dependence -0.0402 0.1669 0.06 0.8095 HCC54:Schizophrenia 0.1372 0.1533 0.8 0.3708 HCC55:Major Depressive, Bipolar, and Paranoid Disorders -0.0303 0.0597 0.26 0.612 HCC67:Quadriplegia, Other Extensive Paralysis -0.2378 0.1949 1.49 0.2224 HCC68:Paraplegia -0.0135 0.2809 0 0.9617 HCC69:Spinal Cord Disorders/Injuries -0.1636 0.1368 1.43 0.2316 HCC70:Muscular Dystrophy -0.1677 0.6565 0.07 0.7983 HCC71:Polyneuropathy: 0.1246 0.0605 4.24 0.0395 HCC72:Multiple Sclerosis -0.8412 0.2479 11.51 0.0007
Trauma in Episode HCC69:Spinal Cord Disorders/Injuries 0.4895 0.1556 9.89 0.0017 Trauma in Episode HCC75:Coma, Brain Compression/Anoxic Damage 0.4681 0.1412 10.99 0.0009 Trauma in Episode HCC155:Major Head Injury 0.0502 0.1614 0.1 0.7556 Trauma in Episode HCC157:Vertebral Fractures without Spinal Cord Injury 0.1233 0.1058 1.36 0.244 Trauma in Episode HCC161:Traumatic Amputation 0.3367 0.0981 11.78 0.0006 Trauma in Episode HCC164:Major Complications of Medical Care and Trauma 0.6025 0.0691 75.93 <.0001 Trauma in Episode HCC177:Amputation Status, Lower Limb/Amputation Complications 0.0245 0.1824 0.02 0.8932 Female, age 35-44 -2.1999 1.1661 3.56 0.0592 Female, age 45-54 0.3463 0.965 0.13 0.7197 Female, age 55-59 0.2338 0.969 0.06 0.8093 Female, age 60-64 -0.2687 0.9106 0.09 0.7679 Female, age 65-69 -0.4468 0.1892 5.58 0.0182 Female, age 70-74 -0.5026 0.1704 8.7 0.0032 Female, age 75-79 -0.3799 0.1635 5.4 0.0201 Female, age 80-84 -0.3303 0.1597 4.28 0.0386 Female, age 85-89 -0.2984 0.1587 3.54 0.06 Female, age 90-94 -0.414 0.1606 6.64 0.0099 Female, age 95 and older -0.4751 0.1704 7.78 0.0053 Male, Infant - age 34 0.2083 1.1341 0.03 0.8543 Male, age 35-44 -0.4499 0.992 0.21 0.6502 Male, age 45-54 0.1472 0.9673 0.02 0.8791 Male, age 55-59 0.2818 0.9657 0.09 0.7704 Male, age 60-64 -0.1066 0.9525 0.01 0.9109 Male, age 65-69 -0.5406 0.1983 7.43 0.0064 Male, age 70-74 -0.3999 0.1829 4.78 0.0288 Male, age 75-79 -0.3602 0.1726 4.36 0.0369 Male, age 80-84 -0.1314 0.1665 0.62 0.4299 Male, age 85-89 -0.4047 0.1665 5.91 0.0151 Male, age 90-94 -0.4684 0.1731 7.32 0.0068 Male, age 95 and older 0 0 . . Disability 0.6478 1.3107 0.24 0.6212 Dual Eligible 0.0353 0.0418 0.71 0.398 Medicare-Aged 0.3663 0.4433 0.68 0.4087 Medicare-Disabled 1.4113 0.9948 2.01 0.156 Medicare-ESRD 0 0 . .
215
Parameter Estimate Standard
Error
Wald Chi-
Square Significance Level
Number of IP visits in last 12 months for condition -0.0099 0.1298 0.01 0.9395 Number of ED visits in last 12 months for condition 0.0337 0.1016 0.11 0.7402 Death in episode window -1.1707 0.0424 763.07 <.0001
216
Table 13. Laparoscopic Cholecystectomy- Regression of 30-day Episode Costs for Laparoscopic Cholecystectomy Episodes (N=15,851)
Trauma in Episode HCC155:Major Head Injury 0.8636 0.1529 5.65 <.0001
Trauma in Episode HCC157:Vertebral Fractures without Spinal Cord Injury 0.7109 0.1654 4.3 <.0001
Trauma in Episode HCC158:Hip Fracture/Dislocation 0.9506 0.1703 5.58 <.0001
Trauma in Episode HCC161:Traumatic Amputation 0.3075 0.067 4.59 <.0001 Trauma in Episode HCC164:Major Complications of Medical Care and Trauma 0.772 0.0488 15.81 <.0001 Trauma in Episode HCC177:Amputation Status, Lower Limb/Amputation Complications 0.2627 0.2413 1.09 0.2762
Female, Infant - age 34 -1.1407 0.3498 -3.26 0.0011
Female, age 35-44 -1.1189 0.3433 -3.26 0.0011
Female, age 45-54 -1.0861 0.3455 -3.14 0.0017
Female, age 55-59 -1.0706 0.3389 -3.16 0.0016
Female, age 60-64 -0.9008 0.3292 -2.74 0.0062
Female, age 65-69 -0.8451 0.2555 -3.31 0.0009
Female, age 70-74 -0.7218 0.2549 -2.83 0.0046
Female, age 75-79 -0.733 0.2538 -2.89 0.0039
Female, age 80-84 -0.4253 0.2545 -1.67 0.0947
Female, age 85-89 -0.2418 0.256 -0.94 0.3449
Female, age 90-94 -0.1215 0.2597 -0.47 0.6398
Female, age 95 and older 0.0802 0.2852 0.28 0.7785
Male, Infant - age 34 -1.2177 0.3573 -3.41 0.0007
Male, age 35-44 -1.1253 0.3473 -3.24 0.0012
Male, age 45-54 -1.0822 0.3439 -3.15 0.0016
Male, age 55-59 -1.1099 0.3531 -3.14 0.0017
Male, age 60-64 -1.0343 0.3366 -3.07 0.0021
Male, age 65-69 -0.8161 0.257 -3.18 0.0015
Male, age 70-74 -0.7959 0.2543 -3.13 0.0018
Male, age 75-79 -0.5838 0.2556 -2.28 0.0224
Male, age 80-84 -0.5262 0.2543 -2.07 0.0385
Male, age 85-89 -0.3199 0.2556 -1.25 0.2108
Male, age 90-94 -0.2207 0.2692 -0.82 0.4123
Male, age 95 and older 0 0 - .
Disability 0.3827 0.2505 1.53 0.1265
Dual Eligible 0.1428 0.0292 4.89 <.0001
Medicare-Aged -0.0547 0.1195 -0.46 0.6471
Medicare-Disabled 0.0222 0.1278 0.17 0.8619
219
Parameter Estimate Standard
Error Z
Value Significance
Level
Medicare-ESRD 0 0 . .
MS-DRG: Complications and Comorbidity 0.7909 0.0326 24.28 <.0001
MS-DRG:Major Complications and Comorbidity 0.4004 0.0269 14.91 <.0001
Number of IP visits in last 12 months for condition 0.6023 0.3464 1.74 0.0821
Number of ED visits in last 12 months for condition -1.4386 0.1328 -10.83 <.0001
Death in episode window 0.317 0.1086 2.92 0.0035
220
Table 14.Non- Laparoscopic Cholecystectomy- Regression of 30-day Episode Costs for Non- Laparoscopic Cholecystectomy Episodes (N=3,701)
Trauma in Episode HCC155:Major Head Injury 0.214 0.5313 0.4 0.6871 Trauma in Episode HCC157:Vertebral Fractures without Spinal Cord Injury 0.5044 0.3085 1.63 0.1021
Trauma in Episode HCC158:Hip Fracture/Dislocation 1.149 0.2233 5.15 <.0001
Trauma in Episode HCC161:Traumatic Amputation 0.2902 0.1181 2.46 0.014 Trauma in Episode HCC164:Major Complications of Medical Care and Trauma 0.6035 0.0568 10.63 <.0001 Trauma in Episode HCC177:Amputation Status, Lower Limb/Amputation Complications 0.3286 0.1905 1.73 0.0845
Female, Infant - age 34 -0.7625 0.6539 -1.17 0.2436
Female, age 35-44 -0.7019 0.5356 -1.31 0.19
Female, age 45-54 -0.459 0.5305 -0.87 0.387
Female, age 55-59 -0.4895 0.5197 -0.94 0.3463
Female, age 60-64 -0.1866 0.5456 -0.34 0.7324
Female, age 65-69 -0.2977 0.3272 -0.91 0.3629
Female, age 70-74 -0.3958 0.3241 -1.22 0.222
Female, age 75-79 -0.2637 0.3216 -0.82 0.4122
Female, age 80-84 -0.0373 0.3214 -0.12 0.9076
Female, age 85-89 0.0021 0.3206 0.01 0.9948
Female, age 90-94 0.0584 0.3262 0.18 0.858
Female, age 95 and older -0.0872 0.3474 -0.25 0.8018
Male, Infant - age 34 -0.7985 0.5391 -1.48 0.1386
Male, age 35-44 -0.5756 0.5342 -1.08 0.2812
Male, age 45-54 -0.1983 0.5184 -0.38 0.7021
Male, age 55-59 -0.0499 0.5257 -0.09 0.9243
Male, age 60-64 0.0577 0.5938 0.1 0.9225
Male, age 65-69 -0.6172 0.3237 -1.91 0.0566
Male, age 70-74 -0.4934 0.3205 -1.54 0.1237
Male, age 75-79 -0.3347 0.3206 -1.04 0.2966
Male, age 80-84 -0.2441 0.3187 -0.77 0.4438
Male, age 85-89 0.038 0.3236 0.12 0.9065
Male, age 90-94 0.0214 0.3309 0.06 0.9485
Male, age 95 and older 0 0 - .
Disability 0.2233 0.4491 0.5 0.6191
Dual Eligible 0.1079 0.0542 1.99 0.0466
Medicare-Aged -0.4049 0.2022 -2 0.0453
Medicare-Disabled 0.0216 0.4063 0.05 0.9575
223
Parameter Estimate Standard
Error Z
Value Significance
Level
Medicare-ESRD 0 0 . .
MS-DRG: Complications and Comorbidity 0.598 0.13 4.6 <.0001
MS-DRG:Major Complications and Comorbidity 0.2256 0.1162 1.94 0.0522
MS-DRG: Common Duct Exploration -0.1295 0.1563 -0.83 0.4073
Number of IP visits in last 12 months for condition 0.2588 0.2533 1.02 0.3069
Number of ED visits in last 12 months for condition 0 0 . .
224
Table 15.Medical Back Pain- Regression of 30-day Episode Costs for Medical Back Pain (N=9,904)
Parameter Estimate Standard
Error Z
Value Significance
Level
Intercept 14.0068 3.6117 3.88 0.0001 HCC1:HIV/AIDS -0.0269 0.3035 -0.09 0.9295 HCC2:Septicemia/Shock -0.0987 0.057 -1.73 0.0832 HCC5:Opportunistic Infections -0.1477 0.1451 -1.02 0.3088 HCC7:Metastatic Cancer and Acute Leukemia -0.1527 0.0626 -2.44 0.0147 HCC8:Lung, Upper Digestive Tract, and Other Severe Cancers 0.0145 0.0875 0.17 0.8687 HCC9:Lymphatic, Head and Neck,Brain and Other Major Cancers -0.1292 0.0624 -2.07 0.0386 HCC10:Breast, Prostate, Colorectal and Other Cancers and Tumors -0.0521 0.0364 -1.43 0.153 HCC15:Diabetes with Renal or Peripheral Circulatory Manifestation -0.1025 0.0469 -2.18 0.029 HCC16:Diabetes with Neurologic or Other Specified Manifestation -0.0513 0.0499 -1.03 0.3033 HCC17:Diabetes with Acute Complications -0.2819 0.277 -1.02 0.3088 HCC18:Diabetes with Ophthalmologic or Unspecified Manifestation -0.2295 0.1025 -2.24 0.0252 HCC19:Diabetes without Complication -0.031 0.0307 -1.01 0.3124 HCC21:Protein-Calorie Malnutrition 0.0559 0.0568 0.98 0.3247 HCC25:End-Stage Liver Disease -0.1936 0.1257 -1.54 0.1234 HCC26:Cirrhosis of Liver -0.0738 0.1192 -0.62 0.5357 HCC27:Chronic Hepatitis -0.0128 0.1378 -0.09 0.9257 HCC31:Intestinal Obstruction/Perforation 0.0105 0.0547 0.19 0.8472 HCC32:Pancreatic Disease 0.0415 0.0523 0.79 0.4279 HCC33:Inflammatory Bowel Disease: -0.0952 0.0935 -1.02 0.3086 HCC37:Bone/Joint/Muscle Infections/Necrosis -0.1227 0.0822 -1.49 0.1352 HCC38:Rheumatoid Arthritis and Inflammatory Connective Tissue Disease -0.0595 0.0339 -1.76 0.079 HCC44:Severe Hematological Disorders 0.0076 0.0673 0.11 0.9098 HCC45:Disorders of Immunity -0.0563 0.0785 -0.72 0.473 HCC51:Drug/Alcohol Psychosis 0.0354 0.0827 0.43 0.6687 HCC52:Drug/Alcohol Dependence 0.0888 0.083 1.07 0.2843 HCC54:Schizophrenia -0.1875 0.0916 -2.05 0.0406 HCC55:Major Depressive, Bipolar, and Paranoid Disorders -0.0651 0.0428 -1.52 0.1279 HCC67:Quadriplegia, Other Extensive Paralysis -0.1288 0.1606 -0.8 0.4228 HCC68:Paraplegia -0.2953 0.151 -1.96 0.0504 HCC69:Spinal Cord Disorders/Injuries -0.1402 0.0598 -2.35 0.019 HCC70:Muscular Dystrophy 0.0721 0.3761 0.19 0.8481 HCC71:Polyneuropathy: -0.0715 0.0348 -2.06 0.0396 HCC72:Multiple Sclerosis 0.0172 0.1301 0.13 0.8947 HCC73:Parkinsons and Huntingtons Diseases -0.1026 0.0512 -2 0.045
Level Age Older than 65 Years -0.0501 0.00156 1029.497 <.0001 Male -0.1349 0.0115 138.7039 <.0001 Disability -0.0158 0.1435 0.0121 0.9126 Dual Eligible 0.051 0.0134 14.3737 0.0001 Medicare-Aged 0.1149 0.1517 0.5739 0.4487 Medicare-Disabled -0.2432 0.1507 2.6035 0.1066 MS-DRG: Complications and Comorbidity -0.1705 0.018 89.9711 <.0001 MS-DRG:Major Complications and Comorbidity -0.4583 0.0174 696.5368 <.0001 Number of IP visits in last 12 months for condition -0.0757 0.0132 33.1174 <.0001 Number of ED visits in last 12 months for condition -0.0882 0.0126 49.1121 <.0001
HCC164:Major Complications of Medical Care and Trauma -0.4793 0.0178 722.0348 <.0001
HCC174:Major Organ Transplant Status -0.1782 0.0679 6.8799 0.0087
HCC176:Artificial Openings for Feeding or Elimination -0.237 0.0401 34.9272 <.0001
239
Parameter Estimate Standard
Error
Wald Chi-
Square Significance
Level HCC177:Amputation Status, Lower Limb/Amputation Complications -0.1028 0.0416 6.0944 0.0136 Age Older than 65 Years 0.00842 0.00109 59.7377 <.0001 Male 0.0482 0.0083 33.7569 <.0001 Disability -0.0532 0.0621 0.733 0.3919 Dual Eligible 0.00518 0.00937 0.3055 0.5805 Medicare-Aged -0.0963 0.0684 1.9825 0.1591 Medicare-Disabled -0.00213 0.065 0.0011 0.9738 MS-DRG: Complications and Comorbidity 0.0882 0.0107 67.4542 <.0001 MS-DRG:Major Complications and Comorbidity 0.3509 0.0118 883.0399 <.0001 Number of IP visits in last 12 months for condition -0.1605 0.00885 328.7599 <.0001 Number of ED visits in last 12 months for condition -0.0776 0.00901 74.1785 <.0001
Model Fit Statistics
Criterion Intercept Only
Intercept and Covariates
AIC 119702.6 99872.13 SC 119712.18 100667.46
240
Table 2 (a): Medical AMI: Regression of 30-day Survival Likelihood for 30-day episodes of Medical AMI (N=34,194)
Parameter Estimate Standard
Error
Wald Chi-
Square Significance
Level Intercept -0.3981 1.4825 0.0721 0.7883 HCC1:HIV/AIDS 0.0504 0.2692 0.035 0.8516 HCC2:Septicemia/Shock -0.2621 0.0286 84.0871 <.0001 HCC5:Opportunistic Infections 0.1484 0.1214 1.4946 0.2215 HCC7:Metastatic Cancer and Acute Leukemia -0.6738 0.0477 199.3967 <.0001 HCC8:Lung, Upper Digestive Tract, and Other Severe Cancers -0.3401 0.0589 33.3626 <.0001 HCC9:Lymphatic, Head and Neck,Brain and Other Major Cancers -0.08 0.0651 1.5098 0.2192 HCC10:Breast, Prostate, Colorectal and Other Cancers and Tumors 0.1893 0.0538 12.3796 0.0004 HCC15:Diabetes with Renal or Peripheral Circulatory Manifestation 0.396 0.0475 69.6343 <.0001 HCC16:Diabetes with Neurologic or Other Specified Manifestation 0.2269 0.054 17.6484 <.0001 HCC17:Diabetes with Acute Complications 0.277 0.1365 4.1178 0.0424 HCC18:Diabetes with Ophthalmologic or Unspecified Manifestation 0.2924 0.0974 9.0147 0.0027 HCC19:Diabetes without Complication 0.106 0.0222 22.7911 <.0001 HCC21:Protein-Calorie Malnutrition -0.1588 0.0328 23.3702 <.0001 HCC25:End-Stage Liver Disease -0.407 0.1015 16.0866 <.0001 HCC26:Cirrhosis of Liver -0.0885 0.1352 0.4288 0.5126 HCC27:Chronic Hepatitis 0.1503 0.1976 0.5783 0.447 HCC31:Intestinal Obstruction/Perforation -0.1174 0.0507 5.3544 0.0207 HCC32:Pancreatic Disease 0.0116 0.074 0.0248 0.8749 HCC33:Inflammatory Bowel Disease: 0.132 0.1195 1.2201 0.2693 HCC37:Bone/Joint/Muscle Infections/Necrosis -0.0116 0.1036 0.0126 0.9105 HCC38:Rheumatoid Arthritis and Inflammatory Connective Tissue Disease 0.168 0.0642 6.8451 0.0089 HCC44:Severe Hematological Disorders 0.0694 0.0601 1.3358 0.2478 HCC45:Disorders of Immunity 0.2459 0.1109 4.9172 0.0266 HCC51:Drug/Alcohol Psychosis 0.3201 0.123 6.7734 0.0093 HCC52:Drug/Alcohol Dependence -0.0598 0.1439 0.1728 0.6776 HCC54:Schizophrenia -0.0364 0.1229 0.0878 0.7669 HCC55:Major Depressive, Bipolar, and Paranoid Disorders 0.2936 0.065 20.4316 <.0001 HCC67:Quadriplegia, Other Extensive Paralysis -0.1615 0.1021 2.5032 0.1136 HCC68:Paraplegia 0.2652 0.2079 1.6273 0.2021 HCC69:Spinal Cord Disorders/Injuries 0.0748 0.1458 0.2629 0.6081 HCC70:Muscular Dystrophy 0.0342 0.5414 0.004 0.9497 HCC71:Polyneuropathy: 0.2479 0.063 15.4853 <.0001 HCC72:Multiple Sclerosis -0.0161 0.1751 0.0085 0.9265 HCC73:Parkinsons and Huntingtons Diseases 0.00756 0.0638 0.014 0.9057
Level MS-DRG: Complications and Comorbidity -0.2083 0.0336 38.3892 <.0001 MS-DRG:Major Complications and Comorbidity -0.3722 0.0314 140.674 <.0001 Number of IP visits in last 12 months for condition -0.0298 0.00842 12.5215 0.0004 Number of ED visits in last 12 months for condition -0.1519 0.0863 3.0973 0.0784
Level Medicare-Disabled -4.696 207.1 0.0005 0.9819 MS-DRG: Complications and Comorbidity -0.107 0.6797 0.0248 0.8749 MS-DRG:Major Complications and Comorbidity 0.8428 0.8969 0.883 0.3474 Number of IP visits in last 12 months for condition 0.000398 0.2118 0 0.9985 Number of ED visits in last 12 months for condition 7.6531 149.4 0.0026 0.9591
HCC176:Artificial Openings for Feeding or Elimination 0.0179 0.037 0.2329 0.6294 HCC177:Amputation Status, Lower Limb/Amputation Complications 0.0351 0.0725 0.234 0.6286 Age Older than 65 Years -0.00286 0.00136 4.4142 0.0356 Male -0.00159 0.0109 0.0214 0.8837 Disability -0.0746 0.1037 0.5168 0.4722 Dual Eligible -0.0142 0.0121 1.3779 0.2405 Medicare-Aged -0.0467 0.1174 0.1582 0.6908 Medicare-Disabled 0.0151 0.1068 0.02 0.8876 MS-DRG: Complications and Comorbidity 0.00739 0.0134 0.3027 0.5822 MS-DRG:Major Complications and Comorbidity 0.014 0.0171 0.6681 0.4137 Number of IP visits in last 12 months for condition -0.0226 0.0227 0.9952 0.3185 Number of ED visits in last 12 months for condition 0.1083 0.0266 16.5154 <.0001
HCC174:Major Organ Transplant Status 0.0415 0.0696 0.3544 0.5517 HCC176:Artificial Openings for Feeding or Elimination -0.0536 0.031 2.9997 0.0833 HCC177:Amputation Status, Lower Limb/Amputation Complications 0.0365 0.063 0.3352 0.5626 Age Older than 65 Years 0.0005 0.00118 0.1782 0.6729 Male 0.00424 0.00948 0.2005 0.6543 Disability -0.00369 0.0894 0.0017 0.9671 Dual Eligible 0.00029 0.0106 0.0008 0.9778 Medicare-Aged 0.00289 0.1011 0.0008 0.9772 Medicare-Disabled 0.0014 0.0922 0.0002 0.9879 MS-DRG: Complications and Comorbidity -0.0119 0.0117 1.0347 0.3091 MS-DRG:Major Complications and Comorbidity -0.00847 0.0149 0.3212 0.5709 Number of IP visits in last 12 months for condition -0.2686 0.0173 242.1864 <.0001 Number of ED visits in last 12 months for condition -0.1128 0.0163 48.0923 <.0001
Level Age Older than 65 Years -0.00174 0.00236 0.5435 0.461 Male -0.00471 0.0172 0.0755 0.7835 Disability 0.1475 0.3778 0.1524 0.6962 Dual Eligible 0.0211 0.0187 1.2712 0.2595 Medicare-Aged 0.1079 0.4119 0.0686 0.7934 Medicare-Disabled -0.1741 0.3843 0.2054 0.6504 MS-DRG: Complications and Comorbidity 0.0176 0.0209 0.712 0.3988 MS-DRG:Major Complications and Comorbidity 0.0339 0.0216 2.4615 0.1167 Number of IP visits in last 12 months for condition -0.00203 0.0194 0.011 0.9163 Number of ED visits in last 12 months for condition -0.0167 0.0125 1.7756 0.1827
Level Age Older than 65 Years 0.000737 0.00127 0.3338 0.5634 Male 0.0106 0.00928 1.3041 0.2535 Disability 0.1114 0.1937 0.3307 0.5653 Dual Eligible -0.00944 0.01 0.8875 0.3461 Medicare-Aged 0.1265 0.2115 0.3579 0.5497 Medicare-Disabled -0.0448 0.1965 0.0521 0.8195 MS-DRG: Complications and Comorbidity 0.00668 0.0113 0.3468 0.556 MS-DRG:Major Complications and Comorbidity 0.00269 0.0116 0.0531 0.8177 Number of IP visits in last 12 months for condition -0.2466 0.00933 698.8072 <.0001 Number of ED visits in last 12 months for condition -0.1043 0.00699 222.9515 <.0001
Table 5 (b): Hip Replacement: Regression of 30-day Likelihood of No Potentially Preventable Readmissions for 30-day episodes of Hip Replacement (N=24,603)
Parameter Estimate Standard
Error
Wald Chi-
Square Significance
Level Intercept -8.1114 55.209 0.0216 0.8832 HCC1:HIV/AIDS -0.256 0.1346 3.6161 0.0572 HCC2:Septicemia/Shock -0.5263 0.067 61.6451 <.0001 HCC5:Opportunistic Infections -0.0149 0.0217 0.4681 0.4939 HCC7:Metastatic Cancer and Acute Leukemia -0.0408 0.1054 0.1499 0.6986 HCC8:Lung, Upper Digestive Tract, and Other Severe Cancers -0.0687 0.1287 0.2852 0.5933 HCC9:Lymphatic, Head and Neck,Brain and Other Major Cancers -0.1796 0.077 5.4377 0.0197 HCC10:Breast, Prostate, Colorectal and Other Cancers and Tumors -0.1562 0.0487 10.2727 0.0014 HCC15:Diabetes with Renal or Peripheral Circulatory Manifestation -0.157 0.0881 3.1773 0.0747 HCC16:Diabetes with Neurologic or Other Specified Manifestation -0.3017 0.0684 19.4736 <.0001 HCC17:Diabetes with Acute Complications -0.3736 0.2507 2.2201 0.1362 HCC18:Diabetes with Ophthalmologic or Unspecified Manifestation -0.2364 0.1172 4.0662 0.0437 HCC19:Diabetes without Complication -0.1081 0.0249 18.8406 <.0001 HCC21:Protein-Calorie Malnutrition -0.301 0.0609 24.4603 <.0001 HCC25:End-Stage Liver Disease 0.0978 0.2478 0.1558 0.6931 HCC26:Cirrhosis of Liver -0.2558 0.1399 3.3445 0.0674 HCC27:Chronic Hepatitis -0.0858 0.1356 0.4002 0.527 HCC31:Intestinal Obstruction/Perforation -0.3114 0.0547 32.4178 <.0001 HCC32:Pancreatic Disease -0.2633 0.0718 13.4326 0.0002 HCC33:Inflammatory Bowel Disease: -0.0587 0.1069 0.3019 0.5827 HCC37:Bone/Joint/Muscle Infections/Necrosis -0.0557 0.0298 3.4845 0.0619 HCC38:Rheumatoid Arthritis and Inflammatory Connective Tissue Disease -0.1668 0.0366 20.7524 <.0001 HCC44:Severe Hematological Disorders -0.271 0.0846 10.2728 0.0014 HCC45:Disorders of Immunity -0.2661 0.1357 3.8442 0.0499 HCC51:Drug/Alcohol Psychosis -0.2429 0.0658 13.6255 0.0002 HCC52:Drug/Alcohol Dependence -0.1725 0.1008 2.9258 0.0872 HCC54:Schizophrenia 0.0142 0.1492 0.0091 0.9239 HCC55:Major Depressive, Bipolar, and Paranoid Disorders -0.34 0.0525 41.9898 <.0001 HCC67:Quadriplegia, Other Extensive Paralysis -0.9153 0.2436 14.1236 0.0002 HCC68:Paraplegia -1.0297 0.2821 13.3283 0.0003 HCC69:Spinal Cord Disorders/Injuries -0.1546 0.1161 1.7744 0.1828 HCC70:Muscular Dystrophy 0.1089 0.5663 0.037 0.8475 HCC71:Polyneuropathy: -0.3538 0.046 59.0614 <.0001 HCC72:Multiple Sclerosis -0.3034 0.1825 2.7635 0.0964 HCC73:Parkinsons and Huntingtons Diseases -0.1852 0.0793 5.4548 0.0195