Alternatives for Bio-Butanol Production Feasibility study presented to Statoil 12/5-2011 Tutors Sixten Dahlbom Hans T. Karlsson Hanna Landgren Christian Hulteberg Peter Fransson Industry advisor/Statoil representatives Børre Tore Børresen Per Nygård
Transcript
I
Alternatives for Bio-Butanol Production
Feasibility study presented to Statoil
12/5-2011 Tutors
Sixten Dahlbom Hans T. Karlsson
Hanna Landgren Christian Hulteberg
Peter Fransson
Industry advisor/Statoil
representatives
Børre Tore Børresen
Per Nygård
I
Abstract
Title: Alternatives for Bio-Butanol Production
Authors: Sixten Dahlbom, Hanna Landgren and Peter Fransson
Advisors: Hans T. Karlsson, Christian Hulteberg, Per Nygård and Børre Tore
Børresen
Course: KET050 (Projektering)
Aim: The aim of this project is to improve the production of butanol
through comparison with a butanol process investigated in 2008,
and some other alternative butanol processes. The processes
consist of: Identical butanol production plant as in the report from
2008, but with other purification processes. As well as using a
similar ethanol plant as in the report from 2008 but with a
chemical conversion of ethanol into butanol. The latter can be
performed in a single- or multi-step procedure. For these
alternatives the group will consider energy balances as well as
investments and production costs.
Methodology: The group will first perform a literature survey and then simulate
the best alternative for production of butanol. When the simulation
is finished the group will calculate the costs of production and
investment.
Theory: ASPEN PLUS is used for the simulations and the Ulrich method is
utilized for economical calculations.
Data collection: Mostly secondary data will be used; electronic sources and books.
Also some primary data will be used; help from the advisors are
used in this project.
Results: The results point at obvious flaws in the production of butanol
through indirect synthesis using a condensation reactions, these
drawbacks are mostly consisting of the poor productivity and large
production of side products. None of the studied alternatives seems
to be profitable, although out of the five compared alternatives the
two perstraction methods are the most promising. The two
perstraction methods have pay-off times of 15.2 years compared to
the process using HAP as a catalyst which has a pay-off time of
40.1 years, with the current cost and revenue situation.
1.3.1 The Simulation Program Aspen plus ........................................................................ 2 1.4 Economic Assessment ...................................................................................................... 2
1.5 The Feedstock .................................................................................................................. 2 1.6 The Bacteria, Clostridiaceae ............................................................................................ 3 1.7 Background ...................................................................................................................... 3
1.9 Risk Aspects in the Butanol Process ................................................................................ 4 2 Separation Processes to the ABE Fermentation ...................................................................... 5
3 Direct and Indirect Butanol Synthesis from Ethanol ............................................................ 20
3.1 Direct Synthesis .............................................................................................................. 20
3.1.1 Hydroxyapatite (HAP) as Catalyst .......................................................................... 20 3.1.2 Magnesium Oxide (MgO) as Catalyst ..................................................................... 23 3.1.3 Zeolites as Catalyst .................................................................................................. 23 3.1.4 Process Flow Diagram, Direct synthesis ................................................................. 23 3.1.5 Simulation Results for Direct Synthesis .................................................................. 25 3.1.6 Further Investigations and Improvements ............................................................... 28
3.2.4 Process Flow Diagram, Indirect Synthesis .............................................................. 31
4 Financial Analysis ................................................................................................................. 32 4.1 Investment Expenditure for the five Alternatives .......................................................... 33
4.2 Operating Costs for the five Alternatives ....................................................................... 35 4.3 Revenue for the five Alternatives ................................................................................... 37 4.4 Production cost for the five Alternatives ........................................................................ 37
4.5 Net Present Value for the five Alternatives.................................................................... 37 4.6 Pay-Off Time for the five Alternatives .......................................................................... 38
4.7 Sensitivity Analysis for the Five Alternatives ................................................................ 39 4.8 Financial Comparison of the five Alternatives .............................................................. 41
For 20 weeks, a group consisting of four students from Lund University in Sweden will work
together with Statoil ASA, Norway. The group will continue the study made by Larsson, E. et
al.[1]
: A feasibility study on conversion of an ethanol plant to a butanol plant.
More in detail, the group will investigate different separation methods for purification of the
products from the butanol fermentation described by Larsson, E. et al. [1]
. The group will also
study whether it is economically sustainable to convert ethanol to butanol. The ethanol will be
produced by the existing plant described by Larsson, E. et al. To assist the group, tutors from
both Lund University (Hans T. Karlsson and Christian Hulteberg) and from Statoil ASA
(Børre Tore Børresen and Per Nygård) are involved.
1.1 Company Presentation Statoil is an international company with activity in 34 countries and with the headquarters in
Norway. The company is large, with around 20 000 employees worldwide and is publicly
traded on the New York stock exchange. Statoil wants to grow even more and operate in more
countries than they do today. [2]
Figure 1 below shows in which countries Statoil has offices
today. [3]
Figure 1: Shows which countries Statoil operates in.
[3]
Statoil produces electricity, oil, methanol as well as ethanol and has a large focus on natural
recourses. Because of the fact that Statoil believes that natural gas will be more and more
important in the future, they put large effort on finding supplies and harvesting it. Even
though Statoil is currently coupled to negative environmental impact they try to compensate
for it by paying respect to issues that can be improved in order to decrease their impact on the
environment.[2]
1.2 Aim In order to reduce the dependence of fossil fuels, production of butanol as a gasoline
substitute, diesel substitute or additive is an interesting alternative. Butanol is historically
mainly produced by fermentation, but the toxicity of butanol to the organism producing it
leads to low production, the concentration in the fermenter will be at most 1-2wt% butanol.
However, today almost all butanol is produced from propane using the oxo process. Another
problem with the fermentation route is that the butanol has to be separated from the
2
fermentation broth, which costs a lot of money and energy. To improve the process of butanol
production, the group will compare a process studied in 2008[1]
with some other processes.
These are:
• Identical butanol plant as in the report from 2008[1]
, but with other purification
processes.
• Using a similar ethanol plant as in the report from 2008[1]
and afterwards convert
ethanol to butanol. This can be performed in a single- or multi-step procedure.
For the three alternatives listed above the group will consider:
• Energy balances
• Investment costs
• Production costs
1.3 Method The project will start by making a literature survey where facts will be gathered from
primarily peer-reviewed articles, but also from books. The literature study will be used as a
basis for performing calculations on parameters such as investment and production costs, as
well as energy efficiencies. Simulations of the process will be performed in the computer
program Aspen. Data that might be of interest can be viewed in appendix A.
1.3.1 The Simulation Program Aspen plus
Aspen plus is a flow sheeting software, that lets the user draw large and advanced industrial
processes. It also simulates and calculates mass and energy balances. The software includes
physical properties for a numerous chemicals, and features a vast variety of models for phase
equilibrium calculations. Aspen will be used in the project for simulation of the overall
process, along with the occasional integration of MATLAB code.
1.4 Economic Assessment The production economy will be calculated using the Ulrich method where the results contain
both operation and investment costs.
1.5 The Feedstock The feedstock that will be used to produce butanol is lignocellulose, which is a combination
of cellulose, hemicellulose and lignin. Lignocellulose is the largest of the world’s carbon
based renewable natural resources and exists in plants and trees. [4]
The lignocellulose to be
used in this project consists of 40-50% cellulose 15-25% hemicellulose and 15-30% lignin.
Cellulose is a polysaccharide consisting of multiple glucoses on a chain, hemicelluloses is
similar but consists of several different sugars, not only glucose. Lignin is a large
macromolecule which acts as a glue binding together all the polysaccharides. These three
substances are the main components of trees and the lignocellulose to be fermented. Since the
sugars are bound in polysaccharides they will need to be broken down before the butanol
producing cells can utilize them as feed. The composition of spruce and its bark is seen in
table 1 below. [1]
3
Table 1: The raw material composition. [1]
Component Spruce Bark
Glucan 44.0 31.3
Xylan 6.0 4.0
Galaktan 2.3 3.4
Arabinan 2.0 5.0
Mannan 13.0 4.2
Lignin 27.0 31.9
Ash - -
Other 3.5 -
1.6 The Bacteria, Clostridiaceae To produce butanol a bacteria family called Clostridiaceae is used. These bacteria produce
solvents (butanol, ethanol and acetone, therefore the fermentation is called ABE-
fermentation), organic acids (acetate and butyrate) and gases (carbon dioxide and hydrogen).
Depending on which bacteria that is used, different parameters are relevant. One possible
bacterium is Clostridium saccharoperbutylaccetonicum which during anaerobic immobilized
cell batch systems can reach productivities of 0.36gABE L-1
h-1
at PH 6.0 and a temperature of
30°C. C. Saccharoperbutylaccetonicum is a hyper butanol producing strain and it is somewhat
resistant to the product inhibition, therefore it can produce a higher concentration of butanol
than the commonly used bacteria. In large scale production it might be best to use
immobilized microbial cells since they have many advantages, they are e.g. easier to separate
from the product, they can reach a higher cell density and the productivity is greatly
improved. At most these bacteria can grow up to a total solvent concentration of 20gABE L-1
.
The results are based on cultures growing in a medium containing a pure carbon source, in our
case a complex medium is used consisting of lignocellulose as carbon source which will most
likely lower the production rate.[5]
1.7 Background The purity of butanol shall be 99.5 wt%. The amount of ingoing dry spruce is 181 000 tons
per year.
In 2008 Larsson, E. et al.[1]
made a feasibility study on converting an ethanol plant to a
butanol plant. A flow diagram describing the existing ethanol plant can be viewed in figure 2.
To convert the ethanol plant to a butanol plant the following changes were suggested:
• The yeast in the fermentation step shall be changed to the bacteria Clostridium
Acetobutylicum.
• The total fermenter volume is to be increased.
• The distillation part of the plant has to be expanded, this because much more water is
included in the butanol processes.
• As with the distillation, the evaporation part is to be expanded.
For a detailed description of the existing ethanol plant or the suggested modifications please
review the report by Larsson, E. et al. [1]
. A simplified flow diagram describing the butanol
process is shown in figure 3.
4
Figure 2: Simplified flow diagram over the existing ethanol plant
[1]
Figure 3: Simplified flow diagram over the, by Larsson et al., suggested butanol process.
1.9 Risk Aspects in the Butanol Process In the butanol process there are only a few risks concerning the extra steps with regards to
producing butanol instead of ethanol. The bacteria cultures used (Clostridium) can cause
stomach problems if ingested [6]
. Of course there are some risks coupled to the equipment but
the risks are not larger than for the existing production of ethanol.
5
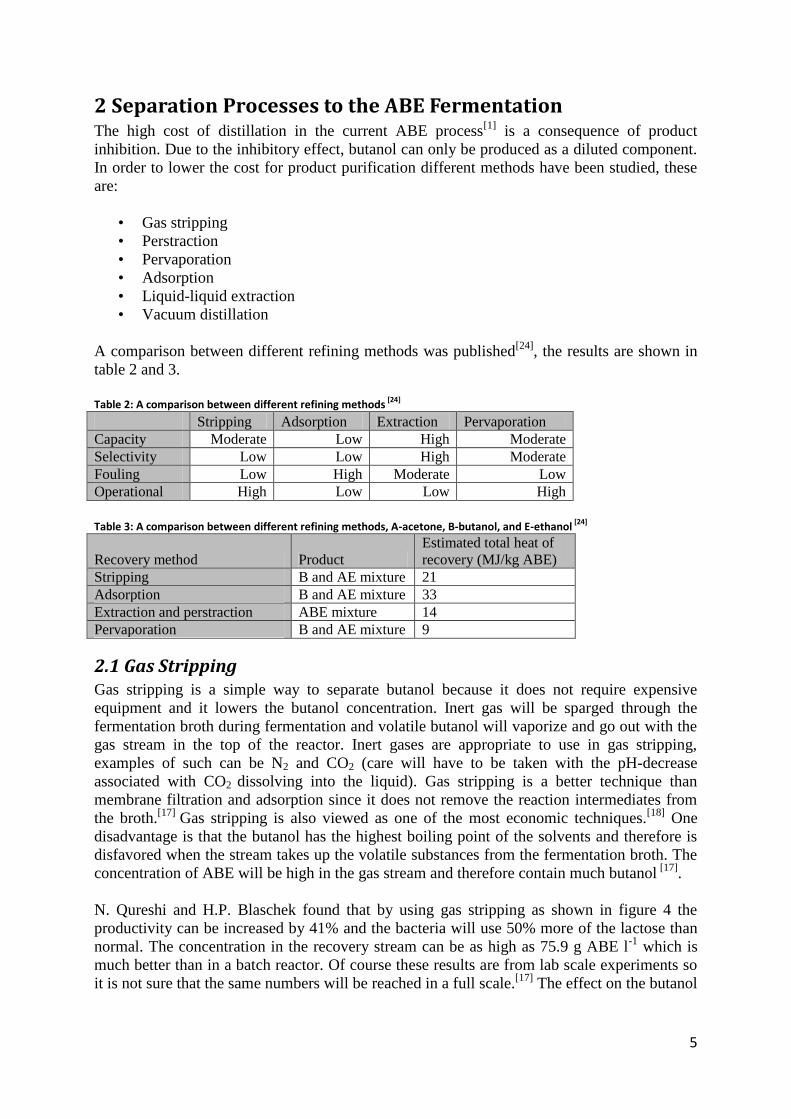
2 Separation Processes to the ABE Fermentation The high cost of distillation in the current ABE process
[1] is a consequence of product
inhibition. Due to the inhibitory effect, butanol can only be produced as a diluted component.
In order to lower the cost for product purification different methods have been studied, these
are:
• Gas stripping
• Perstraction
• Pervaporation
• Adsorption
• Liquid-liquid extraction
• Vacuum distillation
A comparison between different refining methods was published[24]
, the results are shown in
table 2 and 3.
Table 2: A comparison between different refining methods
[24]
Stripping Adsorption Extraction Pervaporation
Capacity Moderate Low High Moderate
Selectivity Low Low High Moderate
Fouling Low High Moderate Low
Operational High Low Low High
Table 3: A comparison between different refining methods, A-acetone, B-butanol, and E-ethanol
[24]
Recovery method Product
Estimated total heat of
recovery (MJ/kg ABE)
Stripping B and AE mixture 21
Adsorption B and AE mixture 33
Extraction and perstraction ABE mixture 14
Pervaporation B and AE mixture 9
2.1 Gas Stripping Gas stripping is a simple way to separate butanol because it does not require expensive
equipment and it lowers the butanol concentration. Inert gas will be sparged through the
fermentation broth during fermentation and volatile butanol will vaporize and go out with the
gas stream in the top of the reactor. Inert gases are appropriate to use in gas stripping,
examples of such can be N2 and CO2 (care will have to be taken with the pH-decrease
associated with CO2 dissolving into the liquid). Gas stripping is a better technique than
membrane filtration and adsorption since it does not remove the reaction intermediates from
the broth.[17]
Gas stripping is also viewed as one of the most economic techniques.[18]
One
disadvantage is that the butanol has the highest boiling point of the solvents and therefore is
disfavored when the stream takes up the volatile substances from the fermentation broth. The
concentration of ABE will be high in the gas stream and therefore contain much butanol [17]
.
N. Qureshi and H.P. Blaschek found that by using gas stripping as shown in figure 4 the
productivity can be increased by 41% and the bacteria will use 50% more of the lactose than
normal. The concentration in the recovery stream can be as high as 75.9 g ABE l-1
which is
much better than in a batch reactor. Of course these results are from lab scale experiments so
it is not sure that the same numbers will be reached in a full scale.[17]
The effect on the butanol
6
production varies with the gas recycle rate, acetone and ethanol concentrations in the broth
and gas bubble size. [19]
Figure 4: Flow sheet for gas stripping.
2.2 Membrane Separation Methods Two methods involving a membrane for purification have been investigated by the group.
These two methods are pervaporation and perstraction.[20,21,22]
2.2.1 Perstraction
The substance to be separated diffuses through a membrane into a solvent on the other side.
This way of separating liquids does not differentiate much from the method known as
extraction. However there is at least one benefit; the bacteria is separated from the solvent.
This enables the use of a solvent harmful to the bacteria. It is said that the diffusion of butanol
through the membrane is the rate controlling step[20]
. However as long as the production rate
in the reactor is even lower, this should not be a problem.
Qureshi, N. and Maddox, I.S. have studied the reduction in butanol inhibition using
perstraction. They used a silica tubing as membrane and oleyl alcohol as solvent. As substrate
they used lactose/whey permeate. Their result was satisfying; a lactose concentration of
227gL-1
could be used (compared with 28.6gL-1
normally), at this lactose concentration the
productivity was 0.07gL-1
. Using perstraction ca. 99 gL-1
h-1
(fermentation broth volume) ABE
was produced. The experiment was run for 391 hours and the concentration of ABE in the
oleyl alcohol was at maximum 9.75gL-1
. Figure 5 shows butanol, ethanol and butyric acid
concentrations in oleyl alcohol at various levels of these chemicals in aqueous phase during
the experiment. According to Qureshi, N. and Maddox, I.S no acetone can be found in the
organic solvent.
7
Figure 5: Butanol, ethanol and butyric acid concentrations in oleyl alcohol at various levels of these chemicals in aqueous phase during fermentation perstraction experiment.
[20]
In situ product separation in butanol fermentation by membrane-assisted extraction has been
studied by Jeon, Y.J.; Lee, Y.Y.[21]
. They used the same membrane and the same organic
solvent as Qureshi, N. and Maddox, I.S. The results of Jeon and Lee are depicted in table 4.
Table 4: Overall performance of membrane-extractive butanol fermentation.[21]
In figure 6 (below), a flow diagram that shows where the perstraction shall be implemented in
the ABE process.
8
Figure 6: Simplified flow diagram over the ABE process using perstraction.
2.2.2 Simulation Results for Perstraction
First of all it is important to mention that it is not sure that any suitable membrane exists,
therefore these results are speculative. However, as long as the solvent is not harmful to the
bacteria, about the same result can be achieved using extraction.
Since the bacteria are separated from the solvent by the membrane, a wide range of solvents
can be used. The group has mainly focused on two different solvents, mainly due to limited
time. The focus was on a 50/50 wt% decane/oleyl alcohol mixture and on mesitylene. The
reasons: the oleyl/decane mixture seems to be the most commonly used in experimental
reports and mesitylene was suggested by a research group to lower the energy demand in the
case of separating the products using extraction [35]
. According to this group’s results as low
as 5.7 MJ/kg butanol was needed using mesitylene (compared to 15 MJ/kg butanol using pure
oleyl alcohol). Since the solubility of mesitylene in water is extremely low they suggested that
the toxicity towards the bacteria might be negligible. If not, this can be solved using
perstraction, as long as a membrane with sufficient properties exists.
The fact that acetone, ethanol and butanol are removed continuously allows the process to be
run as a fed-batch process. Therefore the project group estimated that 20 fermenters are
needed (compared to originally 23), the retention time is 60 hours. The volume of each
fermenter shall be 1 039 m3 using mesitylene as solvent (the fermenter volume is 1000 m
3, the
extra volume is reserved for the solvent) and 1 062 m3 using oleyl alcohol/decane as solvent.
Inside every fermenter a membrane shall be placed, figure 7. The effective fermentation
volume is 800 m3.
9
Since the process is run as a fed-batch, fewer fermenters are needed, however they will
probably have to be washed and the lignin in the feed has to be removed somehow, emptying
the tank seems to be the easiest way of doing it. The outlet from the fermenter consists mostly
of water and lignin. When the fermenter is emptied, the outlet contains the same mass of
lignin as the mass of lignin retained from separation (only) by distillation, based on the same
time. The outlet is passed to an evaporator line. The design of the evaporation line depends on
how often the fermenters are to be emptied (energy demand and sizing), this will be left to
later studies. Due to time limitations, the group will consider the energy and the size to be the
same as in separation by distillation. The same goes for the pretreatment (size and energy).
Figure 7: A fermenter fitted with a membrane which on the other side has the solvent flowing
Depending on the membrane’s properties, different answers will be returned. The group has
made two assumptions, these are:
• Only acetone, butanol, ethanol and water can diffuse through the membrane.
• The mass transfer limitations are small enough to be neglected (since the production
rate is low). If not, a larger membrane area is needed to obtain the same result.
Whether water can diffuse through the membrane or not, as well as if the limitations in mass
transfer can be neglected, can be discussed.
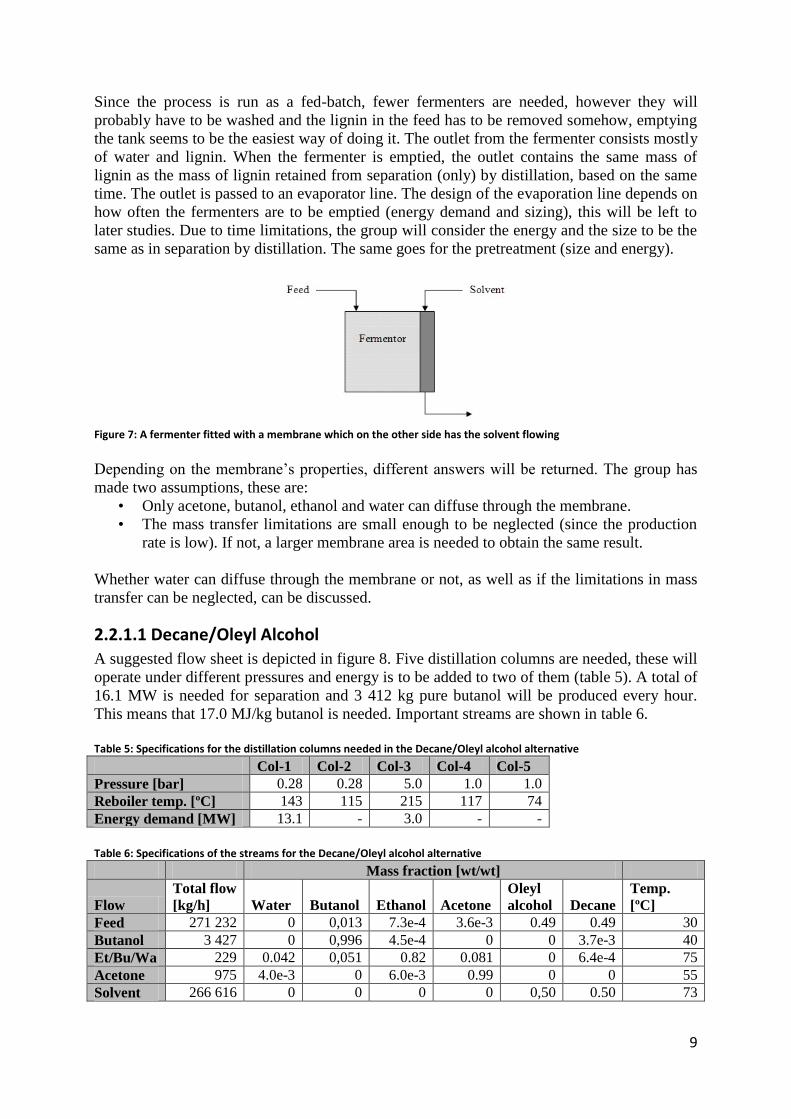
2.2.1.1 Decane/Oleyl Alcohol
A suggested flow sheet is depicted in figure 8. Five distillation columns are needed, these will
operate under different pressures and energy is to be added to two of them (table 5). A total of
16.1 MW is needed for separation and 3 412 kg pure butanol will be produced every hour.
This means that 17.0 MJ/kg butanol is needed. Important streams are shown in table 6.
Table 5: Specifications for the distillation columns needed in the Decane/Oleyl alcohol alternative
Col-1 Col-2 Col-3 Col-4 Col-5
Pressure [bar] 0.28 0.28 5.0 1.0 1.0
Reboiler temp. [ºC] 143 115 215 117 74
Energy demand [MW] 13.1 - 3.0 - -
Table 6: Specifications of the streams for the Decane/Oleyl alcohol alternative
Mass fraction [wt/wt]
Flow
Total flow
[kg/h] Water Butanol Ethanol Acetone
Oleyl
alcohol Decane
Temp.
[ºC]
Feed 271 232 0 0,013 7.3e-4 3.6e-3 0.49 0.49 30
Butanol 3 427 0 0,996 4.5e-4 0 0 3.7e-3 40
Et/Bu/Wa 229 0.042 0,051 0.82 0.081 0 6.4e-4 75
Acetone 975 4.0e-3 0 6.0e-3 0.99 0 0 55
Solvent 266 616 0 0 0 0 0,50 0.50 73
10
Figure 8: Flow sheet for Decane/oleyl alcohol alternative
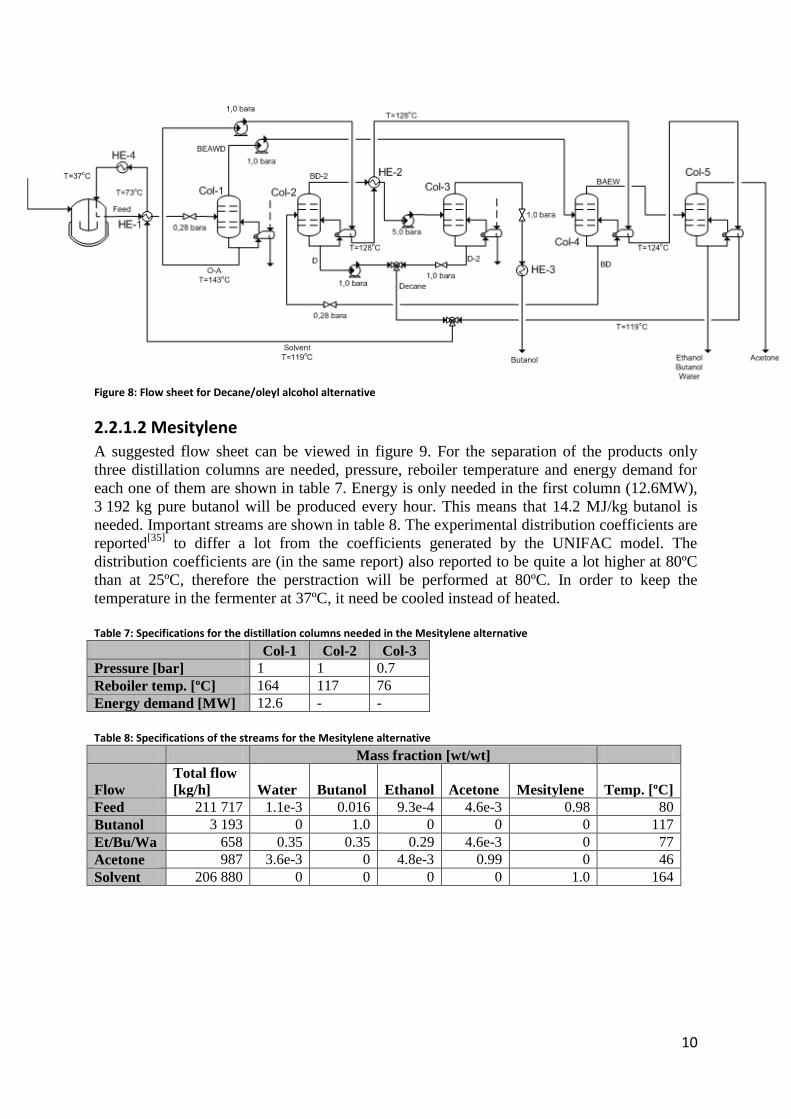
2.2.1.2 Mesitylene A suggested flow sheet can be viewed in figure 9. For the separation of the products only
three distillation columns are needed, pressure, reboiler temperature and energy demand for
each one of them are shown in table 7. Energy is only needed in the first column (12.6MW),
3 192 kg pure butanol will be produced every hour. This means that 14.2 MJ/kg butanol is
needed. Important streams are shown in table 8. The experimental distribution coefficients are
reported[35]
to differ a lot from the coefficients generated by the UNIFAC model. The
distribution coefficients are (in the same report) also reported to be quite a lot higher at 80ºC
than at 25ºC, therefore the perstraction will be performed at 80ºC. In order to keep the
temperature in the fermenter at 37ºC, it need be cooled instead of heated.
Table 7: Specifications for the distillation columns needed in the Mesitylene alternative
Col-1 Col-2 Col-3
Pressure [bar] 1 1 0.7
Reboiler temp. [ºC] 164 117 76
Energy demand [MW] 12.6 - -
Table 8: Specifications of the streams for the Mesitylene alternative
Mass fraction [wt/wt]
Flow
Total flow
[kg/h] Water Butanol Ethanol Acetone Mesitylene Temp. [ºC]
Feed 211 717 1.1e-3 0.016 9.3e-4 4.6e-3 0.98 80
Butanol 3 193 0 1.0 0 0 0 117
Et/Bu/Wa 658 0.35 0.35 0.29 4.6e-3 0 77
Acetone 987 3.6e-3 0 4.8e-3 0.99 0 46
Solvent 206 880 0 0 0 0 1.0 164
11
Figure 9: Flow sheet for the Mesitylene alternative
2.2.3 Pervaporation
Pervaporation and different membranes for this application has been studied by numerous
researchers. The group has focused on one report (due to limited time) and therefore it cannot
be guaranteed that this setup is the best, but it is experimentally verified. The report describes
ABE recovery by pervaporation using different silicate/silicone composite membranes from a
fed-batch reactor[22]
. Qureshi, N. et al. made their own membranes, the procedure is well
described in their report. The different membranes were characterized for flux and selectivity
(defined as in equation 1) at 78 °C using model ABE solution and actual fermentation broth,
the results are shown in table 9.
Selectivity = (y/(1 − y))/(x/(1 − x)) [Eq. 1]
y = weight fraction of component in permeate sample
x = weight fraction of component in retentate sample
In their further studies they choose the membrane with the highest selectivity towards butanol.
Their experimental setup is shown in figure 10. A UF-membrane is used between the reactor
and the pervaporation, this since the reactor temperature is 35 °C, but the pervaporation
temperature is 78 °C.
12
Table 9: Flux and selectivity of a silicate-silicone and silicone membranes using model solution and fermentation broth at 78 °C.
[22]
Figure 10: A schematic diagram of ABE production in fed-batch reactor and recovery by pervaporation (a) fermentation reactor; (b) ultra filtration membrane unit; (c) buffer tank; (d) pervaporation membrane unit (e) cold traps. (1.1) cell culture stream; (1.2) ultra filtration membrane permeate; (1.3) pervaporation membrane retentate recycle; (1.4) cell free fermentation broth recycle stream through pervaporation membrane; (1.5) pervaporation membrane permeate stream. [22]
Qureshi, N. et al. showed that the butanol selectivity not was affected by the broth. The
experiment lasted for 120 hours. They also showed that ethanol and acetic acid not diffused
through the membrane at concentrations lower than 0.04gL-1
. In total the fed batch reactor
was operated for 870 hours and 155 gL-1
solvent was produced. The solvent yield (g solvents/
g glucose utilized) was 0.31 – 0.35.
2.3 Adsorption A stream of fermentation broth from a butanol producing fermenter can be run through a
membrane filter or a centrifuge to separate the biomass from the water, butanol, ethanol and
acetone. The solids can then be recirculated to the fermenter while the liquids are run through
adsorption columns. The columns can be filled with hydrophobic adsorbents of almost any
kind (often silica). In the case of butanol production, the substances which will bond to the
column are butanol, ethanol, acetone and some water. The components not adsorbed will be
taken back to the fermenter. Thus the fermentation process can be run continuously, see figure
11.
13
Figure 11: Shows the process for absorption of butanol
[25].
After the packing in columns have adsorbed butanol it can be desorbed by increasing the
temperature to around 200°C. This has been suggested to greatly decrease the energy costs as
ordinary distillation would require 73.3 MJ/kg butanol, while adsorption only would need 8.2
MJ/kg. Two columns should be used to ensure continuous production, then the two columns
can alternate between being loaded (adsorption) and unloaded (desorption). [1]
Research has shown that some zeolites can favor adsorption of butanol over both ethanol and
acetone resulting in highly concentrated desorbed solutions. Studies have been made on the
adsorption of the ABE-system by zeolites where the feed consists of either filtered or non-
filtered fermentation broth. The results here also showed that butanol is favorably adsorbed on
the solid phase adsorbent; results can be seen in table 10. The table shows that about 100g
butanol/kg adsorbent can be reached which is a good result, but can be improved further if
used on industrial scale as adsorption material and conditions could be optimized further. The
desorbed solution will contain over 90% of butanol which is relatively high; the rest will
mostly contain acetone and some water. [23]
The butanol concentration can then be increased
further by distillation [1]
.
Table 10: Shows the feed concentrations and the adsorbed concentration of two filtered and two non-filtered fermentation broths.
[24]
14
2.4 Liquid-Liquid Extraction Liquid-liquid extraction is considered to be suitable for butanol recovery. The unit operation
can be placed inside as well as outside the fermentation tank[24]
.
To choose an appropriate organic solvent in the extraction setup, some considerations have to
be made[25]
:
• The solvent has to be compatible with the bacteria used for fermentation.
• The solvent has to have a high capacity for the fermentation products. This to
minimize the amount of solvent needed and the product recovery cost.
• If the products are recovered from the solution by distillation, the solvent should be
less volatile than the products. However it is important that the solvent is not so
nonvolatile that high pressure steam is needed in the reboiler.
• The solvent has to be barely soluble in water, this to minimize solvent losses.
A solvent with more or less these properties has been reported by Roffler, S. et al., namely
oleyl alcohol diluted to 50 wt% in decane[25]
. One can probably think of some other solvents,
but to the groups knowledge no other has been reported. It is imported to mention that oleyl
alcohol is toxic to the culture when exposed over a long period of time[26]
. Data for pure oleyl
alcohol and for the oleyl alcohol/decane mixture can be seen in table 11.
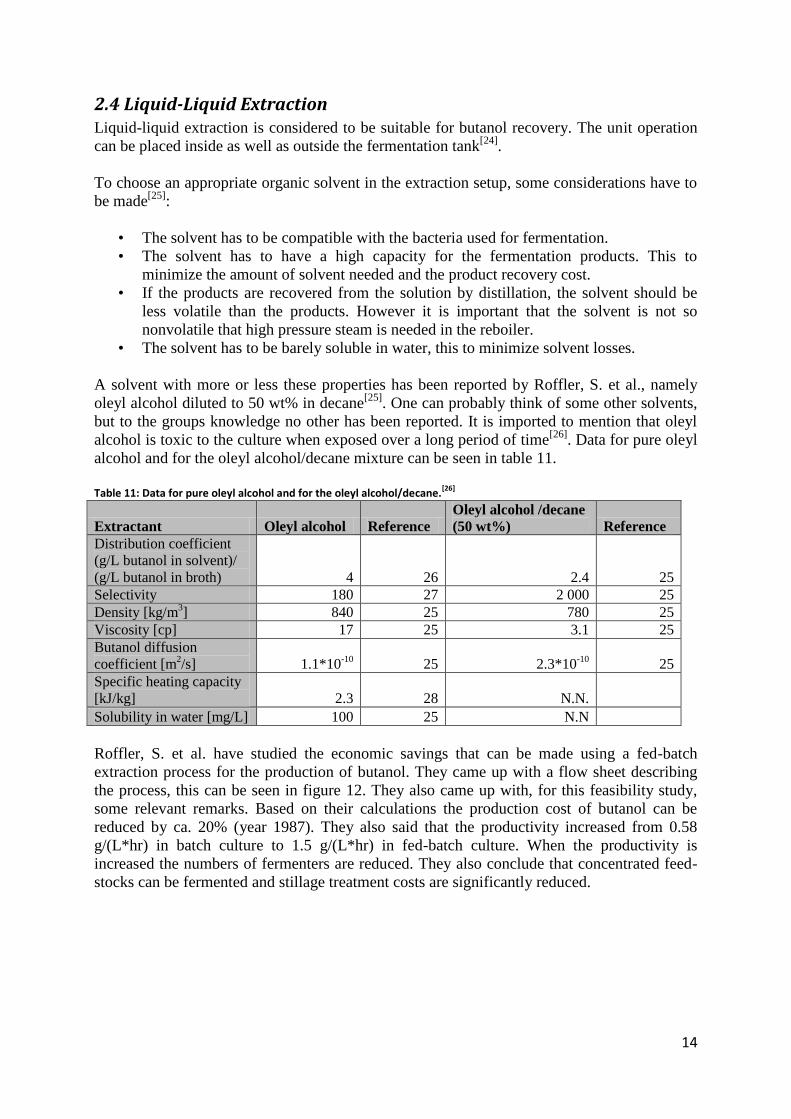
Table 11: Data for pure oleyl alcohol and for the oleyl alcohol/decane.
[26]
Extractant Oleyl alcohol Reference
Oleyl alcohol /decane
(50 wt%) Reference
Distribution coefficient
(g/L butanol in solvent)/
(g/L butanol in broth) 4 26 2.4 25
Selectivity 180 27 2 000 25
Density [kg/m3] 840 25 780 25
Viscosity [cp] 17 25 3.1 25
Butanol diffusion
coefficient [m2/s] 1.1*10
-10 25 2.3*10
-10 25
Specific heating capacity
[kJ/kg] 2.3 28 N.N.
Solubility in water [mg/L] 100 25 N.N
Roffler, S. et al. have studied the economic savings that can be made using a fed-batch
extraction process for the production of butanol. They came up with a flow sheet describing
the process, this can be seen in figure 12. They also came up with, for this feasibility study,
some relevant remarks. Based on their calculations the production cost of butanol can be
reduced by ca. 20% (year 1987). They also said that the productivity increased from 0.58
g/(L*hr) in batch culture to 1.5 g/(L*hr) in fed-batch culture. When the productivity is
increased the numbers of fermenters are reduced. They also conclude that concentrated feed-
stocks can be fermented and stillage treatment costs are significantly reduced.
15
Figure 12: Process flow diagram of a fed-batch fermentation employing oleyl alcohol/decane as Extractant.
[25]
16
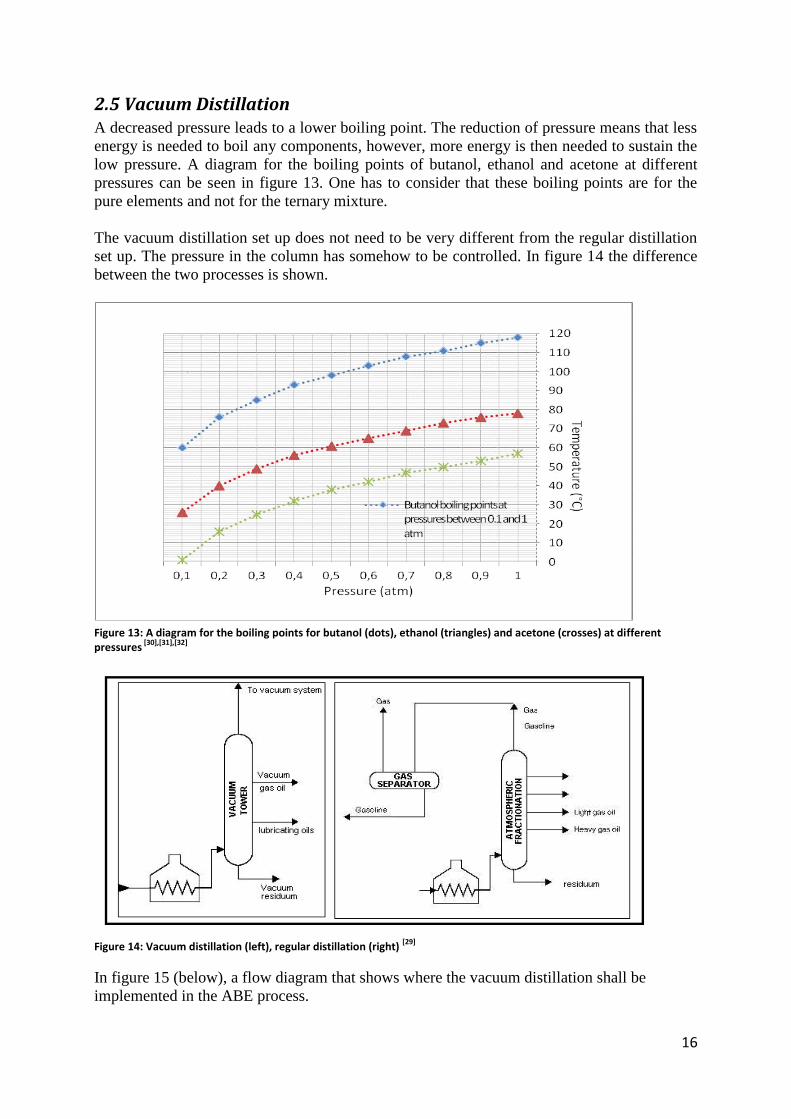
2.5 Vacuum Distillation
A decreased pressure leads to a lower boiling point. The reduction of pressure means that less
energy is needed to boil any components, however, more energy is then needed to sustain the
low pressure. A diagram for the boiling points of butanol, ethanol and acetone at different
pressures can be seen in figure 13. One has to consider that these boiling points are for the
pure elements and not for the ternary mixture.
The vacuum distillation set up does not need to be very different from the regular distillation
set up. The pressure in the column has somehow to be controlled. In figure 14 the difference
between the two processes is shown.
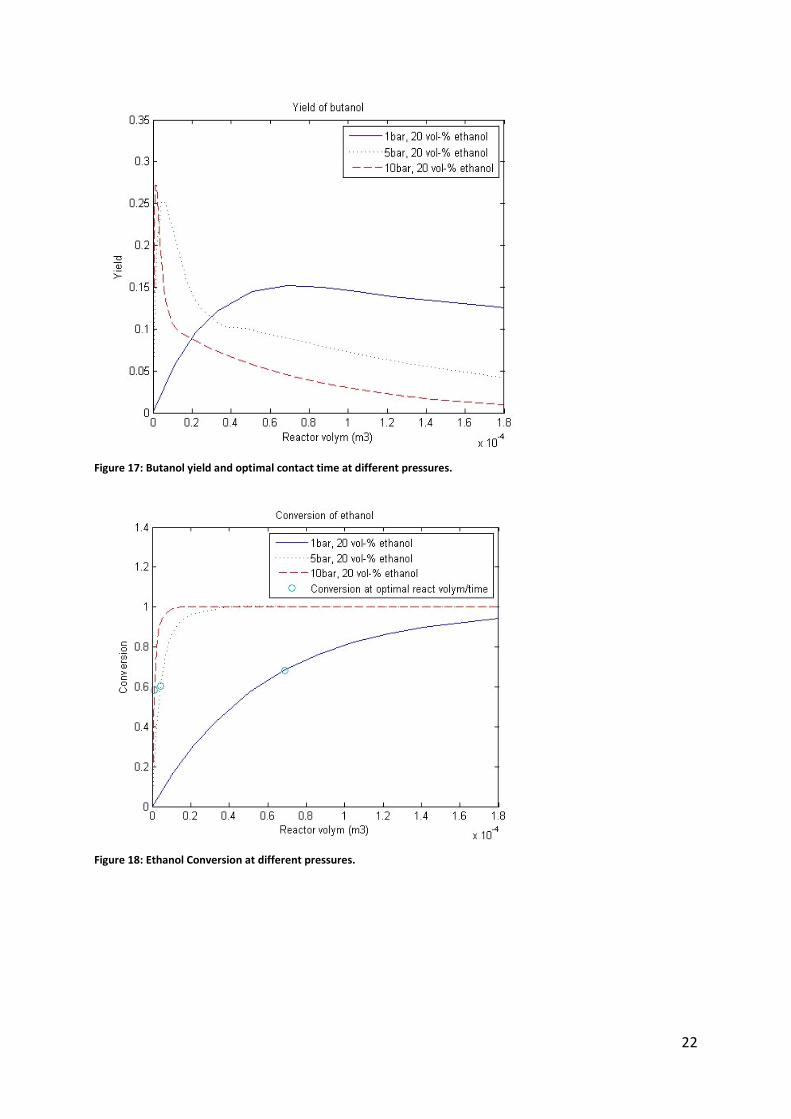
Figure 13: A diagram for the boiling points for butanol (dots), ethanol (triangles) and acetone (crosses) at different pressures
Further improvements need to be done in minimizing the losses of ethanol and butanol, as for
now there is a loss of 88kg/h butanol (46kg/h in the water-phase stream and 42kg/h in the
bottom stream of the second distillation column) and 133kg/h ethanol, e.g. recycle the water-
phase stream to distillation column number 2. Some improvements can be made in the energy
demand and recovery, e.g. with the help of pinch analysis. Further studies on the reaction
kinetics need to be carried out in order to determine if there are any restrictions in mass
transport or diffusion in relation to the reaction kinetics.
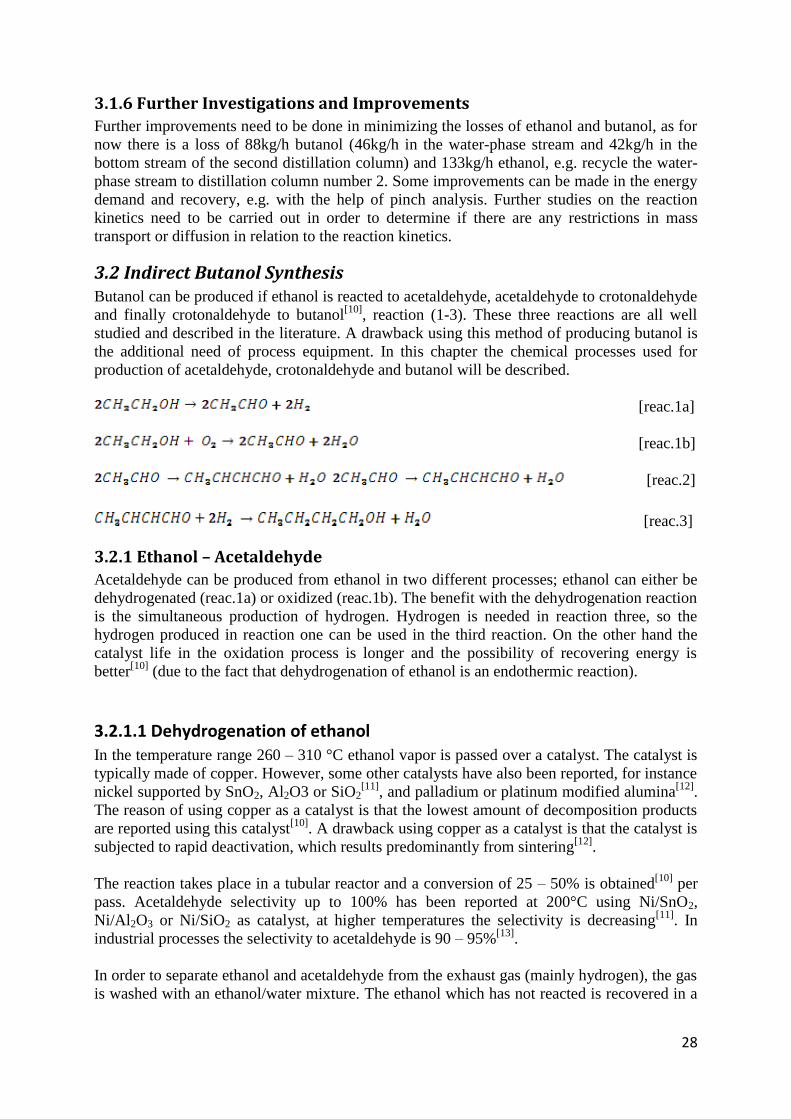
3.2 Indirect Butanol Synthesis Butanol can be produced if ethanol is reacted to acetaldehyde, acetaldehyde to crotonaldehyde
and finally crotonaldehyde to butanol[10]
, reaction (1-3). These three reactions are all well
studied and described in the literature. A drawback using this method of producing butanol is
the additional need of process equipment. In this chapter the chemical processes used for
production of acetaldehyde, crotonaldehyde and butanol will be described.
[reac.1a]
[reac.1b]
[reac.2]
[reac.3]
3.2.1 Ethanol – Acetaldehyde
Acetaldehyde can be produced from ethanol in two different processes; ethanol can either be
dehydrogenated (reac.1a) or oxidized (reac.1b). The benefit with the dehydrogenation reaction
is the simultaneous production of hydrogen. Hydrogen is needed in reaction three, so the
hydrogen produced in reaction one can be used in the third reaction. On the other hand the
catalyst life in the oxidation process is longer and the possibility of recovering energy is
better[10]
(due to the fact that dehydrogenation of ethanol is an endothermic reaction).
3.2.1.1 Dehydrogenation of ethanol In the temperature range 260 – 310 °C ethanol vapor is passed over a catalyst. The catalyst is
typically made of copper. However, some other catalysts have also been reported, for instance
nickel supported by SnO2, Al2O3 or SiO2[11]
, and palladium or platinum modified alumina[12]
.
The reason of using copper as a catalyst is that the lowest amount of decomposition products
are reported using this catalyst[10]
. A drawback using copper as a catalyst is that the catalyst is
subjected to rapid deactivation, which results predominantly from sintering[12]
.
The reaction takes place in a tubular reactor and a conversion of 25 – 50% is obtained[10]
per
pass. Acetaldehyde selectivity up to 100% has been reported at 200°C using Ni/SnO2,
Ni/Al2O3 or Ni/SiO2 as catalyst, at higher temperatures the selectivity is decreasing[11]
. In
industrial processes the selectivity to acetaldehyde is 90 – 95%[13]
.
In order to separate ethanol and acetaldehyde from the exhaust gas (mainly hydrogen), the gas
is washed with an ethanol/water mixture. The ethanol which has not reacted is recovered in a
29
distillation step and recirculated. The final acetaldehyde yield in industrial processes is ca. 90
%[10]
. A simplified flow sheet describing this process can be seen in figure 22.
Byproducts in the dehydrogenation process are butyracetate, crotonaldehyde, higher alcohols
and ethylene[13]
.
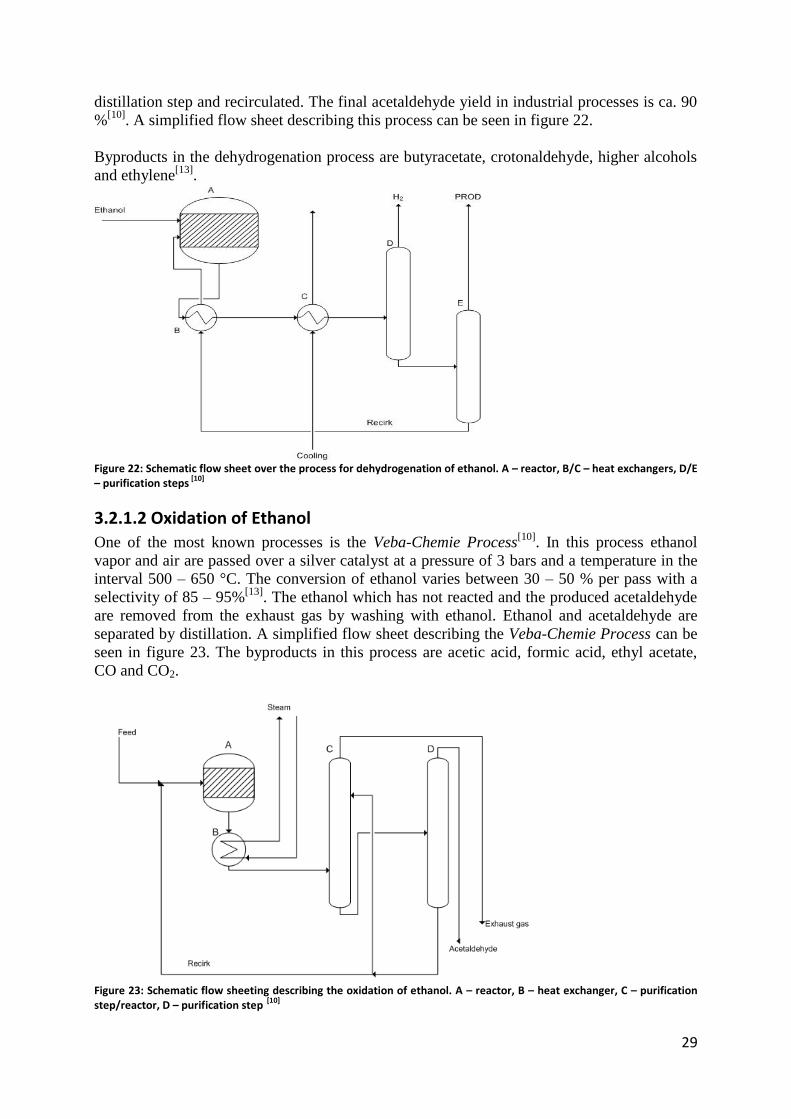
Figure 22: Schematic flow sheet over the process for dehydrogenation of ethanol. A – reactor, B/C – heat exchangers, D/E – purification steps
[10]
3.2.1.2 Oxidation of Ethanol
One of the most known processes is the Veba-Chemie Process[10]
. In this process ethanol
vapor and air are passed over a silver catalyst at a pressure of 3 bars and a temperature in the
interval 500 – 650 °C. The conversion of ethanol varies between 30 – 50 % per pass with a
selectivity of 85 – 95%[13]
. The ethanol which has not reacted and the produced acetaldehyde
are removed from the exhaust gas by washing with ethanol. Ethanol and acetaldehyde are
separated by distillation. A simplified flow sheet describing the Veba-Chemie Process can be
seen in figure 23. The byproducts in this process are acetic acid, formic acid, ethyl acetate,
CO and CO2.
Figure 23: Schematic flow sheeting describing the oxidation of ethanol. A – reactor, B – heat exchanger, C – purification step/reactor, D – purification step
[10]
30
3.2.2 Acetaldehyde – Crotonaldehyde The common method to produce crotonaldehyde is the aldol reaction of acetaldehyde
followed by dehydration of the acetaldol (reaction 4).
[reac.4]
In order to produce acetaldol, acetaldehyde is reacted in a tubular reactor at a temperature
ranging from 20 up to 25°C. The residence time is several hours[13]
. To catalyze the reaction
an aqueous sodium hydroxide solution is used[14]
(sodium hydroxide will at any time be found
as an ion in water). The conversion of acetaldehyde is restricted to 50 – 60% to limit resin
formation and secondary side reactions. The reaction is stopped and the reaction-mixture
neutralized by adding acetic acid[13]
. The selectivity to acetaldol is 85% and the main
byproduct is crotonaldehyde. The dehydration of acetaldol occurs readily in the presence of
acetic acid. In industrial processes the dehydration step is implemented in the purification
steps.
The reactor vessel (where the aldol condensation takes place) is followed by a stripping
column. The acetaldehyde which has not reacted is recirculated back to the reactor. The
acetaldol is fed to a distillation column, dehydrated and a crotonaldehyde/water mixture is
distilled to the azeotrope and separated into water and an aqueous crotonaldehyde phase
containing 10% water. Finally, the crotonaldehyde/water mixture is fed into a rectification
column. A simplified flow sheet describing the process can be seen in figure 24.
Figure 24: The acetaldehyde to crotonaldehyde process
[14]
3.2.3 Crotonaldehyde – Butanol
This reaction can be carried out in both liquid- and vapor-phase processes[15],[16]
. If the
reaction is to be carried out as liquid reaction, a solvent must be used. The solvent has to be
separated from the product later on, this is not needed if the reaction instead is a gas phase
reaction. Using a Cu/Al2O2 catalyst, crotonaldehyde conversion up to 100% and butanol
selectivity up to 100% can be achieved[16]
. The temperature should be at least 150 °C. If this
catalyst is exposed to sulfur it will be poisoned and has to be replaced.
31
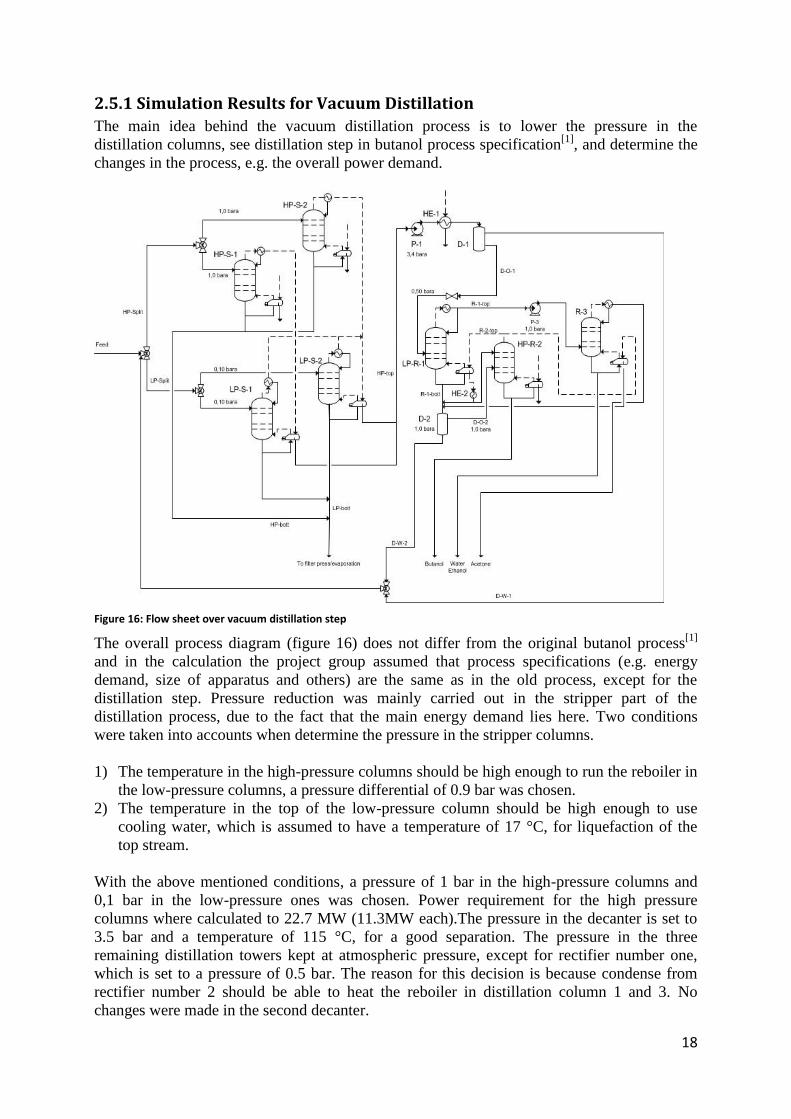
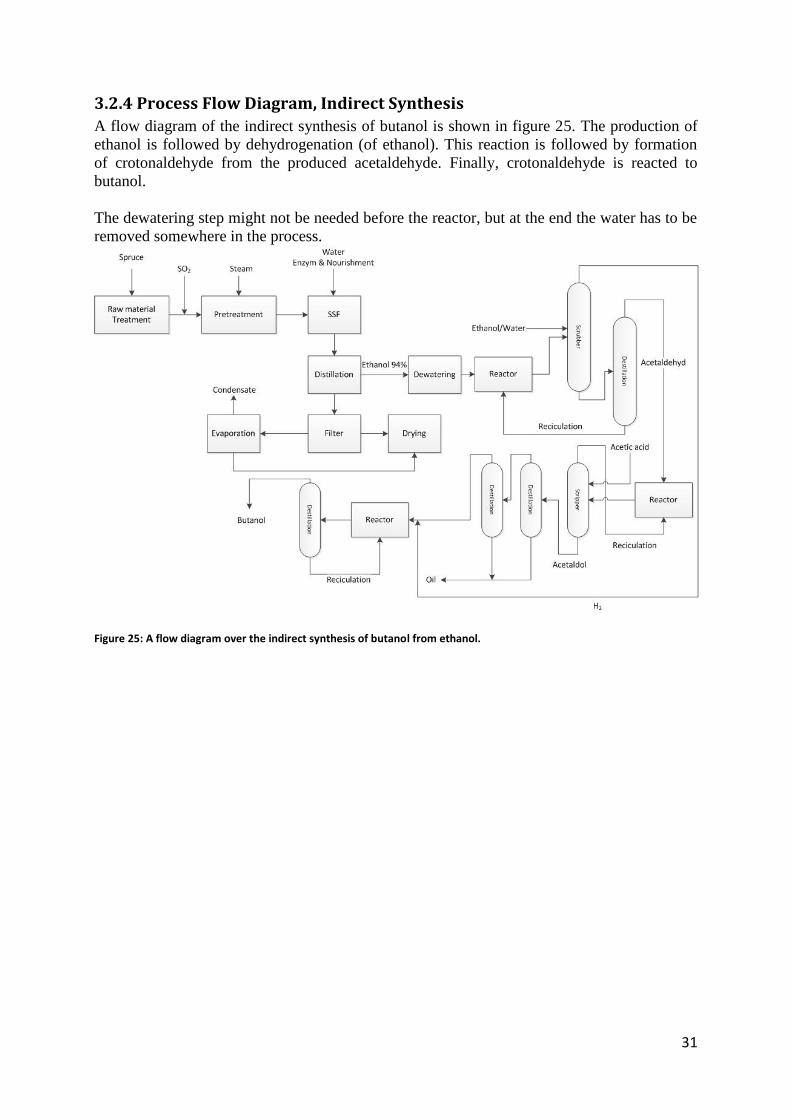
3.2.4 Process Flow Diagram, Indirect Synthesis
A flow diagram of the indirect synthesis of butanol is shown in figure 25. The production of
ethanol is followed by dehydrogenation (of ethanol). This reaction is followed by formation
of crotonaldehyde from the produced acetaldehyde. Finally, crotonaldehyde is reacted to
butanol.
The dewatering step might not be needed before the reactor, but at the end the water has to be
removed somewhere in the process.
Figure 25: A flow diagram over the indirect synthesis of butanol from ethanol.
32
4 Financial Analysis To compare the alternatives with each other, some calculations have been done on the
investment expenditure and the operating costs. As a basis for the profitability analysis a
lifespan of 10 years has been assumed together with an interest rate of 15 %. In the
calculations five alternatives have been compared, these are:
The butanol production from the 2008 report
The same butanol production as in the report from 2008 but with altered separation
method by using vacuum distillation
Oleyl alcohol/decane perstraction
Mesitylene perstraction.
Producing butanol from ethanol through a HAP-catalyzed condensation reaction.
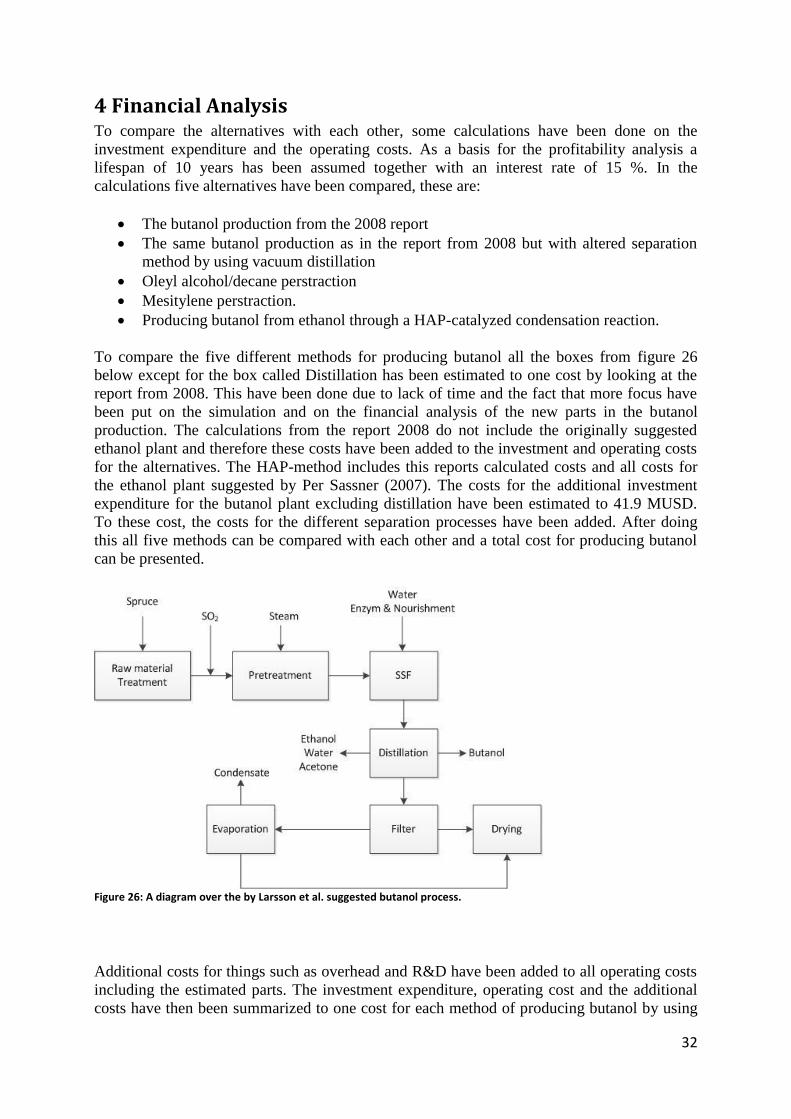
To compare the five different methods for producing butanol all the boxes from figure 26
below except for the box called Distillation has been estimated to one cost by looking at the
report from 2008. This have been done due to lack of time and the fact that more focus have
been put on the simulation and on the financial analysis of the new parts in the butanol
production. The calculations from the report 2008 do not include the originally suggested
ethanol plant and therefore these costs have been added to the investment and operating costs
for the alternatives. The HAP-method includes this reports calculated costs and all costs for
the ethanol plant suggested by Per Sassner (2007). The costs for the additional investment
expenditure for the butanol plant excluding distillation have been estimated to 41.9 MUSD.
To these cost, the costs for the different separation processes have been added. After doing
this all five methods can be compared with each other and a total cost for producing butanol
can be presented.
Figure 26: A diagram over the by Larsson et al. suggested butanol process.
Additional costs for things such as overhead and R&D have been added to all operating costs
including the estimated parts. The investment expenditure, operating cost and the additional
costs have then been summarized to one cost for each method of producing butanol by using
33
the net present value method. Also the pay-off time has been calculated for the different
methods. To investigate the accuracy and reliability of the calculations a sensitivity analysis
has been performed regarding the most important parameters in the calculations. All results
for the five alternatives are compared in the chapter called Financial Comparison of the
Alternatives.
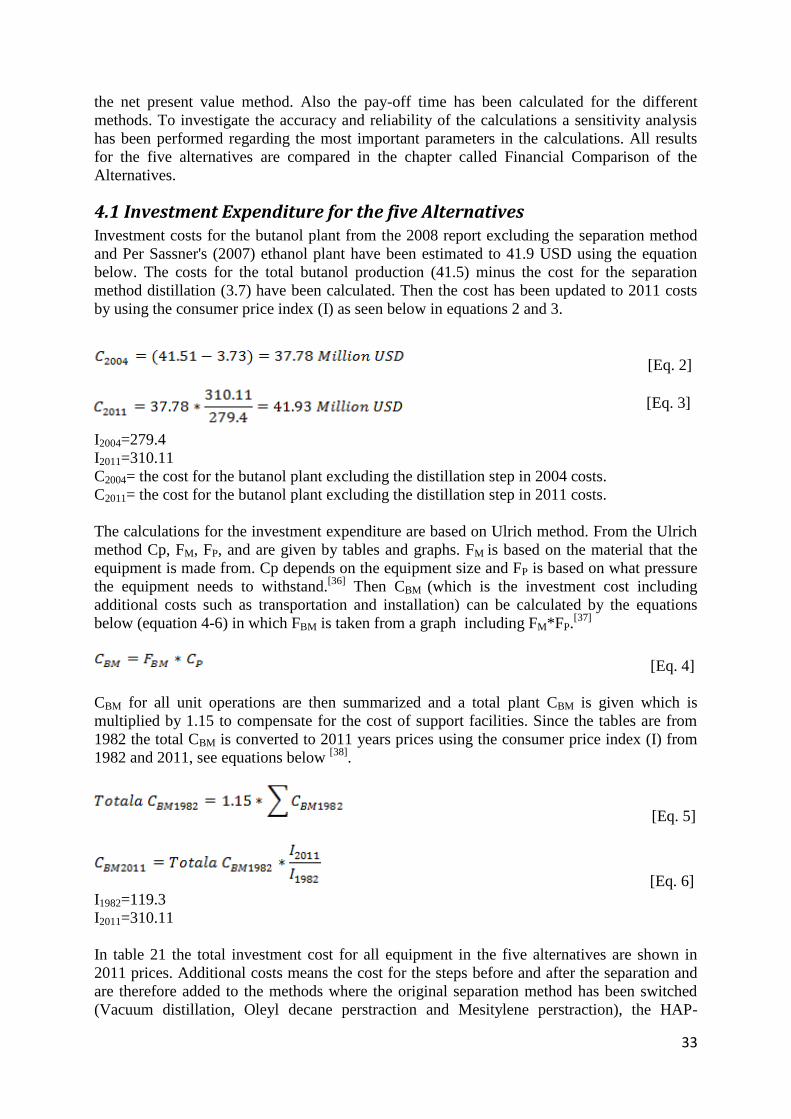
4.1 Investment Expenditure for the five Alternatives Investment costs for the butanol plant from the 2008 report excluding the separation method
and Per Sassner's (2007) ethanol plant have been estimated to 41.9 USD using the equation
below. The costs for the total butanol production (41.5) minus the cost for the separation
method distillation (3.7) have been calculated. Then the cost has been updated to 2011 costs
by using the consumer price index (I) as seen below in equations 2 and 3.
[Eq. 2]
[Eq. 3]
I2004=279.4
I2011=310.11
C2004= the cost for the butanol plant excluding the distillation step in 2004 costs.
C2011= the cost for the butanol plant excluding the distillation step in 2011 costs.
The calculations for the investment expenditure are based on Ulrich method. From the Ulrich
method Cp, FM, FP, and are given by tables and graphs. FM is based on the material that the
equipment is made from. Cp depends on the equipment size and FP is based on what pressure
the equipment needs to withstand.[36]
Then CBM (which is the investment cost including
additional costs such as transportation and installation) can be calculated by the equations
below (equation 4-6) in which FBM is taken from a graph including FM*FP.[37]
[Eq. 4]
CBM for all unit operations are then summarized and a total plant CBM is given which is
multiplied by 1.15 to compensate for the cost of support facilities. Since the tables are from
1982 the total CBM is converted to 2011 years prices using the consumer price index (I) from
1982 and 2011, see equations below [38]
.
[Eq. 5]
[Eq. 6]
I1982=119.3
I2011=310.11
In table 21 the total investment cost for all equipment in the five alternatives are shown in
2011 prices. Additional costs means the cost for the steps before and after the separation and
are therefore added to the methods where the original separation method has been switched
(Vacuum distillation, Oleyl decane perstraction and Mesitylene perstraction), the HAP-
34
catalysis process and the process from the report 2008 do already include these additional
costs. The total costs are the CBM2011 plus the additional costs. For a more detailed table for
four alternatives, except for the case presented in the report from 2008, see Appendix E. The
investment cost for each separation step is added to the butanol production suggested by the
report from 2008. Furthermore the cost for the suggested ethanol plant is added to each
alternative since this is not included in the costs for the butanol production plant from the
2008 report (some includes the cost for distillation and some do not depending on if
separation is included in the original costs).
The cost for the original ethanol plant can be calculated from Per Sassner’s thesis. Sassner
mentions that a plant using 200 000 tons of raw material per year will cost 1 264 MSEK, the
cost can be scaled by Sassner’s scaling coefficient (n) using equations 7 and 8.[39]
[Eq. 7]
[Eq. 8]
The new cost must be converted to dollar and brought up to date which results in a cost for the
previously mentioned ethanol plant of 209.3 million USD. If the distillation equipment (9%)
is subtracted from these costs the resulting expenditure will be 190.19 million US dollar.
Table 21: Shows the result from the Investment Expenditure for the four alternatives including the case from the 2008 report. All costs are in million US dollar.
Alternative
CBM2011
(MMUSD)
Additional Costs
for butanol plant
(MMUSD)
Additional cost for
ethanol plant
(MMUSD)
Total
investment
cost
(MMUSD)
Vacuum Distillation 16.6 41.9 190.2 248.7
Oleyl/decane
Perstraction 13.7 41.9 190.2 245.8
Mesitylene Perstraction 8.0 41.9 190.2 240.1
HAP Catalysis 18.4 0 209.3 227.7
Report 2008 46.1 0 209.3 255.4
As seen above the alternative with a HAP catalyst is the least expensive alternative according
to the investment expenditure and the Report 2008 is the most expensive one. The cost from
the report 2008 and from the vacuum distillation is almost the same which is reasonable since
in the 2008 report the distillation has been optimized to resemble vacuum distillation.
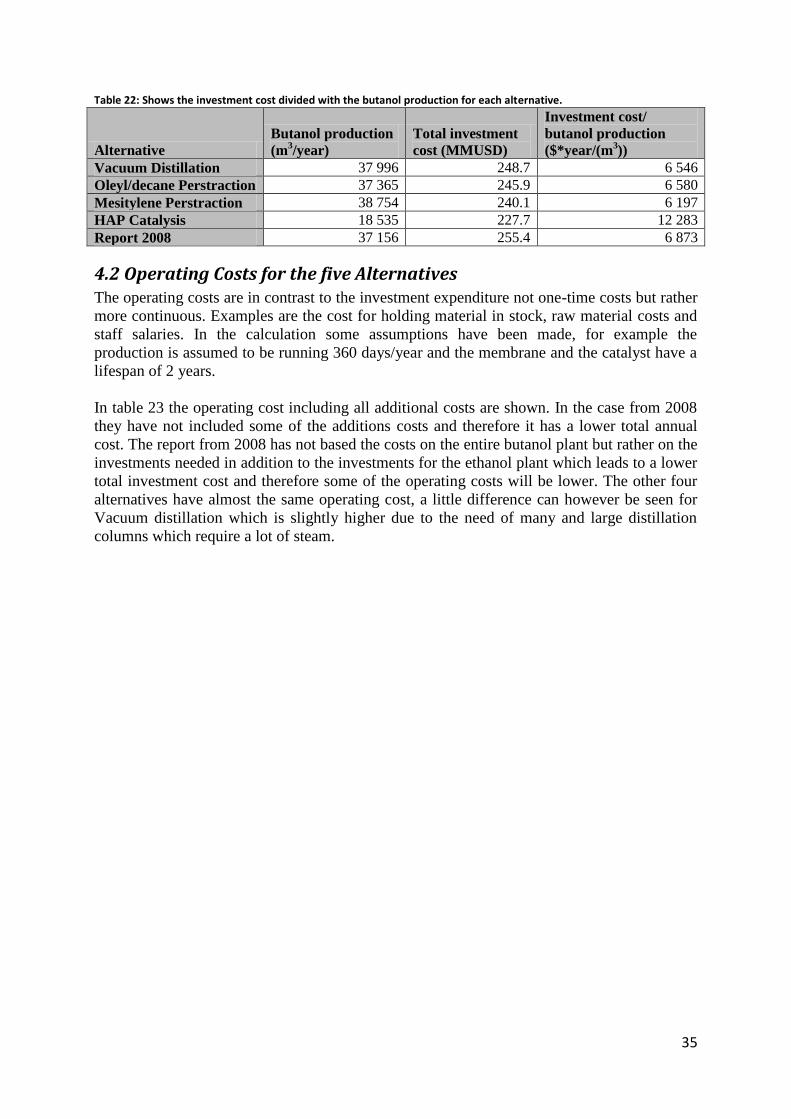
In table 22 a comparison of investment costs divided by the butanol production for all
alternatives are described. The alternative with a HAP catalyst has by far the highest
investment cost/butanol production while the other alternatives are almost the same. This
might seem strange since the investment cost for the HAP alternative was the lowest but the
low productivity of the condensation reaction results in it having the highest investment cost
per unit mass of butanol produced.
35
Table 22: Shows the investment cost divided with the butanol production for each alternative.
Alternative
Butanol production
(m3/year)
Total investment
cost (MMUSD)
Investment cost/
butanol production
($*year/(m3))
Vacuum Distillation 37 996 248.7 6 546
Oleyl/decane Perstraction 37 365 245.9 6 580
Mesitylene Perstraction 38 754 240.1 6 197
HAP Catalysis 18 535 227.7 12 283
Report 2008 37 156 255.4 6 873
4.2 Operating Costs for the five Alternatives The operating costs are in contrast to the investment expenditure not one-time costs but rather
more continuous. Examples are the cost for holding material in stock, raw material costs and
staff salaries. In the calculation some assumptions have been made, for example the
production is assumed to be running 360 days/year and the membrane and the catalyst have a
lifespan of 2 years.
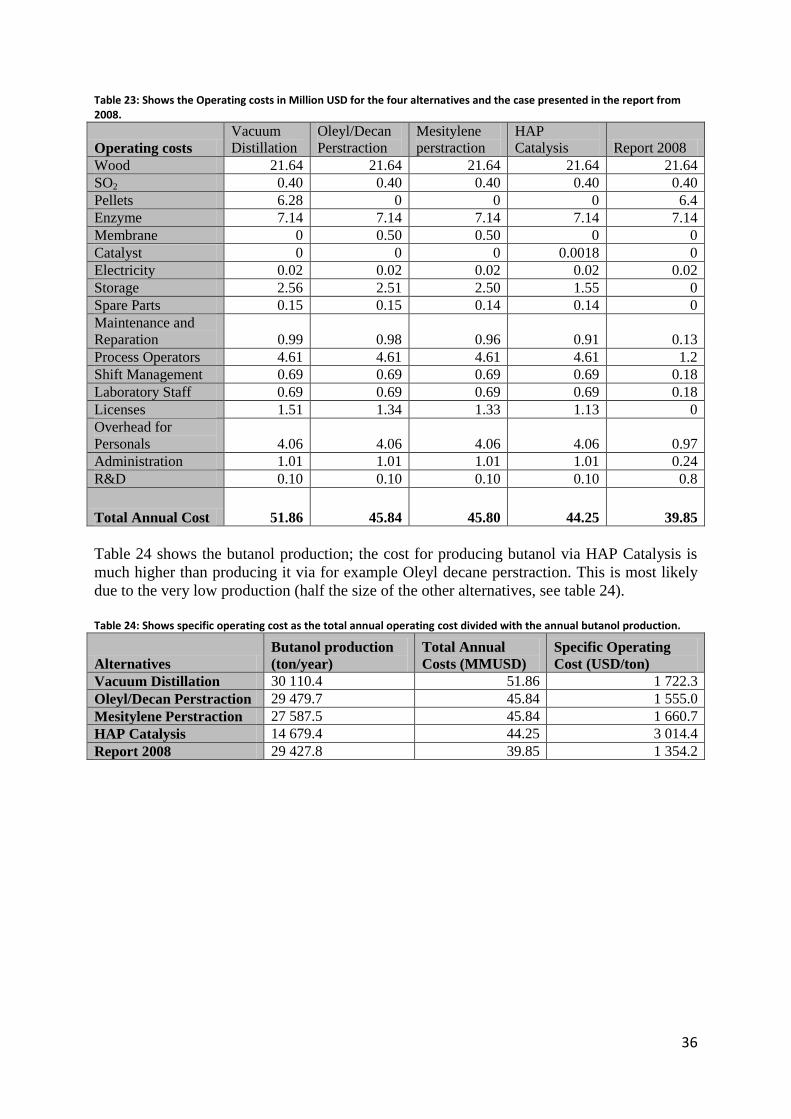
In table 23 the operating cost including all additional costs are shown. In the case from 2008
they have not included some of the additions costs and therefore it has a lower total annual
cost. The report from 2008 has not based the costs on the entire butanol plant but rather on the
investments needed in addition to the investments for the ethanol plant which leads to a lower
total investment cost and therefore some of the operating costs will be lower. The other four
alternatives have almost the same operating cost, a little difference can however be seen for
Vacuum distillation which is slightly higher due to the need of many and large distillation
columns which require a lot of steam.
36
Table 23: Shows the Operating costs in Million USD for the four alternatives and the case presented in the report from 2008.
Operating costs
Vacuum
Distillation
Oleyl/Decan
Perstraction
Mesitylene
perstraction
HAP
Catalysis Report 2008
Wood 21.64 21.64 21.64 21.64 21.64
SO2 0.40 0.40 0.40 0.40 0.40
Pellets 6.28 0 0 0 6.4
Enzyme 7.14 7.14 7.14 7.14 7.14
Membrane 0 0.50 0.50 0 0
Catalyst 0 0 0 0.0018 0
Electricity 0.02 0.02 0.02 0.02 0.02
Storage 2.56 2.51 2.50 1.55 0
Spare Parts 0.15 0.15 0.14 0.14 0
Maintenance and
Reparation 0.99 0.98 0.96 0.91 0.13
Process Operators 4.61 4.61 4.61 4.61 1.2
Shift Management 0.69 0.69 0.69 0.69 0.18
Laboratory Staff 0.69 0.69 0.69 0.69 0.18
Licenses 1.51 1.34 1.33 1.13 0
Overhead for
Personals 4.06 4.06 4.06 4.06 0.97
Administration 1.01 1.01 1.01 1.01 0.24
R&D 0.10 0.10 0.10 0.10 0.8
Total Annual Cost 51.86 45.84 45.80 44.25 39.85
Table 24 shows the butanol production; the cost for producing butanol via HAP Catalysis is
much higher than producing it via for example Oleyl decane perstraction. This is most likely
due to the very low production (half the size of the other alternatives, see table 24).
Table 24: Shows specific operating cost as the total annual operating cost divided with the annual butanol production.
Alternatives
Butanol production
(ton/year)
Total Annual
Costs (MMUSD)
Specific Operating
Cost (USD/ton)
Vacuum Distillation 30 110.4 51.86 1 722.3
Oleyl/Decan Perstraction 29 479.7 45.84 1 555.0
Mesitylene Perstraction 27 587.5 45.84 1 660.7
HAP Catalysis 14 679.4 44.25 3 014.4
Report 2008 29 427.8 39.85 1 354.2
37
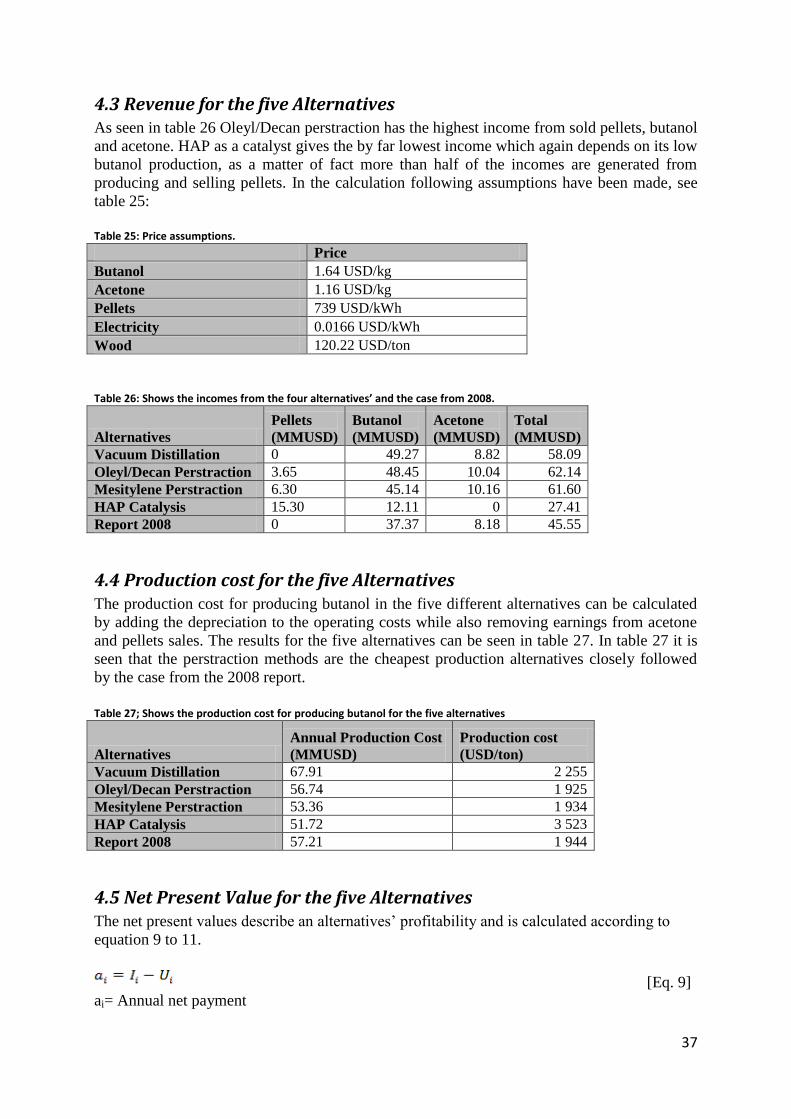
4.3 Revenue for the five Alternatives As seen in table 26 Oleyl/Decan perstraction has the highest income from sold pellets, butanol
and acetone. HAP as a catalyst gives the by far lowest income which again depends on its low
butanol production, as a matter of fact more than half of the incomes are generated from
producing and selling pellets. In the calculation following assumptions have been made, see
table 25:
Table 25: Price assumptions.
Price
Butanol 1.64 USD/kg
Acetone 1.16 USD/kg
Pellets 739 USD/kWh
Electricity 0.0166 USD/kWh
Wood 120.22 USD/ton
Table 26: Shows the incomes from the four alternatives’ and the case from 2008.
Alternatives
Pellets
(MMUSD)
Butanol
(MMUSD)
Acetone
(MMUSD)
Total
(MMUSD)
Vacuum Distillation 0 49.27 8.82 58.09
Oleyl/Decan Perstraction 3.65 48.45 10.04 62.14
Mesitylene Perstraction 6.30 45.14 10.16 61.60
HAP Catalysis 15.30 12.11 0 27.41
Report 2008 0 37.37 8.18 45.55
4.4 Production cost for the five Alternatives The production cost for producing butanol in the five different alternatives can be calculated
by adding the depreciation to the operating costs while also removing earnings from acetone
and pellets sales. The results for the five alternatives can be seen in table 27. In table 27 it is
seen that the perstraction methods are the cheapest production alternatives closely followed
by the case from the 2008 report.
Table 27; Shows the production cost for producing butanol for the five alternatives
Alternatives
Annual Production Cost
(MMUSD)
Production cost
(USD/ton)
Vacuum Distillation 67.91 2 255
Oleyl/Decan Perstraction 56.74 1 925
Mesitylene Perstraction 53.36 1 934
HAP Catalysis 51.72 3 523
Report 2008 57.21 1 944
4.5 Net Present Value for the five Alternatives The net present values describe an alternatives’ profitability and is calculated according to
equation 9 to 11.
[Eq. 9]
ai= Annual net payment
38
Ii= Annual income
Ui= Annual operating cost
[Eq. 10]
X= Interest rate, 15% in this report
N= Lifespan, 10 in this report
[Eq. 11]
Sn= Return N years forward
G= Investment expenditure
The results of these calculations are shown in table 28 below where the lifespan is assumed to
be ten years and the interest rate used is 15 %. The reason that all values are negative is that in
these calculations investment costs for the ethanol plant has been included which is not the
case in the report from 2008.
Table 28: Shows the calculations on the net present value.
4.6 Pay-Off Time for the five Alternatives An investments pay-off time describes how long time it takes for the future annual payments
to pay off the original investment cost if the interest rate is disregarded. The pay-off time will
be calculated according to equation 12.
[Eq. 12]
n = Pay-off time
G = Investment expenditure
ai = Annual net payment
The pay-off times for four of the alternatives are shown in table 29, the method with a HAP
catalyst is not relevant since its annual net payment is negative (table 28) As seen in table 29
Oleyl/Decan and Mesitylene perstraction both have a pay-off time around 15 year which is
quite good given the largely negative net present values (table 28).
39
-350
-300
-250
-200
-150
-100
-50
0
1.43 1.64 1.85
Ne
t p
rese
nt
valu
e (
MM
USD
)
Butanol price (USD/kg)
Sensitivity Analysis of change in Butanol Price
Vacuum distillation
Oleyl decan perstraction
Mesi extraction
HAP catalysis
Table 29: Shows the time it takes to pay-off the investment costs.
Alternative Pay-Off time (years)
Vacuum Distillation 39.93
Oleyl Decan Perstraction 15.08
Mesitylene perstraction 15.20
HAP Catalysis N/A
Report 2008 40.09
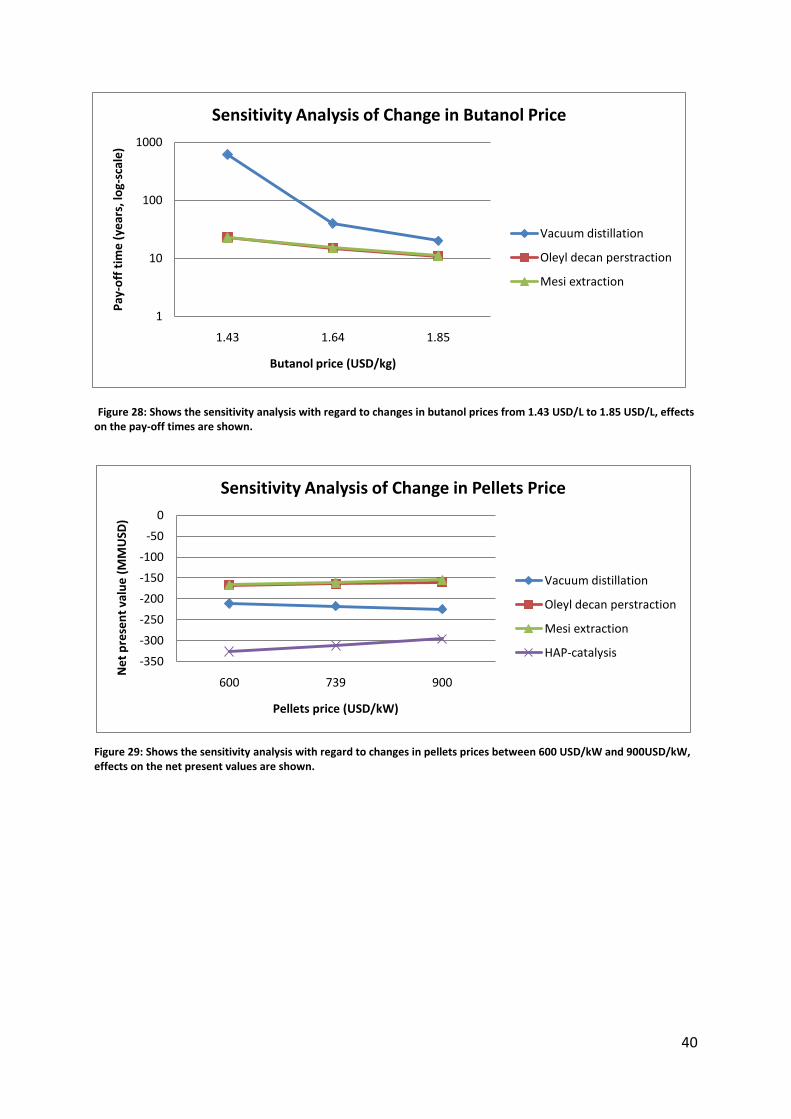
4.7 Sensitivity Analysis for the Five Alternatives Three variables will be analyzed in order to see how sensitive the calculations are to changes
in the assumptions. These variables are the price of butanol and pellets and the plant lifespan.
The effects of these variables on the net present value and the pay-off time have been studied
and can be seen in figures 27-31, for more detailed values see Appendix F. The effects of
lifespan changes on pay-off time are non-existing which is why the results are not included in
this report.
The results from the sensitivity analysis clearly shows that the studied parameters have some
effect on the net present value and pay-off times for the alternatives although none of the
changes (which were quite large) made caused any specific altercations of the final results
other than the alternative became more or less profitable than they already were without
making any of them profitable or even close to profitable.
Figure 27: Shows the sensitivity analyses with regard to changes in butanol price from 1.43 USD/L to 1.85 USD/L, effects on the net present values are shown.
40
1
10
100
1000
1.43 1.64 1.85
Pay
-off
tim
e (
year
s, lo
g-sc
ale
)
Butanol price (USD/kg)
Sensitivity Analysis of Change in Butanol Price
Vacuum distillation
Oleyl decan perstraction
Mesi extraction
-350
-300
-250
-200
-150
-100
-50
0
600 739 900
Ne
t p
rese
nt
valu
e (
MM
USD
)
Pellets price (USD/kW)
Sensitivity Analysis of Change in Pellets Price
Vacuum distillation
Oleyl decan perstraction
Mesi extraction
HAP-catalysis
Figure 28: Shows the sensitivity analysis with regard to changes in butanol prices from 1.43 USD/L to 1.85 USD/L, effects on the pay-off times are shown.
Figure 29: Shows the sensitivity analysis with regard to changes in pellets prices between 600 USD/kW and 900USD/kW, effects on the net present values are shown.
41
0
10
20
30
40
50
60
600 739 900
Pay
.off
tim
e (
year
s)
Pellets price (USD/kW)
Sensitivity Analysis of Change in Pellets Price
Vacuum distillation
Oleyl decan perstraction
Mesi extraction
-350
-300
-250
-200
-150
-100
-50
0
10 15 20
Ne
t p
rese
nt
valu
e (
MM
USD
)
Lifespan (years)
Sensitivity Analysis of Change in Lifespan
Vacuum distillation
Oleyl decan perstraction
Mesi extraction
HAP catalysis
Report 2008
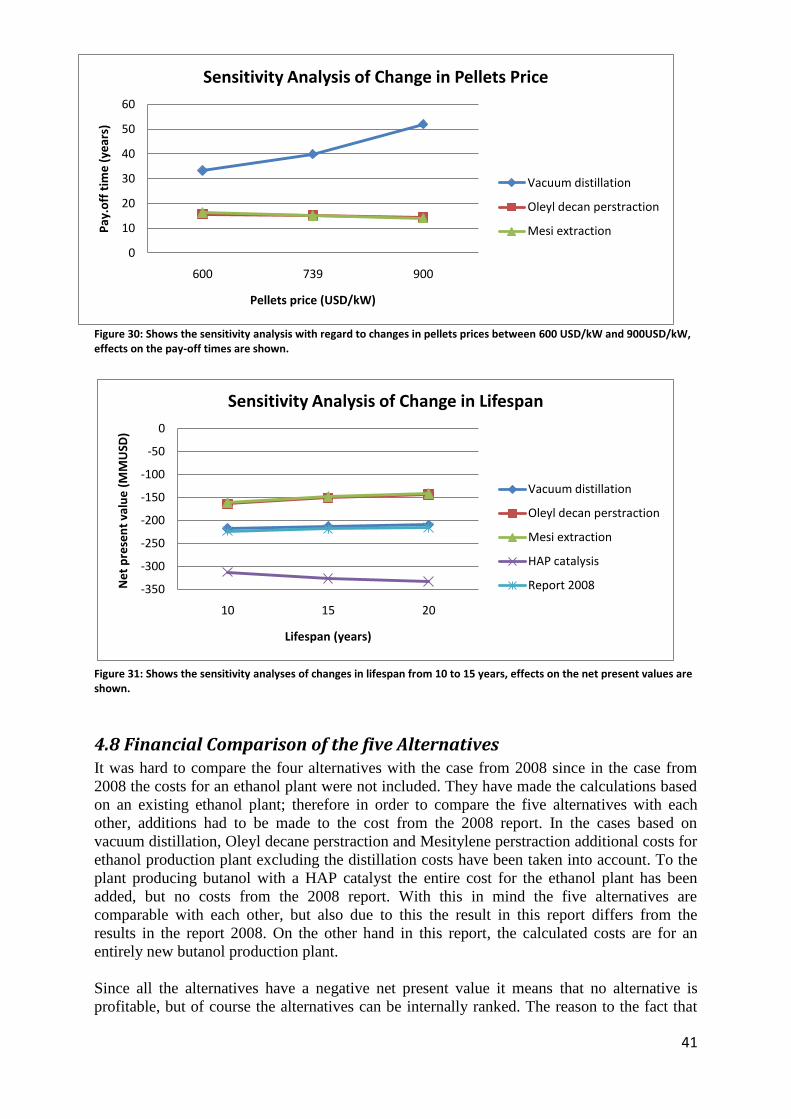
Figure 30: Shows the sensitivity analysis with regard to changes in pellets prices between 600 USD/kW and 900USD/kW, effects on the pay-off times are shown.
Figure 31: Shows the sensitivity analyses of changes in lifespan from 10 to 15 years, effects on the net present values are shown.
4.8 Financial Comparison of the five Alternatives It was hard to compare the four alternatives with the case from 2008 since in the case from
2008 the costs for an ethanol plant were not included. They have made the calculations based
on an existing ethanol plant; therefore in order to compare the five alternatives with each
other, additions had to be made to the cost from the 2008 report. In the cases based on
vacuum distillation, Oleyl decane perstraction and Mesitylene perstraction additional costs for
ethanol production plant excluding the distillation costs have been taken into account. To the
plant producing butanol with a HAP catalyst the entire cost for the ethanol plant has been
added, but no costs from the 2008 report. With this in mind the five alternatives are
comparable with each other, but also due to this the result in this report differs from the
results in the report 2008. On the other hand in this report, the calculated costs are for an
entirely new butanol production plant.
Since all the alternatives have a negative net present value it means that no alternative is
profitable, but of course the alternatives can be internally ranked. The reason to the fact that
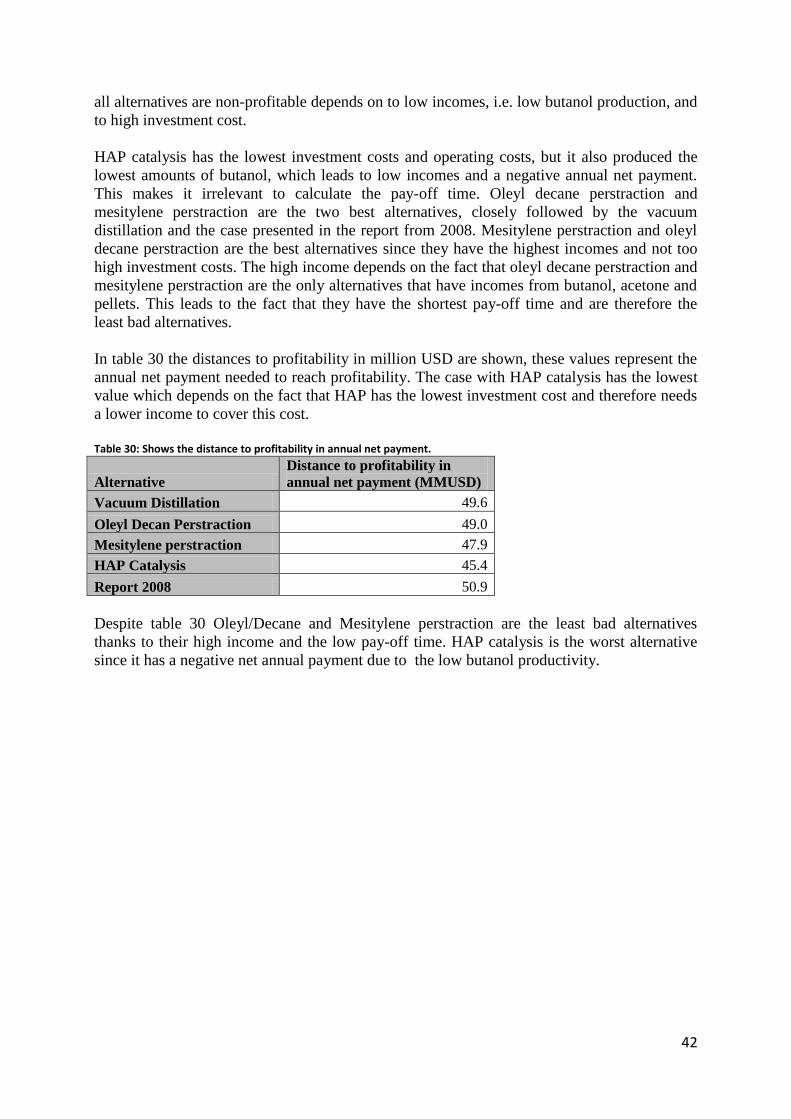
42
all alternatives are non-profitable depends on to low incomes, i.e. low butanol production, and
to high investment cost.
HAP catalysis has the lowest investment costs and operating costs, but it also produced the
lowest amounts of butanol, which leads to low incomes and a negative annual net payment.
This makes it irrelevant to calculate the pay-off time. Oleyl decane perstraction and
mesitylene perstraction are the two best alternatives, closely followed by the vacuum
distillation and the case presented in the report from 2008. Mesitylene perstraction and oleyl
decane perstraction are the best alternatives since they have the highest incomes and not too
high investment costs. The high income depends on the fact that oleyl decane perstraction and
mesitylene perstraction are the only alternatives that have incomes from butanol, acetone and
pellets. This leads to the fact that they have the shortest pay-off time and are therefore the
least bad alternatives.
In table 30 the distances to profitability in million USD are shown, these values represent the
annual net payment needed to reach profitability. The case with HAP catalysis has the lowest
value which depends on the fact that HAP has the lowest investment cost and therefore needs
a lower income to cover this cost.
Table 30: Shows the distance to profitability in annual net payment.
Alternative
Distance to profitability in
annual net payment (MMUSD)
Vacuum Distillation 49.6
Oleyl Decan Perstraction 49.0
Mesitylene perstraction 47.9
HAP Catalysis 45.4
Report 2008 50.9
Despite table 30 Oleyl/Decane and Mesitylene perstraction are the least bad alternatives
thanks to their high income and the low pay-off time. HAP catalysis is the worst alternative
since it has a negative net annual payment due to the low butanol productivity.
43
5 Recommendations Based on the knowledge as of today it cannot be stated that synthesis of butanol from ethanol
is better (with respect to process economy) than fermentation of butanol, the so called ABE
process. The following is recommended:
5.1 Synthesis of Butanol from Ethanol The method of indirect synthesis of butanol from ethanol seemed at first to be a promising
way to go. However, it turned out that too much byproduct was produced during the
condensation reaction, which kept the butanol productivity low. The low butanol production
capability of such a plant therefore kept revenues at a minimum and caused a negative net
income. Therefore direct synthesis via butanol producing bacteria is the recommended way to
use in for future work. The low productivity of indirect synthesis on the other hand leaves
room for future process development which is why it might be interesting to also look into the
processes optimization opportunities, in this study however the alternative does not look
viable.
If further investigation was to be conducted in this field interesting areas of research might
include looking at possible commercial opportunities for the byproducts, if these were to be
further purified, Statoil could sell them as well as the butanol and thus raising the revenue
stream significantly. Another interesting topic is any possibility of enhancing the reactions
selectivity towards butanol since this would increase the butanol productivity in the plant and
in that way increases revenues.
5.2 Separation Processes Out of the investigated separation processes the two perstraction methods are the most
efficient, this is mainly due to their lower energy and steam demand compared to vacuum and
regular distillation while maintaining about the same productivity. The low steam demand
leads to a pellet surplus which thus can be sold to further increase revenues compared to the
two pure distillation processes in which pellets has to be bought. Other than this lower
demand for steam and energy, no larger differences exist between the four alternative
separation processes. Also the two perstraction methods are very much alike even though it
seems at this stage that oleyl/decane perstraction is slightly better than mesitylene
perstraction. Thus these are the two most interesting processes to look into in future research,
other than indirect synthesis.
5.3 Economy From a purely economic aspects none of the alternatives presented in this report are profitable
(negative net present values), they are not even close. Though some of the processes might
still be interesting to look into, one can see that the large extra costs which are coupled to
butanol production compared to ethanol production needs to be lowered and the productivity
of butanol must be greatly increased if this investment is ever going to be profitable. All in all,
the economic analysis points to the perstraction methods as the two most profitable out of the
five studied alternatives, which is why they are most interesting for a future butanol plant. The
two perstraction methods have pay-off times of 15.2 years compared to the process using
HAP as an catalyst which has a pay-off time of 40.1 years.
44
7 References [1] Larsson, E.; Max-Hansen, M.; Pålsson, A.; Studeny, R. A feasibility study on conversion