20
Alternatives for Rural Roads Iowa DOT Project HR 242 Sponsored by the Highway Division of the Iowa Department of Transportation and the Iowa Highway Research Board.
Alternatives for Rural Roads Iowa DOT Project HR 242 Sponsored by the Highway Division of the Iowa Department of Transportation and the Iowa Highway Research Board.
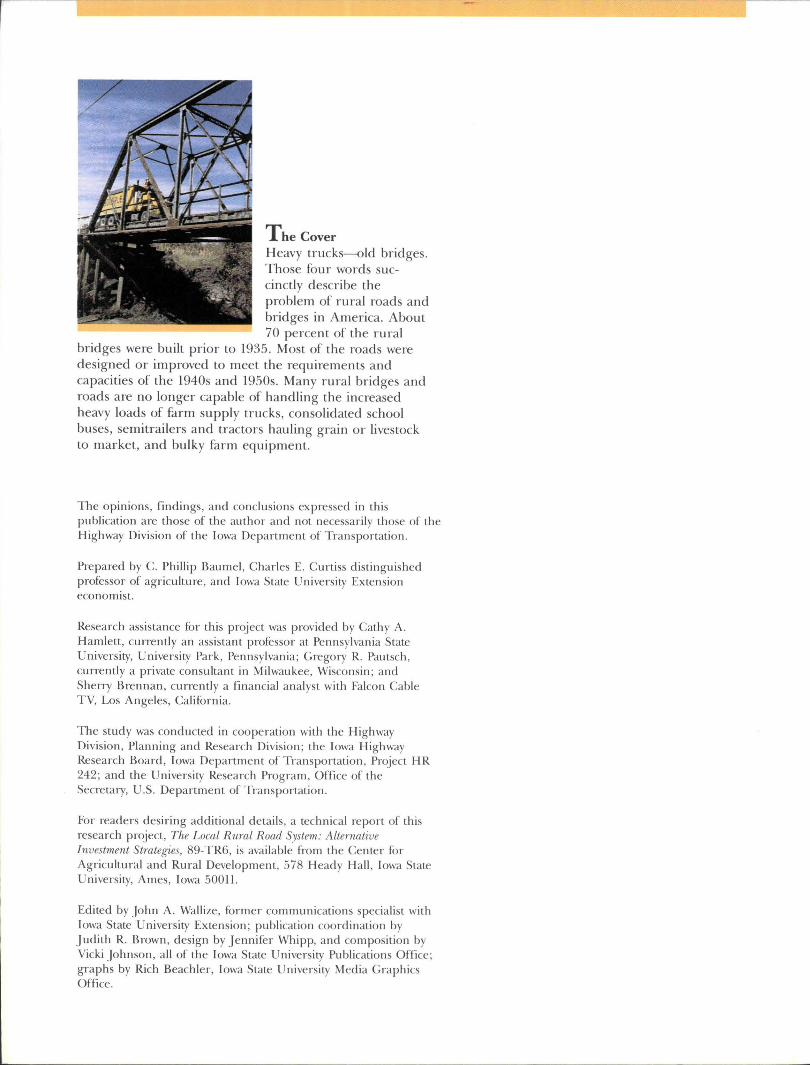
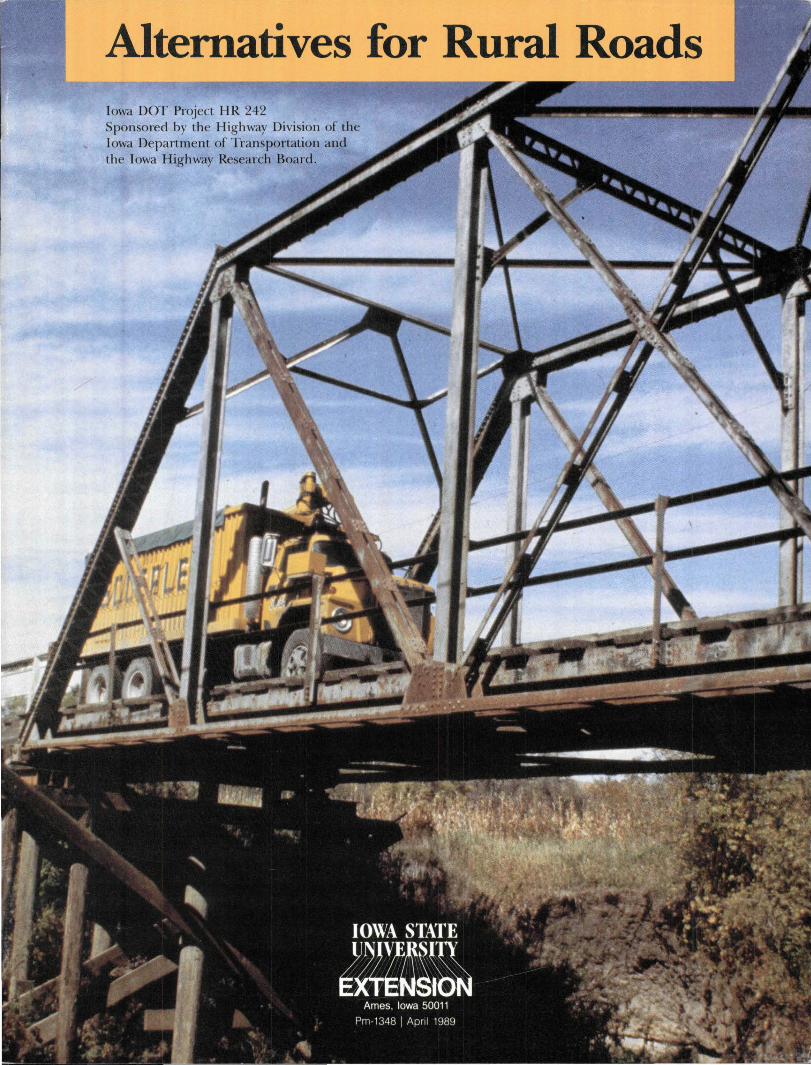
The Cover Heavy trucks-old bridges. Those four words succinctly describe the problem of rural roads and bridges in America. About 70 percent of the rural
bridges were built prior to 1935. Most of the roads were designed or improved to meet the requirements and capacities of the 1940s and 1950s. Many rural bridges and roads are no longer capable of handling the increased heavy loads of farm supply trucks, consolidated school buses, semitrailers and tractors hauling grain or livestock to market, and bulky farm equipment.
The opinions, findings, and conclusions expressed in this publication are those of the author and not necessarily those of the Highway Division of the Iowa Department of Transportation .
Prepared by C. Phillip Baumel, Charles E. Curtiss distinguished professor of agriculture, and Iowa State University Extension economist.
Research assistance for this project was provided by Cathy A. Hamlett, currently an assistant professor at Pennsylvania State University, University Park, Pennsylvania; Gregory R. Pautsch , currently a private consultant in Milwaukee, Wisconsin ; and Sherry Brennan, currently a financial analyst with Falcon Cable TV, Los Angeles, California.
The study was conducted in cooperation with the Highway Division, Planning and Research Division ; the Iowa Highway Research Board, Iowa Department of Transportation, Project HR 242; and the University Research Program, Office of the Secretary, U.S. Department of Transportation.
For readers desiring additional details , a technical report of this research project, The Local Rural Road System: Alternative Investment Strategies, 89-TR6, is available from the Center for Agricultural and Rural Development, 578 Heady Hall , Iowa State University, Ames, Iowa 50011.
Edited by John A. Wallize, former communications specialist with Iowa State University Extension; publication coordination by Judith R. Brown , design by Jennifer Whipp, and composition by Vicki Johnson, all of the Iowa State University Publications Office; graphs by Rich Beachler, Iowa State University Media Graphics Office.
Alternatives for Rural Roads
Executive Summary Much of the nation's rural road system is deteriorating. Many of the roads were built in the 1880s and 1890s with the most recent upgrading done in the 1940s and 1950s. Consequently, many roads and bridges do not have the capacity for the increased loads, speed, and frequent use of today's vehicles.
Because of the growing demands and a dense county road system (inherited from the land settlement policies two centuries ago), revenue available to counties is inadequate to upgrade and maintain the present system. Either revenue must be increased-an unpopular option---or costs must be reduced.
Getting rural America "out of the mud" was a major goal in the 1920s and 1930s. Roads got high priority for funding. But today, needs exceed available funds to upgrade the rural road system. (Photo courtesy of the Chicago and Northwestern Transportation Company.)
Some of the same bridges and basic road design for this farmto-market vehicle are in use today. This vehicle rarely had a gross weight of l ton with cargo. Contemporary vehicles may have a gross weight of 40 tons. (Photo courtesy of the Chicago and Northwestern Transportation Company.)
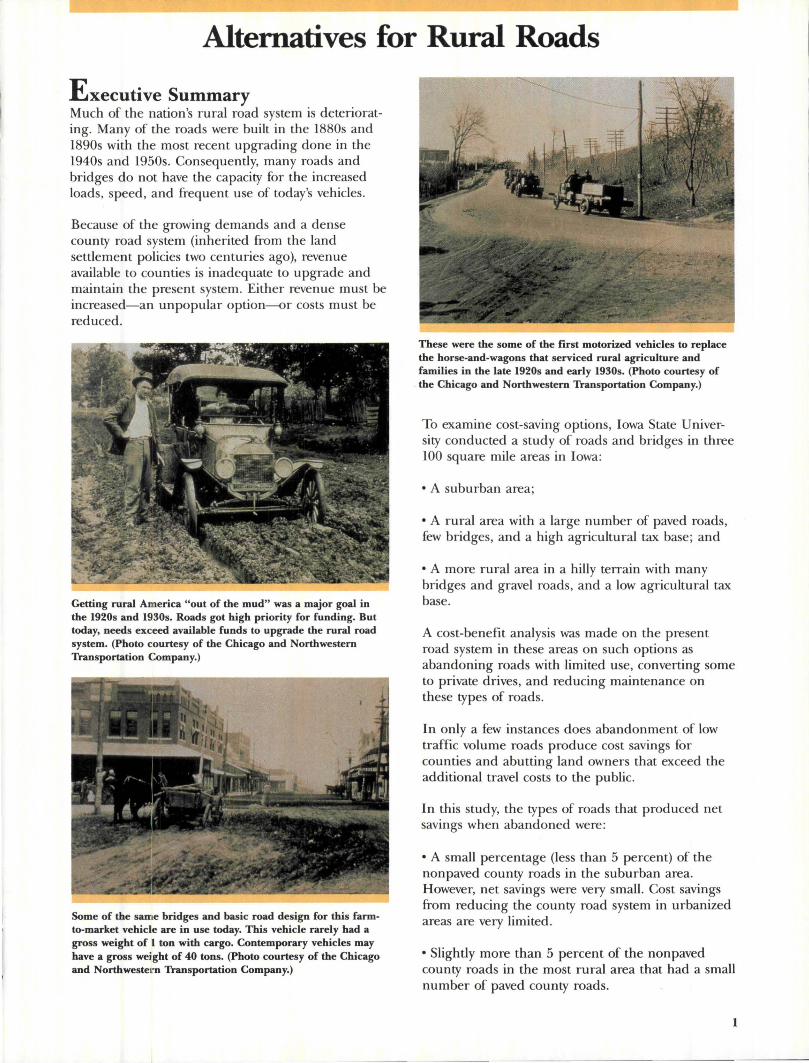
These were the some of the first motorized vehicles to replace the horse-and-wagons that serviced rural agriculture and families in the late 1920s and early 1930s. (Photo courtesy of the Chicago and Northwestern Transportation Company.)
To examine cost-saving options, Iowa State University conducted a study of roads and bridges in three 100 square mile areas in Iowa:
• A suburban area;
• A rural area with a large number of paved roads, few bridges, and a high agricultural tax base; and
•A more rural area in a hilly terrain with many bridges and gravel roads, and a low agricultural tax base.
A cost-benefit analysis was made on the present road system in these areas on such options as abandoning roads with limited use, converting some to private drives, and reducing maintenance on these types of roads.
In only a few instances does abandonment of low traffic volume roads produce cost savings for counties and abutting land owners that exceed the additional travel costs to the public.
In this study, the types of roads that produced net savings when abandoned were:
• A small percentage (less than 5 percent) of the nonpaved county roads in the suburban area. However, net savings were very small. Cost savings from reducing the county road system in urbanized areas are very limited.
• Slightly more than 5 percent of the nonpaved county roads in the most rural area that had a small number of paved county roads.
1
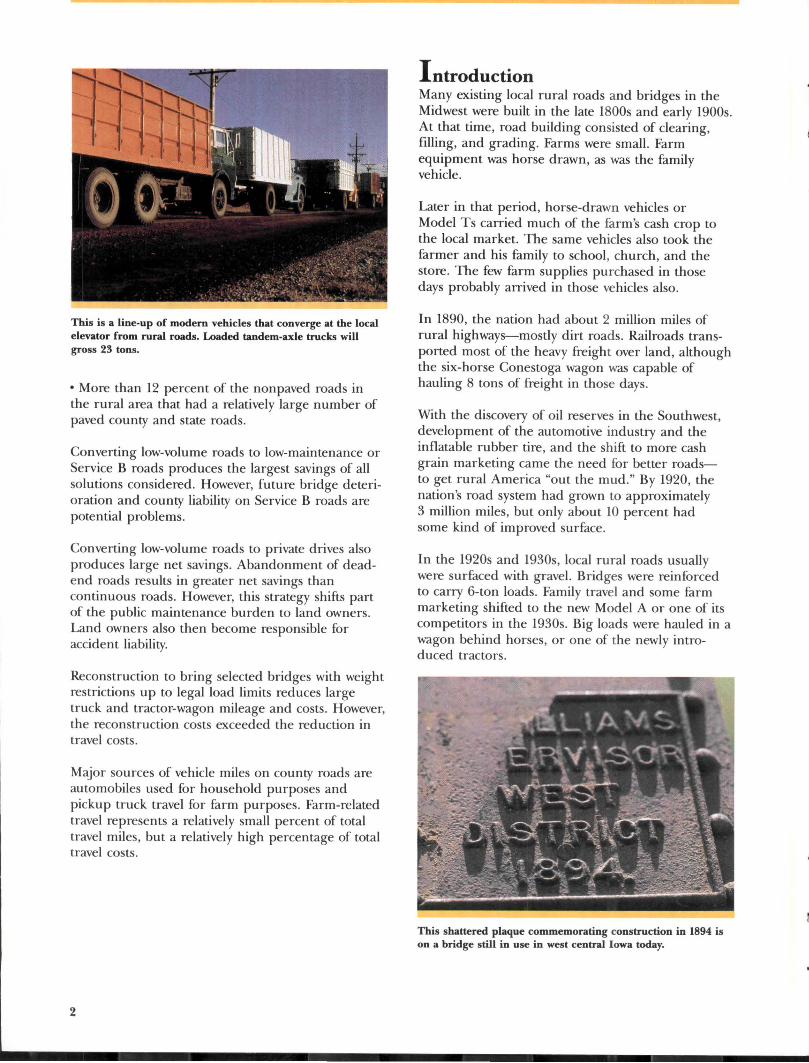
This is a line-up of modern vehicles that converge at the local elevator from rural roads. Loaded tandem-axle trucks will gross 23 tons.
• More than 12 percent of the nonpaved roads in the rural area that had a relatively large number of paved county and state roads.
Converting low-volume roads to low-maintenance or Service B roads produces the largest savings of all solutions considered. However, future bridge deterioration and county liability on Service B roads are potential problems.
Converting low-volume roads to private drives also produces large net savings. Abandonment of deadend roads results in greater net savings than continuous roads. However, this strategy shifts part of the public maintenance burden to land owners. Land owners also then become responsible for accident liability.
Reconstruction to bring selected bridges with weight restrictions up to legal load limits reduces large truck and tractor-wagon mileage and costs. However, the reconstruction costs exceeded the reduction in travel costs.
Major sources of vehicle miles on county roads are automobiles used for household purposes and pickup truck travel for farm purposes. Farm-related travel represents a relatively small percent of total travel miles, but a relatively high percentage of total travel costs.
2
Introduction Many existing local rural roads and bridges in the Midwest were built in the late 1800s and early 1900s. At that time, road building consisted of clearing, filling, and grading. Farms were small. Farm equ.ipment was horse drawn, as was the family vehicle.
Later in that period, horse-drawn vehicles or Model Ts carried much of the farm's cash crop to the local market. The same vehicles also took the farmer and his family to school, church, and the store. The few farm supplies purchased in those days probably arrived in those vehicles also.
In 1890, the nation had about 2 million miles of rural highways-mostly dirt roads. Railroads transported most of the heavy freigh t over land, although the six-horse Conestoga wagon was capable of hauling 8 tons of freight in those days.
With the discovery of oil reserves in the Southwest, development of the automotive industry and the inflatable rubber tire, and the shift to more cash grain marketing came the need for better roadsto get rural America "out the mud." By 1920, the nation's road system had grown to approximately 3 million miles, but only about 10 percent had some kind of improved surface.
In the 1920s and 1930s, local rural roads usually were surfaced with gravel. Bridges were reinforced to carry 6-ton loads. Family travel and some farm marketing shifted to the new Model A or one of its competitors in the 1930s. Big loads were hauled in a wagon behind horses, or one of the newly introduced tractors.
This shattered plaque commemorating construction in 1894 is on a bridge still in use in west central Iowa today.
The Problem Nationally, 70 percent of today's local rural bridges were built before 1935. Those bridges were built for 6- to 7-ton loads. Even those built in the 1940s were designed for 15- to 20-ton loads.
Thus, many local rural roads and bridges are based on traffic use of the 1940s and 1950s. Since then, farm size has grown; the number of vehicles has increased, as has their capacity; and motorized farm equipment has become common-all to the detriment of the road system.
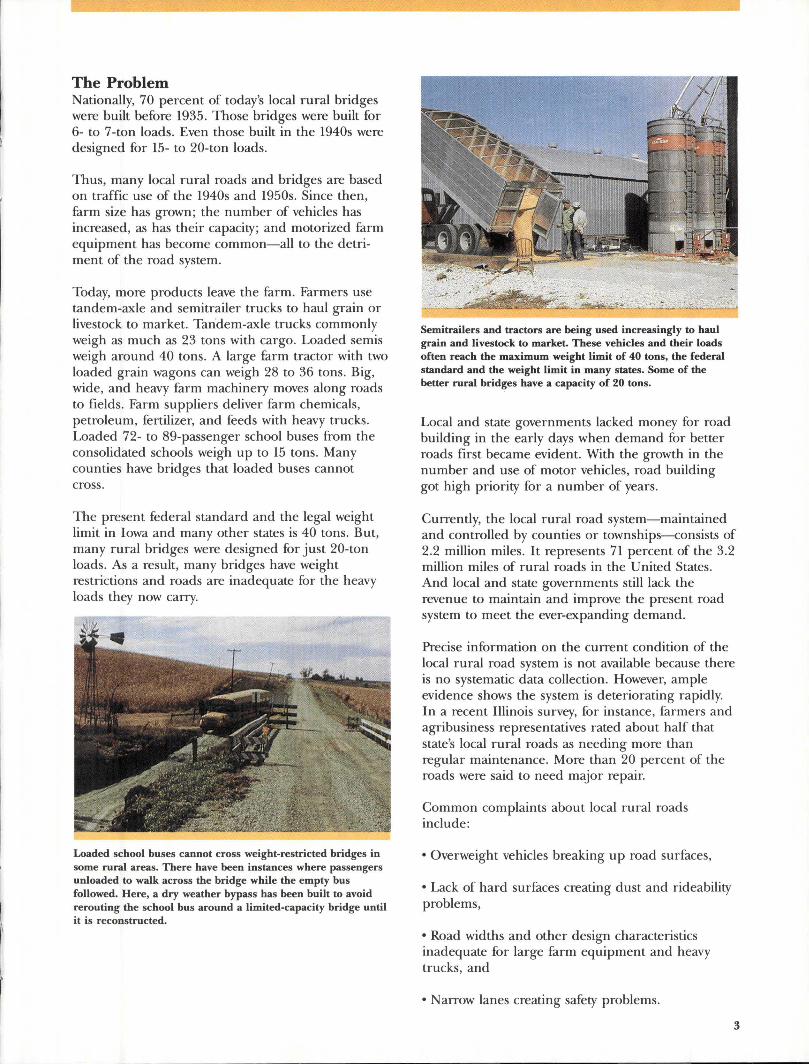
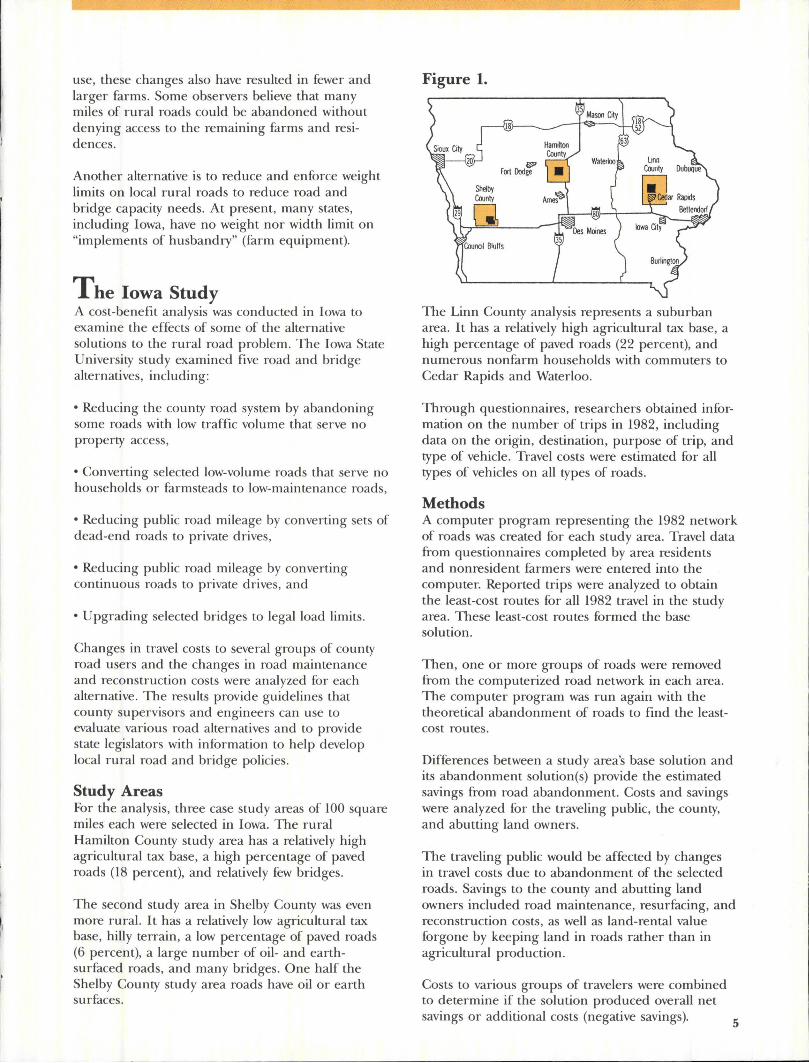
Today, more products leave the farm. Farmers use tandem-axle and semitrailer trucks to haul grain or livestock to market. Tandem-axle trucks commonly weigh as much as 23 tons with cargo. Loaded semis weigh around 40 tons. A large farm tractor with two loaded grain wagons can weigh 28 to 36 tons. Big, wide, and heavy farm machinery moves along roads to fields . Farm suppliers deliver farm chemicals, petroleum, fertilizer, and feeds with heavy trucks. Loaded 72- to 89-passenger school buses from the consolidated schools weigh up to 15 tons. Many counties have bridges that loaded buses cannot cross.
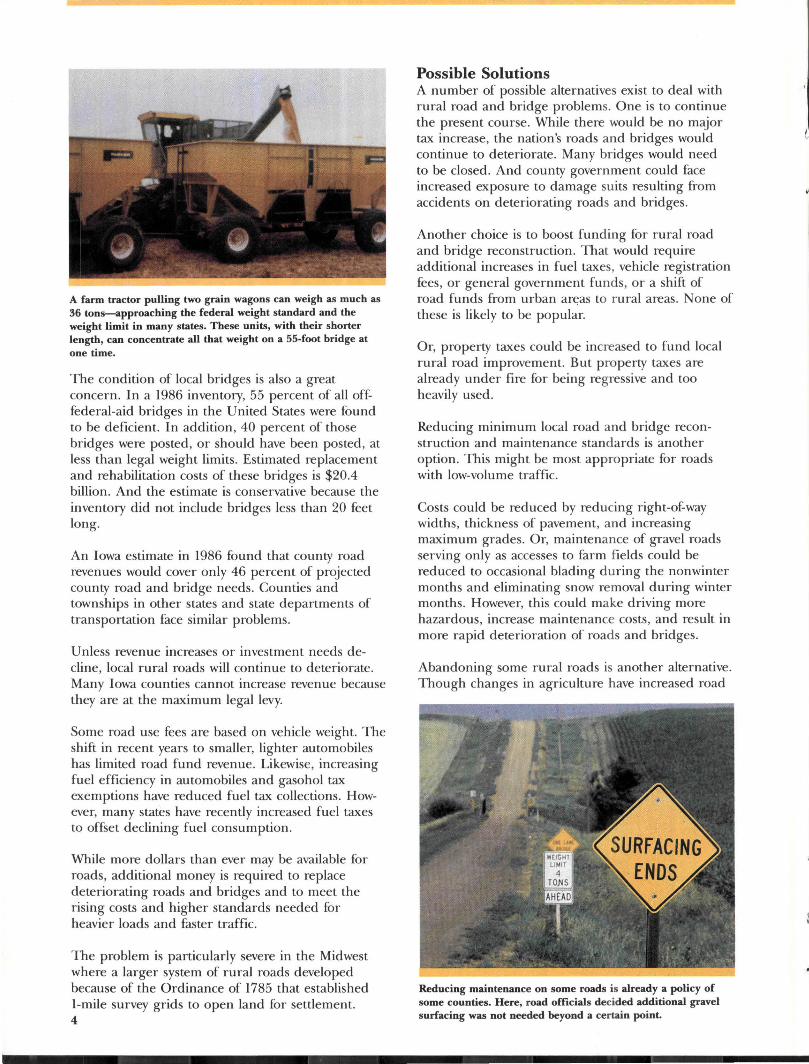
The present federal standard and the legal weight limit in Iowa and many other states is 40 tons. But, many rural bridges were designed for just 20-ton loads. As a result, many bridges have weight restrictions and roads are inadequate for the heavy loads they now carry.
Loaded school buses cannot cross weight-restricted bridges in some rural areas. There have been instances where passengers unloaded to walk across the bridge while the empty bus followed. Here, a dry weather bypass has been built to avoid rerouting the school bus around a limited-capacity bridge until it is reconstructed.
Semitrailers and tractors are being used increasingly to haul grain and livestock to market. These vehicles and their loads often reach the maximum weight limit of 40 tons, the federal standard and the weight limit in many states. Some of the better rural bridges have a capacity of 20 tons.
Local and state governments lacked money for road building in the early days when demand for better roads first became evident. With the growth in the number and use of motor vehicles, road building got high priority for a number of years.
Currently, the local rural road system-maintained and controlled by counties or townships--consists of 2.2 million miles. It represents 71 percent of the 3.2 million miles of rural roads in the United States. And local and state governments still lack the revenue to maintain and improve the present road system to meet the ever-expanding demand.
Precise information on the current condition of the local rural road system is not available because there is no systematic data collection. However, ample evidence shows the system is deteriorating rapidly. In a recent Illinois survey, for instance, farmers and agribusiness representatives rated about half that state's local rural roads as needing more than regular maintenance. More than 20 percent of the roads were said to need major repair.
Common complaints about local rural roads include:
• Overweight vehicles breaking up road surfaces,
• Lack of hard surfaces creating dust and rideability problems,
• Road widths and other design characteristics inadequate for large farm equipment and heavy trucks, and
•Narrow lanes creating safety problems.
3
A farm tractor pulling two grain wagons can weigh as much as 36 tons-approaching the federal weight standard and the weight limit in many states. These units, with their shorter length, can concentrate all that weight on a 55-foot bridge at one time.
The condition of local bridges is also a great concern. In a 1986 inventory, 55 percent of all offfederal-aid bridges in the United States were found to be deficient. In addition, 40 percent of those bridges were posted, or should have been posted, at less than legal weight limits. Estimated replacement and rehabilitation costs of these bridges is $20.4 billion. And the estimate is conservative because the inventory did not include bridges less than 20 feet long.
An Iowa estimate in 1986 found that county road revenues would cover only 46 percent of projected county road and bridge needs. Counties and townships in other states and state departments of transportation face similar problems.
Unless revenue increases or investment needs decline, local rural roads will continue to deteriorate. Many Iowa counties cannot increase revenue because they are at the maximum legal levy.
Some road use fees are based on vehicle weight. The shift in recent years to smaller, lighter automobiles has limited road fund revenue. Likewise, increasing fuel efficiency in automobiles and gasohol tax exemptions have reduced fuel tax collections. However, many states have recently increased fuel taxes to offset declining fuel consumption.
While more dollars than ever may be available for roads, additional money is required to replace deteriorating roads and bridges and to meet the rising costs and higher standards needed for heavier loads and faster traffic.
The problem is particularly severe in the Midwest where a larger system of rural roads developed because of the Ordinance of 1785 that established I-mile survey grids to open land for settlement. 4
Possible Solutions A number of possible alternatives exist to deal with rural road and bridge problems. One is to continue the present course. While there would be no major tax increase, the nation's roads and bridges would continue to deteriorate. Many bridges would need to be closed. And county government could face increased exposure to damage suits resulting from accidents on deteriorating roads and bridges.
Another choice is to boost funding for rural road and bridge reconstruction. That would require additional increases in fuel taxes, vehicle registration fees , or general government funds, or a shift of road funds from urban areas to rural areas. None of these is likely to be popular.
Or, property taxes could be increased to fund local rural road improvement. But property taxes are already under fire for being regressive and too heavily used.
Reducing minimum local road and bridge reconstruction and maintenance standards is another option. This might be most appropriate for roads with low-volume traffic.
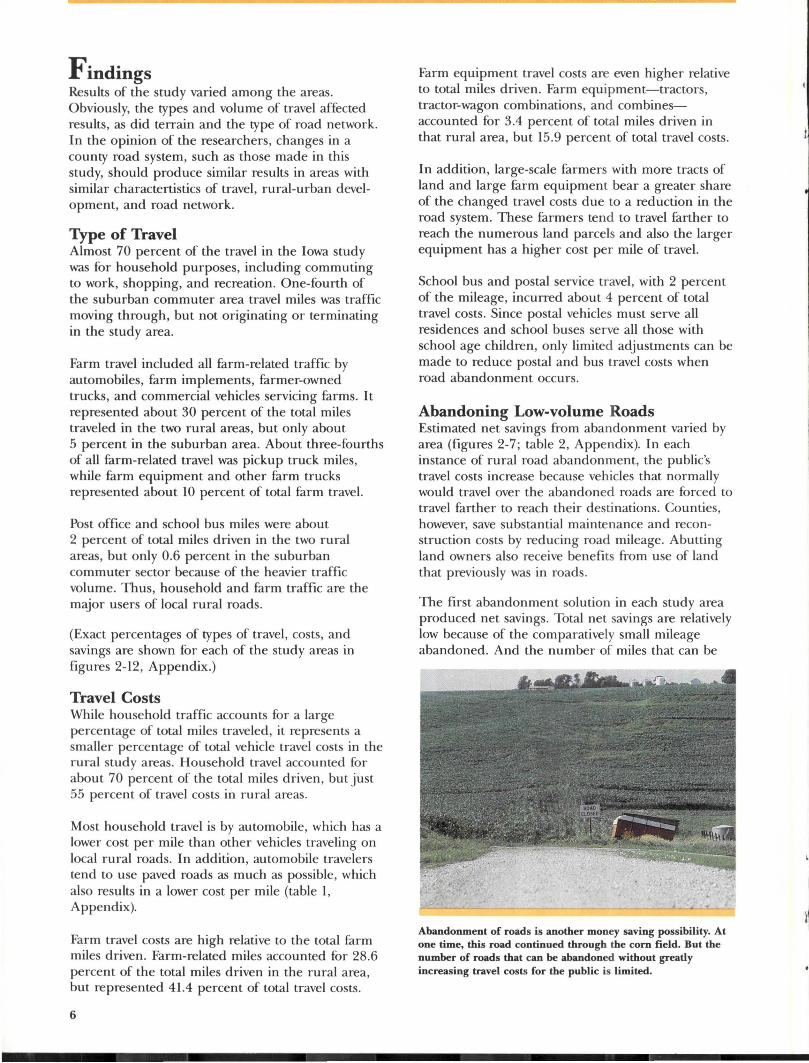
Costs could be reduced by reducing right-of-way widths, thickness of pavement, and increasing maximum grades. Or, maintenance of gravel roads serving only as accesses to farm fields could be reduced to occasional blading during the nonwinter months and eliminating snow removal during winter months. However, this could make driving more hazardous, increase maintenance costs, and result in more rapid deterioration of roads and bridges.
Abandoning some rural roads is another alternative. Though changes in agriculture have increased road
Reducing maintenance on some roads is already a policy of some counties. Here, road officials decided additional gravel surfacing was not needed beyond a certain point.
use, these changes also have resulted in fewer and larger farms. Some observers believe that many miles of rural roads could be abandoned without denying access to the remaining farms and residences.
Another alternative is to reduce and enforce weight limits on local rural roads to reduce road and bridge capacity needs. At present, many states, including Iowa, have no weight nor width limit on "implements of husbandry" (farm equipment).
The Iowa Study A cost-benefit analysis was conducted in Iowa to examine the effects of some of the alternative solutions to the rural road problem. The Iowa State University study examined five road and bridge alternatives, including:
• Reducing the county road system by abandoning some roads with low traffic volume that serve no property access,
• Converting selected low-volume roads that serve no households or farmsteads to low-maintenance roads,
• Reducing public road mileage by converting sets of dead-end roads to private drives ,
•Reducing public road mileage by converting continuous roads to private drives , and
•Upgrading selected bridges to legal load limits.
Changes in travel costs to several groups of county road users and the changes in road maintenance and reconstruction costs were analyzed for each alternative. The results provide guidelines that county supervisors and engineers can use to evaluate various road alternatives and to provide state legislators with information to help develop local rural road and bridge policies.
Study Areas For the analysis, three case study areas of 100 square miles each were selected in Iowa. The rural Hamilton County study area has a relatively high agricultural tax base, a high percentage of paved roads (18 percent), and relatively few bridges.
The second study area in Shelby County was even more rural. It has a relatively low agricultural tax base, hilly terrain, a low percentage of paved roads (6 percent), a large number of oil- and earthsurfaced roads, and many bridges. One half the Shelby County study area roads have oil or earth surfaces.
Figure 1.
The Linn County analysis represents a suburban area. It has a relatively high agricultural tax base, a high percentage of paved roads (22 percent), and numerous nonfarm households with commuters to Cedar Rapids and Waterloo.
Through questionnaires, researchers obtained information on the number of trips in 1982, including data on the origin, destination, purpose of trip, and type of vehicle. Travel costs were estimated for all types of vehicles on all types of roads.
Methods A computer program representing the 1982 network of roads was created for each study area. Travel data from questionnaires completed by area residents and nonresident farmers were entered into the computer. Reported trips were analyzed to obtain the least-cost routes for all 1982 travel in the study area. These least-cost routes formed the base solution.
Then, one or more groups of roads were removed from the computerized road network in each area. The computer program was run again with the theoretical abandonment of roads to find the leastcost routes.
Differences between a study area's base solution and its abandonment solution(s) provide the estimated savings from road abandonment. Costs and savings were analyzed for the traveling public, the county, and abutting land owners.
The traveling public would be affected by changes in travel costs due to abandonment of the selected roads. Savings to the county and abutting land owners included road maintenance, resurfacing, and reconstruction costs, as well as land-rental value forgone by keeping land in roads rather than in agricultural production.
Costs to various groups of travelers were combined to determine if the solution produced overall net savings or additional costs (negative savings). 5
Findings Results of the study varied among the areas. Obviously, the types and volume of travel affected results, as did terrain and the type of road network. In the opinion of the researchers, changes in a county road system, such as those made in this study, should produce similar results in areas with similar charactertistics of travel, rural-urban development, and road network.
Type of Travel Almost 70 percent of the travel in the Iowa study was for household purposes, including commuting to work, shopping, and recreation. One-fourth of the suburban commuter area travel miles was traffic moving through, but not originating or terminating in the study area.
Farm travel included all farm-related traffic by automobiles, farm implements, farmer-owned trucks, and commercial vehicles servicing farms. It represented about 30 percent of the total miles traveled in the two rural areas, but only about 5 percent in the suburban area. About three-fourths of all farm-related travel was pickup truck miles, while farm equipment and other farm trucks represented about 10 percent of total farm travel.
Post office and school bus miles were about 2 percent of total miles driven in the two rural areas, but only 0.6 percent in the suburban commuter sector because of the heavier traffic volume. Thus, household and farm traffic are the major users of local rural roads.
(Exact percentages of types of travel , costs, and savings are shown for each of the study areas in figures 2-12, Appendix.)
Travel Costs While household traffic accounts for a large percentage of total miles traveled, it represents a smaller percentage of total vehicle travel costs in the rural study areas. Household travel accounted for about 70 percent of the total miles driven, but just 55 percent of travel costs in rural areas.
Most household travel is by automobile, which has a lower cost per mile than other vehicles traveling on local rural roads. In addition, automobile travelers tend to use paved roads as much as possible, which also results in a lower cost per mile (table 1, Appendix).
Farm travel costs are high relative to the total farm miles driven. Farm-related miles accounted for 28.6 percent of the total miles driven in the rural area, but represented 41.4 percent of total travel costs.
6
Farm equipment travel costs are even higher relative to total miles driven. Farm equipment-tractors, tractor-wagon combinations, and combinesaccounted for 3.4 percent of total miles driven in that rural area, but 15.9 percent of total travel costs.
In addition, large-scale farmers with more tracts of land and large farm equipment bear a greater share of the changed travel costs due to a reduction in the road system. These farmers tend to travel farther to reach the numerous land parcels and also the larger equipment has a higher cost per mile of travel.
School bus and postal service travel, with 2 percent of the mileage, incurred about 4 percent of total travel costs. Since postal vehicles must serve all residences and school buses serve all those with school age children, only limited adjustments can be made to reduce postal and bus travel costs when road abandonment occurs.
Abandoning Low-volume Roads Estimated net savings from abandonment varied by area (figures 2-7; table 2, Appendix). In each instance of rural road abandonment, the public's travel costs increase because vehicles that normally would travel over the abandoned roads are forced to travel farther to reach their destinations. Counties, however, save substantial maintenance and reconstruction costs by reducing road mileage. Abutting land owners also receive benefits from use of land that previously was in roads.
The first abandonment solution in each study area produced net savings. Total net savings are relatively low because of the comparatively small mileage abandoned. And the number of miles that can be
Abandonment of roads is another money saving possibility. At one time, this road continued through the corn field. But the number of roads that can be abandoned without greatly increasing travel costs for the public is limited.
abandoned is limited-probably about 5 to 10 percent of a county road system.
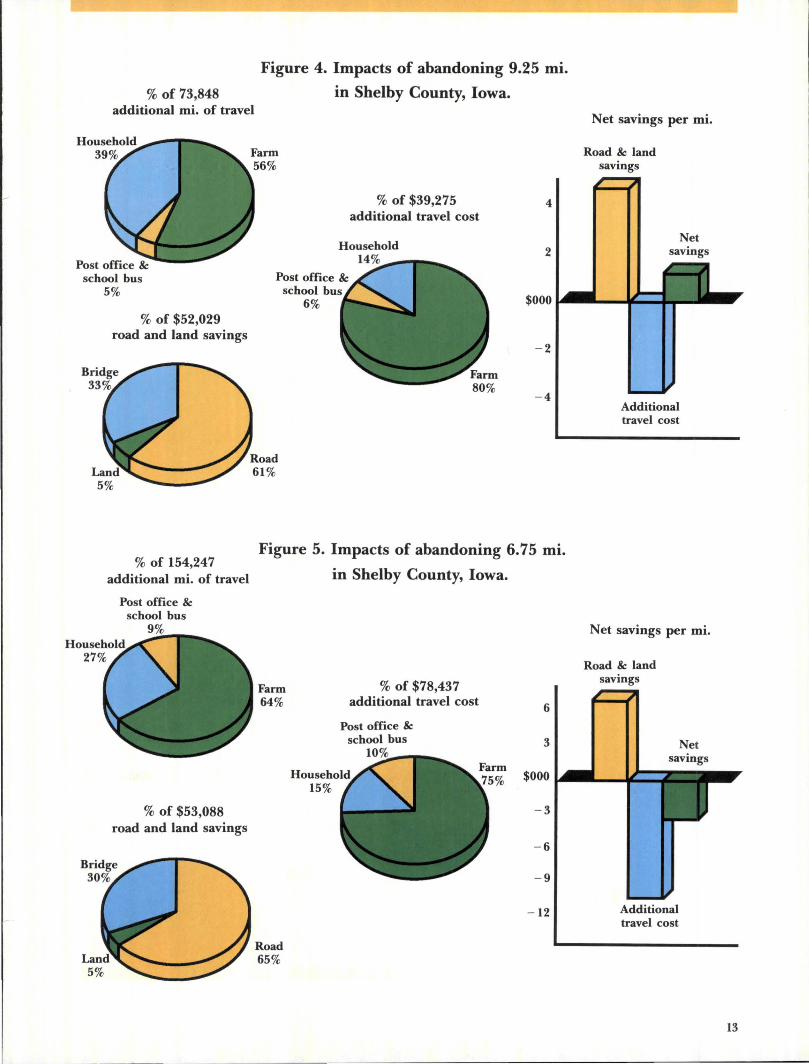
Savings ranged from $70 per mile per year for the first 5.25 miles of road abandoned in the suburban area up to $1,379 per mile per year for the first 9.25 miles abandoned in the most rural area.
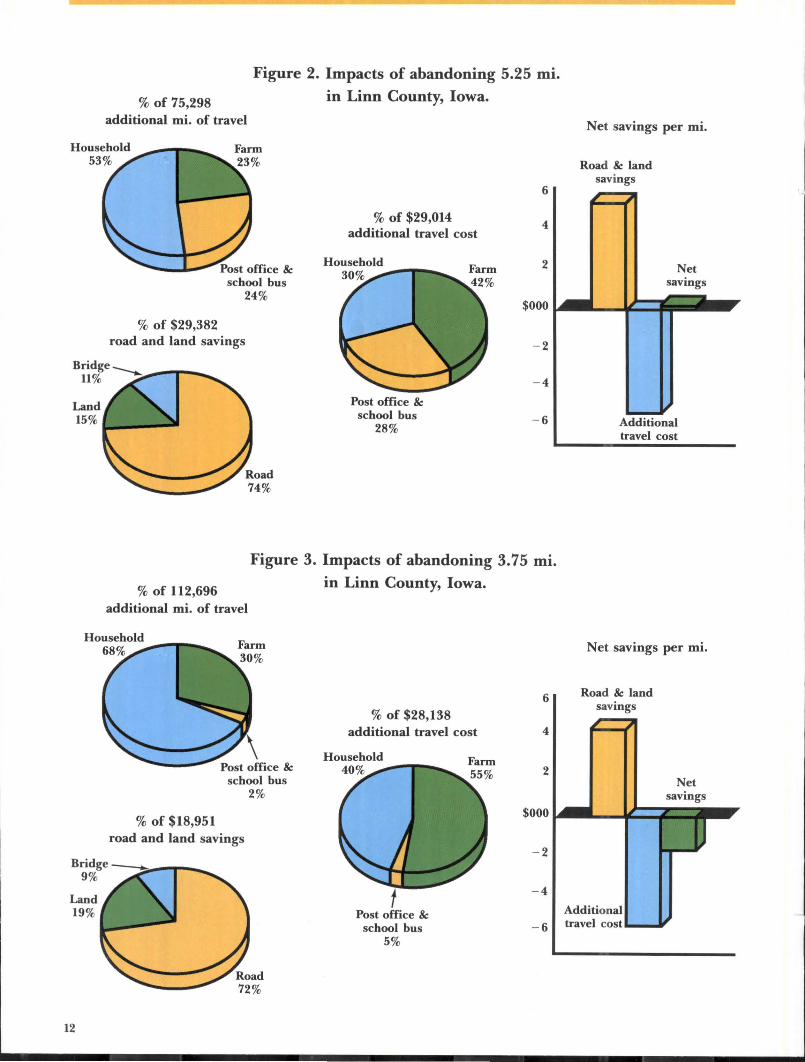
Though net savings were small, impacts were often sizable in total. For instance, abandonment of those 5.25 miles in the suburban area resulted in an additional 75,298 miles of travel at a cost of $29,014 (figure 2). Total savings from the abandonment amounted to $29,382 for a net savings of about $300 per year.
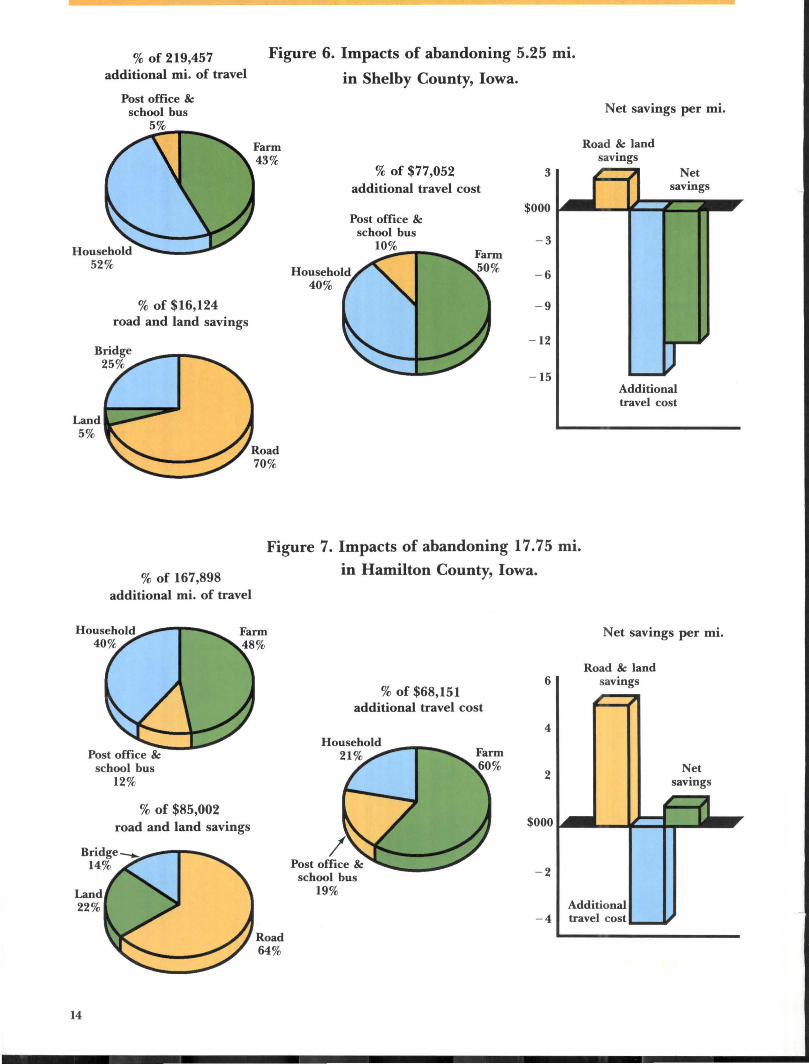
Abandoning just under 18 miles of roads in one rural area required an additional 167,898 miles of travel at an added cost of $68,151 per year (figure 7). However, total savings to the county and abutting land owners amounted to more than $85 ,000 per year.
Additional abandonment of roads beyond these first stages did not produce net savings (figures 3, 5, 6; table 2, Appendix). As more roads are abandoned , the additional cost to the traveling public increases faster than the savings to the counties and abutting land owners. Rural roads abandoned in the later stages generally carried 10 to 30 trips a day.
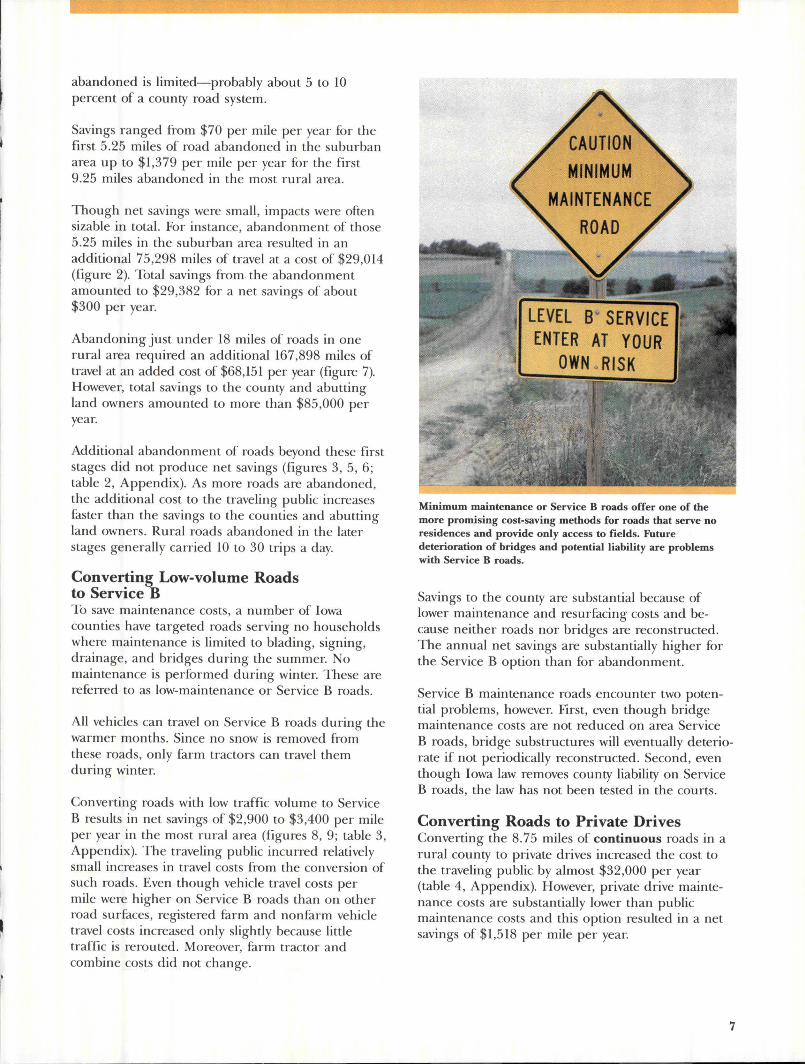
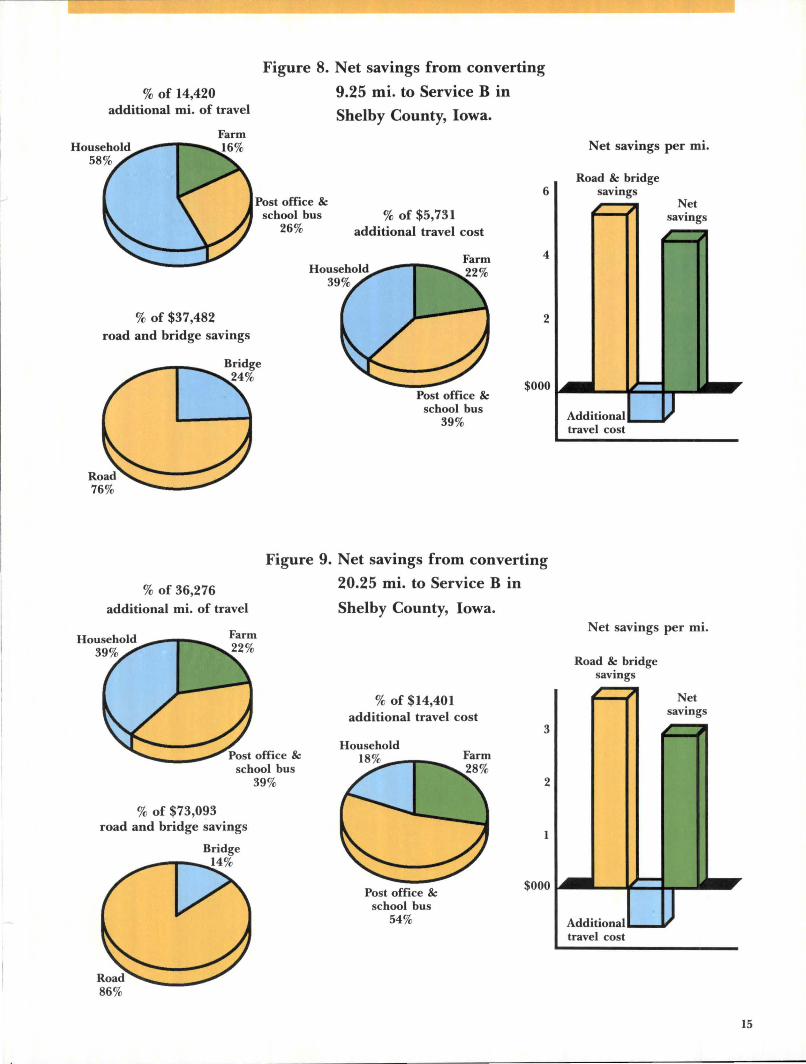
Converting Low-volume Roads to Service B To save maintenance costs, a number of Iowa counties have targeted roads serving no households where maintenance is limited to blading, signing, drainage, and bridges during the summer. No maintenance is performed during winter. These are referred to as low-maintenance or Service B roads.
All vehicles can travel on Service B roads during the warmer months. Since no snow is removed from these roads, only farm tractors can travel them during winter.
Converting roads with low traffic volume to Service B results in net savings of $2,900 to $3,400 per mile per year in the most rural area (figures 8, 9; table 3, Appendix). The traveling public incurred relatively small increases in travel costs from the conversion of such roads. Even though vehicle travel costs per mile were higher on Service B roads than on other road surfaces, registered farm and nonfarm vehicle travel costs increased only slightly because little traffic is rerouted. Moreover, farm tractor and combine costs did not change.
MINIMUM
Minimum maintenance or Service B roads offer one of the more promising cost-saving methods for roads that serve no residences and provide only access to fields. Future deterioration of bridges and potential liability are problems with Service B roads.
Savings to the county are substantial because of lower maintenance and resurfacing costs and because neither roads nor bridges are reconstructed. The annual net savings are substantially higher for the Service B option than for abandonment.
Service B maintenance roads encounter two potential problems, however. First, even though bridge maintenance costs are not reduced on area Service B roads, bridge substructures will eventually deteriorate if not periodically reconstructed. Second, even though Iowa law removes county liability on Service B roads, the law has not been tested in the courts.
Converting Roads to Private Drives Converting the 8.75 miles of continuous roads in a rural county to private drives increased the cost to the traveling public by almost $32,000 per year (table 4, Appendix). However, private drive maintenance costs are substantially lower than public maintenance costs and this option resulted in a net savings of $1,518 per mile per year.
7
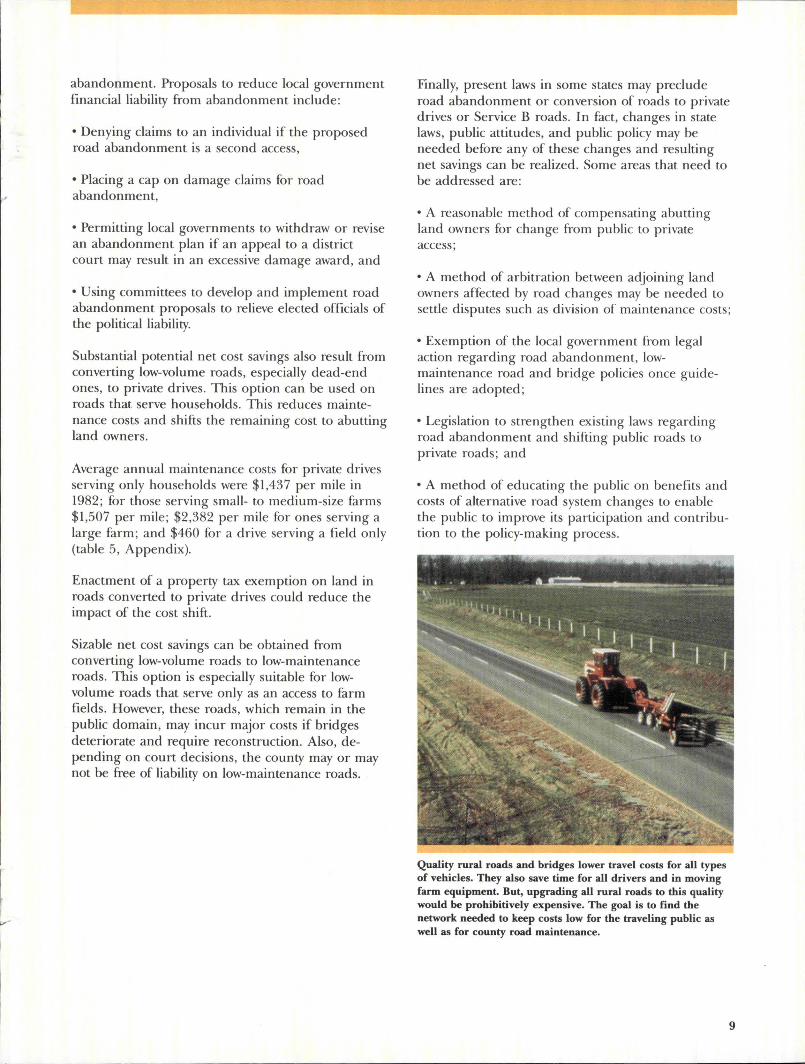
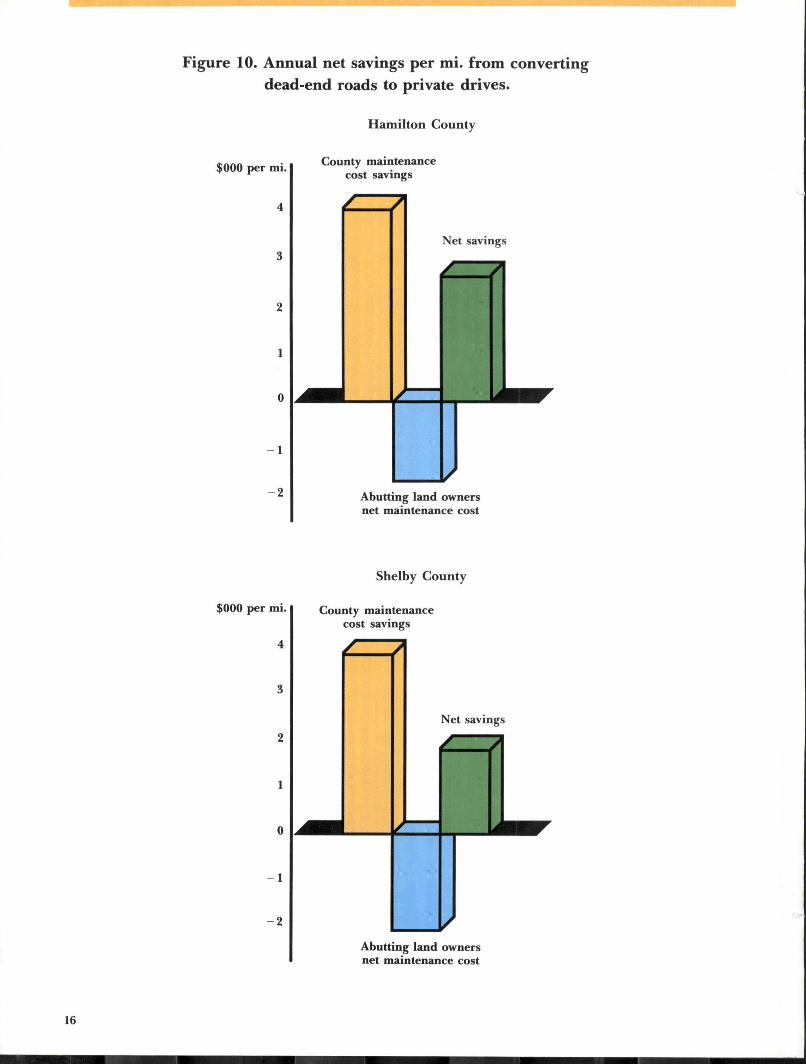
Converting dead-end roads to private drives has even larger savings potential for most counties. In most instances, this option results in no additional travel costs, because only originating or terminating traffic travels on these roads.
In addition, each mile of 66-foot right-of-way public road converted to 40-foot right-of-way private drive frees 3.15 acres of land for agricultural production. Rental value of the added land is included in the cost savings from private drives. Converting deadend roads to private drives created a net savings of $1,956 to $2,442 per mile per year in rural counties (figure 10; table 4, Appendix).
Dead-end roads, serving only one or two residences, can be converted to private drives to redu«!e costs. Less maintenance is required on private driveways, which lowers costs. But some compensation may be needed for land owners who take on the maintenance of what was once a public road.
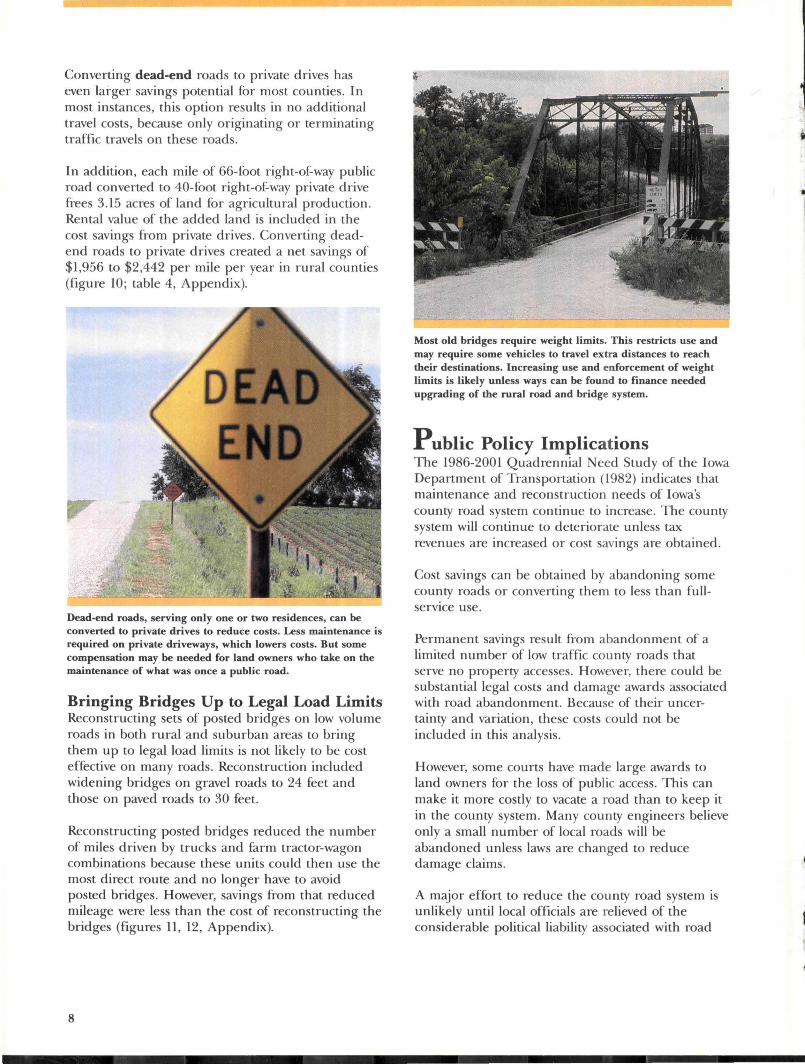
Bringing Bridges Up to Legal Load Limits Reconstructing sets of posted bridges on low volume roads in both rural and suburban areas to bring them up to legal load limits is not likely to be cost effective on many roads. Reconstruction included widening bridges on gravel roads to 24 feet and those on paved roads to 30 feet.
Reconstructing posted bridges reduced the number of miles driven by trucks and farm tractor-wagon combinations because these units could then use the most direct route and no longer have to avoid posted bridges. However, savings from that reduced mileage were less than the cost of reconstructing the bridges (figures 11, 12, Appendix).
8
Most old bridges require weight limits. This restricts use and may require some vehicles to travel extra distances to reach their destinations. Increasing use and enforcement of weight limits is likely unless ways can be found to finance needed upgrading of the rural road and bridge system.
Public Policy Implications The 1986-2001 Quadrennial Need Study of the Iowa Department of Transportation (1982) indicates that maintenance and reconstruction needs of Iowa's county road system continue to increase. The county system will continue to deteriorate unless tax revenues are increased or cost savings are obtained.
Cost savings can be obtained by abandoning some county roads or converting them to less than fullservice use.
Permanent savings result from abandonment of a limited number of low traffic county roads that serve no property accesses. However, there could be substantial legal costs and damage awards associated with road abandonment. Because of their uncertainty and variation, these costs could not be included in this analysis.
However, some courts have made large awards to land owners for the loss of public access. This can make it more costly to vacate a road than to keep it in the county system. Many county engineers believe only a small number of local roads will be abandoned unless laws are changed to reduce damage claims.
A major effort to reduce the county road system is unlikely until local officials are relieved of the considerable political liability associated with road
.1
,
abandonment. Proposals to reduce local government financial liability from abandonment include:
• Denying claims to an individual if the proposed road abandonment is a second access,
• Placing a cap on damage claims for road abandonment,
• Permitting local governments to withdraw or revise an abandonment plan if an appeal to a district court may result in an excessive damage award, and
•Using committees to develop and implement road abandonment proposals to relieve elected officials of the political liability.
Substantial potential net cost savings also result from converting low-volume roads, especially dead-end ones, to private drives. This option can be used on roads that serve households. This reduces maintenance costs and shifts the remaining cost to abutting land owners.
Average annual maintenance costs for private drives serving only households were $1 ,437 per mile in 1982; for those serving small- to medium-size farms $1,507 per mile; $2,382 per mile for ones serving a large farm; and $460 for a drive serving a field only (table 5, Appendix).
Enactment of a property tax exemption on land in roads converted to private drives could reduce the impact of the cost shift.
Sizable net cost savings can be obtained from converting low-volume roads to low-maintenance roads. This option is especially suitable for lowvolume roads that serve only as an access to farm fields. However, these roads, which remain in the public domain, may incur major costs if bridges deteriorate and require reconstruction. Also, depending on court decisions, the county may or may not be free of liability on low-maintenance roads.
Finally, present laws in some states may preclude road abandonment or conversion of roads to private drives or Service B roads. In fact, changes in state laws, public attitudes, and public policy may be needed before any of these changes and resulting net savings can be realized. Some areas that need to be addressed are:
• A reasonable method of compensating abutting land owners for change from public to private access;
• A method of arbitration between adjoining land owners affected by road changes may be needed to settle disputes such as division of maintenance costs;
•Exemption of the local government from legal action regarding road abandonment, lowmaintenance road and bridge policies once guidelines are adopted;
• Legislation to strengthen existing laws regarding road abandonment and shifting public roads to private roads; and
• A method of educating the public on benefits and costs of alternative road system changes to enable the public to improve its participation and contribution to the policy-making process.
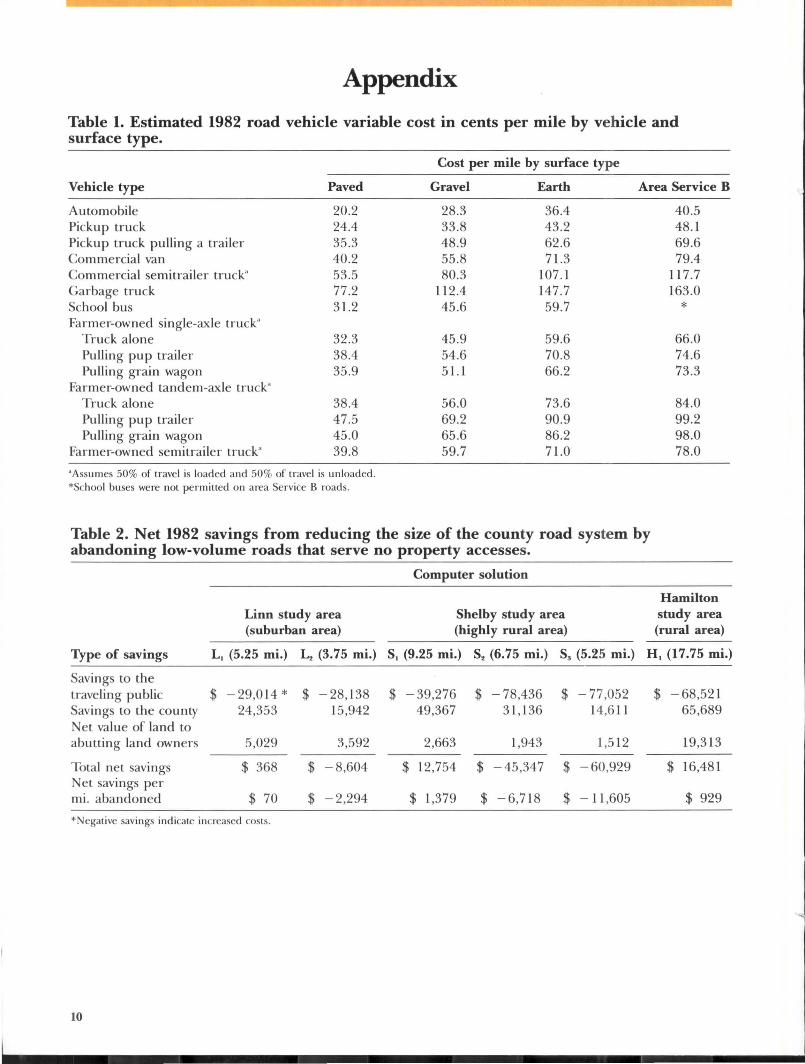
Quality rural roads and bridges lower travel costs for all types of vehicles. They also save time for all drivers and in moving farm equipment. But, upgrading all rural roads to this quality would be prohibitively expensive. The goal is to find the network needed to keep costs low for the traveling public as well as for county road maintenance.
9
Appendix
Table 1. Estimated 1982 road vehicle variable cost in cents per mile by vehicle and surface type.
Cost per mile by surface type
Vehicle type Paved Gravel Earth Area Service B
Automobile 20.2 28.3 36.4 40.5 Pickup truck 24.4 33.8 43.2 48.l Pickup truck pulling a trailer 35.3 48.9 62.6 69.6 Commercial van 40.2 55.8 71.3 79.4 Commercial semitrailer truck" 53.5 80.3 107.1 117.7 Garbage truck 77.2 112.4 147.7 163.0 School bus 31.2 45.6 59.7 * Farmer-owned single-axle truck"
Truck alone 32.3 45.9 59.6 66.0 Pulling pup trailer 38.4 54.6 70.8 74.6 Pulling grain wagon 35.9 51.1 66.2 73.3
Farmer-owned tandem-axle truck" Truck alone 38.4 56.0 73.6 84.0 Pulling pup trailer 47.5 69.2 90.9 99.2 Pulling grain wagon 45.0 65.6 86.2 98.0
Farmer-owned semitrai ler truck" 39.8 59.7 71.0 78.0
"Assumes 50% of travel is loaded and 50% of travel is unloaded . *School buses were not permitted on area Service B roads.
Table 2. Net 1982 savings from reducing the size of the county road system by abandoning low-volume roads that serve no property accesses.
Type of savings
Savings to the traveling public Savings to the county
et value of land to abutting land owners
Total net savings Net savings per mi. abandoned
Linn study area (suburban area)
L, (5.25 mi.) L. (3.75 mi.)
$ -29,014 * $ -28,138 24,353 15,942
5,029 3,592
$ 368 $ -8,604
$ 70 $ -2,294
*Negative savings indicate increased costs.
10
Computer solution
Shelby study area (highly rural area)
S, (9.25 mi.) S, (6.75 mi.) S, (5.25 mi.)
$ -39,276 $ -78,436 $ -77,052 49,367 31,136 14,611
2,663 1,943 1,512
$ 12,754 $ -45,347 $ -60,929
$ 1,379 $ -6,718 $ - 11 ,605
Hamilton study area (rural area)
H, (17.75 mi.)
$ -68,521 65,689
19,313
$ 16,481
$ 929
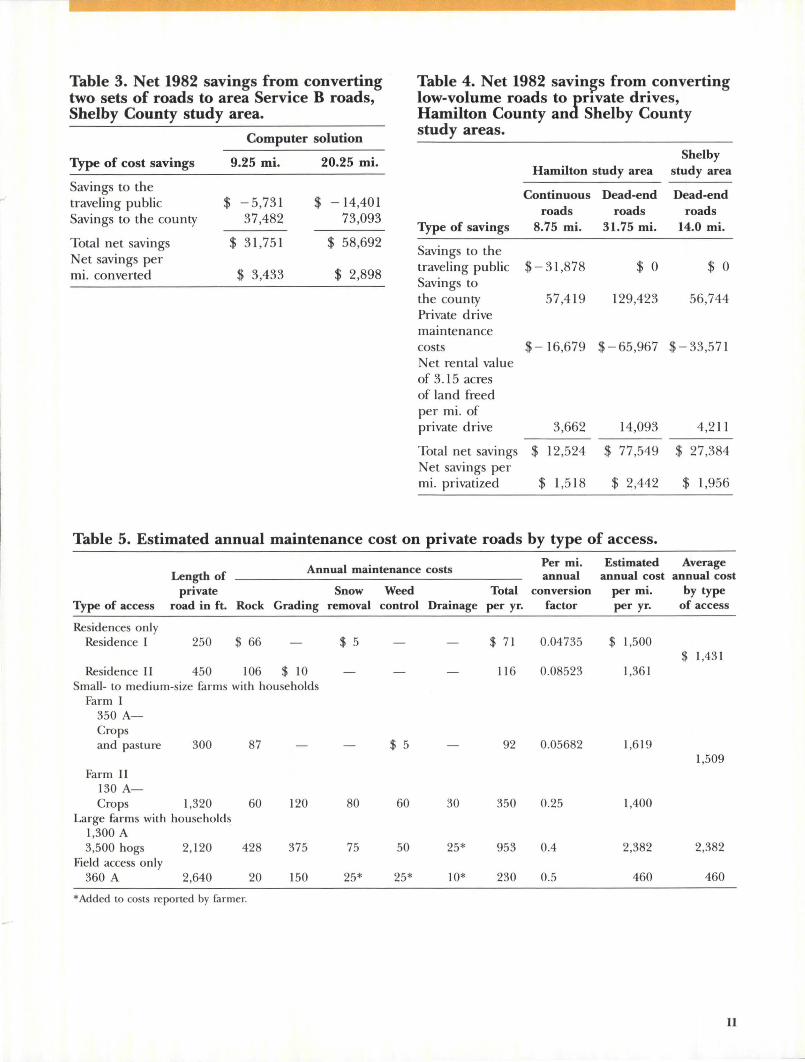
Table 3. Net 1982 savings from converting two sets of roads to area Service B roads, Shelby County study area.
Computer solution
Type of cost savings 9.25 mi. 20.25 mi.
Savings to the traveling public $ -5,731 $ -14,401 Savings to the county 37,482 73,093
Total net savings $ 31,751 $ 58,692 Net savings per mi. converted $ 3,433 $ 2,898
Table 4. Net 1982 saving-s from converting low-volume roads to private drives, Hamilton County and Shelby County study areas.
Shelby Hamilton study area study area
Type of savings
Savings to the traveling public Savings to the county Private drive maintenance
Continuous roads
8.75 mi.
$-31,878
57,419
Dead-end Dead-end roads roads
31.75 mi. 14.0 mi.
$ 0 $ 0
129,423 56,744
costs $-16,679 $-65,967 $-33,571 Net rental value of 3.15 acres of land freed per mi. of private drive 3,662
Total net savings $ 12,524 Net savings per mi. privatized $ 1,5 18
14,093 4,211
$ 77 ,549 $ 27 ,384
$ 2,442 $ 1,956
Table 5. Estimated annual maintenance cost on private roads by type of access.
Annual maintenance costs Per mi. Estimated Average Length of annual annual cost annual cost
private Snow Weed Total conversion per mi. by type Type of access road in ft. Rock Grading removal control Drainage per yr. factor per yr. of access
Residences only Residence I 250 $ 66 $ 5 $ 71 0.04735 $ 1,500
$ 1,431 Residence II 450 106 $ 10 116 0.08523 1,361
Small- to medium-size farms with households Farm I
350 A-Crops and pasture 300 87 $ 5 92 0.05682 1,6 19
1,509 Farm II
130 A-Crops 1,320 60 120 80 60 30 350 0.25 1,400
Large farms with households 1,300 A 3,500 hogs 2,120 428 375 75 50 25* 953 0.4 2,382 2,382
Field access only 360 A 2,640 20 150 25* 25* 10* 230 0.5 460 460
*Added to costs reported by farmer.
11
Land 15%
Land 19%
12
% of 75,298 additional mi. of travel
% of $29,382 road and land savings
% of 112,696 additional mi. of travel
% of $18,951 road and land savings
Figure 2. Impacts of abandoning 5.25 mi. in Linn County, Iowa.
% of $29,014 additional travel cost
Post office & school bus
28%
6
4
2
- 2
- 4
- 6
Figure 3. Impacts of abandoning 3.75 mi. in Linn County, Iowa.
% of $28,138 additional travel cost
Post office & school bus
5%
6
4
2
Net savings per mi.
Road & land savings
Net savings
Additional travel cost
Net savings per mi.
Road & land savings
Net savings
% of 73,848 additional mi. of travel
% of $52,029 road and land savings
% of 154,247 additional mi. of travel
Post office & school bus
9%
.. ,
% of $53,088 road and land savings
Figure 4. Impacts of abandoning 9.25 mi.
in Shelby County, Iowa.
Post office & school bus
6%
% of $39,275 additional travel cost
4
2
- 2
- 4
Figure 5. Impacts of abandoning 6. 7 5 mi.
in Shelby County, Iowa.
Fann 64%
Road 65%
% of $78,437 additional travel cost 6
3
- 6
- 9
- 12
Net savings per mi.
Road & land savings
Net savings
Additional travel cost
Net savings per mi.
Road & land savings
Net savings
Additional travel cost
13
Land 5%
14
% of 219,457 additional mi. of travel
Post office & school bus
5%
% of $16,124 road and land savings
% of 167,898 additional mi. of travel
% of $85,002 road and land savings
Figure 6. Impacts of abandoning 5.25 mi.
in Shelby County, Iowa.
% of $77,052 additional travel cost
Post office & school bus
10%
3
- 3
- 6
- 9
- 12
- 15
Figure 7. Impacts of abandoning 17. 7 5 mi.
in Hamilton County, Iowa.
% of $68,151 additional travel cost
Post office & school bus
19%
6
4
2
- 2
Net savings per mi.
Road & land savings
Net savings
Additional travel cost
Net savings per mi.
Road & land savings
Net savings
Additional
Road 64%
- 4 travel cost __ ,
% of 14,420 additional mi. of travel
% of $37,482 road and bridge savings
% of 36,276 additional mi. of travel
% of $73,093 road and bridge savings
Figure 8. Net savings from converting
9.25 mi. to Service B in
Shelby County, Iowa.
Post office & school bus
26% % of $5,731
additional travel cost
Post office & school bus
39%
6
4
2
Figure 9. Net savings from converting
20.25 mi. to Service B in
Shelby County, Iowa.
% of $14,401 additional travel cost
3
2
I
Net savings per mi.
Road & bridge savings
Net savings
Additional __ ., travel cost
Net savings per mi.
Road & bridge savings , ,
Net savings
Post office & school bus
54%
"-$000 ~
Additional _ ___.,.J travel cost
15
16
Figure 10. Annual net savings per mi. from converting dead-end roads to private drives.
$000 per mi.
4
3
2
1
0
- 1
-2
$000 per mi.
4
3
- 1
- 2
Hamilton County
County maintenance cost savings
Net savings
Abutting land owners net maintenance cost
Shelby County
County maintenance cost savings
Net savings
Abutting land owners net maintenance cost
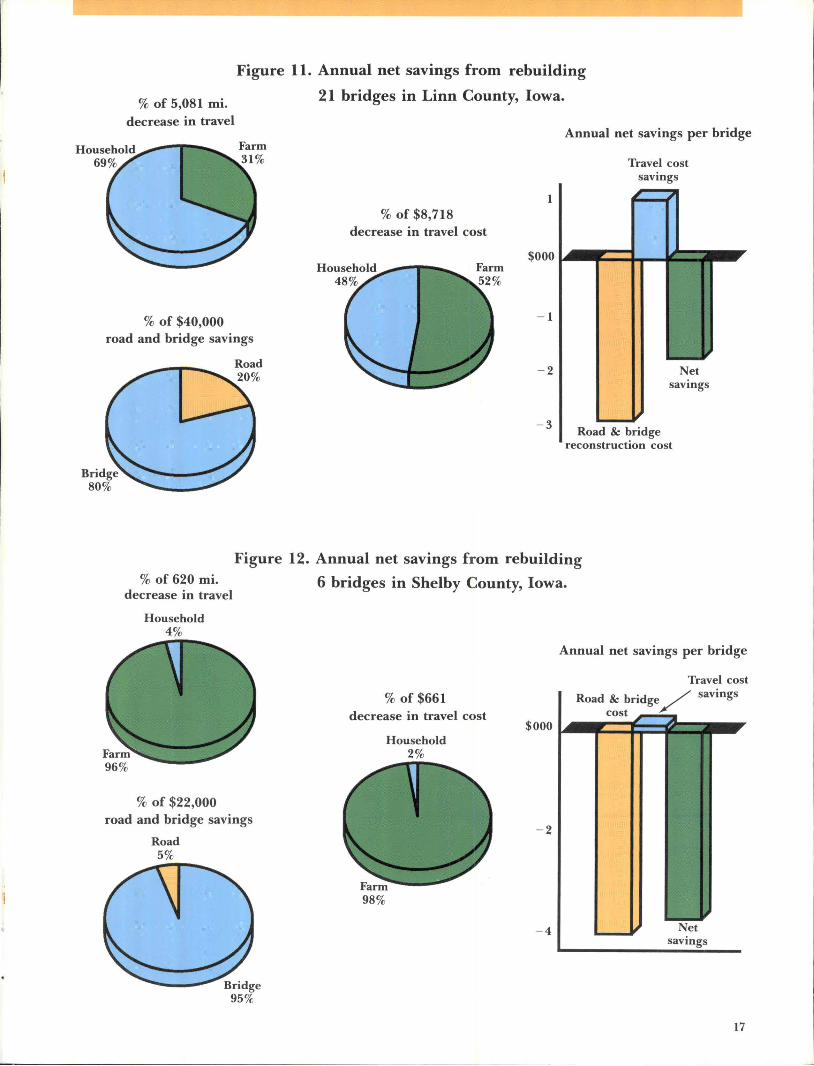
Figure 11. Annual net savings from rebuilding
% of 5,081 mi. decrease in travel
% of $40,000 road and bridge savings
21 bridges in Linn County, Iowa.
% of $8,718 decrease in travel cost
- 2
- 3
Annual net savings per bridge
Travel cost savings
Net savings
Road & bridge reconstruction cost
% of 620 mi. decrease in travel
Figure 12. Annual net savings from rebuilding
6 bridges in Shelby County, Iowa.
Household 4%
% of $22,000 road and bridge savings
Road 5%
% of $661 decrease in travel cost
Household 2%
Annual net savings per bridge
Travel cost
Road & bridge/ savings
cost --• $ 000 ~ .. !::::~:::::I
- 2
- 4 Net savings
17

4J..::. and justice for all The Iowa Cooperative Extension Service's programs and policies are consistent with pertinent federal and state laws and regulations on nondiscrimination regarding race, color, national origin, religion, sex, age, and handicap.
Cooperative Extension Service, Iowa State University of Science and Technology and the United States Department of Agriculture cooperating. Elizabeth A. Elliott, interim director, Ames, Iowa. Distributed in furtherance of the Acts of Congress of May 8 and June 30, 1914.


