25
Amateur Pulsar Detection Using the RTL2832U DVB-T and a 3m Dish Peter East, with assistance from Guillermo Gancio, Michiel Klaassen and Steve Olney
| Date post: | 03-May-2018 |
| Category: |
Documents |
| Upload: | truongngoc |
| View: | 218 times |
| Download: | 1 times |

Amateur Pulsar Detection
Using the RTL2832U DVB-T
and a 3m Dish
Peter East, with assistance fromGuillermo Gancio, Michiel Klaassen and Steve Olney

Introduction
• Background• Why RTL SDR?• RTL Radio Telescope• Detecting Pulsars• Challenges• Improving Chances• Conclusions

Amateur pulsar detection?
The PlanBeg real Data from Experts
Write some software, check SNRUnderstand Radio Telescope Performance
Scale the System ParametersTry it out

RTL2832U USB Dongle
• The RTL2832U is a ‘high-performance’ DVB-T (Digital Video Broadcasting - Terrestrial) demodulator with a USB 2.0 interface.
• It outputs 8-bit I/Q-samples at bandwidths up to 2.4MHz and tunes over 25-1800MHz

RTL Pulsar Radio Telescope
Data .bin Files
Software Processing:DemodulationDe-dispersion
Folding Integration
Dish
Antenna
LNA Chain
Band
Filter
PC
RTLUSB
Dongle

Available Software
Testing: SDR# + Zadig Driverfrom: sdrsharp.com
Data: Osmocom rtl tools rtl_sdr.exefrom: sdr.osmocom.org
Folding: rapulsar2.exefrom: y1pwe.co.uk/RAProgs
Display: Excel/MathCad
Professional: Tempo, Presto, Sigprocfrom: pulsarastronomy.net

Digital SDR Features
• RTL SDR is cheap, but can be better• Data recording + post-processing• Radiometer Equation:
ΔT=Tsys/√ (BT/N)
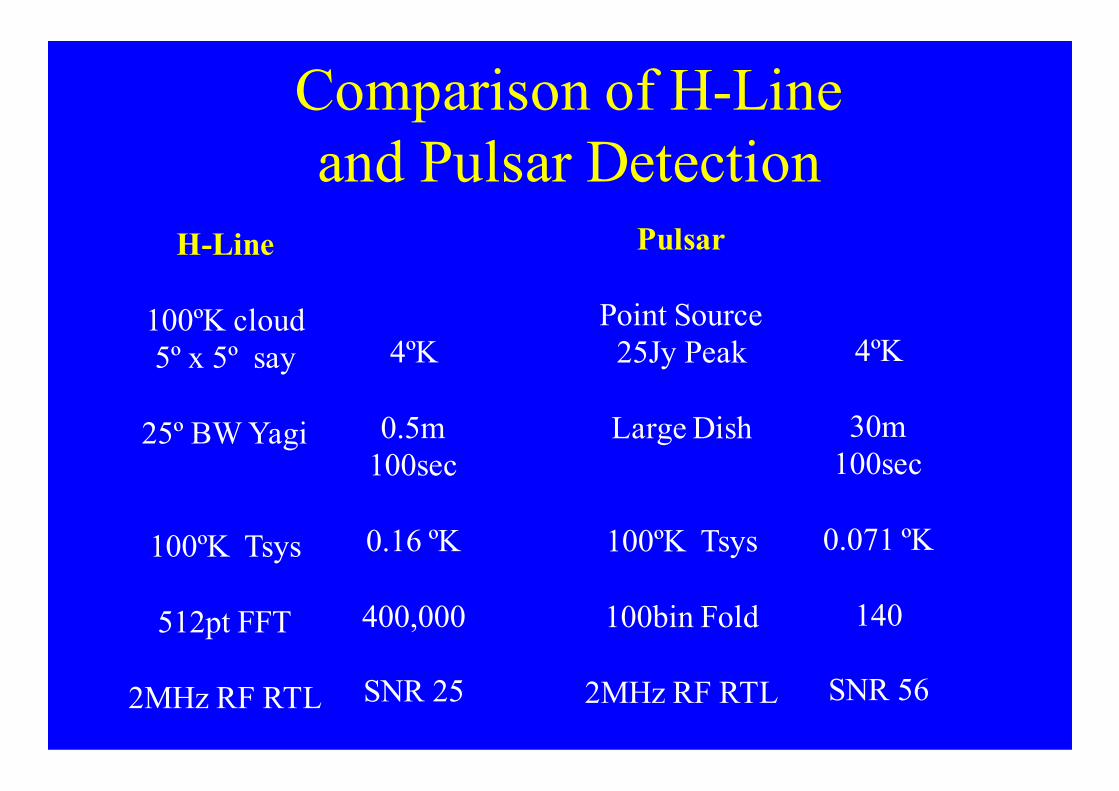
Comparison of H-Line and Pulsar Detection
H-Line
100ºK cloud5º x 5º say
25º BW Yagi
100ºK Tsys
512pt FFT
2MHz RF RTL
Pulsar
Point Source25Jy Peak
Large Dish
100ºK Tsys
100bin Fold
2MHz RF RTL
4ºK
0.5m100sec
0.16 ºK
400,000
SNR 25
4ºK
30m100sec
0.071 ºK
140
SNR 56

RTL Detected Pulsar Data

Detection ProcessWithin the pulsar pulse:
The receiver noise = k(Tpul + Tsys)Band outside = k(Tsys)B
Tpul and Tsys are the pulsar and system noise temperatures.k is Boltzsmann’s Constant, B the RF bandwidthSquaring the I and Q components (square-law detection)results in both AC (α BBv) and DC (α B2) components.
TsysTpulDC
AC
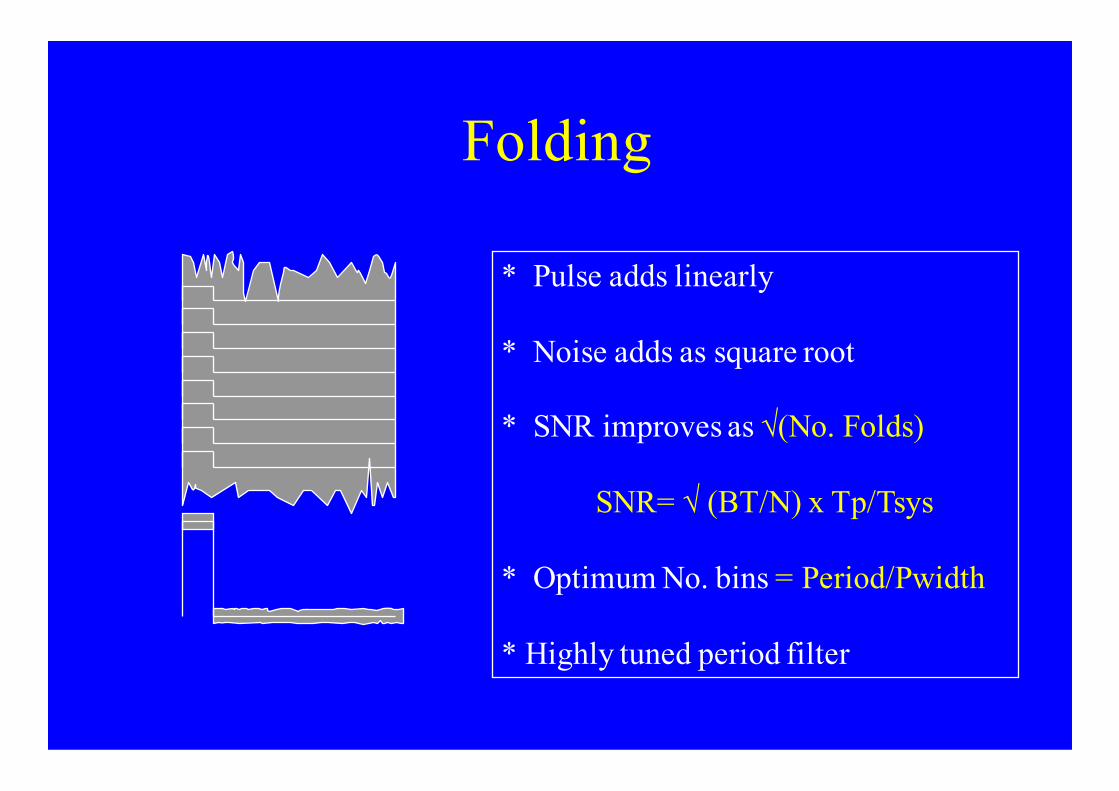
Folding
* Pulse adds linearly
* Noise adds as square root
* SNR improves as √(No. Folds)
SNR= √ (BT/N) x Tp/Tsys
* Optimum No. bins = Period/Pwidth
* Highly tuned period filter

Data Processing – DOS cmd.exeOsmoCom rtlsdr library & capture tool: ‘rtl_sdr.exe’.The capture tool generates files containing raw IQ ADC data from the dongle in hex form (viewing software: ‘hexdump.exe’).
rtl_sdr ./data.bin -f 1420e6 -g 42 –n 1e9
rapulsar2.exe processes this to carry out folding.• It breaks data into blocks equal in time to the pulsar period• Sums the blocks.• Outputs a text file that can be viewed in Excel or Math CAD.
rapulsar2 data.bin data.txt 100 89.39
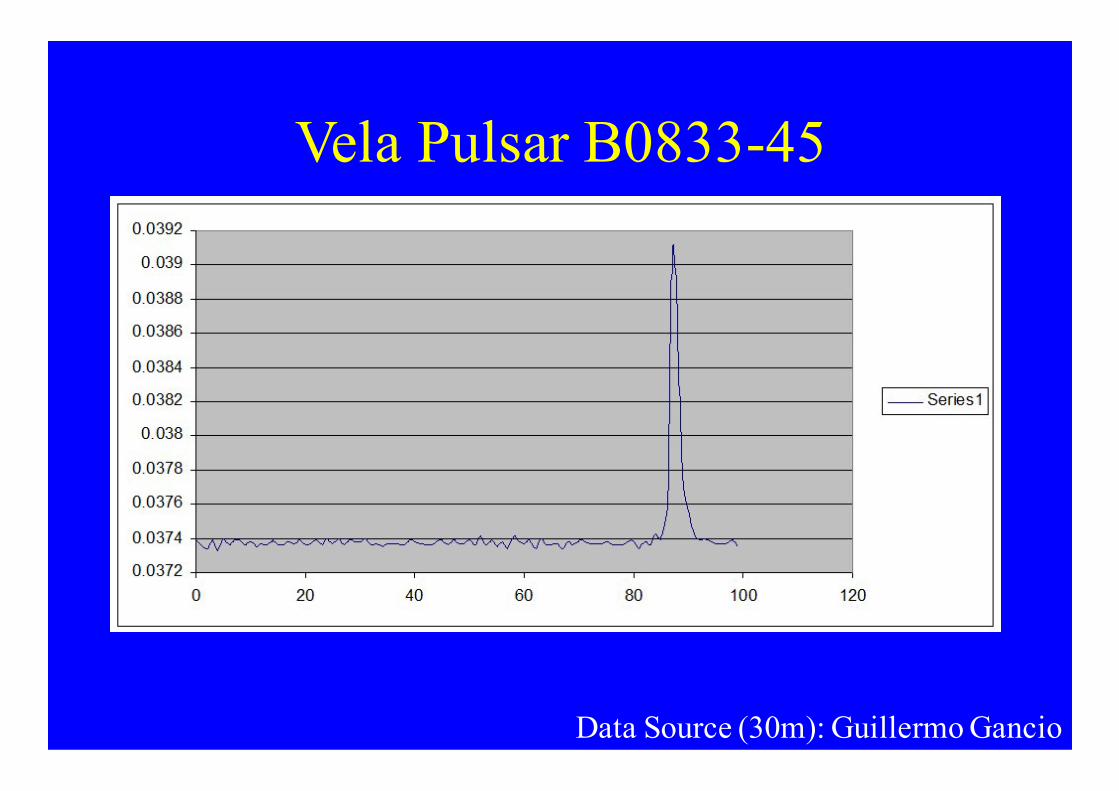
Vela Pulsar B0833-45
Data Source (30m): Guillermo Gancio

Amateur Pulsar Detection Systems
Pulsar
25Jy Peak
30m Dish
110ºK Tsys
100bin Fold
30m2MHz RF
4ºK
500sec
0.035 ºK
SNR 114
3.0m2MHz RF
0.04ºK
10800sec
0.0075 ºK
SNR 5.3
3.0m10Mhz RF
0.04ºK
3600sec
0.0058 ºK
SNR 7
3.0m10MHz RF
0.04ºK
1800sec50ºK Tsys0.0037 ºK
SNR 11

Quad RTL Rx

Homemade Softwarewww.y1pwe.co.uk
• Rapulsar2.exe – period folding • Pdetect2.exe – square-law video detection• Rafft2.exe – RF spectrum analysis• Pafft2.exe – video spectrum analysis• Amp_sts2.exe – ADC utilisation• Filetrim2.exe – file trimming• RFImit.exe – RFI spectral line blanking• Pdetfilt2.exe – Video spectrum blanking • De-dispers2Co.exe – de-dispersion

Digital De-dispersion
.bin File
FFT fL
fH
De-dispersed .bin file
Inverse FFT
FFT period Delays
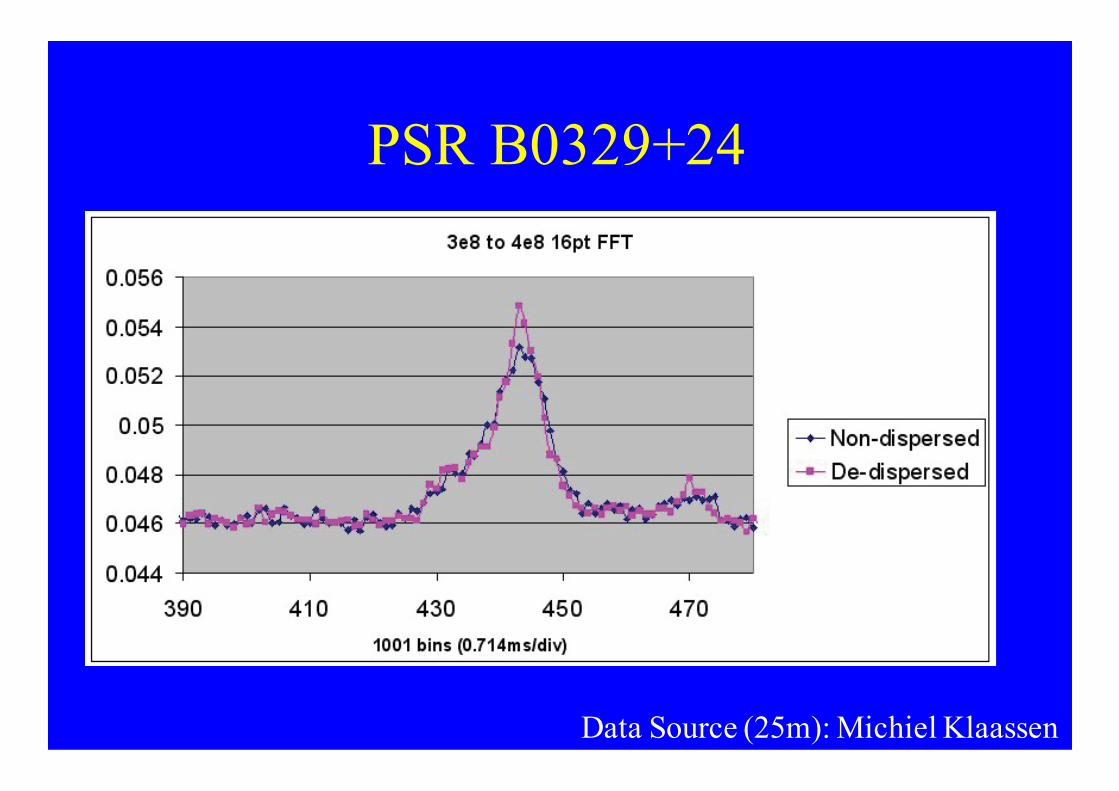
PSR B0329+24
Data Source (25m): Michiel Klaassen

Challenges
• RF Interference - RF and Video • Weak Signals - Folding process can find peaks
in noise• Validating Real Detections

Vela Video Spectrum
0
0.01
0.02
0.03
0.04
0.05
0.06
0.07
0.08
0.09
0.1
0 500 1000 1500 2000 2500 3000 3500 4000 4500
pafft2 500.bin 500.txt 2 1 8192Data Source (30m): Guillermo Gancio
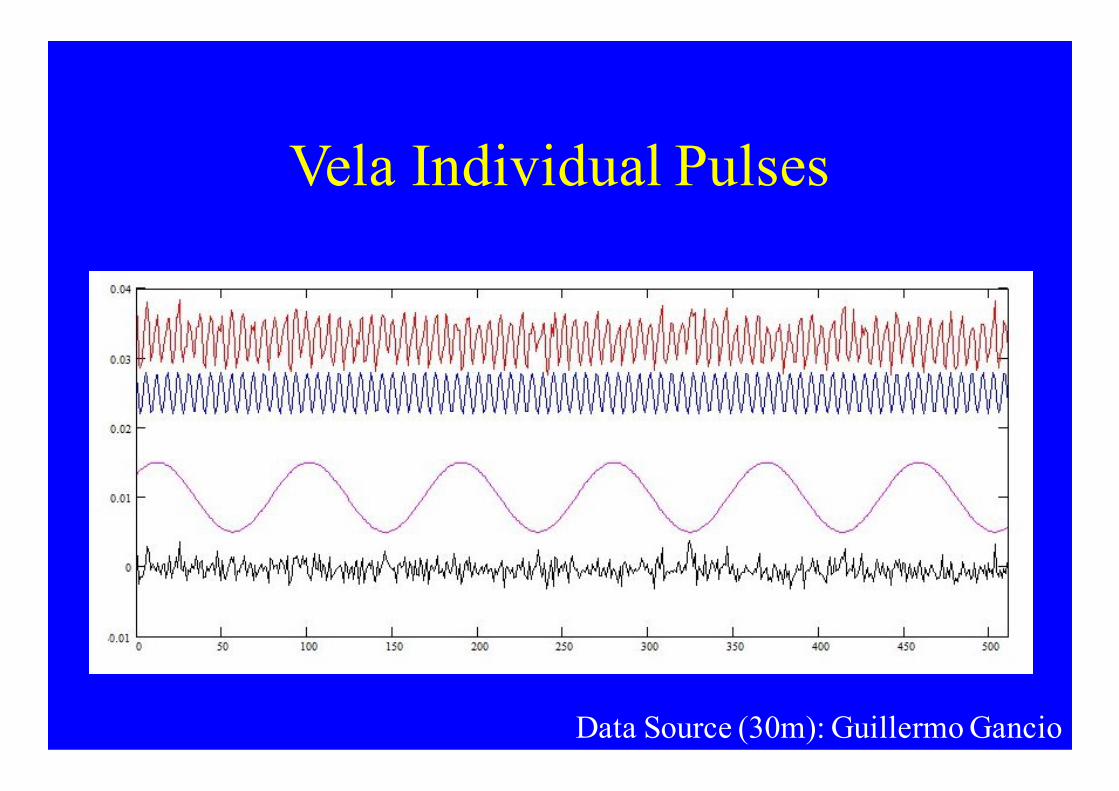
Vela Individual Pulses
Data Source (30m): Guillermo Gancio
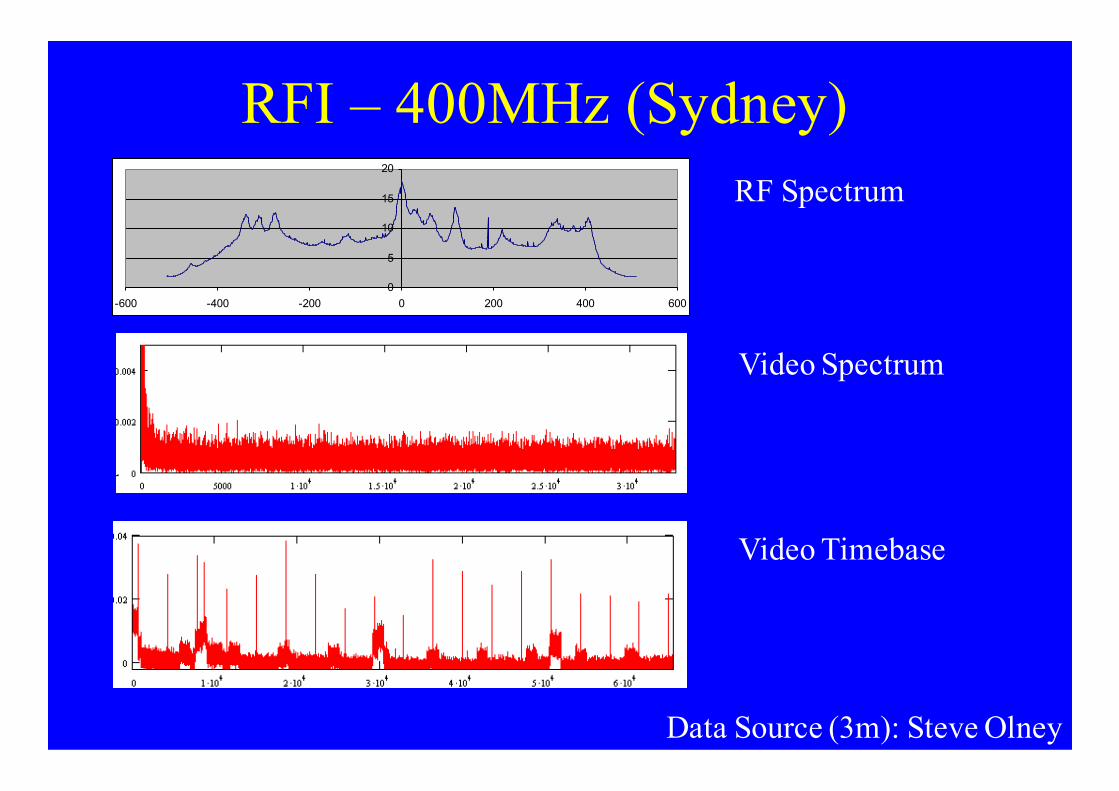
RFI – 400MHz (Sydney)
0
5
10
15
20
-600 -400 -200 0 200 400 600
RF Spectrum
Video Timebase
Video Spectrum
Data Source (3m): Steve Olney

False Vela
Folding period = 2 x 89.39msArrowed period = 89.39msSNR ~ 7
Data Source (3m): Steve Olney
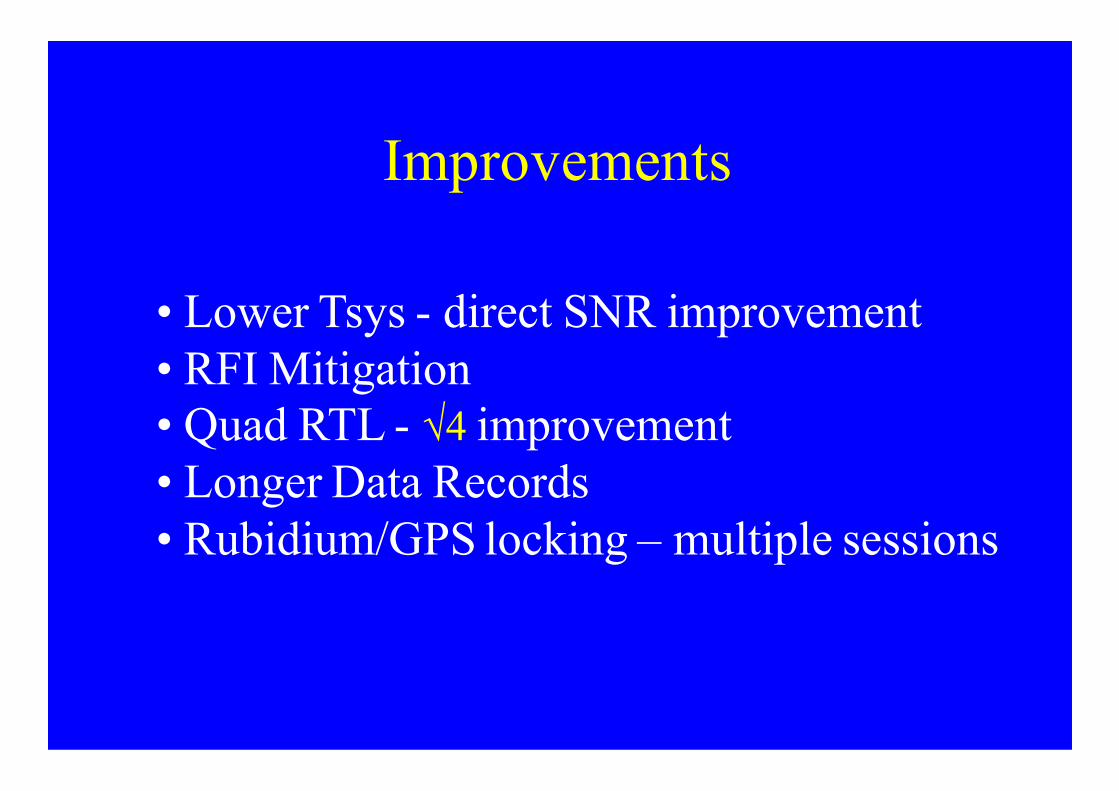
Improvements
• Lower Tsys - direct SNR improvement • RFI Mitigation• Quad RTL - √4 improvement • Longer Data Records• Rubidium/GPS locking – multiple sessions
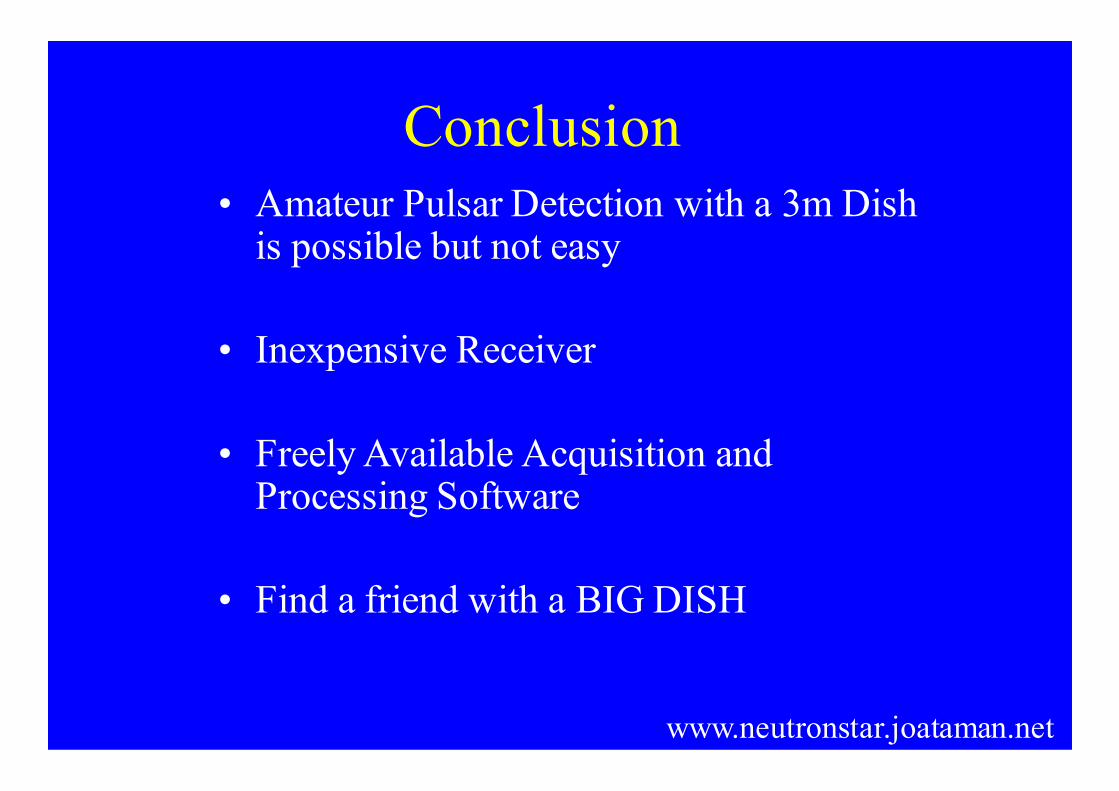
Conclusion• Amateur Pulsar Detection with a 3m Dish
is possible but not easy
• Inexpensive Receiver
• Freely Available Acquisition and Processing Software
• Find a friend with a BIG DISH
www.neutronstar.joataman.net


