A REPORT ON Ambient Air Quality, Water/ Waste Water Quality & Ambient Noise Level At NORTH EASTERN COALFIELDS COAL INDIA LTD. MARGHERITA SUMMER SEASON (April 2012 - June 2012) Submitted To : Submitted By: North-Eastern Coalfields ENVIROCON Coal India Limited Digboi Stores Building Margherita New Market Assam Digboi, Assam
Transcript
A REPORT ON
Ambient Air Quality, Water/ Waste Water Quality
&
Ambient Noise Level
At
NORTH EASTERN COALFIELDS
COAL INDIA LTD.
MARGHERI TA
SUMMER SEASON
(Apri l 2012 - June 2012)
Submitted To: Submitted By:
North-Eastern Coalf ields ENVIROCON Coal India L imi ted D igboi Stores Bui lding Margher i ta New Market
Assam D igboi , Assam
CONTENTS
Pages
1. BACKGROUND 1-2
2. SCOPE AND OBJECTIVE 3
3. METHODOLOGY 4
4. AMBIENT AIR QUALITY TEST RESULTS
a. RPM Levels 5
b. SPM Levels 6
c. SO2 Levels 7
d. NO2 Levels 8
Remarks 8
5. WATER ANALYSIS RESULTS
a. Effluent Water Analysis Results 9-11
b. Drinking Water Analysis Results 12
Remarks 13
6. NOISE LEVEL MEASUREMENT RESULTS 14
7. CONCLUSION 15
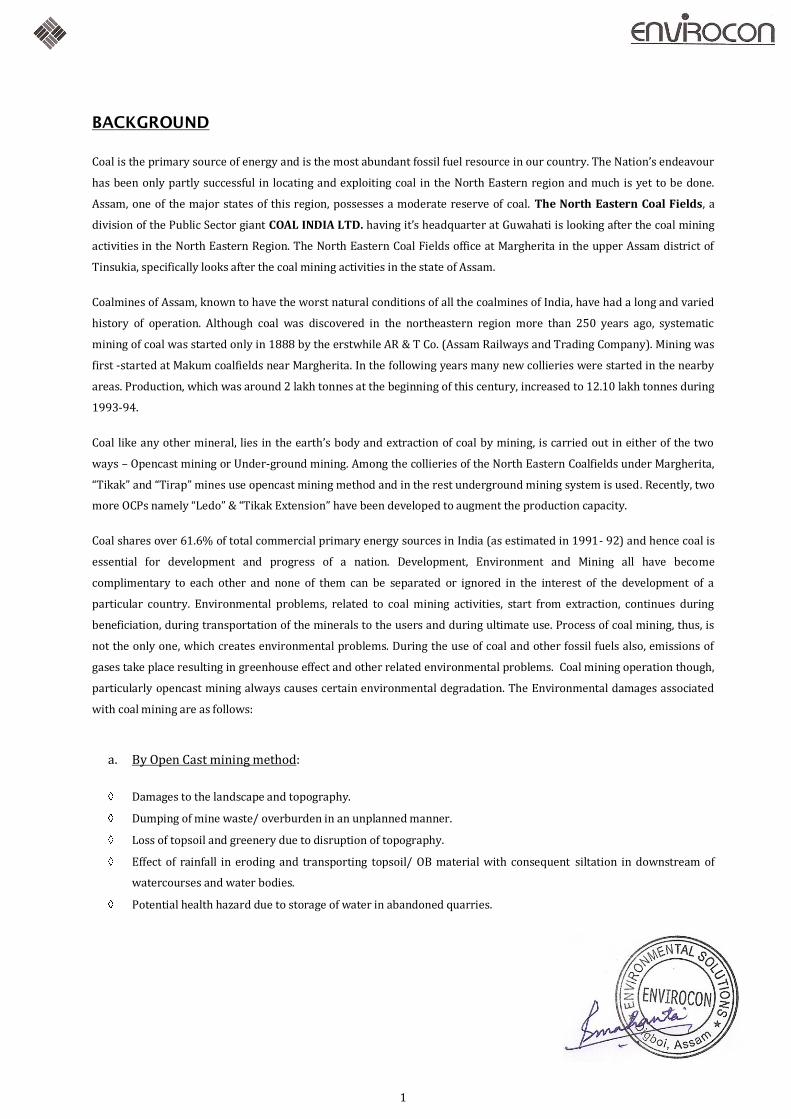
BACKGROUND
Coal is the primary source of energy and is the most abundant fossil fuel resource in our country. The Nation’s endeavour
has been only partly successful in locating and exploiting coal in the North Eastern region and much is yet to be done.
Assam, one of the major states of this region, possesses a moderate reserve of coal. The North Eastern Coal Fields, a
division of the Public Sector giant COAL INDIA LTD. having it’s headquarter at Guwahati is looking after the coal mining
activities in the North Eastern Region. The North Eastern Coal Fields office at Margherita in the upper Assam district of
Tinsukia, specifically looks after the coal mining activities in the state of Assam.
Coalmines of Assam, known to have the worst natural conditions of all the coalmines of India, have had a long and varied
history of operation. Although coal was discovered in the northeastern region more than 250 years ago, systematic
mining of coal was started only in 1888 by the erstwhile AR & T Co. (Assam Railways and Trading Company). Mining was
first -started at Makum coalfields near Margherita. In the following years many new collieries were started in the nearby
areas. Production, which was around 2 lakh tonnes at the beginning of this century, increased to 12.10 lakh tonnes during
1993-94.
Coal like any other mineral, lies in the earth’s body and extraction of coal by mining, is carried out in either of the two
ways – Opencast mining or Under-ground mining. Among the collieries of the North Eastern Coalfields under Margherita,
“Tikak” and “Tirap” mines use opencast mining method and in the rest underground mining system is used. Recently, two
more OCPs namely “Ledo” & “Tikak Extension” have been developed to augment the production capacity.
Coal shares over 61.6% of total commercial primary energy sources in India (as estimated in 1991- 92) and hence coal is
essential for development and progress of a nation. Development, Environment and Mining all have become
complimentary to each other and none of them can be separated or ignored in the interest of the development of a
particular country. Environmental problems, related to coal mining activities, start from extraction, continues during
beneficiation, during transportation of the minerals to the users and during ultimate use. Process of coal mining, thus, is
not the only one, which creates environmental problems. During the use of coal and other fossil fuels also, emissions of
gases take place resulting in greenhouse effect and other related environmental problems. Coal mining operation though,
particularly opencast mining always causes certain environmental degradation. The Environmental damages associated
with coal mining are as follows:
a. By Open Cast mining method:
Damages to the landscape and topography.
Dumping of mine waste/ overburden in an unplanned manner.
Loss of topsoil and greenery due to disruption of topography.
Effect of rainfall in eroding and transporting topsoil/ OB material with consequent siltation in downstream of
watercourses and water bodies.
Potential health hazard due to storage of water in abandoned quarries.
1
b. By Underground mining method:
Loss of productive land and property due to subsidence and surface/ underground mine fires.
Lowering of ground water bodies.
Adverse effect on surface water through release of polluted effluents etc.
Noise, vibration and occupational health problems etc.
Besides, release of solid and gaseous pollutants to the atmosphere disturbs the air to be breathed. All the above adverse
effects of mining may cause environmental degradation and ecological imbalance through disturbances to atmosphere,
hydrosphere, lithosphere and biosphere.
To protect and safeguard the environment against the resultant effects due to multiple activities, various stringent laws,
rules and regulations at National and International levels have been framed and are being enforced by Environment
Ministries, Pollution Control Boards and other similar organizations.
In order to curb the adverse effects of the abovementioned problems, the management of North Eastern Coalfields, has
taken various measures for Pollution control and given a new thrust in the direction of environmental restoration to
confine better mining scenario vis-à-vis environment. Suitable studies were initiated to generate data on existing status of
the environment; a number of measures have been adopted to prevent degradation due to deforestation, soil erosion,
water and air pollution etc., and at the same time provide concrete and exemplary works of land restoration to establish
the credibility of the company’s intention of environmental management.
As part of the Environmental Management program of NEC- Margherita and to keep an eye on the state of the
environment at the collieries and their adjacent residential areas, periodic test for Ambient Air Quality is carried out at
the collieries of Tikak, Tirap, Tipong, Baragolai and Ledo together with the Central Hospital in Margherita. Tests for Water
quality is also being carried out for Effluent (raw and treated) and Drinking water available from different sources in and
around the collieries. Noise level measurement is also conducted at some selected locations.
ENVIROCON, a Digboi based Environmental Consultancy firm, which is engaged in Environmental Data Generation,
Pollution Monitoring, Environmental Study and other allied works, was assigned with this important job of regular
Ambient Air Testing, Water analysis and Noise level measurement at selected locations of the different collieries of Coal
India Ltd., NEC- Margherita.
2
SCOPE OF THE STUDY
The present study included the open cast mines i.e. Tikak, Tirap and Ledo and the underground mine of Tipong together
with the Margherita Central Hospital and residential and commercial areas surrounding the mine areas, for Ambient Air
Quality testing; all the mines and adjoining areas for Water/ Waste Water analysis, and some selected locations for noise
level measurement.
OBJECTIVE OF THE STUDY
The major objectives of the study were,
To assess the ambient air quality at the selected mines (both open- cast & underground) and adjacent residential
areas and also at the Central Hospital in Margherita.
To assess the quality of effluent (raw and treated) and drinking water collected from different sources in and around
the mine areas.
To determine the noise levels at some selected locations near the mines and the residential areas. This report is prepared on the basis of available literature and on the data obtained by onsite monitoring through the
Summer Season (April 2012 to June 2012) for the relevant environmental components and parameters.
3
METHODOLOGY
Ambient Air Quality testing was conducted for the following parameters-
Respirable Particulate Matter (RPM)
Suspended Particulate Matter (SPM)
Sulfur Dioxide (SO2)
Nitrogen Dioxide (NO2).
For collecting samples for the determination of RPM, SPM, SO2 and NO2, ‘ENVIROTECH High Volume Respirable Dust
Sampler, APM 460’ together with gaseous attachment APM 411 was used. The instrument is capable of drawing air at a
flow rate of 1 to 1.3 m3/ min, with very little pressure drop. The APM 460 sampler uses an improved cyclone to separate
the coarser particles (larger than 10 microns) from the air stream before filtering it on the 0.5 micron pore-size filter
allowing a measurement of both TSPM (Total Suspended Particulate Matter) and the Respirable fraction of Suspended
Particulate Matter. Glass micro-fibre filter papers (GFA sheets, Whatman or equivalent) were used for the collection of
RPM. To determine the SO2 component in ambient air, sample was collected by drawing air at a flow rate of 0.5 liters per
minute (LPM) through an absorbing solution of Sodium tetrachloromercurate. For the NO2 component, sample was
collected by drawing air at a similar flow rate through another absorbing solution (a mixture of Sodium hydroxide and
Sodium arsenite). While the measurements of RPM and SPM were done gravimetrically, measurements of both SO2 and
NO2 were carried out colorimetrically. Samples for all the parameters were collected after every eight hours during the
twenty-four hours of total sampling period at each of the sampling points. All the analysis was done as per standard
methodology of IS-5182.
For analysis of water, the water samples collected from different sources were analysed as per relevant norms and
standards.
For measurement of noise, an appropriate sound level meter was used to measure the sound pressure levels. In
environmental noise measurement, the assessment of loudness is very important for its effects on people. This was
achieved by the use of A-weighting filters in the noise measuring instrument which gives a direct reading of the
approximate loudness. Moreover, A-weighted equivalent sound pressure levels (Leq) were also computed from the hourly
values of A-weighted sound levels. Noise measurement was carried out at some carefully selected locations covering
industrial, commercial and residential areas to assess the baseline noise levels.
4
ENVIRONMENTAL TEST RESULTS
AMBIENT AIR QUALITY
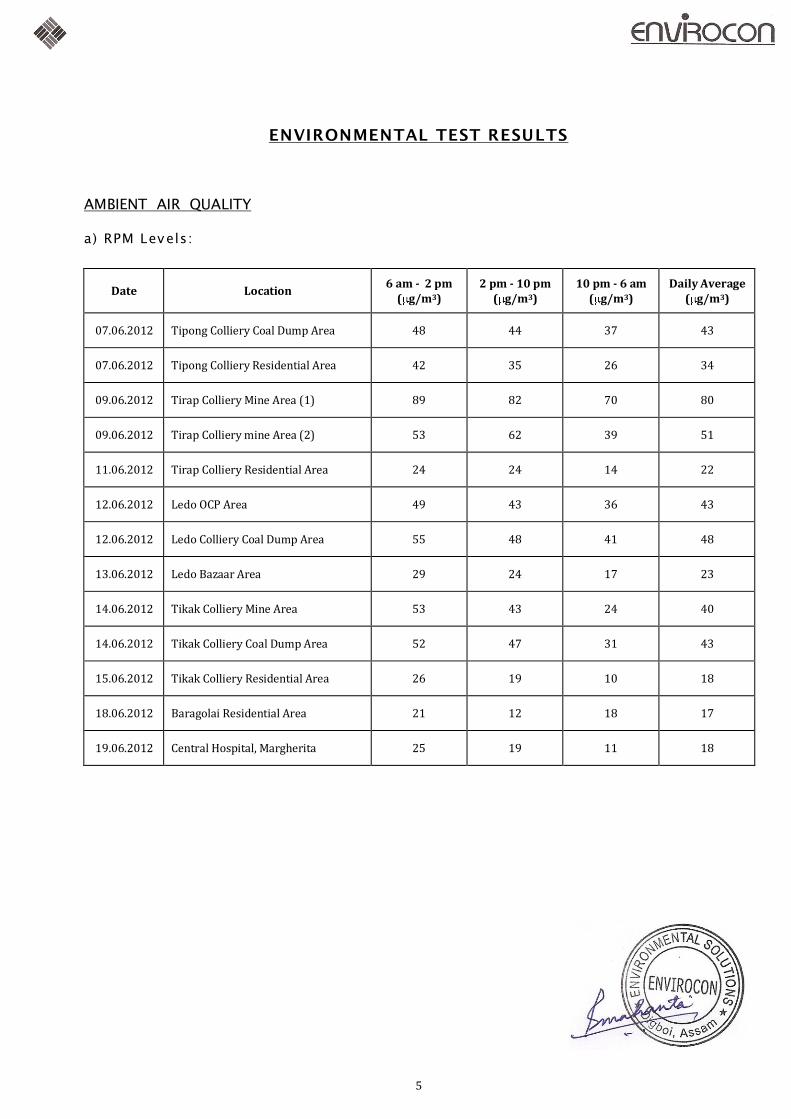
a) RPM Levels:
Date Location 6 am - 2 pm
( g/m3) 2 pm - 10 pm
( g/m3) 10 pm - 6 am
( g/m3) Daily Average
( g/m3)
07.06.2012 Tipong Colliery Coal Dump Area 48 44 37 43
07.06.2012 Tipong Colliery Residential Area 42 35 26 34
09.06.2012 Tirap Colliery Mine Area (1) 89 82 70 80
09.06.2012 Tirap Colliery mine Area (2) 53 62 39 51
11.06.2012 Tirap Colliery Residential Area 24 24 14 22
12.06.2012 Ledo OCP Area 49 43 36 43
12.06.2012 Ledo Colliery Coal Dump Area 55 48 41 48
13.06.2012 Ledo Bazaar Area 29 24 17 23
14.06.2012 Tikak Colliery Mine Area 53 43 24 40
14.06.2012 Tikak Colliery Coal Dump Area 52 47 31 43
15.06.2012 Tikak Colliery Residential Area 26 19 10 18
18.06.2012 Baragolai Residential Area 21 12 18 17
19.06.2012 Central Hospital, Margherita 25 19 11 18
5
b) SPM Levels:
Date Location 6 am - 2 pm
( g/m3) 2 pm - 10 pm
( g/m3) 10 pm - 6 am
( g/m3) Daily Average
( g/m3)
07.06.2012 Tipong Colliery Coal dump Area 203 220 181 201
07.06.2012 Tipong Colliery Residential Area 143 162 119 141
09.06.2012 Tirap Colliery Mine Area (1) 343 328 294 322
09.06.2012 Tirap Colliery mine Area (2) 327 293 257 292
11.06.2012 Tirap Colliery Residential Area 183 155 121 159
12.06.2012 Ledo OCP Area 312 274 267 284
12.06.2012 Ledo Colliery Coal Dump Area 292 286 239 276
13.06.2012 Ledo Bazaar Area 205 168 129 171
14.06.2012 Tikak Colliery Mine Area 231 224 205 220
14.06.2012 Tikak Colliery Coal Dump Area 249 242 218 238
15.06.2012 Tikak Colliery Residential Area 127 108 98 111
18.06.2012 Baragolai Residential Area 108 94 83 94
19.06.2012 Central Hospital, Margherita 117 102 91 101
6
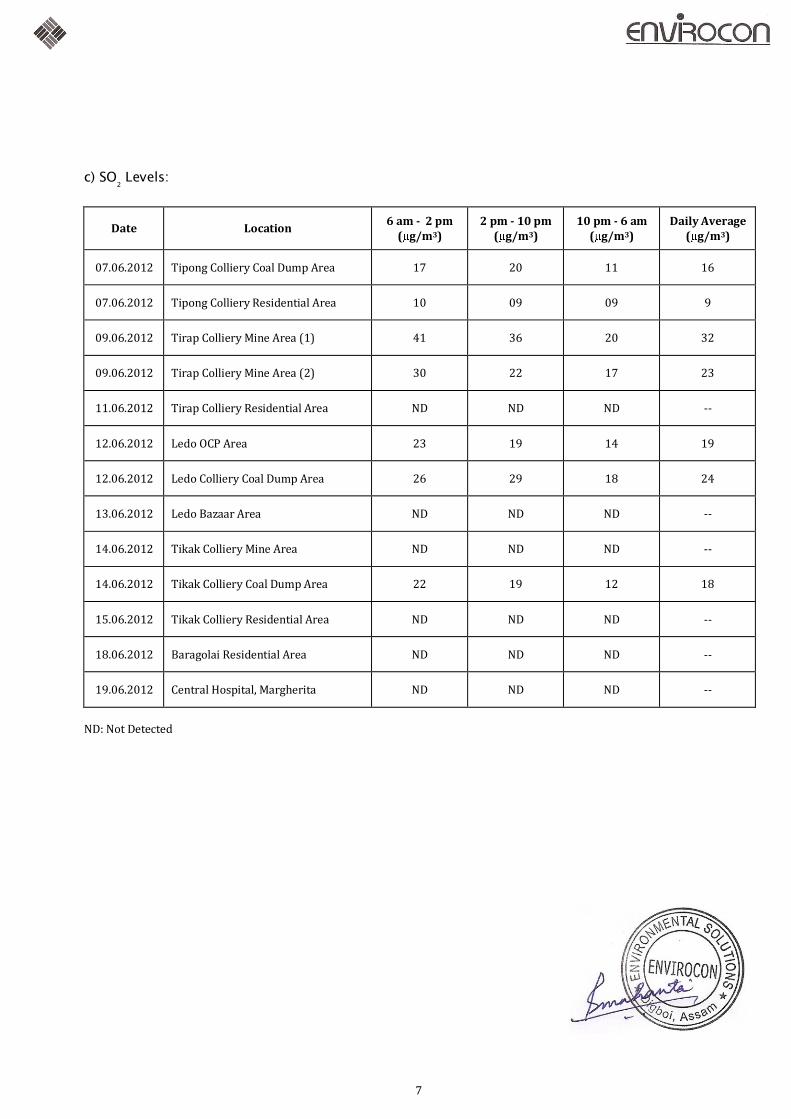
c) SO2
Levels:
Date Location 6 am - 2 pm
( g/m3) 2 pm - 10 pm
( g/m3) 10 pm - 6 am
( g/m3) Daily Average
( g/m3)
07.06.2012 Tipong Colliery Coal Dump Area 17 20 11 16
07.06.2012 Tipong Colliery Residential Area 10 09 09 9
09.06.2012 Tirap Colliery Mine Area (1) 41 36 20 32
09.06.2012 Tirap Colliery Mine Area (2) 30 22 17 23
11.06.2012 Tirap Colliery Residential Area ND ND ND --
12.06.2012 Ledo OCP Area 23 19 14 19
12.06.2012 Ledo Colliery Coal Dump Area 26 29 18 24
13.06.2012 Ledo Bazaar Area ND ND ND --
14.06.2012 Tikak Colliery Mine Area ND ND ND --
14.06.2012 Tikak Colliery Coal Dump Area 22 19 12 18
15.06.2012 Tikak Colliery Residential Area ND ND ND --
18.06.2012 Baragolai Residential Area ND ND ND --
19.06.2012 Central Hospital, Margherita ND ND ND --
ND: Not Detected
7
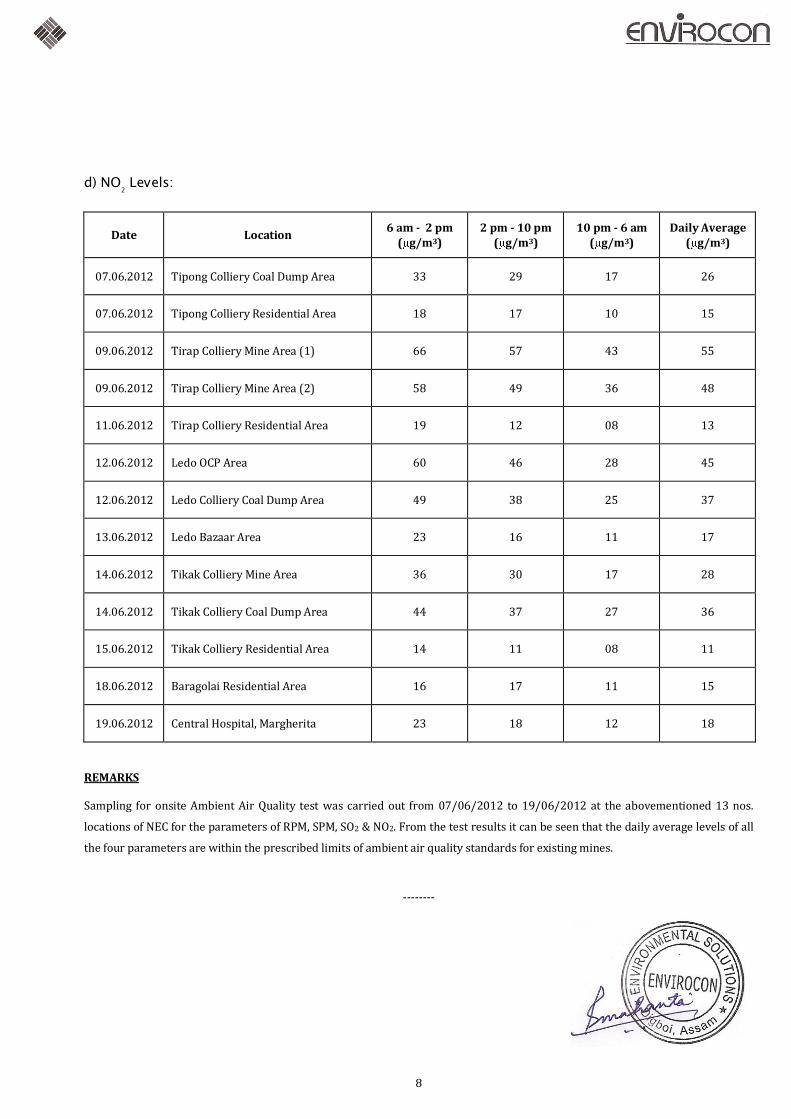
d) NO2
Levels:
Date Location 6 am - 2 pm
( g/m3) 2 pm - 10 pm
( g/m3) 10 pm - 6 am
( g/m3) Daily Average
( g/m3)
07.06.2012 Tipong Colliery Coal Dump Area 33 29 17 26
07.06.2012 Tipong Colliery Residential Area 18 17 10 15
09.06.2012 Tirap Colliery Mine Area (1) 66 57 43 55
09.06.2012 Tirap Colliery Mine Area (2) 58 49 36 48
11.06.2012 Tirap Colliery Residential Area 19 12 08 13
12.06.2012 Ledo OCP Area 60 46 28 45
12.06.2012 Ledo Colliery Coal Dump Area 49 38 25 37
13.06.2012 Ledo Bazaar Area 23 16 11 17
14.06.2012 Tikak Colliery Mine Area 36 30 17 28
14.06.2012 Tikak Colliery Coal Dump Area 44 37 27 36
15.06.2012 Tikak Colliery Residential Area 14 11 08 11
18.06.2012 Baragolai Residential Area 16 17 11 15
19.06.2012 Central Hospital, Margherita 23 18 12 18
REMARKS Sampling for onsite Ambient Air Quality test was carried out from 07/06/2012 to 19/06/2012 at the abovementioned 13 nos.
locations of NEC for the parameters of RPM, SPM, SO2 & NO2. From the test results it can be seen that the daily average levels of all
the four parameters are within the prescribed limits of ambient air quality standards for existing mines.
--------
8
WATER/ WASTE WATER ANALYSIS
(For the Period ‘April 2012 --- June 2012’, for the Summer Season)
a) Effluent/Waste Water Analysis Results
[18 (Eighteen) nos. of Effluent/ Waste Water Samples were collected in the period between 04/06/201 and 21/06/2012, and
analyzed for the following parameters].
Parameters & Units E 01 E 02 E 03 E 04 E 05 E 06
pH 7.9 6.4 6.6 6.7 3.1 6.5
COD (mg/L) 107 124 83 65 278 72
Suspended Solids. (mg/L) 138 75 122 63 179 81
Oil & Grease. (mg/L) 4.3 2.0 2.3 ND 2.7 1.0
Nitrate Nitrogen (mg/L) 7.9 2.8 4.9 1.0 2.1 0.9
ND: Not Detected E 01: Colony Effluent- MARGHERITA
E 02: Central Hospital effluent- MARGHERITA
E 03: Near temple by the side of NH - BARAGOLAI
E 04: Downstream of Namdang river- BARAGOLAI
E 05: Raw mine water- TIKAK
E 06: Treated water- TIKAK
9
Effluent Water Analysis Results (contd-1):
Parameters & Units E 07 E 08 E 09 E 10 E 11 E 12
pH 5.6 2.9 6.6 6.7 6.5 2.6
COD (mg/L) 118 209 91 104 146 283
Suspended Solids. (mg/L) 181 137 69 163 194 185
Oil & Grease. (mg/L) 4.3 2.4 1.4 2.9 3.0 3.2
Nitrate Nitrogen (mg/L) 4.8 3.1 2.4 4.3 4.5 3.5
E 07: Nallah water surrounding coal dump outlet of Samukjan Nallah – TIKAK
E 08: Raw mine water- LEDO OCP
E 09: Treated water – LEDO OCP
E 10: Upstream of Ledo Pani Nallah - LEDO
E 11: Downstream of Ledo Pani Nallah – LEDO
E 12: Raw mine water- TIRAP
10
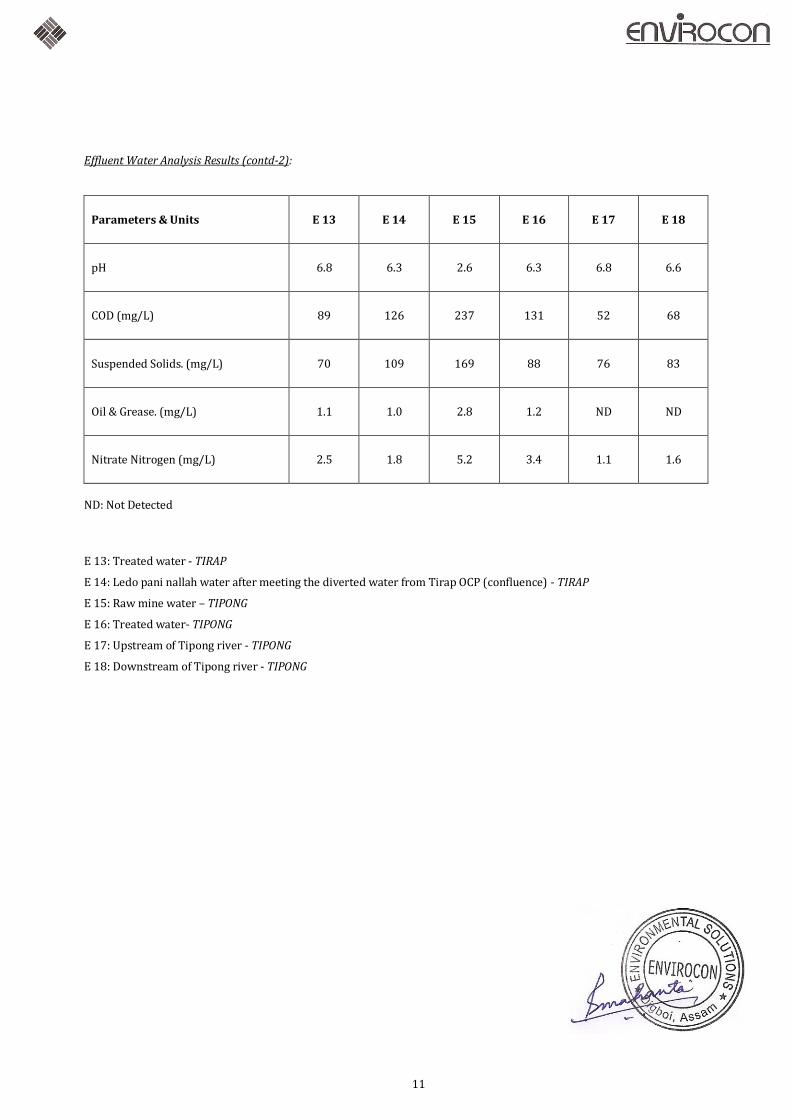
Effluent Water Analysis Results (contd-2):
Parameters & Units E 13 E 14 E 15 E 16 E 17 E 18
pH 6.8 6.3 2.6 6.3 6.8 6.6
COD (mg/L) 89 126 237 131 52 68
Suspended Solids. (mg/L) 70 109 169 88 76 83
Oil & Grease. (mg/L) 1.1 1.0 2.8 1.2 ND ND
Nitrate Nitrogen (mg/L) 2.5 1.8 5.2 3.4 1.1 1.6
ND: Not Detected E 13: Treated water - TIRAP
E 14: Ledo pani nallah water after meeting the diverted water from Tirap OCP (confluence) - TIRAP
E 15: Raw mine water – TIPONG
E 16: Treated water- TIPONG
E 17: Upstream of Tipong river - TIPONG
E 18: Downstream of Tipong river - TIPONG
11
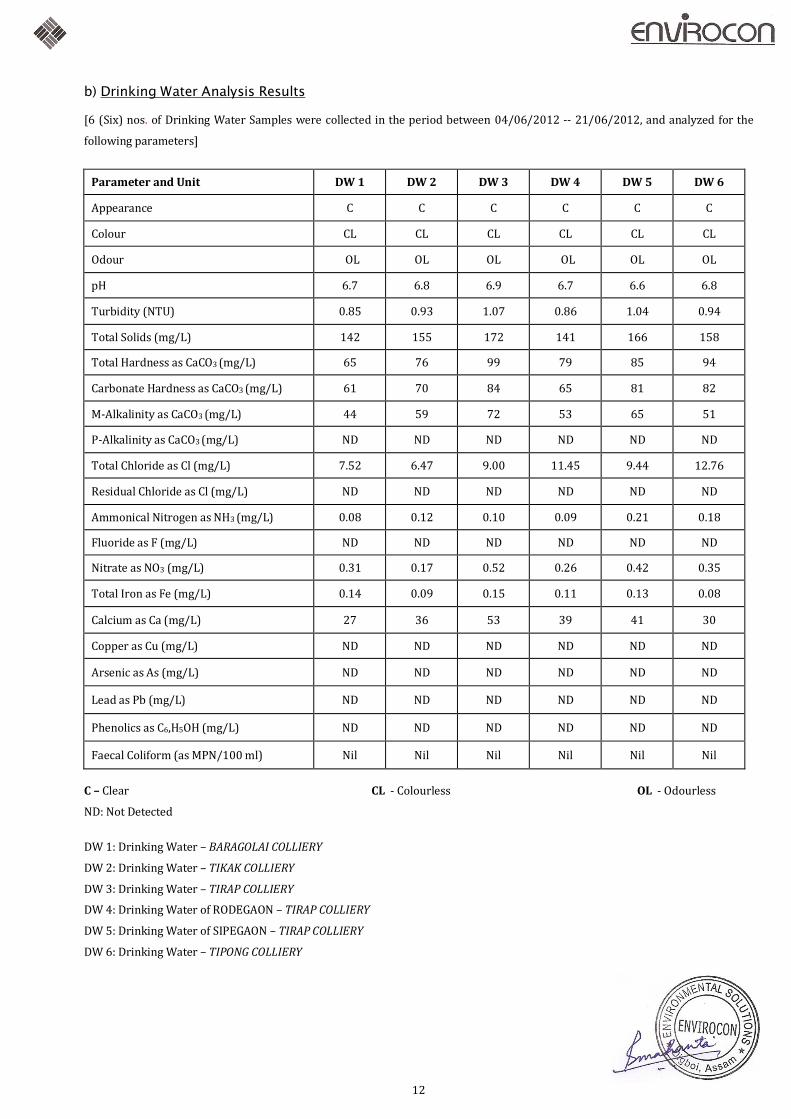
b) Drinking Water Analysis Results
[6 (Six) nos. of Drinking Water Samples were collected in the period between 04/06/2012 -- 21/06/2012, and analyzed for the