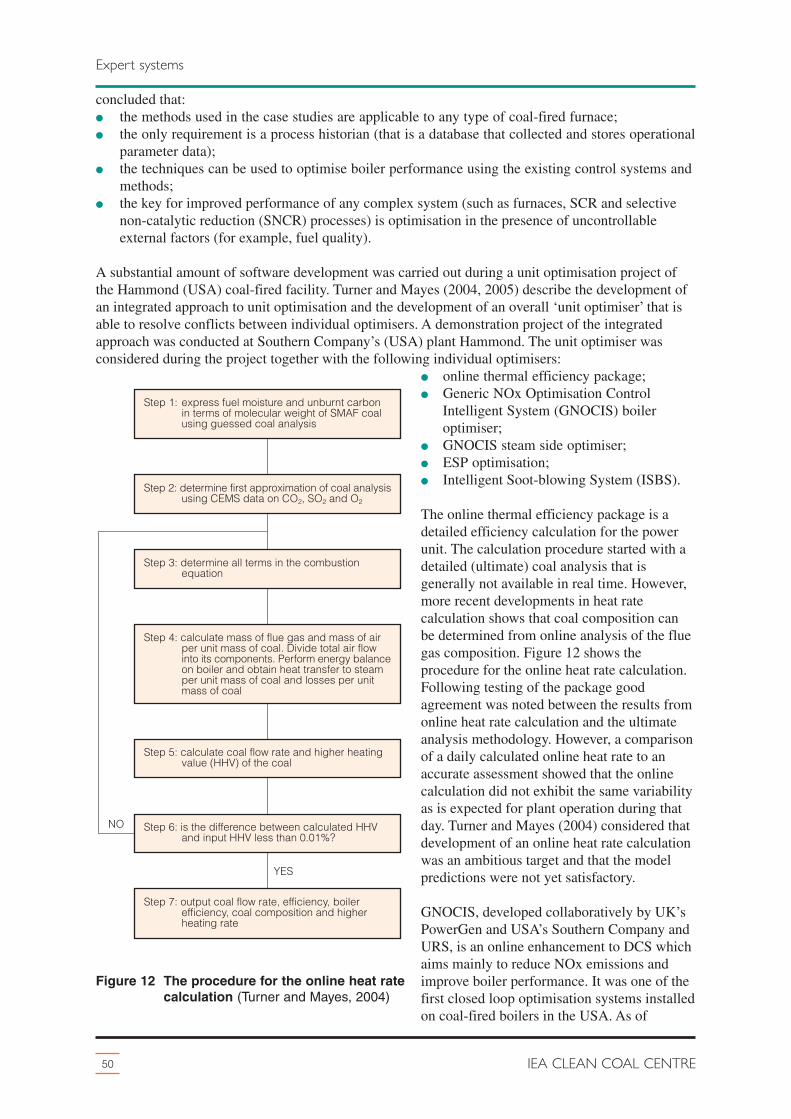
Coal quality, that is the properties of coal, has an impact on many parts of a power plant including thecoal handling facilities, pulverising mills, boiler, air heater, ESP, ash disposal as well as stackemissions. Coals have different characteristics and heat content. The behaviour of a coal in a boiler isstrongly influenced by its rank and by the mineral matter and other impurities associated with it. Coalproperties can affect the efficiency, reliability and availability of both the boiler and the emissionscontrol units. Therefore they affect the economics as well as the short- and long-term operation of theplant. Expert systems are used today in many aspects of power generation. The first step in theapplication of expert systems for coal quality assessment is to ensure that the sampling proceduresused are as accurate and precise as is possible. This then provides a representative sample for thesubsequent analysis. Online analysers can show variations in coal quality as they are occurring.However, online analysers can be expensive and their cost-effectiveness depends on the site andapplication. Despite questions about the accuracy of online analysers being raised, their use in coalmines as well as power plants continues to increase. The operation of coal-fired power plants involvesmultiple variables which have different levels of importance. A key contributor to an overall expertsystem is the method used to optimise the coal combustion in the boiler. This is affected by coalquality, boiler cleanliness and equipment deterioration as well as by the even distribution of thepulverised fuel to the burners. Expert systems for assessing coal quality and its implications for powergeneration have been and continue to be developed.
Acknowledgement
With thanks to Mr Gordon Couch for his contribution to this report
Acronyms and abbreviations
2 IEA CLEAN COAL CENTRE
AI artificial intelligenceAS Standards AustraliaASPE adaptive signal processing elementASTM American Society for Testing and MaterialsBSI British Standards InstitutionCCS carbon capture and storageCFD computational fluid dynamicsCPP coal preparation plantCQE™ Coal Quality ExpertCQIM Coal Quality Impact ModelDIN prefix used by German StandardsFGD flue gas desulphurisationFBC fluidised bed combustionGB prefix used by the Standardisation Administration of the People’s Republic of ChinaGCV gross calorific valueGNOCIS Generic NOx Optimisation Control Intelligent SystemGOST prefix used by Russian National StandardsGUI graphical user interfaceHHV higher heating value (the same as the GCV)IGCC integrated gasification combined cycleISIS Intelligent Soot-blowing SystemISO International Organisation for StandardisationLHV lower heating value (the same as the NCV)MIMO multiple input multiple outputNCV net calorific valuePCC pulverised coal combustionPCS predictive controller set-upPGNAA prompt gamma neutron activation analysisPRB Powder River Basin (in the USA)QOC quadratic optimal controllerrom run-of-mine (coal)SCR selective catalytic reductionSI standard internationalSISO single input single output
Contents
3Expert systems and coal quality in power generation
5Expert systems and coal quality in power generation
In 2011, approximately 40% of the world’s electricity will be generated from coal. Coal remains themost abundant fossil fuel and can therefore provide a reliable energy source for much of the nextcentury. For a variety of reasons including, particularly, security of supply, it is almost certainlynecessary in most countries to plan to generate power from several different sources, of which coalcan be a major contributor. Coal quality (that is the properties of coal) has an impact on many parts ofa power plant including the coal handling facilities, pulverising mills, boiler, air heater, ESP, ashdisposal as well as stack emissions. Figure 1 is a diagram of a typical pulverised coal combustionpower station. Table 1 is the stages that require monitoring in a coal-fired power generating plants (asshown in Figure1).
Coals have very different characteristics, and can have a heat content ranging widely, from 5 to30 MJ/kg. The variation in the amount and nature of the ash-forming materials in coal are discussed ina previous Clean Coal Centre report by Couch (2006). The internationally-traded coals generally haveheating values in the 22–30 MJ/kg range, and most have >26 MJ/kg. They also generally have lowerash contents than coals used inside the country of origin. The current major producers of hard coal areChina, USA, India, Australia, Indonesia, South Africa, Russia, Kazakhstan, Poland and Colombia.The top coal exporters are Australia, Indonesia, Russia, Colombia, South Africa, USA and Canadawhile the top coal importers are Japan, China, South Korea, India, Chinese Taipei, Germany and theUK (World Coal Association, 2010). The traded coals with the lowest gross calorific value (GCV)come from Indonesia and are mainly ranked as subbituminous, but with low ash and sulphur contents,which is advantageous to some buyers/consumers (Trecazzi and others, 2007). Schiffer (2006)discusses the role of international coal trade in power generation.
The behaviour of a coal in a boiler is strongly influenced by the mineral matter and other impuritiesassociated with it, both in terms of how much ash-forming material is there, and its composition.Analysis and significance of mineral matter in coal seams is discussed in detail by Ward (2002). Inparticular, the mineral matter can form slagging deposits in the hotter parts of the boiler and foulingdeposits as the flue gas passes through the heat exchangers and are progressively cooled. Various coalproperties can affect the efficient and consistent operation of both the boiler and the emissions controlunits which clean the flue gases before discharge. They therefore affect both the short- and long-termoperability of the plant, and the economics of the operation. The major contributor to differences incoal properties is the presence of the mineral matter and other impurities, alongside the reactivity ofthe coal which is broadly associated with its rank.
Over the last few decades, many steps have been taken to reduce the emissions associated with coal-fired power generation with substantial reductions in those of particulate matter, SO2 and NOx. Thetechnologies for reducing and virtually eliminating these emissions are well developed, and are beingmore widely deployed as required by the appropriate regulatory authorities. For detailed informationon these technologies (see Nalbandian, 2009, 2004; Nalbandian Soud, 2000). This inevitably meansthat the cost of the electricity generated rises and that coal-fired power plants become more complex.Their operation becomes subject to many parallel constraints, which are related to:� the quality and consistency of the coal being used;� the behaviour of the boiler and turbine in generating power, the gas volumes involved, its
temperature, and the deposition of ash on heat transfer surfaces;� the performance of the flue gas clean-up units and their interactions;� the load-following characteristics of all the components.
An ‘expert system’ is a computer program or, more commonly, a suite of programs, that simulates thejudgement and behaviour of a human (or an organisation) which has technical knowledge and a greatdeal of accumulated experience. The human manager typically looks at the information and evidence
available, and uses both technical knowledge and past experience to judge the optimum operatingconditions for a plant at a particular time.
An expert system seeks to codify, prioritise and apply such knowledge automatically, using acomputer program. It generally contains a knowledge base which formalises the accumulatedexperience, together with a set of rules for applying these as new conditions arise. It deals with thecomplex algorithms which are required to set the necessary conditions for safe and economicoperation. Such systems can be applied to specific parts of an operating plant, and may also be used todetermine overall operating characteristics in such a way as to optimise long-term plant performance.A critical input variable for coal-fired plant will always be the quantity and quality of the coal beingfed to the boiler.
Human and organisational expertise consists of knowledge about a complex system, an understandingof the problems that arise during its operation, and skill at solving some of the problems whichpresent themselves. Knowledge consists of:� that which includes the published information, facts, and the theories and equations which are
contained in textbooks and references. It includes knowledge which is taught at college and oncourses;
� that which consists largely of ‘rules of thumb’ or heuristics, based on a combination oftheoretical knowledge and of past experience. It is essentially derived and private knowledgewhich does not normally find its way into the published literature or into teaching material.Heuristics enable the human expert:
– to make educated guesses when necessary; – to recognise promising approaches to problem solving and optimisation;
– to deal effectively with erroneous or incomplete data.
The understanding and reproduction of such ‘rules of thumb’ are the central challenge in thedevelopment of expert systems. The ‘rules of thumb’ used are not necessarily universal, and will mostlikely have been developed by particular utilities using a relatively narrow range of coals produced intheir region.
The operation of coal-fired power plants involves multiple variables which have different levels ofimportance. Thus different expert systems need development and validation in different locations, also
6 IEA CLEAN COAL CENTRE
Introduction
powerdistribution
transmissionsubstation
stackrail carunloading
stockpiles
reclaimconveyor
coal storageconveyor
mill silo feedconveyor
millsilo
pulveriser
boilerpipes
secondary blower
primary blower
1
ash removal
4 6 7
FGD
9
ESP/FF
1052 3
16
generator
1517
controlroom
11
coolingtower
1412
steamturbine
13
cooling tank
boiler
8
Figure 1 A typical layout of a pulverised coal fired power plant (Thermo Electron Corp, 2005)
7Expert systems and coal quality in power generation
Introduction
Table 1 The stages that require monitoring in a coal-fired power generating plant (asshown in Figure 1)
Applications for stages 1–6 include:– weighfeeders– on-line coal analysers– coal blending software– conveyor belt monitoring and protection controls– tramp metal detection– continuous point and level measurement– tripper car position measurement
7 Pulveriser (coal mill) and primary blower– preheat air to pulverisers– bearing temperature monitoring– coal flow distribution measurement and control
8 Boiler (coal-fired furnace)– SCR system catalyst temperature monitoring– bottom ash removal– lime and fly ash slurry density and flow monitoring– fly ash hopper level monitoring– opacity monitors– heat exchanger and boiler tube alloy verification– primary and secondary combustion air monitoring– water analysis monitors (sodium, silica, pH, conductivity, dissolved Oxygen, Oxygen scavenger)– plug chute detection– sampling probes– gaseous pollutant monitors (CO, CO2, NOx, SO2)– stack gas flow monitors– integrated continuous emission monitoring systems (CEMs)
9 Flue gas desulphurisation (FGD) scrubber– percent solids and slurry monitoring
10 Particulate matter control (ESP or fabric filter)– bottom ash slurry measurement– fly ash level measurement– carbon in fly ash gauges
11 Control room– data acquisition, monitoring and management
12 Boiler pipes– cooling water and condensate flow measurement
13 Steam turbine– data acquisition and monitoring of turbine parameters
14 Cooling tank, cooling tower, reservoir– density measurement– influent and discharge flow measurement– water analysis monitors (pH, conductivity, chloride)
15 Generator– data acquisition, monitoring and management
16 Transmission substations– power quality monitoring and analysis
17 Power distribution– data acquisition, monitoring and management– power quality monitoring and analysis
taking into account the many possible variations in plant design.
This review includes a discussion of the different patterns of coal supply in Chapter 2, and of coalsampling and analysis in Chapter 3. In Chapter 3 the discussion is of the main aspects of coal analysisboth in the laboratory and online. There are significant limitations on what can be established and onthe interpretation and use of the data obtained. Section 3.2.2 looks at the use of coal analysis as a basisfor putting data into expert systems which can be used as management tools for:� running coal preparation plants (CPPs);� managing coal blending;� assessing the comparative economics of using different coals in a particular boiler based on: – plant efficiency effects; – sub-system capacities and auxiliary power requirements; – steam attemperation requirements; – propensity for slagging and fouling; – maintenance and waste disposal costs; – possible replacement power costs resulting from changes in unit availability and capacity;� controlling the soot-blowing cycles in a boiler. In pulverised coal combustion, the fuel can collect
on the tube banks in the boiler. These tube banks are cleaned by high-pressure jets of steam in anoperation called soot-blowing;
� monitoring the coal feed into a coal-fired boiler and optimising the boiler operating conditionsaccordingly. A given power plant tends to use a restricted range of coals. The operators learn howto run the boilers satisfactorily whilst coping with the changes in coal properties within the range.
Various aspects of the use of these systems are discussed in Chapters 4 and 5. This includes both theshort-term effects, such as meeting the requirements for peak demand, and the overall long-termeconomics which are affected by plant reliability, availability and maintenance costs, as well as fuelcosts.
Expert systems for assessing coal quality and its implications for power generation need to fit into thebroader context of the management of large companies using a variety of energy sources who areseeking to maximise profit across the business value chain, within the prevailing legislative andregulatory framework. The long-term economics of power production from the different sources affectthe choices made alongside considerations of energy security. These broader systems fall outside thescope of this report and it should be noted that relatively little information about them has beenpublished.
8 IEA CLEAN COAL CENTRE
Introduction
2 Coal variability in power generation
9Expert systems and coal quality in power generation
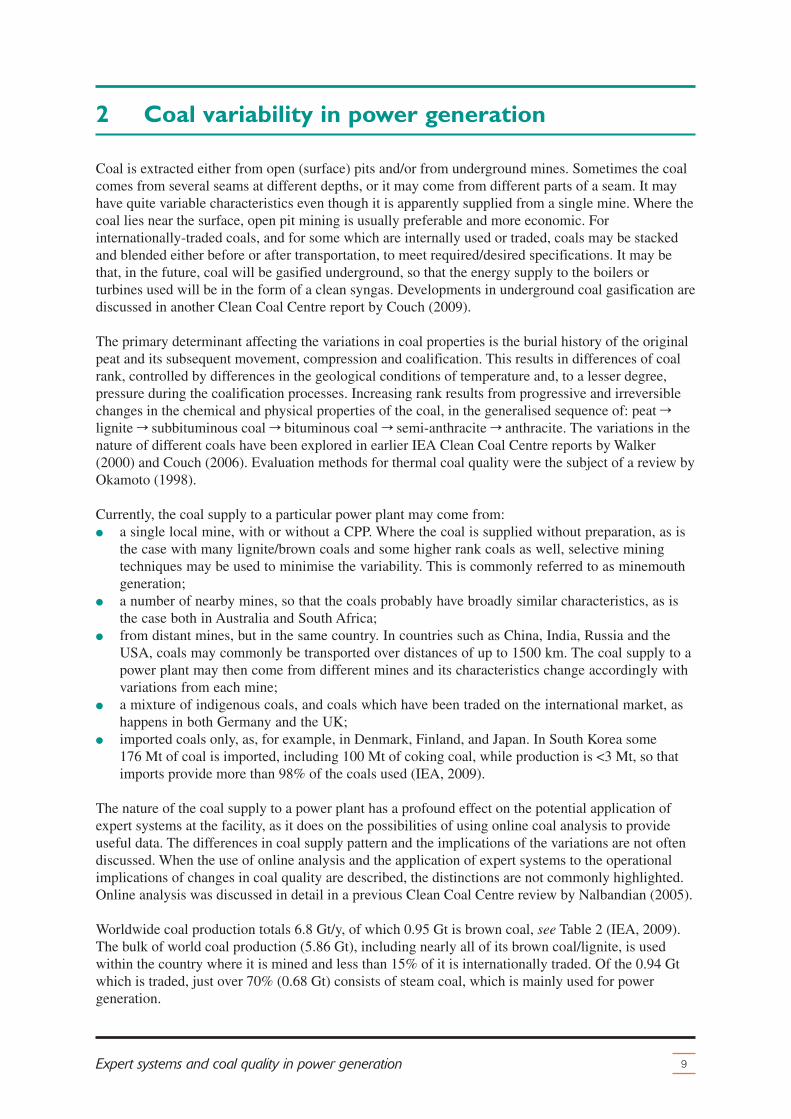
Coal is extracted either from open (surface) pits and/or from underground mines. Sometimes the coalcomes from several seams at different depths, or it may come from different parts of a seam. It mayhave quite variable characteristics even though it is apparently supplied from a single mine. Where thecoal lies near the surface, open pit mining is usually preferable and more economic. Forinternationally-traded coals, and for some which are internally used or traded, coals may be stackedand blended either before or after transportation, to meet required/desired specifications. It may bethat, in the future, coal will be gasified underground, so that the energy supply to the boilers orturbines used will be in the form of a clean syngas. Developments in underground coal gasification arediscussed in another Clean Coal Centre report by Couch (2009).
The primary determinant affecting the variations in coal properties is the burial history of the originalpeat and its subsequent movement, compression and coalification. This results in differences of coalrank, controlled by differences in the geological conditions of temperature and, to a lesser degree,pressure during the coalification processes. Increasing rank results from progressive and irreversiblechanges in the chemical and physical properties of the coal, in the generalised sequence of: peat rlignite r subbituminous coal r bituminous coal r semi-anthracite r anthracite. The variations in thenature of different coals have been explored in earlier IEA Clean Coal Centre reports by Walker(2000) and Couch (2006). Evaluation methods for thermal coal quality were the subject of a review byOkamoto (1998).
Currently, the coal supply to a particular power plant may come from:� a single local mine, with or without a CPP. Where the coal is supplied without preparation, as is
the case with many lignite/brown coals and some higher rank coals as well, selective miningtechniques may be used to minimise the variability. This is commonly referred to as minemouthgeneration;
� a number of nearby mines, so that the coals probably have broadly similar characteristics, as isthe case both in Australia and South Africa;
� from distant mines, but in the same country. In countries such as China, India, Russia and theUSA, coals may commonly be transported over distances of up to 1500 km. The coal supply to apower plant may then come from different mines and its characteristics change accordingly withvariations from each mine;
� a mixture of indigenous coals, and coals which have been traded on the international market, ashappens in both Germany and the UK;
� imported coals only, as, for example, in Denmark, Finland, and Japan. In South Korea some176 Mt of coal is imported, including 100 Mt of coking coal, while production is <3 Mt, so thatimports provide more than 98% of the coals used (IEA, 2009).
The nature of the coal supply to a power plant has a profound effect on the potential application ofexpert systems at the facility, as it does on the possibilities of using online coal analysis to provideuseful data. The differences in coal supply pattern and the implications of the variations are not oftendiscussed. When the use of online analysis and the application of expert systems to the operationalimplications of changes in coal quality are described, the distinctions are not commonly highlighted.Online analysis was discussed in detail in a previous Clean Coal Centre review by Nalbandian (2005).
Worldwide coal production totals 6.8 Gt/y, of which 0.95 Gt is brown coal, see Table 2 (IEA, 2009).The bulk of world coal production (5.86 Gt), including nearly all of its brown coal/lignite, is usedwithin the country where it is mined and less than 15% of it is internationally traded. Of the 0.94 Gtwhich is traded, just over 70% (0.68 Gt) consists of steam coal, which is mainly used for powergeneration.
This has implications for the nature and variability of the coals used at power plants, and a number ofdifferent patterns have emerged, for example:� lower grade coals (with heat contents <16 MJ/kg) including most lignites/brown coals, and/or
coals with a high ash content, are used at or near the minemouth. This is because transport costsare disproportionately increased by the amount of inert, noncombustible, material present in theform of mineral matter and/or water. These coals are commonly quite variable in theircharacteristics;
� the high ash coals which arise in coal exporting countries such as Australia and South Africa,where the higher grade, lower ash content, coal is sold internationally while the middlingproducts from the CPP, containing maybe 25-40% ash, are used at nearby power stations;
� in the USA the use of western Powder River Basin (PRB) subbituminous coals has grownsubstantially from 264 t/y in 1998 to 402 t/y in 2008 (US BLM, 2009). This increase has beenlargely because the PRB coals have a low sulphur content, and blending these with highersulphur eastern US coals has enabled utilities to reduce/control SO2 emissions without the needto invest in flue gas desulphurisation (FGD) units on older plants. The blending of coals withconsiderable different characteristics has, however, presented significant challenges;
� in China, either the coal has to be transported long distances by rail or the power generated atminemouth power plants has to be transferred over similar distances. As a result of theconcentration of coal producers and consumers in places like Hong Kong and Shanghai andalong that coastline, coal has been imported to these areas in recent years;
� in Russia there are substantial transfers of coal westwards from the central Kuznetsk basincoalfield over long distances (Crocker and Kovalchuk, 2008). These supply the Moscow area andother parts of western and European Russia, so many power plants there deal with a mixture oflocal and more distant coals, and some fire a mixture of coal and natural gas;
� in India, coal is transported long distances, since the main centres needing power are a long wayfrom the mines. Indian coals are generally of low grade due to their high and variable ash content.To encourage the use of coal washing, the government introduced a regulation to the effect thatany coal transported more than 1000 km must have its ash content reduced to <32±2%. There arereports of significant coal supply shortages in various parts of the country (LCN, 2009). As aconsequence, a number of power plant managers may accept any coal they can acquire withoutemphasis on quality.
Characterisation in production of thermal coal was discussed by Osborne and Hall (1997). In order toachieve strong partnerships with end users, the authors state that all aspects of the coal need to beunderstood including: handling and storage characteristics, pulverising behaviour, combustionbehaviour, mineral matter and ash chemistry interactions, in addition to the characteristics of the coaland its ash in terms of environmental factors such as dust, self heating and emissions components. Inorder to ensure that quality is controlled, the coal chain must be regularly sampled and adjusted inaccordance with the analytical results. Key control parameters are thus selected, which whenmonitored, provide a reliable indication of quality ‘flow’ in terms of both specification and
10 IEA CLEAN COAL CENTRE
Coal variability in power generation
Table 2 Coal production and traded coal totals in 2008, Gt (IEA, 2009)
worldwide coalproduction
hard/bituminous brown coal coking coal
6.8 5.85 0.95Included in the hard coalfigure
internationally-tradedcoal
0.940.51 plus 0.17 ofIndonesiansubbituminous
0 0.26
consistency requirements. Examples of commonly adopted approaches to controlling key specifiedparameters in the coal chain are shown in Figure 2. Schuster and Penterson (2002) discusscharacteristic coal parameters and extensive operating experience with various coals in power plantsin the USA and Europe.
Zehner (2002) presented an abstract of the guideline for the ‘characterisation of power plants coals’ inGermany. The guideline does not provide, as such, recommendations for the most efficient use ofcoals procured on the international market, because the properties of the coals differ greatly, as well asthe design of the power plants. However, the guideline is intended to provide information with regardto which coal properties should be given special attention, which measures can be taken againstnegative effects, and which tools (that is, software as well as hardware) are available for thesystematic and cost-effective operation of a plant. The guideline is directed at the technical staff of acoal-fired power plant as well as coal buyers. It is also expected to serve as an educational tool fornew staff at the power plant.
Many power generators have choices to make about their coal source and whether to cofire biomass orpetcoke. These choices depend on an economic evaluation of the effects of different coal propertiesand characteristics on plant operating costs. This applies to most power plants which useimported/traded coals including ‘coal-rich’ countries such as the USA and China. These generatorscan benefit from the application of an expert system based on the principles lying behind coal qualitysuch as the Coal Quality Impact Model (CQIM) discussed in Section 5.1.
2.1 Coal quality impact on power plant operation
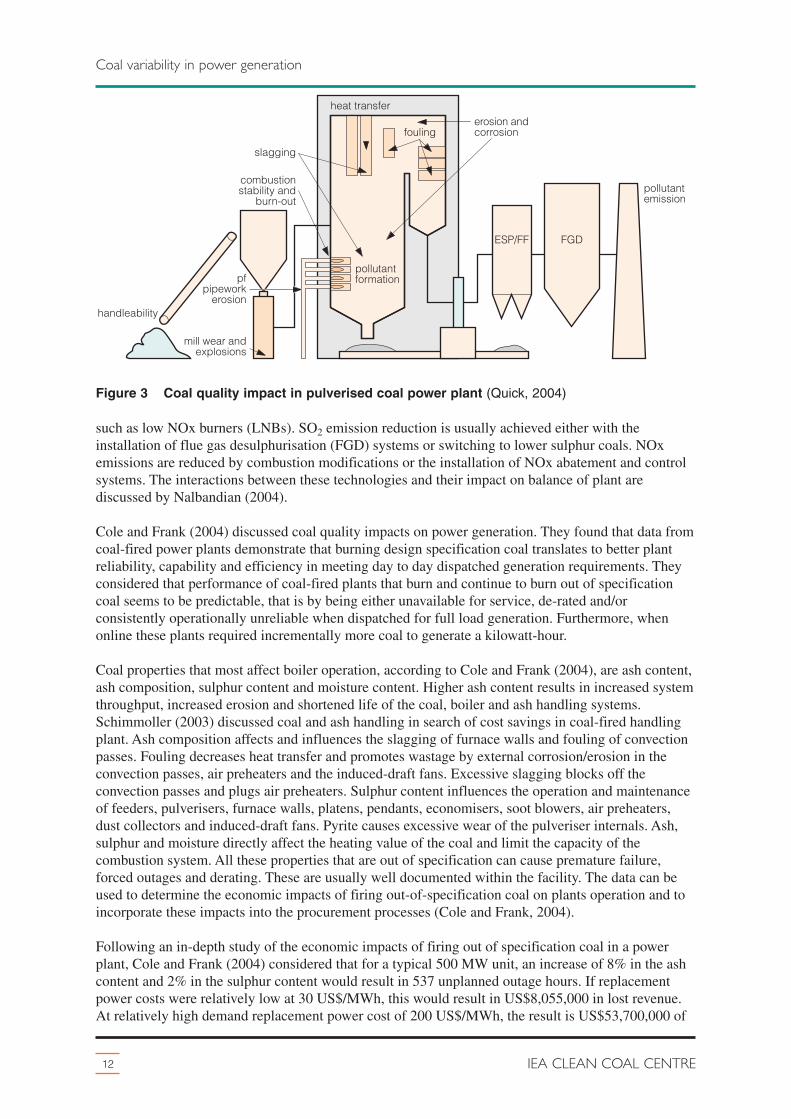
Quick (2004) considers that of all the coal quality impacts the most important is pollutant emissions.Other coal quality impacts on boiler involve corrosion, deposition, combustion stability, burnout andunburnt carbon in ash (see Figure 3). Ash deposition and slagging can cause problems with somecoals (such as Powder River Basin (PRB) coals). Unburnt carbon in ash can be impacted by millperformance and grind quality, fuel/air distribution and fitting of combustion modification systems
11Expert systems and coal quality in power generation
Figure 2 Examples of commonly adopted approaches to controlling key specifiedparameters in the coal chain (Osborne and Hall, 1997)
12 IEA CLEAN COAL CENTRE
Coal variability in power generation
such as low NOx burners (LNBs). SO2 emission reduction is usually achieved either with theinstallation of flue gas desulphurisation (FGD) systems or switching to lower sulphur coals. NOxemissions are reduced by combustion modifications or the installation of NOx abatement and controlsystems. The interactions between these technologies and their impact on balance of plant arediscussed by Nalbandian (2004).
Cole and Frank (2004) discussed coal quality impacts on power generation. They found that data fromcoal-fired power plants demonstrate that burning design specification coal translates to better plantreliability, capability and efficiency in meeting day to day dispatched generation requirements. Theyconsidered that performance of coal-fired plants that burn and continue to burn out of specificationcoal seems to be predictable, that is by being either unavailable for service, de-rated and/orconsistently operationally unreliable when dispatched for full load generation. Furthermore, whenonline these plants required incrementally more coal to generate a kilowatt-hour.
Coal properties that most affect boiler operation, according to Cole and Frank (2004), are ash content,ash composition, sulphur content and moisture content. Higher ash content results in increased systemthroughput, increased erosion and shortened life of the coal, boiler and ash handling systems.Schimmoller (2003) discussed coal and ash handling in search of cost savings in coal-fired handlingplant. Ash composition affects and influences the slagging of furnace walls and fouling of convectionpasses. Fouling decreases heat transfer and promotes wastage by external corrosion/erosion in theconvection passes, air preheaters and the induced-draft fans. Excessive slagging blocks off theconvection passes and plugs air preheaters. Sulphur content influences the operation and maintenanceof feeders, pulverisers, furnace walls, platens, pendants, economisers, soot blowers, air preheaters,dust collectors and induced-draft fans. Pyrite causes excessive wear of the pulveriser internals. Ash,sulphur and moisture directly affect the heating value of the coal and limit the capacity of thecombustion system. All these properties that are out of specification can cause premature failure,forced outages and derating. These are usually well documented within the facility. The data can beused to determine the economic impacts of firing out-of-specification coal on plants operation and toincorporate these impacts into the procurement processes (Cole and Frank, 2004).
Following an in-depth study of the economic impacts of firing out of specification coal in a powerplant, Cole and Frank (2004) considered that for a typical 500 MW unit, an increase of 8% in the ashcontent and 2% in the sulphur content would result in 537 unplanned outage hours. If replacementpower costs were relatively low at 30 US$/MWh, this would result in US$8,055,000 in lost revenue.At relatively high demand replacement power cost of 200 US$/MWh, the result is US$53,700,000 of
handleability
pollutantemission
erosion andcorrosion
pollutantformation
pollutantformation
heat transfer
fouling
FGDESP/FF
slagging
combustionstability and
burn-out
mill wear andexplosions
pfpipework
erosion
Figure 3 Coal quality impact in pulverised coal power plant (Quick, 2004)
unrealised revenue. Cole and Frank (2004) state that the total fuel costs for such a unit for one year(assuming a 75% capacity factor, 10 MJ/kWh heat rate and 11 US$/MJ fuel cost) are US$39,000,000.These figures are put into perspective as follows (Frank and Cole, 2004):Total yearly fuel bill US$ 39,000,000Low demand replacement power costs US$30/MWhLost revenue or equivalent fuel penalty US$8,055,000Percentage fuel penalty = 8,055,000/39,000,000 or 20.6%High demand replacement power costs US$200/MWhLost revenue or equivalent fuel penalty US$53,700,000Percentage fuel penalty = 53,700,000/39,000,000 or 137.7%
In reality, the authors consider that the actual lost revenue falls between the two values. However, thisdoes not include the reduced boiler efficiency or increased maintenance costs caused by firing out-of-specification quality coal. Cole and Frank (2004) present coal beneficiation as a process to be utilisedto produce specification coal for use in power stations to reduce the coal quality impact on powergeneration.
The parameters and plant operating conditions which may be affected by changes in coal quality andits composition include:� handleability and flow characteristics in silos, stockpiles and conveyor belts. This in turn
depends on: – surface moisture, and the range of ambient temperature conditions; – size distribution, and in particular the proportion of fine material; – the nature of the mineral matter present which can affect particle ‘stickiness’. Increased
stickiness is often associated with the presence of clays;� its behaviour during coal preparation in different plant sections;� the conditions in the pulveriser, which are affected by: – the coal hardness (which can be measured on an empirical and comparative basis) which is
affected by the presence of hard minerals like quartz and pyrite; – the moisture content, as the mill inlet temperature needs to increase with higher moisture
content coals, to ensure that the desired outlet temperature of around 70ºC is maintained; – the amount of coal required, which is affected by its heat value (or its specific energy);� combustion and ash deposition characteristics when used in a pulverised coal combustion
(PCC) boiler or in a gasifier on an integrated gasification combined cycle (IGCC) unit;� the emissions from any combustion or gasification plant, which will be controlled to an extent
by downstream flue gas cleaning units (for example to reduce NOx, SO2 and particulateemissions);
� economic factors affecting the overall profitability of unit operation, such as its availability,capacity and maintenance costs.
Expert systems can be used to assess coal quality and to understand and manage the effects of itsvariations. These include computer programs which can be used to assess the practical impact ofchanges in coal composition. The input to these programs can be based on empirical results and/or onmodelling various aspects of the process. The challenge is always to validate the outcomes. These arediscussed in Chapter 5.
2.2 Coal characteristics and plant design
A range of properties/characteristics of coals that determine boiler design and are currently used indifferent parts of the world for power generation can be expressed as follows:� a lower heating value (LHV) or net calorific value (NCV) from 5 MJ/kg to 30 MJ/kg. NCV or
LHV is the useful calorific value in boiler plant. Gross calorific value (GCV) or higher heatingvalue (HHV) is the calorific value under laboratory conditions. The difference is essentially the
13Expert systems and coal quality in power generation
Coal variability in power generation
latent heat of the water vapour produced;� ash content can vary from 1% to 50% or even higher. Many standards do not define material with
>50% ash as being ‘coal’. The ash is formed from the mineral matter present, and, in lower rankcoals, from organically bound impurities;
� moisture content can vary from 5% to 65%;� the sulphur content of in situ coals can range from virtually nothing to as much as 10%, though
in the coals used in power generation it is generally 0.5–2.5%;� the age of a given deposit can be from 350 million years to as little as 2 million years, and the
temperatures and pressures experienced depend on many factors, meaning that the degree ofcoalification is highly variable.
A power plant boiler is designed to burn a ‘specification’ coal, which is commonly defined as the coalfrom a nearby mine or the coal most likely to be purchased from further afield. The vast majority ofcoal-fired boilers use pulverised coal combustion (PCC), although it is possible that as more plants arerequired to capture and store the CO2 formed, integrated gasification combined cycle (IGCC) unitswill also be built. As there are only a small number of these plants at the moment, this study focuseson pulverised coal combustion units.
A generic flowsheet for a typical modern pulverised-coal power generating unit is shown in Figure 1.The various stages, can include:� mine and CPP, together with handling, storage and transport and blending (where applicable);� pulverisers;� boiler and heat exchangers (and steam to the turbine and condenser);� low NOx burners with air staging;� air and water preheaters for thermal efficiency;� ash handling, with an electrostatic precipitator (ESP) or fabric filter. Note that carbon-in-ash
levels are of significance;� units for the reduction/removal of NOx, using selective catalytic reduction (SCR), SO2, using
flue gas desulphurisation (FGD) and particulate matter (using ESPs or fabric filters);� CO2 capture (in the future).
In pulverised coal combustion, the coal ismilled to a fine size and conveyedpneumatically to the burners in such a waythat the feed is evenly distributed around thecombustion chamber. On entering the furnacethe coal particles heat rapidly and the volatilematter is distilled off, leaving minute sponge-like particles of carbon and mineral matter.The volatile gases mix with the oxygen in theair and burn quickly. Oxygen also reacts withthe carbon, releasing heat. With the correctamount of excess air, and of turbulent mixing,virtually complete combustion can be achievedin less than ten seconds (see Figure 4).
The boiler design and flue gas cleaning unitsare optimised to obtain best performance fromthe specification coal while meetingenvironmental requirements. This determinesthe heat transfer areas provided in differentparts of the boiler. Once these parameters aredetermined, the boiler operates mostefficiently with coals which have properties
14 IEA CLEAN COAL CENTRE
Coal variability in power generation
500
10 20
Time, s
Tem
per
atur
e, °
C
1000
1500
The top curve represents finerparticles of 0.1 µm and thebottom curve larger particles of100 µm size.
particles deposited on a surface
in the combustion and heat exchangesections for suspended particles
near to those of the specification coal. In practice, PCC boilers have proved to be remarkably tolerantof some variations in coal quality, and cope well with coals from different sources. However somechanges in coal characteristics can have serious deleterious effects on both short-term and long-termboiler performance and may affect aspects of the performance of the flue gas cleaning equipment.
The design also determines:� the coal pulverisers;� both forced draught and induced draught fan sizes;� burner design and location;� the heat transfer areas and detailed geometry of the steam superheater, reheater and economiser
sections;� the water pump size;� the turbine used and its steam condenser.
The boiler design is markedly different for burning lignite, for example using flue gas recirculation todry the incoming coal. Boilers firing anthracites commonly use the down-shot burner arrangement toachieve the longer residence times and ensure carbon burn-out. The boiler’s physical size and capacitylimit flexibility in operation. Therefore, once the major components in a PCC unit have been sized anddesigned in detail, the implications of changes in coal properties can be considered. Similarconsiderations will apply in principle to IGCC plants if they are more widely deployed. Since thereare currently only a few such units, these are not discussed in this study. More are likely to be built asthe need for CCS at power plants becomes more pressing. The various flue gas cleaning units aredesigned so as to meet the requirements for limiting emissions of SO2, NOx and particulate matter.
For some highly variable coals, possibly to provide flexibility for mixing with other solid fuels,fluidised bed combustion (FBC) may provide the most satisfactory design solution. As FBC representsless than 2% of the worlds total coal-fired capacity, it is also not specifically considered in this study,although many of the principles used in expert systems would be equally applicable.
Most major plant components are required to operate continuously for periods of more than a year, tofacilitate an annual planned maintenance schedule. In some units, attempts have been made to movetowards a two-yearly maintenance. Hence unplanned damage to parts of the plant, which necessitatesa shut-down (that is, a forced outage), is to be avoided. The use of expert systems to assess coalquality which may affect corrosion and erosion in parts of the plant can help to avoid, minimise orcontrol such damage.
Most power plant descriptions only look at the efficiency of operation and of coal and componentbehaviour when operating under full load under steady-state conditions. In practice, and increasingly,many coal-fired units are load following and possibly even two shifting, in order to meet the demandsof the market. When two shifting, the unit is normally kept on stand-by over night, when the powerdemand is at a minimum. These varying patterns of plant operation impose their own strains on plantcomponents, associated with thermal cycling. In addition, the coal composition will have differentimpacts with changing conditions in the boiler and flue gas cleaning units. For example, coals with ahigh ash content are more likely to encounter problems with erosion in various parts of the plant thanthose with less ash.
Most coal-fired power plant units running in competitive markets operate for a considerable amount oftime as load followers. This means that conditions in the boiler are changing with different impactsrelating to coal quality due to slagging and fouling deposits, and of soot-blowing. In addition, the flyash size and resistivity may vary, affecting the performance of the ESPs or fabric filters. Ultimatelythe fundamental objectives include boiler/power supply reliability and availability, together withprofitable operation under changing market circumstances. Slagging and fouling in coal-fired boilersis discussed in detail by Barnes (2009).
15Expert systems and coal quality in power generation
Coal variability in power generation
According to Lenk and Voigtländer (2002) and Drenckhahn and Riedle (2005), when many of theexisting coal-fired power plants were built, the stability of the power generation market was such thatthe operational goals were readily and accurately predictable. The liberalisation of the power marketin many places and short-term fluctuations in the price of fuels have led to the need for moreflexibility. As a result, there is a much greater need for well-validated expert systems to optimise plantoperation. The needs will vary from plant to plant and country to country, in terms of:� fuel supply and cost;� the pattern of demand for power;� local legislative and regulatory requirements, including the costs associated with CO2 emissions.
The variations in a coal from one deposit may be sufficient to affect the behaviour of the coal in aboiler. As an example, there are four 500 MWe units at Loy Yang, Victoria, Australia using locallymined brown coal/lignite from a deposit near the surface, mined by open pit methods. These had beenoperating well for several years with regular planned annual shut-downs. Even though the ash contentof the lignite is very low, at just 1–3%, it was the composition of the ash that proved to beproblematic. When mining through a patch of brown coal which was high in sodium, the units couldonly run for some 800 hours (just over a month) before they had to be shut down and the foulingdeposits removed (Couch, 2004).
In all cases a boiler unit is designed to operate in the optimum way when using its ‘design coal’, andboiler manufacturers usually define their guaranteed performance figures in terms of this coal. Coal-fired boilers can in practice use a range of coals, and often the decision to purchase from a specificsource is finely balanced, based on the delivered price for the coal and the implications for the runningcosts of the plant when using it.
The provision of stacker/reclaimer units where coal is stocked will facilitate blending which can beused to even out some of the variations in coal properties and characteristics. The variability from anindividual mine will be strongly affected by both the mining method used and on whether or not thereis a CPP.
2.3 Market influences
As an example of the changes that can take place in the market, Anderson (2002) highlighted theconflicting drivers that affect coal purchasing decisions. The example relates to the supply andpurchase of eastern US bituminous coals. 2001 produced the strongest seller’s market seen in years.Total production was around 450 Mt (or roughly 12% of the world total production at the time). Manyproducers struggled to keep up with demand, some to the point of cutting corners on quality in orderto meet production requirements. At the same time, several power generators purchased coals thatoften did not meet their plant specifications which resulted in them taking necessary measures toadapt to operating with coals with different qualities.
An extremely mild winter then followed, resulting in large stockpiles at both mines and power plants.Coal producers had to balance the needs of their customers against cost cutting measures which wererequired to maintain acceptable profits. Power generators who had struggled with the earlier supplyshortages, had acquired useful knowledge about the ramifications of pushing generating units to theirlimits.
The conflicting drivers provided the impetus and opportunity to consider several factors, such as:� optimising coal quality to meet both coal producer and power generator requirements including
using expert systems which could play a role in the optimisation process;� assessing the effects of impending emissions regulations being applied to power generators;� re-examining the market methods used, and the relative advantages of long-term contract
purchases versus short-term seller-buyer negotiations;
16 IEA CLEAN COAL CENTRE
Coal variability in power generation
17Expert systems and coal quality in power generation
Coal variability in power generation
180
160
140
120
100
0
Oct 08
$/t
200
220
Jan 09
80
60
40
20
Apr 08Jan 08Oct 07Jul 07Apr 07Jan 07 Jul 08
cal 08cal 09cal 10
Figure 5 Spot prices for internationally traded coal delivered into north-west Europe (DraxGroup plc, 2009)
180
160
140
120
100
0
$/t
200
80
60
40
20
Mar
08
Asian markerNewcastle FOB
Jan
08
May
08
Jul 0
8
Sep
08
Nov
08
Mar
09
Jan
09
May
09
Jul 0
9
Sep
09
Nov
09
Mar
10
Jan
10
May
10
Jul 1
0
Sep
10
Nov
10
Figure 6 Asian and NW Europe steam coal marker prices (MCR, 2011)
� matching coal costs to take account of varying electricity prices at different times of the day.
Different considerations apply in different situations but since the cost of the fuel represents a largeproportion of the operating costs of most coal-fired power plants, the pressures imposed by the marketneed to be taken into account. Purchasing coals with different qualities for use in a particular powerplant requires careful assessment of the various options and of the longer-term costs of these options.A wide range of factors influences the price of coal, and the variation in the costs of traded coals in2007-09 is illustrated in Figure 5. These peaked at 218 US$/t in June 2008, to steadier values aroundthe 80 US$/t range by 2009. The lines represent coal prices delivered into north-west Europe (asreflected by the Tradition Financial Services (TFS) API 2 index). The benchmark reference used totrade coal imported into north-west Europe. The API 2 index is an average of the Argus coal,insurance and freight (cif) Rotterdam assessment and McCloskey’s north-west European steam coalmarker. These price variations have a substantial impact on the costs of power generation for utilitiesusing traded coals (see Figure 6).
These widely varying situations have a profound impact on what expert systems can be used, and ontheir efficacy. Much depends on whether or not a coal is washed since in a CPP the various size rangesare treated, and in each case cleaner and dirtier fractions are separated, and a reject stream of high ashmaterial is usually dumped. Where the coal is washed, both the high grade product and the middlingproducts are likely to be much more consistent in quality than the original run of mine (rom) coal.This is because stray pieces of shale and rock are separated, along with material from any dirt bandspresent, and because the density separation and size cuts involved tend to increase productconsistency. Low rank coals are not generally susceptible to conventional water-based coalpreparation techniques although it is possible to upgrade them by drying as described by Couch(1990) and Dong (2011).
18 IEA CLEAN COAL CENTRE
Coal variability in power generation
3 Coal sampling and analysis
19Expert systems and coal quality in power generation
Coal is an organic sedimentary rock that contains varying amounts of carbon, hydrogen, nitrogen,oxygen and sulphur as well as trace amounts of other elements including mineral matter. It is a solid,brittle, combustible, carbonaceous rock formed by the decomposition and alteration of vegetation bycompaction, temperature and pressure. It varies in colour from brown to black and is usually stratified.Coal analysis establishes the price of the coal by allocation of production costs and is used to controlmining and cleaning operations and to determine plant efficiency. For a detailed study of coal analysissee Speight (2005).
Coal has been mainly used within its country of origin. Therefore, many different standards for coaltesting, sampling and analysis have emerged. Although these are broadly similar in principle, therecan be significant variations in their detail. Some (such as the German standards) are biased towardsassessing the coking behaviour of a coal, rather than its combustion characteristics. Among theprincipal standards used are those of:� the American Society for Testing and Materials (ASTM);� Standards Australia (AS);� the British Standards Institution (BSI);� the Standardisation Administration of the People’s Republic of China (with the prefix GB);� German Standards (with the prefix DIN);� Russian National Standards (with the prefix GOST);� the International Organisation for Standardisation (ISO).
3.1 Sampling
The first step in the application of expert systems for coal quality assessment is to ensure that thesampling procedures used are as accurate and precise as possible. This then provides a representativesample for the subsequent analysis. If the initial sample is not properly taken then the analysis can bemisleading. Experience has indicated that about 70–80% of the uncertainty/error of the analysis resultcomes from sampling, about 15–20% from sample preparation, and about 5–10% from the laboratoryprocedures involved, which demonstrates the importance of good sampling practice (CoalTransInternational, 1998; Laurila, 1997) .
Sampling is discussed in detail in other IEA Clean Coal Centre reports by Carpenter (2002, 1999).The discussion here covers only some of the key points from these studies.
In the early stages of assessing the quantity and quality of the coal in a deposit, core samples fromdrilling will be used. These will provide a vital part in the assessment of which parts of a coal depositare worth extracting, and possibly of the subsequent timing and sequencing of the mining. Selectivemining is one of the techniques that can be used to improve the quality of mined coals. Improvementof coal quality fed to power plant by using selective excavation method at the Seyitömer coal mines isdiscussed by Aykul and Yalçin (2004). This is an expert system/procedure which will not be discussedin this report but which is an important preliminary to the efficient use of world coal resources.
Sampling is commonly carried out from rom coal on a conveyor belt, and from belts at various stagesin the usage chain including the feed into a boiler or on to a stockpile. It is also carried out on the coalstored en route between the mine and the power plant, particularly where the coals are traded. Thepurchaser needs to be assured that the coal delivered is of adequate quality, and there will beadjustments made to the amount paid if off-specification material is supplied.
Where online analysis is undertaken of the coal carried on a conveyor belt, the device is calibrated
(and re-calibrated) against a laboratory analysis of samples. Obtaining a representative sample impliesthat every particle has an equal chance of being selected. Thus the size distribution of the sampleshould also reflect the size distribution of the bulk coal since the composition of small particles maybe different to that of larger lumps. Edwards and others (2005) discussed new developments in on-beltanalysis. Foster (2004) presented two case studies on the use of across-the-belt analysers to meet trainquality targets.
Coal is a difficult material to sample because of its variability, the number of significantcontaminants/impurities present and its tendency to segregate by size or mass. Sampling is furthercomplicated by the sampling equipment available, the quantity to be represented by the sample(sample mass), and the degree of precision required. In addition, the coal may be a blend of differentcoal types. How the coal was blended can have a profound effect on the way a representative sampleis obtained; depending, for instance, on whether it is intimately mixed or not (CoalTrans International,1997). Biased results can be introduced by the sampling procedure as well as by sample preparationand analysis.
The main sources of bias during sampling can be avoided by:� choosing the most suitable location for the sampling point;� using sampling equipment that meets the necessary specifications;� taking precaution when sampling for a specific purpose. For example, avoiding a loss or gain in
moisture when sampling to measure total moisture, and minimising breakage when sampling forsize analysis.
Various standards specify the procedures for collecting representative samples under differentconditions of sampling. As an example of the standards available, the BS ISO 13909 series, dated2001, includes:� general introduction to hard coal and coke – mechanical sampling (part 1);� coal – sampling from moving streams (part 2);� methods for determining the precision of sampling, sample preparation and testing (part 7);� methods of testing for bias (part 8).
There is also a BS ISO standard number 15239, dated 2005, covering the evaluation of themeasurement performance of online analysers for solid mineral fuels.
A comprehensive discussion on sampling of coal is presented by Laurila and Corriveau (1995). Whenestablishing a sampling scheme, it is important to recognise that the variability in the components oflower rank coals are often greater than those in higher rank coals, especially of some of the ashconstituents that might affect boiler deposition.
Generally, the standards specify the number and weight of increments to be taken for each samplingunit to achieve a given precision. An increment is a small portion of the coal samples collected in asingle operation of the sampling device. The increments are taken throughout the entire samples so asto reflect the coal variability. They are combined to form what is termed the gross sample, which isthen crushed and divided, following standard procedures, to produce the samples for analysis.Generally, the higher the number of increments taken, the greater the precision.
When sampling to determine whether a coal consignment meets the contract specification, it isimportant (and customary) to take samples and divide into three – one for the supplier, one for thebuyer and one as a reference for independent, impartial analysis, in case of dispute.
Mechanical sampling systems that are capable of collecting unbiased samples from moving coalstreams can be categorised into two types:� cross-belt samplers (sweep arm or hammer samplers) that sweep a cross-section of coal from the
moving conveyor belt into a hopper. They must be properly adjusted to avoid leaving any coal
20 IEA CLEAN COAL CENTRE
Coal sampling and analysis
fines on the belt that could compromise sample accuracy;� cross-stream (or falling-stream or cross-cut) cutter samplers which collect a cross-section from a
freely falling stream of coal. Thus the installation of these samplers requires a gap at a transferpoint, typically between two conveyor belts.
Sampling coal when it is sticky is a problem since it can stick to or clog the samplers, causing bias inthe results. The standards cover the size of the cutter opening (typically three times the coal top size),that the cutter should move at a uniform speed and, for cross-stream samplers, the speed of the cutter.The size and number of increments to be collected to minimise bias are also specified. A full cross-section of the stream should be taken whenever possible since it provides a more representativesample than a partial cross-section. Technological advances in mechanical sampling systems, and acomparison of cross-belt and cross-stream systems is given in Reagan and DeMatteo (2007) andReagan (1999).
Bias testingAll sampling systems need to be checked for bias, that is for systematic errors that may have beenintroduced. Generally, a loss or gain in the mass of the increments during collection causes asystematic error. This can include spillage of coarse or fine particles, or failure to collect the fineparticles at the bottom of a stockpile. A consistent bias occurs if the time intervals during systematicsampling coincide with cyclical variations in the coal quality.
Tests for bias can be tedious and expensive. A good bias test program design should not onlydetermine the overall bias of the system but that of the components as well, so that their contribution,if any, to the overall bias is known. Some systems are inherently biased and the test simply determinesthe extent of that bias (Laurila and Corriveau, 1995). The actual bias test procedure depends on thelocal conditions, and the sampling system in use. Therefore standards, such as AS 4264.3 and BS1017: Part 1, only give general principles for bias testing. Bias testing of mechanical samplers iscovered in the new ISO/DIS 13909: Part 8 standard, which requires an annual bias test for mechanicalsampling systems. The ASTM is currently discussing bias testing of mechanical sampling systems.
The first phase of any bias test is the preparation for conducting the test and a careful inspection of thesampling system and equipment to see if any systematic errors have been introduced. The latestASTM standard is D7430-11: Standard Practice for Mechanical Sampling of Coal (ASTM, 2008).Both sampling and bias testing involve complex issues (Laurila and Corriveau, 1995) and Speight(2005).
The reason for including a detailed discussion of sampling in the context of the review of the work onexpert systems is that the conventional sampling and analysis of the coal provides the basis for thecoal quality information involved. From the quality data, action(s) may be taken to modify and adaptthe downstream operating conditions so as to optimise overall performance.
3.2 Analysis
The data obtained from coal analysis may determine which parts of a coal seam are extracted (usingexploration data). It provides vital data relating to the design and operation of a CPP, and theinformation establishes the value of the coal product, and thus, broadly, the price at which it may bemarketed and the use to which it is put. Foster (2006) discussed testing a nuclear elemental staticsample analyser to optimise the operation of a CPP. Although the experience was proven beneficial,Foster (2006) considered that it was too early to use such cutting edge technology to optimiseoperation, reduce costs and maximise profitability.
For the power plant operator several aspects of the analysis provide important information which willaffect the economics of running the plant. This is because the quality of the coal being used affects its
21Expert systems and coal quality in power generation
Coal sampling and analysis
heating value, the amount of ash deposition and corrosion in the boiler, and the costs associated withflue gas cleaning. Prior knowledge of the exact composition of the coal being fed can help the boileroperator to minimise the overall and long-term operating costs of the individual units. The maincomponents which may cause operational problems are associated with the mineral matter present, orsometimes, in the case of low rank coals, of organically-bound impurities. If the coal composition andits properties are varying as it is fed into a boiler this can cause additional uncertainties and, undersuch circumstances, the provision of information from online analysis can be of particular value.
However, both the laboratory and online methods of analysis have limitations, and for commercialusers of coal it is important to understand what these are in order to make the best use of theinformation provided. This includes the data which is available to be fed into the plant expert systems.
Analysis data almost invariably reflects a combination of a wide range of properties, some of whichare desirable, while others present either minor or even major challenges to the plant operator in termsof the overall economic performance of the generation units. The analysis is limited by themethodologies used which are necessary to achieve reproducibility and consistency in the resultsobtained. These however, do not necessarily represent or reproduce the conditions found duringhandling or inside the boiler and therefore the behaviour of various impurities present.
3.2.1 Laboratory methods
Laboratory analyses utilise methods that are reproducible and which get as close as possible tomeasuring the coal properties which affect its behaviour during handling and use. The tests carried outon coal are more thoroughly discussed in another IEA Clean Coal Centre report by Carpenter (2002).The principal limitation is that the laboratory conditions do not always parallel the operatingconditions of a power plant in which the coal is used (such as PCC boilers). This is due to the heating
rate of the coal particles (Rajoo, 2011).
One factor to be taken into account is that coalsamples can oxidise, so that some of theproperties will change with time, possiblybefore the sample has been analysed. Thelower rank coals are generally more readilyoxidised and as a result, more care isnecessary in this respect. Oxidation of coalprior to combustion is discussed in detail byNalbandian (2010).
A cause of confusion in the evaluation of coaldata is the wide range of exclusions used inreporting coal analysis, and the failure of someworkers and writers to identify clearly thebasis of their results. Some commonly usedbases are illustrated in Figure 7. Two otherswhich are not illustrated are:� moist, ash-fee (maf) which assumes that
the coal is free of ash but containswater/moisture;
� moist, mineral matter free (mmmf) whichassumes that the coal is free of mineralmatter but contains water/moisture.
There are standard laboratory methods for
22 IEA CLEAN COAL CENTRE
Coal sampling and analysis
as re
ceiv
ed (
ar)
air
drie
d (
ad)
dry
bas
is (
db
)
dry
, ash
free
(d
af)
dry
, min
eral
mat
ter
free
(dm
mf)
fixedcarbon
volatileorganicmatter
volatilematter
volatilemineralmatter
mineralmatter
purecoal
totalmoisture
surface moisture
inherent moisture
ash
Figure 7 Relationship of the differentanalytical bases to various coalcomponents (Ward, 1984)
determining the proximate analysis of coal (Nalbandian, 2010; ASTM, 2009a; Carpenter, 2002),comprising:� moisture;� volatile matter;� ash contents.
It is also possible to use smaller samples and rapid temperature and atmosphere control with athermogravimetric method (TA-129, 2009) to obtain a proximate analysis, though this is probably lessrigorous and reproducible than the long-established standard methods. It can, however, produceindicative results much more quickly.
There are similarly standard laboratory methods for determining the ultimate analysis, comprisingthe weight per cent of carbon, sulphur, nitrogen and oxygen (by difference). Trace elements presentare often measured as part of the ultimate analysis (Nalbandian, 2010; ASTM, 2009b; Speight, 2005;Carpenter, 2002). These will commonly include chlorine and mercury.
For combustion, other properties of great importance are:� the calorific value or heating value;� the ash composition;� its behaviour at high temperature such as its softening and fusion temperatures.
Gross calorific value (GCV) or Higher Heating Value (HHV) is determined by burning a weighedsample of coal. This is carried out in a strong sealed vessel called a bomb calorimeter which iscorrosion resistant. It has a thermal jacket whose temperature is controlled by a microprocessorsystem which also fires the ‘bomb’ and measures the resultant temperature changes. The test continuesuntil equilibrium is reached. The GCV is calculated from the temperature rise in the water in thecalorimeter (Carpenter, 2002). A microcomputer uses the sample weight and temperature data toderive the GCV, applying corrections for heat from the fuse and any combustion aids used (Liu andLipták, 2003).
Ash analysis provides a measure of the incombustible material present, and the composition of theash can provide some guidance about how it will behave in a PCC boiler. There are a number ofdifferent standards used (Carpenter, 2002). However, the conditions encountered in the boiler aremarkedly different from those used during the analysis with much higher temperatures and variableoxidising conditions. There may also be interactions between various ash forming components. This iswhy ash behaviour in terms of its slagging and fouling characteristics cannot be precisely predictedfrom the ash analysis results.
Under some circumstances it is necessary to know the heat capacity and thermal conductivity of acoal, and for metallurgical use (coke making), its free-swelling index and agglomeration index. Inaddition its mechanical properties such as hardness, grindability and friability which affect coalpulverisation and its handleability are also routinely determined by laboratory tests.
The list above illustrates the range of coal properties which can affect its behaviour and, to an extent,the various assessments of its probable behaviour when used in a boiler. These are based on acombination of the results from analysis and of experience built up over many years (Barnes, 2009;Couch, 1994).
3.2.2 Online analysis
The previous discussion has shown that obtaining samples that are representative of the manythousand tonnes of coal in a stockpile or consignment can be an exacting task. By its very nature,laboratory analysis carried out on the samples according to standard procedures can be time
23Expert systems and coal quality in power generation
Coal sampling and analysis
consuming, with results only available some time after the coal has been sampled. This could be amatter of hours if the coal is analysed on site or a few days if the sample is analysed at a distantlocation. Thus the analysis results do not necessarily reflect current operating conditions. Real-timeinformation on coal quality could help to manage stockpiles more efficiently and, perhaps moreimportantly, coal-fired boiler operating conditions. This is discussed in a recent IEA Clean CoalCentre report by Nalbandian (2005).
Online analysers can show variations in coal quality as they are occurring. In systems where coal canbe analysed directly on the conveyor belt, errors due to sampling and sample preparation areminimised. However, online analysers can be expensive and their cost-effectiveness depends on thesite and application. Despite questions about the accuracy of online analysers being raised, their use incoal mines as well as power plants continues to increase. Their performance, in practice, has beenfound to relate strongly to initial installation, calibration, subsequent maintenance and applicationenvironment. Of these, the initial calibration was of prime importance. An analyser unit must beadapted to its particular installation by being carefully calibrated, using known samples that have beenanalysed in the laboratory (reference samples). The chosen samples must represent the range of coalswhich the machine might be expected to encounter in service. Analysis of coals beyond the range ofthe initial calibration do not have the same accuracy. Changes in coal supply can thus necessitate re-calibration. The calibration may also drift over time, requiring the analyser to be frequentlyre-calibrated (Nalbandian, 2005).
Standard methods for the evaluation of the performance of online analysers, including statisticalassessment procedures, are currently being discussed by ISO (ISO CD 15239, entitled Solid mineralfuels . evaluation of the measurement performance of online analysers) and ASTM (Laurila, 1997;Page, 1998). An Australian standard (AS 1038.24 Coal and coke analysis and testing. Part 24: guide tothe evaluation of measurements made by online coal analysers) has recently been published. Thesestandards outline the principles of the reference test method. Due to the range of configurations foronline analysers and their relationship to sampling/analysis systems, it is impossible to provideparticular test methods to cover all situations. More detail on the evaluation and performance testingof online analysers is given by Laurila and Corriveau (1995). These include statistical methods forevaluating precision and bias, and sampling procedures designed to obtain samples that can be usedfor calibration, accuracy and verification. Renner (1999) describes the planning and evaluationnecessary prior to the installation of online analysers. He also emphasises the importance ofcalibration and quality assurance, particularly the impact from mechanical sampling systems. In thelate 1990s, despite frequent disappointments, online analysers were gradually approaching the levelsof precision and reliability needed for confident usage. Today, online analysers are considered reliableand used more widely in a large number of coal-fired power plants. In 2001, Makansi explained howthe then latest online coal analyser technology created profits for both suppliers and customers.
Online analysers have been employed (Nalbandian, 2005):� to monitor the incoming coal at a site to determine whether it meets the required specification. In
addition, the analysis data will provide information of direct relevance to controlling theoperating conditions in the boiler plant which form a key component within an expert system forcombustion purposes;
� to sort and segregate coal into different stockpiles, according to its quality. How far this ispractical for coals arriving from a number of different sources is limited by the calibration rangeof the analyser;
� to blend coals from different stockpiles to meet the required specification. By maximising theamount of lower cost coal in a blend, savings can be made. It is also possible to blend coalsautomatically, for example by allowing the online analyser to control the feeders beneath thestockpiles involved;
� for monitoring coal during reclamation to check it meets the desired specification; and� more recently, for pulverised coal flow measurement and control, although in 2001 there was no
proven method for online control of the pulverised coal distribution in response to a signal from a
24 IEA CLEAN COAL CENTRE
Coal sampling and analysis
25
flow meter (DTI, 2001a). Magni and others (2005) discuss using Kalman Filter estimation of coalflow in power plants (see Section 4.4) while Roberts (2009a,b) examines a new online technologyfor particle size analysis, which influences coal flow characteristics, for improving boileroptimisation in coal-fired power plants.
Some of the main online measuring techniques in use include (Nalbandian, 2005):� Natural gamma systems which require no radioactive source. They measure the gamma
emission from the conveyed coal and calculate the ash content by combining this with ameasurement of the weight of the load. In dual energy gamma-ray transmission systems, thebulk coal ash content is determined by combining measurements of the intensity of two narrowbeams of high and low gamma-rays that are passed vertically through the conveyor belt. Theseanalysers only work properly if the coal on the belt is well mixed since the small beam onlydetermines a small area in the middle of the belt. Instruments are available that split the beaminto a number of corresponding detectors that determine the ash content at separate pointsacross the full belt width; these may provide a better measure of the ash content. Varyingchemical composition, especially the iron content, can lead to inaccuracies. Triple energygamma-ray transmission systems have been developed. Although natural gamma systems maynot be the most accurate, they are generally less costly than other methods; Taylor (2001)discussed the online monitoring of the ash content of coal using natural gamma technology;Richie and Edwards (2009) described the use of online monitoring of natural gamma radiationin coal ash to maintain coal quality.
� Prompt gamma neutron activation analysis (PGNAA) provides the elemental composition ofcoal by measuring the gamma radiation emitted when coal is exposed to a neutron source.Carbon, hydrogen, sulphur, nitrogen and chlorine are measured directly and the ash content isindirectly determined by combining the elements that comprise the ash (mainly silicon, iron,calcium, aluminium, potassium and titanium). A separate ash analyser is included in somePGNAA systems. The heating value (if a moisture meter is present), ash fusion (slaggingfactors) and oxygen content can also be indirectly determined. Some systems require a smallslipstream of coal to be diverted from the main coal flow to the analyser. ConventionalPGNAA can give problems for brown coals and lignites with a high moisture content, or coalswith large and variable ash constituents. Instruments using multiple sodium iodide detectorshave been developed to cope with coals from multiple sources. Instruments have also beenspecifically designed for high moisture brown coals. Hennessy and others (2007), Edwards(2004) and Blenkinsop (2003) describe advances and application of PGNAA analysis in coal-fired plant.
� Microwave moisture meters determine the moisture content by measuring the attenuation andphase shift of microwaves passed through the coal. Microwave moisture measurements are oftenincorporated in dual energy gamma-ray transmission and PGNAA systems, enabling the heatingvalue of the coal to be calculated. France (2005) discussed the use of microwave techniques inAustralia for online coal analysis.
� The Neutron Inelastic-scattering and Thermal capture Analysis (NITA) system was developed byCSIRO (Australia) and is based on neutron-gamma analysis to provide multi-elemental analysesof large streams of material across a range of industrial applications including coal combustionfor power generation. In neutron-induced gamma analytical techniques, neutrons bombard thematerial under investigation (the coal). Gamma-rays emitted as a result of the various interactionsthat occur can be measured to infer the elemental composition of the coal because the energies ofthese gamma-rays are characteristic of the emitting nuclei. These techniques use highlypenetrating radiation which permits non-intrusive and non-destructive ‘bulk’ elemental analysisof coal in vessels, pipes and on conveyor belts. These systems produce measurements that areaveraged over a large volume of coal. However, a safety risk posed by the use of high-strengthneutron sources in an industrial environment must be noted and observed. Despite concern overpotential radiation hazards, neutron-induced gamma activation has become a standard onlineanalysis technique, as the penetrating power of neutrons makes it possible to conductmeasurements on large volumes of coal (Lim and Abernethy, 2004, 2005).
Expert systems and coal quality in power generation
Coal sampling and analysis
� X-ray fluorescence (XRF) analysis is a widely used method of elemental analysis providing bothqualitative and quantitative compositional information. Among its advantages are the wide rangeof measurable elements covering nearly the entire periodic system. X-ray fluorescence is theemission of fluorescent X-rays from a material that has been excited by bombarding with high-energy X-rays or gamma rays. XRF spectrometry has the potential to be very sensitive inmeasuring trace elements, but it has the disadvantage in that it requires 15–30 minute samplecollection and pre-concentration. The method only works on elements with atomic numbers >25and is incapable of detecting beryllium (Seltzer and Meyer, 1997). Most samples of XRF areeither pressed to a pellet (disc shaped) or are converted to a homogeneous glass disc (bead) byfusion with lithium tetraborate. The fused bead technique overcomes heterogeneity effects and isgenerally required for obtaining highest analytical accuracies for minors and majors, in particularfor silicon oxide and iron oxide. On the other hand, pressed pellets are more suitable for traceanalysis (van Kroonenberg, 1996).
More recently, a prototype coal analyser using pulsed fast thermal neutron analysis (PFTNA) wasbuilt and the first commercial model was being developed in 2001 (Belbot and others, 2001). InPFTNA-based elemental analysis, coal continuously flows in a vertical chute that is irradiated withpulsed neutrons. During the neutron pulse, high-energy neutrons interact with the elements such as Cand O emitting characteristic gamma rays. In between pulses, neutrons scatter off light elements in thecoal and slow down to thermal energies. These lower-energy neutrons initiate thermal capturereactions with elements such as H, S and Cl emitting gamma rays characteristics of these elements.Neutron activation is used for the measurement of Na, producing isotopes that have longer half-lives(in the order of seconds) than the fast and thermal capture reactions. The gamma rays produced fromeach type of nuclear reaction (fast neutron, thermal neutron and activation) are acquired and stored indifferent spectra. This reduces the background as compared with the spectra taken with a radio-isotopic source. The analysis of the experimental data was performed using a de-convolutioncomputer code developed for the automatic extraction of the intensities of the characteristic gammarays. Belbot and others (2001) discuss the performance of the prototype and the development of acommercial model of such an analyser.
Hatt (2007) discusses the SODERN CNA analyser which uses an electrical neutron source or tube.According to Hatt (2007), this is a new generation of analysers which offers operational and analyticaladvantages. The use of electrical neutrons allows the direct measurement of the carbon, oxygen,sulphur and the elements of the mineral matter in the coal safely and reliably.
Both ash and moisture analysers need to know the amount of coal at any point in time to enable anassessment of the required measurement. Weighing becomes particularly important when blendingcoals. The weighing system must be accurate and repeatable. Odgaard and Mataji (2005) discussed amethod for estimating moisture content of the coal in coal mills. The estimation was performed with asimple linear dynamic energy balance model and an optimal unknown input observer. The observerwas designed for the purpose and tested on four sets of experimental data from a coal mill. The resultsindicated that the observer estimation was successful with different moisture contents.
In a detailed report on online analysis of heating value, the Electric Power Research Institute, USA(EPRI, 1999) considered that online analysers allow for the use of real-time plant control andapplications of tools such as the Coal Quality Evaluator (C-QUEL™) which was developed to assessand predict the impact of coal quality on power plant performance and power production costs. Aswith all expert systems, C-QUEL™ requires input data from online coal analysers, distributed controlsystems (DCS) and performance monitoring systems. Specific plant operating conditions can be thusdetermined for operators dealing with changing coal supplies. For more detail on the C-QUEL™system seeMitas and others (1991). According to EPRI (1999), a knowledge of real-time heatingvalue derived from the use of online analysis can also affect coal-related mass flows and annual coalusage. Online coal analysers used where coal quality varies significantly and frequently and wherechanges in coal quality affect downstream processes. Blending of two or more coal streams to obtain
26 IEA CLEAN COAL CENTRE
Coal sampling and analysis
specific performance is an example of howonline analysis would be beneficial. Fuelflexibility by matching coal burnt with theelectricity market can be fine-tuned. A low-heat, low-cost coal may be utilised duringoff-peak hours when incremental generatingcosts are most critical to keeping the plantonline and capacity is not critical. A high-heat,more costly coal cal be used during peak hourswhen the price of power is high and capacityis tight. According to EPRI (1999), with theuse of online analysers, the blending ratio canbe varied continuously to allow for variationsin the input streams, heating value, capacityand emissions requirements. This would resultin better utilisation of the higher-cost coal.
The cost of analysers reflects the variation in parameters that can be measured with each technology,highlighting the need for an individual case to be made for any analyser choice. Highly accuratemeasurements may or may not be required for a particular use. The economics and choice oftechnology depends on the reason behind its installation and therefore there is a trade-off in responsetime. These relationships are show in Figure 8 (EPRI, 1999) outlining an approach for trading offanalytical performance and response time versus the requirements of the application.
There are situations, such as small operating units, where the use of online ash analysers is notconvenient or cost-effective. In these cases a portable subsurface gauge is available for determiningthe ash content of coal within a stockpile. These gauges are based on the natural gamma-raytechnique. Consequently, they require no artificial radiation sources and are relatively inexpensive. Anatural gamma ash gauge can measure the ash content of low ash coal (<20% ash) with an accuracy of0.6% (Mathew and others, 1993). The gauge requires calibration for each coal type, since coals ofdifferent origin require different calibration equations. However the accuracy of ash determination bysuch a method is relatively unaffected by variations in ash composition or normal variations inmoisture content. It should be noted that a large number of measurements have to be taken over thewhole of the coal stockpile while it is being built up in order to determine its average ash content.
The use of remote monitoring with online analysis in the power generating industry is growing.Brummel (2006) discusses a suite of software/programs to carry out data acquisition, analysis,diagnostics and automated processing in coal-fired power plant for the early detection ofabnormalities in the operation of gas turbines and other equipment in the facility. This allows formaking more informed decisions with regard to taking a course of action when necessary, with bettertiming resulting not only in financial benefits but also improving operational and maintenancepractices in the facility. Hedvall and McKenzie (2007) discuss the benefits of real-time qualitymonitoring.
Tillman and Duong (2007) reported on managing slagging at the Monroe, 3100 MWe (net) capacitypower plant in South Michigan (USA) using online coal analysis and fuel blending. The stationconsists of four wall-fired boilers (775–795 MWe (net) each) firing blends of southern PRBsubbituminous coal with low and medium sulphur Central Appalachian (LSCA and MSCA,respectively) bituminous coal. The units utilised small ESPs with typical specific collection areavalues of 191 and 286 ft2/1000 acfm (~11 and 16 m2/1000 m3/h) depending upon unit. A typical ESPspecific collection area is between 11 and 45 m2/1000 m3/h (200 and 800 ft2/1000 acfm) flue gasvolume depending on fly ash resistivity. Particles with resistivity in the range of 107-1010 ohm-cm areamenable to collection with ESPs. High resistivity particles are difficult to collect, which result inpoor performance of an ESP (Soud, 1995). Today, the plant fires a blend of coal. The coal handling
27Expert systems and coal quality in power generation
Coal sampling and analysis
Response time
Ana
lytic
per
form
ance
contract valuation
power stationoptimisation
sortingblending
emissions management,slagging/fouling control
Figure 8 Schematic of performance versusresponse time for various potentialanalyser applications (EPRI, 1999)
facility supports using three piles, each of a different type of coal, and the facility is capable ofblending various percentages of LSCA, MSCA and PRB coals. The plant employs an X-rayFluorescence (XRF) analyser (see above and (for more detail) Nalbandian, 2005). The XRF analysisprogram includes the following systems (Tillman and Duong, 2007):� a coal sampler retrieving coal from the belt and crushing it to a size appropriate for the analyser;� an online analyser capable of evaluating the coal for numerous constituents;� a software package that provides information to the supervising operator, the shift supervisor and
various engineers.
The analyser, coupled with a moisture meter provides the plant with the following information(Tillman and Duong, 2005):� as-received heat content;� moisture;� ash;� volatile matter;� fixed carbon;� sulphur;� silica;� alumina;� titanium;� iron oxide;� calcium oxide;� magnesium oxide;� potassium oxide;� sodium oxide;� phosphorus pentoxide.
Other minerals are also evaluated by the XRF analyser including barium and manganese. Some ofthese data are converted, using the computer software package, into additional measures for the plantoperations and engineering personnel including:� volatility (volatile matter/fixed carbon ratio);� opacity indications (silica plus alumina percentage);� base/acid ratio;� calcium/iron ratio;� sulphur loading;� ash loading;� slagging alkalinity
Techniques were also developed to calculate the ultimate analysis from the analyser signals and data.According to Tillman and Duong (2007) these, coupled with data from the plant information system,provide the plant with the capability for calculating heat and material balances about the boiler as wellas residence times in each section of the boiler (furnace, secondary superheat section, primarysuperheat section, reheater, economiser). Furthermore, these data provide the basis for calculatingfurnace and boiler cleanliness factors plus temperatures in all zones of the boiler and, consequently,gas velocities through each section and gas velocities impacting the ESPs. The analyser program isconsidered an essential exercise and the Monroe facility has committed to ensuring >90% availabilityof the analyser system including sampler, crusher, analyser and software. The instruments arecalibrated monthly to ensure that instrument drift is minimised.
Chemical fractionation data analysis along with typical measures (for example, base/acid ratio) areused at Monroe to manage slagging and fouling. Chemical fractionation experiments are carried outon the parent coals and on the coal blends. According to Tillman and Duong (2007), this work isperformed recognising that the traditional measures of coal quality are necessary but not sufficient todefine the properties of low rank coals. These data then provide a basis for evaluating the slagging
28 IEA CLEAN COAL CENTRE
Coal sampling and analysis
properties of coal blends using a regression equation derived from the chemical fractionation databaseand based upon the behaviour of calcium. The equation permits relating the chemical fractionationdata to prior base/acid and slagging alkalinity data from the coal analyser. Tillman and Duong (2007),consider that continuous experimentation has shown that the blends do not behave like the weightedaverage of the two parent coals. When burning high percentage blends (for example ~65% PRB)understanding the influences of blending on the parameters measured by the online analyser andtransmitted to the operators is essential. The program has proven successful in managing slagging andfouling and was extended to provide guidance for the operators managing opacity through controllingSO3 injection to influence ash resistivity using models driven by data from the online analyser(Tillman and Duong, 2007).
29Expert systems and coal quality in power generation
Coal sampling and analysis
4 Quality assessment with expert systems
30 IEA CLEAN COAL CENTRE
An expert system is intelligent computer software, which can comprise a suite of programs, that usesknowledge and inference procedures to solve problems that are difficult enough to require significanthuman expertise for their solution (OECD, 2003).
4.1 Characteristics of expert systems
Every expert system consists of two principal parts (Engelmore and Feigenbaum, 1993):� the knowledge base;� the inference engine.
The knowledge base contains both factual and heuristic knowledge. Factual knowledge consists of allinformation available to plant operators and included in the plant digital/distributed control system(DCS). Heuristic knowledge is the less rigorous, more experiential and more judgmental knowledgeof performance or what commonly constitutes the rules of ‘good judgement’ or the art of ‘goodguessing’ in a field. In contrast to factual knowledge, heuristic knowledge is rarely discussed and islargely individualistic. The knowledge base is used with either ‘if/then’ statements (condition andaction) or the rule of ‘good judgement’. In an ‘if/then’ program, the ‘if part’ lists a set of conditions insome logical combination. Once the ‘if part’ of the rule is satisfied, the ‘then part’ can be carriedout/concluded and the appropriate action taken. Expert systems whose knowledge is represented inrule form are called rule-based systems (Engelmore and Feigenbaum, 1993).
The inference engine makes inferences by determining which rules are satisfied by facts, ordering thesatisfied rules, and executing the rule with the highest priority.
Expert data editing systems make so-called intelligent imputations based on a specified hierarchy ofmethods to be used in imputing an item. One item may use a deterministic approach followed by ahot-deck approach, while another item might require a model-based approach. Each item would beresolved according to its own hierarchy of approaches, the next being automatically tried when theprevious method has failed. Hot-deck imputation is a means of imputing missing data using the datafrom other observations in the sample at hand.
According to Maxson (2005), to deal with highly complex processes that don’t easily lend themselvesto first-principles modelling, the process engineering community has increasingly harnessed neuralnetwork technology. Neural networks computationally mimic the nervous system of the human body.The system uses inputs (stimuli) to predict outputs (responses) based on the patterns ‘learned’ by thesystem. Training the system to develop a corresponding model is done by using historical and/ormeasured data. The goal of the model is to characterise outputs given inputs. Inputs consist of datathat are known to impact the process. Neural networks have proved successful in many applicationswith accuracy in general >95% and often higher than 99%. Maxson (2005) considers that there areproponents for both sides, some who adamantly oppose anything except first principles and otherswho believe the heuristic approach made practical by high-speed computers and neural nets renders afirst-principles approach obsolete. In truth, however, Maxson (2005) finds that both approaches havemerit. Tools that can blend the best of both approaches generally demonstrate the broadestapplicability and effectiveness.
An example of the demands that are made on a modern expert system applied to new plant is theCliffside 6 supercritical unit. This will generate 800 MWe and replace four small units built in the1940s at Rutherford, NC, USA (McGinnis and others, 2009). The plant is subject to strict emissionlimits for NOx, SO2, sulphuric acid mist, mercury and particulate matter. In addition the effective
control of other acid gases including HCl and HF will be required, for both environmental reasons andbecause of their impact on plant maintenance. The chlorine content of the coal is therefore ofsignificance.
As the plant uses high sulphur coals from Kentucky and Virginia, the design adopted combines spraydry FGD and wet FGD systems. In the integrated process, sulphuric acid mist, HCl, mercury andparticulates are removed at the spray dry FGD stage. Additional mercury and HCl removal occurs inthe downstream wet FGD unit. The principal process steps are as follows:� the flue gas is cooled in a spray dryer adsorber using a lean lime slurry. Significant amounts of
mercury are captured and as the outlet temperature is well below the acid dewpoint, the SO3
condenses as a sulphuric acid mist which reacts with the lime slurry. The solid calcium sulphateis captured in the fabric filter;
� SO2 capture in the spray dry scrubbing stage is minimised by temperature control and sub-stoichiometric reagent feed to minimise lime usage;
� most of the SO2 capture is achieved in the wet FGD using lower-cost limestone, and wallboardquality or landfill gypsum is produced;
� the purge stream required to control chlorides and inert fines for wallboard gypsum is returned asa component in the lime slurry feed to the spray dry scrubber.
The control of NOx emissions will be by the use of low NOx burners and overfire air, followed by aSCR unit (McGinnis and others, 2009).
Plants using different coals and operating in places with different emissions regulations may have aless complex series of unit operations, although in due course a CO2 absorber may become anadditional requirement. However, the above illustrates the range of factors that need to be consideredand included within the overall control algorithms of an expert system. The emissions control systemsneed to be able to accept the required load-following characteristics of the boiler while meeting thenecessary emission limits despite variations in the process conditions. It is additionally important tomaintain the quality of the saleable byproducts and to minimise the amount of carbon-in-ash.
4.2 At the mine
Coal is extracted either from open (surface) pits or from underground mines and, as discussed inChapter 2, there are different supply patterns to power plants. Coal quality in the deposit is assessedon the basis of cored borehole samples taken during exploration work. Some of this is needed toassess the practicality and costs of mining, and some may be undertaken to assist in the detailedplanning concerning which segments of the deposit to exploit as part of the ongoing operation of amine. Variations in coal quality, and in particular the amount of extraneous dirt present, do not alwaysshow up in the results from borehole analysis – these are affected by the mining method used as wellas the nature of the coal seam. In terms of both coal quality and its variability, much depends onwhether the coal is treated in a CPP and then on the extent of the processing. In recent years,computer aided designs and models have been developed for decision making purposes with regard toplanning mines and the potential exploitation of certain coal deposits. Such model are discussed byCichoæ (2004) and Roumpos and others (2004). However, these are not discussed in this review.
The management of the rom product from different parts of a mine requires careful consideration. Forexample, blending can produce an optimum product for consistent performance in power plants. Thiscommonly requires a carefully monitored stacker/reclaimer set-up, and online analysis devices may beable to facilitate the sorting process. Each mine is likely to have developed its own expert system formaximising the overall return from the mine and power plant. Woodward (2005) explained how to usean online analyser to perform sorting in a Western US coal mine.
A global perspective of CPP is presented by Bethell (2007) describing coal processing circuitry and
31Expert systems and coal quality in power generation
Quality assessment with expert systems
practices. Coal sizing, cleaning de-watering and reject disposal devices, techniques and practices arealso discussed. Arnold and others (2007) review current coal preparation plants (CPP) practice,principally in the USA and Australia. The automation and control of some of the unit operations, suchas Romjigs and Batac jigs are discussed along with the various applications of dense medium in bathsand cyclones. For coal preparation – automation and control see Couch (1996); DTI (2001b).Computer-based systems which aim to ensure consistent operation and maximise the profitability ofCPPs are in widespread use. They are backed up by process modelling and plant audits which providethe knowledge base and input for the operation of a CPP. The status of coal preparation research wasthe subject of a study by Honaker and others (2007) and future challenges in coal preparation plantdesign and operation were discussed by Davis (2007). Cierpisz (2001) presented the application ofcomputer-based monitoring and control systems in coal preparation plants.
Most online coal analysers used on CPPs are simple ash gauges (Woodward, 2007). Most are locatedon the product side of the plant, to monitor performance although more than a hundred are used tomonitor the plant feed. It is noteworthy that Woodward (2007) says that almost all plants use ahuman operator to interpret the analyser results and effect process changes rather than attemptingautomation. This implies that the application of expert systems as understood in this report, to theoperation of CPPs, is very limited, although some sub-systems within a plant include feed-backcontrol loops.
The possibility of using commercial online analysis systems for monitoring the ash content of lowgrade lignites in Greek mines was the subject of a study by Kavouridis and Pavloudakis (2007).Pilot-scale tests were carried out by installing the online analyser on the conveyor belt that transportedthe lignite from the mine pit to the bunker of Kardia mine, Ptolemais basin. The study results showedthat the precision of the online analyser was not satisfactory and did not allow the precisedetermination of the ash content in real time. Kavouridis and Pavloudakis (2007) consider that thepoor performance of the chosen online analyser was due to the multi-seam structure of the lignitedeposit. The deposit consisted of many lignite layers of varying thickness separated by waste layerswhich led to significant fluctuations of the produced lignite quality. The most important causes for theerrors were attributed to the intense variation in ash content and the fluctuation in the mineral mattercomposition, especially the changes in FeO3 and CaO content and also the rapid changes in ligniteweight per conveyor belt unit area. Several solutions were investigated in order to overcome theseproblems. It was decided that online analysis can be applied successfully in this mine if a detailed andreliable spatial database of the quality characteristics of each lignite seam were developed. However,this would require a time-consuming and rather expensive drilling programme.
Kavouridis and Pavloudakis (2007) consider that the following must be examined as alternatives:� simultaneous use of online analysers that incorporate different operating principles and are
capable of measuring other lignite quality parameters apart from ash content. These wouldprovide more data which can lead to improved ash monitoring precision after processing withsoftware especially developed for such application;
� implementation of a sampling and laboratory analysis program for regular mapping of the qualitycharacteristics of the lignite seams that appear in each mine bench. The lignite samples obtainedfrom each seam can be analysed for elemental ash composition, so that the calculation of theabsorption coefficient variations (that is, shifting of calibration line) is possible. This processwould have to be carried out in time intervals that allow tracing of the qualitative changes in eachseam;
� it would be possible to choose (either manually or automatically) the set of calibration coefficientsthat gives the optimum online analysers accuracy based on the contribution of each bucket wheelexcavator (BWE) to the production of the mine and tracing the operating point of the excavation.Kawalec (2004) discussed the short-term scheduling and blending in a lignite open-pit mineutilising BWEs.
According to Kavouridis and Pavloudakis (2007), more experimental work needs to be carried out to
32 IEA CLEAN COAL CENTRE
Quality assessment with expert systems
investigate the possibility of using online analysers in mines where the lignite deposits have lower andless fluctuating contents of FeO3 and CaO in ash.
4.3 Blending
Laboratory- and full-scale coal blending studies were the subject of a detailed review by Rozendaaland others (1998). Coal blending for power generation can be carried out in one of two ways.Different coals can be stored in separate stockpiles and weigh feeders can be used to balance thedifferent amounts of coal fed onto a conveyor feeding a power plant boiler. Alternatively, coals may bestacked on large stockpiles in layers and reclaimed in such a way as to achieve a representative blend.Management of coal stockpiles is discussed in other IEA Clean Coal Centre reports by Nalbandian(2010) and Carpenter (1999).
Dynamic coal blending can be used to improve overall plant economic performance where there is achoice of coals to use and the blending can maximise the use of the lowest cost coal. In order tooperate a dynamic coal blending system, reliable information about the different coal qualities isessential. In addition it is necessary to have an understanding of the effects of changes in the blendunder the operating conditions in different parts of the power plant sequence (Sehgal and Shea, 2001):pulverisers r burners r boiler furnace r superheaters r reheaters r economiser r air preheater rSCR unit r ESP/fabric filters r FGD unit r CO2 absorber r stack
Most coal-fired power plants use a fixed coal blend which is tailored for optimum performance underfull load conditions. Often this blend is of a much higher quality than is needed during part-loadoperation, and of a lower quality than is needed when output peaks. Fixed blends also lack the flexibilityto adapt to changing plant conditions such as increased ash deposition or deteriorating precipitatorperformance which can cause costly derates (Sehgal and Shea, 2001). A detailed review of the state-of-the-art in coal blending in 2001 for power generation was prepared by Wall and others (2001).
US DOE reports published in 2001 and 2007 cover the demonstration of advanced integrated controlsystems for simultaneous emissions reduction. At each stage of the systems, the coal properties, alongwith the volume of injected air, determines the conditions, gas velocities, temperatures, ash quantityand properties, and the amounts of the various gaseous components, some of which need to beremoved (Shea and others, 2002).
A software product applied to dynamic blending called CoaLogic was reported to have been installedin thirty boilers in North America for a variety of purposes. In one example of its application, an800 MWe plant in Canada was subject to frequent derates because the stack frequently exceededopacity limits. The coal came from a nearby mine with five seams, one of which produced coal with ahigh opacity potential, supplying approximately 30% of the coal used at the plant. Coal from the otherseams had a variable heat content. It was also considered that the plant derating may have been theresult of limited mill capacity.
The amount of coal mined from different seams is largely carried out independently of the powerplant, so the operator has to accept the coal supplied. Stack opacity is affected not only by the coalblend being fired but also by which coal has been in use for the previous few hours and the influencethat its ash chemistry has on the ESPs. These tend to become de-conditioned with low sodium, lowsulphur coals. The de-conditioning of precipitators refers to the reduction in removal efficiency thatoccurs when these devices are subjected to coals with low ion content over an extended period of time(Sehgal and Hickinbotham, 2001). Particulate control with electrostatic precipitators is discussed indetail in previous Clean Coal Centre publications by Zhu (2003) and Soud (1995). Controlling opacityand heating value at the burners, therefore, requires an ongoing estimation of coal characteristics suchas sodium, calcium, and ash, and operating conditions such as load and the type of coal that has beenburned for the previous few hours.
33Expert systems and coal quality in power generation
Quality assessment with expert systems
A particular challenge has arisen in the USA where substantial quantities of subbituminous PRB coalsare blended with eastern bituminous coals in order to meet sulphur emissions requirements. Fuelblending with PRB coal is discussed by McCartney and Williams (2009). Similar problems can ariseelsewhere, particularly where Indonesian subbituminous coals are blended with other traded coalsnearly all of which are bituminous.
The ash characteristics of subbituminous and bituminous coals differ significantly. The high sodiumand calcium contents which are common in subbituminous coals result in a lower ash fusiontemperature, and considerably increased slag formation which results in changes in heat transfer inlarge sections of the boiler. Use of the PRB coal can result in unit derates and forced outages forcleaning and to repair or replace boiler tubes that have overheated because they were covered in slag,or have been damaged by slag falls (Smyrniotis, 2005).
The use of computational fluid dynamics (CFD) modelling can provide a tool to mitigate suchproblems. CFD modelling can target areas of both the radiant and convective sections of the boiler andto add chemicals such as magnesium hydroxide, which reduce both slagging and fouling using amethodology called targeted in-furnace injection (TIFI). The company involved in this particulardevelopment is Fuel Tech Inc (Fuel Tech, 2009), but others offer alternative systems and approaches(Gelbar and Kunkel, 2002).
4.4 Application to boiler feed
Coal quality impacts coal handling, pulverising, combustion, ash deposition and soot-blowing,corrosion and erosion, low NOx burners, air staging, SCR, FGD and ESPs – hence overall emissionsas well as carbon-in-ash. That is, the varying coal properties can affect the efficient operation of boththe boiler and of the emissions control units. They therefore affect both the short and long-termoperability of the plant, and the economics of the operation.
The key impacts are connected with:� the performance of the pulverising mills;� coal distribution to the burners;� ash deposition and in particular its slagging and fouling behaviour;� long-term corrosion and erosion effects;� interactions between the various emissions control units.
Magni and others (2005) discuss Kalman filter estimation of coal flow in power plants. The Kalmanfilter is a set of mathematical equations that provides an efficient computational (recursive) means toestimate the state of a process, in a way that minimises the mean of the squared error. Kalman filteringis used mainly to estimate system states that can only be observed indirectly or inaccurately by thesystem itself. The filter is powerful in several aspects: it supports estimations of past, present, andeven future states, and it can do so even when the precise nature of the modelled system is unknown(Welch and Bishop, 2006). The estimation was carried out for a reference conventional, once-through,660 MW supercritical coal-fired plant reproducing an actual unit located in Italy. The dynamicsimulator of such a plant used as test bench included all the water steam systems (boiler, steamturbine, balance of plant), the air-gas system, the mills and all the control loops. Figure 9 shows therepresented original control scheme of the pulverised coal flow to the furnace. The scheme includes aproportional-integral master controller driven by the error between the coal flow request (receivedfrom the power plant load controller) and an estimation of the total pulverised coal exiting the mills.The output of the control represents the mill feeder speed request for all the mills in operation(maximum of 6). Magni and others (2005) consider that the feeder speed gives a good representationof the coal flow entering the mills and is controlled, for each mill, by a dedicated proportion-integralregulator. With regard to the coal flow estimation exiting each mill, its dynamic behaviour isrepresented by means of two transfer functions taking into account the contribution of the pulverising
34 IEA CLEAN COAL CENTRE
Quality assessment with expert systems
time delay of the coal entering the mill and the contribution of the lead effect of the air flowing insidethe mill and carrying the pulverised coal to the furnace. The two transfer functions used for coal flowestimation had been identified on the basis of a trial and error procedure.
The simulations demonstrated that it is not possible to improve the response of the coal flow controlloop with the actual coal flow estimation. However, with better estimation of coal flow, improvementsmay be achieved. To achieve greater improvements, two different approaches were undertaken toobtain a better coal flow estimation using Kalman filtering. The first approach involved using a blackbox model of the mill-boiler-turbine system for the simulation of the coal mass flow with a Kalmanfilter. The second approach used non-linear physical model based estimation with Kalman filtering. Inboth cases, the Kalman estimation gave corresponding data with the effective coal mass flow, both insteady state condition and in transients. In the test case, closing the coal flow control loop with theKalman estimation in substitution of the missing measurement allowed for better tuning of the controlsystem, leading to a significant improvement in its dynamic performance without compromisingsystem stability. Magni and others (2005) found that even the amplitude of the disturbances on themain steam temperature and pressure, induced by electrical power request variations, weresignificantly reduced. The authors concluded that all these factors, combined with the resultingcontrol system robustness to modification of the coal calorific value, concur in making the Kalmanfilter a good solution to the coal mass flow control problem in power plants.
4.5 Predictive modelling
Vesel (2009) discusses the application of multi-variable model-based control in the power generation
35Expert systems and coal quality in power generation
Quality assessment with expert systems
total fuel flow estimation(to be substituted by the Kalman estimation)
mill 1outlet coal
flow estimation
feeder speed request to all mills
total fuel flow estimation
mill 1air flow
rate
mill 1feederspeed
mill 2air flow
rate
mill 2feederspeed
++
+
mill 1regulator
++
+-
mill 2feeder speed request
mill 2regulatormill 2
outlet coalflow estimation
mill 1feeder speed request
∑
+-
masterregulator
total fuel flow request
Figure 9 The represented original control scheme of the pulverised coal flow to the furnace(Magni and others, 2005)
sector. He attributes the slow uptake of the technology partly to the higher performance requirementsand the much faster dynamic behaviour of power plant components compared to industrial processes.This required computing power that until recently was either not available or not cost-effective. Vesel(2009) considers that, for utility application of multi-variable control technologies, there have beenthree overlapping generations of advanced controls which are currently in use. The first generationused neural networks to build the multi-variable model. The second generation was the linear multi-variable model-predictive controls. The third generation relies on state-space-modelling. State-spacemodels are a flexible family of models which fits the modelling of many scenarios. The strongestfeature of state-space models is the existence of very general algorithms for filtering, smoothing andpredicting. For detailed information on state-space models see Poncia (2003).
According to Poncia (2003), there are a number of reasons to adopt model-based predictive control ina power plant context. For example, the inclusion of several constraints such as limits on theoperability of actuators, admissible ranges on the thermodynamic variables imposed to guarantee safeoperation. Also, the possibility of delaying easily with the compensation of measurable disturbancessuch as the power needs of the grid. Different techniques have been adopted in recent years includingestimation of states and plant parameters online with an extended Kalman filter (Welch and Bishop,2006).
Poncia (2003) discusses in detail the application of multi-variable techniques to the control of fossilfuel power plants. He concludes that solutions that replace the classic multiple single-input single-output configuration have not found application in the industrial realm. This is attributed mainly to thecaution and uncertainty with systems that revolutionise well-assessed technologies and designprocedures. Due to this reasoning, attention is mainly devoted to structures where the classicregulation is kept in operation and a multi-variable solution corrects it, in order to improve thetrajectories of the thermodynamic variables. The design process is achieved in a sequence of stepsinvolving (Poncia, 2003):� choice of the control architecture, alternatively controlled reference value or control action
correction. Both architectures consist of a multi-variable controller that corrects the action of atraditional regulation system;
� development of a non-linear model of the power plant, used for simulation and verificationpurposes. The model is validated against experimental data from the real plant;
� synthesis of the reduced-order models that are incorporated in the control algorithm. The modelscan be identified from simulation or experimental data in a fast and reliable way by applyingstate-space identification techniques;
� model-based predictive control strategies have been demonstrated to be effective and reliable forthe control of many chemical and thermal processes;
� controller synthesis and verification over the operating range of the place, according to designspecifications.
Furthermore, Poncia (2003) considers that the benefits of the introduction of a control actioncorrection multi-variable controller based on state-space model based predictive control have beenillustrated by presenting his findings of an application to a simulated 320 MW oil-fired plant. Heobserves that:� the application of the multi-variable solution allows a reduction of thermal stresses and pressure
oscillations when extreme conditions are encountered;� amplitudes of the control variables are also reduced, thus diminishing the stress and effort of the
actuators;� the results suggest the possibility of eliminating the temperature control by attemperation, a
solution that results in efficiency losses and increases the possibility of damage in the turbine;� the improved control system is conceived in such a way that when the multi-variable controller is
disconnected, the traditional regulation devices guarantee safe operation of the plant.
Vesel (2009) discusses the implementation of a multi-variable predictive control system at the Colstrip
36 IEA CLEAN COAL CENTRE
Quality assessment with expert systems
(USA) coal-fired power plant. The system was designed to be a co-ordinating supervisory layer on topof the basic single-loop proportional-integral-derivative (PID) controls. PID is a generic control loopfeedback mechanism (controller) widely used in industrial control systems. A PID controllercalculates an ‘error’ value as the difference between a measured process variable and a desired set-point. The controller attempts to minimise the error by adjusting the process control inputs. Accordingto Vesel (2009), acceptance of, and confidence in, such a system by plant operating staff takes time.The application of multi-variable predictive control in coal-fired power plants is also discussed byImmonen and others (2007). The authors consider that the advanced model predictive control systemsimprovements in plant operation can include:� NOx reduction;� heat rate improvement;� reduction in unburnt carbon in ash;� reduction in CO2 production per MWh generation;� maintenance of CO at a desired level;� improved availability;� accelerated ramp rates.
In 2007, Ma and others published a study on a comprehensive slagging and fouling prediction tool forcoal-fired boilers and its validation and application. The ash behaviour prediction tool, calledAshProSM, integrates boiler CFD simulations with ash behaviour models including ash formation,transport and deposition, as well as deposit growth and strength development. The results from theCFD model provided the basic information used in the ash behaviour model. The software wasapplied to a 512 MW tangentially-fired boiler to evaluate the localised slagging on furnace walls andfouling in convective pass. The predicted deposit pattern was found to be reasonably consistent,particularly in the overfire air region, indicating that the model was providing accurate predictionalthough Ma and others (2007) consider that this could be improved by fine tuning the ash behaviourmodel and better integration between the two models. Following the application of the system at the512 MW boiler, the authors concluded that the prediction tool can be used to determine the depositthickness, chemical composition, physical properties and heat transfer properties in a specific regionof the furnace wall and convective pass. It can be used to assess the combined impact of ash formationand deposition phenomena on power plant performance and can also be used to assess the impact ofcoal quality, ash properties, fouling and slagging in the operation of the plant as well as used fordesign and operational purposes. According to Ma and others (2007), further efforts continue toimprove the prediction of the model.
4.6 Non-linear modelling techniques
Conventional methods of empirical modelling for predicting the effects of coal quality changes on boilerperformance use linear statistical techniques. However, some parameters can be predicted moreaccurately using non-linear techniques and an application of this is described by Bulsari and others(2009). An example is given of the use of a non-linear model at the Naantali power plant, near Turku inFinland, to improve combustion efficiency while keeping NOx and other emissions within desired limits.
The No 2 boiler on which the tests were carried out was supplied in 1964, and produces some90 MWe of power and 175 MWth of heat. It burns about 44 t/h of coal at full capacity. The coalcomes from six different Russian mines, and there are differences in coal characteristics betweenevery shipment. Quantitative knowledge of the effects of process variables such as the set points forthe flow rates of air and coal make it easier to operate under optimal conditions.
Non-linear modelling is based on empirical or semi-empirical data that takes at least some non-linearity into account. Older techniques have included polynomial regression and linear regressionwith non-linear terms. New developments use feed-forward neural networks, multivariate splines andkernel regression, and have been found to be particularly valuable in process modelling.
37Expert systems and coal quality in power generation
Quality assessment with expert systems
The Naantali boiler uses coal as the main fuel with up to 2% of added sawdust. Oil is only used forstart-up. In developing the non-linear model, plant data were collected. Fuel flow rates, fraction ofsawdust, air flow rates and a variable indirectly indicating the amount of excess air were selected asinput variables for the first phase of the work. Output variables included emissions, the amount of feedwater as a measure of the power generated, unburnt carbon in fly ash, flue gas temperature and steamtemperature.
It was found that the non-linear models developed could predict NOx emissions while facilitating themore efficient operation of the boiler. It was also possible to follow the effects of input variables orpairs of input variables on parameters such as the amount of carbon in ash. It is claimed that the use ofsuch models can provide for the setting of process variables to meet optimisation objectives in thepresence of constraints (Bulsari and others, 2009).
The PiT Navigator for coal-fired power plant, is a non-linear model predictive control (NMPC) systemdeveloped by Powitec Intelligent Technologies GmbH (Germany). The system uses proprietary opticaland acoustic multi-sensors and digital image processing software for flame analysis. The parametersdetermined by the multi-sensors are used in combination with conventional combustion data to createstatistical and adaptive models of the process. The non-linear models are used to regulate coal andcombustion air distribution and flow, thus optimising the combustion process and increasingefficiency. When installed, amortisation is expected in less than two years. According to Powitec(2011) the system can achieve the following results:� up to 0.5–1.0% reduction in fuel combustion;� reduction in slagging and fouling in the boiler;� up to 0.5% increase in boiler efficiency;� up to 30% reduction in CO and NOx emissions;� reduction in CO2 emission;� 20% reduction in carbon in ash;� increased availability.
The system has been installed in a number of coal-fired plants. According to Powitec (2011) thesystem has been deemed to meet expectations and perform satisfactorily. Customers have declared itas flexible and easy to use and achieve set targets.
38 IEA CLEAN COAL CENTRE
Quality assessment with expert systems
5 Expert systems
39Expert systems and coal quality in power generation
According to Coker and others (2006), expert systems are software that behaves in much the sameway as a human expert would in a certain field of knowledge. An expert system is a class of computerprogram developed by researchers in artificial intelligence during the 1970s which appearedcommercially in the early 1980s. The programs are a set of rules that analyse information, usuallysupplied by the user of the system about a specific class of problems, as well as provide analysis ofthe problem and recommend a course of action for correction. According to US DOE (2007), artificialintelligence is commonly defined as the science and engineering of making intelligent machines,especially intelligent computer programs. Relative to applications in coal-fired power plants, artificialintelligence consists of aspects of considerations that deal with (US DOE, 2007):� neural networks, which mimic the capacity of the human brain to handle complex non-linear
relationships and ‘learn’ new relationships in the plant environment;� advanced algorithms or expert systems that follow a set of pre-established rules written in
codes or computer language;� fuzzy logic, which involves evaluation of process variables in accordance with approximate
relationships that have been determined to be sufficiently accurate to meet the needs of plantcontrol system.
A number of artificial intelligence systems are available today for use in coal-fired power generation.In this section the discussion is mainly on expert systems that are used to assess the impacts of coalquality in the plant. However, other expert systems such as those that aim to optimise the combustionprocess are also presented.
The Clean Coal Technology (CCT) demonstration programme began in 1985. It is co-funded by theUS government and industry to demonstrate a new generation of innovative coal utilisation processesincluding software/expert systems development in a series of facilities built across the USA. Theprojects are conducted on a commercial scale to prove technical feasibility and provide theinformation required for future application (US DOE, 2001). Three computer/expert software systemswere developed under the CCT programme for application in coal-fired plant including (US DOE,2001):� Coal Quality Expert (CQE™), a program that provides detailed analyses of the impacts of coal
quality, operational changes and /or environmental compliance alternatives on emissions,performance and power production costs;
� Generic NOx Control Intelligent System (GNOCIS), an advanced software-based system thatoptimises boiler operation to achieve reduced NOx emissions while improving unit performance;
� Plant Economic Optimisation Advisor (PEOA™), a system designed to assist in meetingemissions regulations while optimising overall plant economic performance. The PEOA systemdemonstration was discontinued because of operating problems. This software is not discussedfurther in this review.
According to US DOE (2001), these projects incorporate aspects of artificial intelligence (AI), whichinvolves computer-based decision-making processes that mimic those of the human brain. The use ofdifferent forms of AI in plant operation and control is discussed by the US DOE (2007) and Bartos(2005). The CQE™ and GNOCIS projects are discussed in greater detail in Sections 5.1 and 5.4respectively.
5.1 Coal Quality Expert (CQE™)
During the early 1990s there were extensive efforts by the US DOE to develop a software tool forutilities, coal producers and equipment manufacturers that could analyse the impacts of:
� coal quality on power plant performance, emissions and costs;� hardware provision (and plant modifications);� operational changes;� environmental compliance alternatives.
The software was called the Coal Quality Expert (CQE™) (see Figure 10) and was correlated withthe results obtained from the earlier predictions from the Electric Power Research Institute (EPRI)Coal Quality Impact Model (CQIM) (US DOE, 2001). Since its introduction in 1989, CQIM has beenobtained by over 100 PRI member utilities and purchased by an additional 16 users including non-EPRI US utilities, international utilities and coal producers. Black & Veatch (B&V) estimate thatCQIM is used on a regular basis by about 50 users (B&V, 2011). CQIM naturally focused on the useof US coals in US power plants, although it has proved to be applicable more generally. CQIM hasbeen applied to a wide range of fuel-related evaluations by B&V, utilities and coal companies. Theseevaluations have included the following (B&V, 2011):� evaluate potential coal supplies and assist in coal sales/procurement;� establish ‘unit-specific’ coal specifications and property range limits;� develop/evaluate premium/penalties for key coal quality parameters for use in coal contracts and
negotiations;� assess changes in maintenance/availability costs;� quantify advantages/disadvantages of blending and cleaning coals;� quantify advantages/disadvantages of gas cofiring;� evaluate performance and economic trade-offs from burning high sulphur coals that require FGD
versus burning compliance coals;
40 IEA CLEAN COAL CENTRE
Expert systems
selected coals
bituminous subbituminous
anthracite lignite
waste
pilot-scaleboiler
full-scaleboiler
data evaluationand correlation
clean coal
bench-scaletesting
computerexpert model
Figure 10 CQE™ process flow diagram (US DOE, 2001)
� screen alternative coals prior to test burns, collected expected impacts to help write test burnprocedures and evaluate results of tests burns;
� develop strategies to address emission limits;� support engineering studies to predict impacts of equipment modifications on overall unit
performance and economics;� document and standardise the coal procurement decision process.
Juniper and Pohl (1997) describe and assess the CQIM model, briefly, in an Australian producercontext whilst Conroy and Bennett (1996) and Bennett and Conroy (1997) examined the ability ofCQIM to predict the performance of Australian coals in processes that occur in a coal-fired powerplant. They considered that CQIM reduced the possible errors in using empirical correlations by usingthe known performance of one coal to calibrate its predictions for other coals fired in the same powerplant. They concluded that Australian coal producers should continue to evaluate future versions ofCQIM.
The CQE™ project scope included:� the collection and analysis of data to form the basis for the algorithms, methodologies and sub-
models used;� verifying the accuracy and integrity of the software;� coal characterisation, bench- and pilot-scale combustion testing, and full-scale utility boiler tests;� software development.
Harrison and others (1997) describe early experience with the CQE™ model. When the NETL reportDevelopment of a Coal Quality Expert™ a DOE assessment was published in 2000, CQE™ had beendistributed to about 25 utilities in the USA and to one in the UK, through EPRI membership(DOE/NETL, 2000). The CQE™ is a personal computer software package. It is a predictive toolwhich can help a coal-burning utility select the economically optimum coal for a specific boiler, basedon emissions constraints, operational efficiency, performance limitations and cost. The softwarepredicts the operating performance and associated costs of coals not previously used at the facility.Data obtained from bench-, pilot- and full-scale testing were used to develop, adapt and verify thealgorithms in the CQE™. Field tests in utility boilers were performed at six sites.
The goal of the project was to include information based on:� the characterisation and cleanability/washability assessments of various coals;� bench- and pilot-scale combustion testing of the coals in question;� full-scale utility demonstration tests.
The CQE™ utilises several previously existing models developed by EPRI (with US DOE support insome cases) as part of other programs and were not the focus of the CQE™ project including(US DOE, 2001):� Coal Quality Impact Model (CQIM): CQE™ uses the CQIM code to evaluate performance of
many auxiliary systems in coal-fired power plants. CQIM was developed by Black & Veatch(B&V) for the EPRI. The CQIM code can be used to perform maintenance/availability, derating,sensitivity and economic analyses as well as to model coal cleaning, blending and transportation.
� NOx Prediction Model (NOxPERT): NOxPERT predicts NOx emissions as a function of coalparameters, operating data and furnace type.
� Common Systems Evaluator: a program that models equipment systems serving more than oneunit at a plant.
� Acid Rain Advisor (ARA): ARA was designed to assist the user in evaluating options forcompliance with the Clean Air Act Amendments (CAAA). ARA provides the means to rapidlyselect combinations of SO2 reduction technologies at various units in a system while viewingsystem-wide results. It can be used either on a stand-alone basis, in conjunction with CQIM orwithin CQE™.
� Boiler Expert: a model that consists of two routines: slagging expert (SLAGGO) and fouling
41Expert systems and coal quality in power generation
Expert systems
expert (FOULER): – SLAGGO simulates the entire cycle of ash formation, deposit initiation, growth and removal
processes based on coal properties and boiler design and operating parameters. It consists ofseveral models and sub-models including ash formation, ash transport, deposit growth,thermal properties and deposit removal models as well as mineral matter transformation andalkali vaporisation sub-models; pyrite kinetics are excluded. Coal properties, boiler internalaerodynamics and transport mechanics are accounted for to predict changes in cleanliness ofthe waterwall and superheater tubes in the furnace. Deposit removal by soot blowing is alsomodelled;
– FOULER predicts convective pass fouling based on boiler design, temperature and gasdistributions, ash size and composition distributions, and soot blowing and load dropparameters. Thermal resistivities of each heat exchange section are utilised to iterativelycalculate boiler temperature profiles and cleanliness factor is determined from the differencein heat transfer between dirty and clean tubes. time intervals between soot blowing cyclescan be optimised with FOULER.
� CQE™ expands the boiler performance modelling capabilities of CQIM to interface with and useresults from these routines.
According to the US DOE (2001), CQE™ offers significant benefits in the selection of coal-basedfuels and in the design and operation of coal-fired power systems. It has the capability of predictingpower plant performance with a minimum number of bench-scale tests, resulting in lower cost toachieve the desired assessments compared with traditional approaches.
In practice, the uptake of this specific program has been limited, as it was largely aimed at andvalidated for a US market. It has now been largely superceded by Vista™, which is discussed in thenext section. Many of the larger utilities have effectively developed their own software based onsimilar principles and validated with the coals they are using. Coal choice is commonly more limitedthan is implied in some of the discussion about models.
5.2 Vista™
The new generation model of coal quality impact, Vista™, expands the capability of CQIM and hasbeen developed to meet the changing needs of the electricity generating industry (B&V, 2011). TheVista program is funded by a ‘User Group’ of between 22 and 25 utilities and energy companies whodevote resources to the continued improvement of the program. The User Group meets annually todiscuss potential technical enhancements and modifications to the program and uses both an‘Executive Committee’ of members and votes among the members at large to set in place the directionfor Vista development. The Vista program development consists of co-operative effort between threegroups: EPRI, who own the program; the Vista User Group, who fund the program and direct itsdevelopment; and Black & Veatch, who implement the directives of both the Vista User Group andEPRI (Anderson, 2011).
Vista quantifies the cost and performance impacts associated with burning alternate coals in a powerplant. It uses equipment-specific engineering models rather than generic correlations to evaluateperformance impacts with predictions based on equipment configuration and component informationcoupled with detailed calibration data supplied by the user. The model incorporates detailed predictiveperformance models for all equipment affected by the coal quality including a detailed steamgenerator heat transfer model. Further models are used to determine maintenance and availabilitycosts and derates. All models use calculations based primarily on engineering principles, and in somecases empirical formulas, and include the impacts of changes in performance of one system orcomponent on another. The primary task of Vista is to provide the user with total fuel-related costs foralternative coals on a system-by-system basis via a summary of projected performance. Thepredictions consider the following impacts for the combustion of each coal supply (B&V, 2011):
42 IEA CLEAN COAL CENTRE
Expert systems
� plant efficiency effects;� equipment system capacity;� auxiliary power requirements;� steam attemperation requirements;� propensity for slagging or fouling;� a variety of emissions-related calculations, including sulphur dioxide (SO2) and sulphur trioxide
(SO3), nitrogen oxides (NOx), particulate emissions (PM), stack opacity, CO and CO2 emissions,heavy metal emissions such as mercury, and acid gas emissions;
� maintenance costs;� waste disposal costs;� replacement power costs resulting from predictions of differential unit availability and capability;� fuel and fuel transportation costs.
Key features of Vista which were not available with CQIM include (B&V, 2011; Anderson, 2011):� Windows operating platform which eliminates the need for other operating systems and bring
Vista into the mainstream of supposed operating systems, simplifying internal product supportneeds;
� standalone, workgroup or corporate client/serve environments which provides flexibility in howVista can be used from single-user to corporate availability;
� data share via standard structured query language (SQL) databases facilitating external access tothe Vista data and allowing Vista to communicate with other corporate tools;
� user interface similar to other Windows products so that the user does not have to learn anentirely new interface structure;
� user third-party tools for report writing, thus optimising output flexibility and allowing usercustomisation;
� graphical representation of input unit data, simplifying the data input process and allowing avisual verification of configuration accuracy;
� modelling of dry FGD, SCR and SNCR systems, furnace sorbent injection, coal additives, fluegas (duct) sorbent injection, and active and passive mercury capture;
� ability to model stoker-fired units;� ability to model coal and oil cofiring, coal and gas cofiring or complete coal to gas or coal to oil
conversions;� extensive biomass-specific calculations with improvements in every area of the program;� ability to model components not handled directly by the calculations (that is, cyclone particulate
collectors) using a Black Box equipment item. A Black Box generally describes a complexelectronic product defined by its functional or operating characteristics and is packaged as asingular unit. The internal parts are typically hidden from view and little understood (Coker andothers (2006).
Vista also incorporates the following improvements which were not available in prior versions ofCQIM (B&V, 2011):� ability to input data using a variety of units, including ‘standard’ English and standard
international (SI) units;� improvements in the ability to model petroleum coke and other opportunity fuels;� improved mill drying analysis;� ability to model primary air fans dedicated to mills;� improvements for fan modelling especially in off-design operation;� ESP enhancements;� improved wet lime and limestone FGD modelling;� improvement maintenance/availability calculations including significant enhancements to the
Additional flexibility planned for future releases of Vista include (Anderson, 2011):
43Expert systems and coal quality in power generation
Expert systems
� implementation of new steam generator heat transfer model, which will expand the number ofboilers and steam cycles which can be directly modelled by Vista;
� ability to model carbon capture systems;� continued expansion of coal and biomass cofiring and biomass only fired boilers.
In summary, the Vista coal quality impact model/analysis provides a complete examination of theeffects of the coal on unit performance, availability, fuel costs, operation and maintenance costs andother parameters. This, combined with other information from the unit can be used to develop acomprehensive economic model of a power plant (B&V, 2011).
According to Eyre (2011), the evaluation of fuel quality impacts on power plant performance isimportant to ensure that the best value coals are purchased, rather than simply the cheapest coals. Thisis because the adverse impacts on ash saleability, emissions performance or unit efficiency canquickly negate the benefits of a slightly cheaper $/GJ coal price. As many different factors must beconsidered, computer models are ideal for assessing the true value of coals. While Vista is consideredthe most comprehensive model available for fuel quality assessment, Eyre (2011) notes that it takesappreciable time and effort to build and calibrate new Vista models. In order to obtain accurate results,a detailed power plant model developed by an experienced Vista user is required, otherwise results canbe misleading. While this can be a viewed as a negative, the advantage is that detailed calibrationensures that Vista’s predictions are fine-tuned to ones’s own specific power plant.
An advantage of Vista over simpler models is that it assesses impacts of fuel quality on power plantmaintenance and availability. While it is not always easy to validate these predictions against observedperformance, the very high level of detail Vista employs and the historic M&A database referenced byVista gives confidence in the results. Conversely, the evaluation of several other fuel quality impactscan be equally performed by much simpler tools. For example, calculations of fuel transportationcosts, emissions (especially CO2 and SO2), reagent demand and by-product (ash and gypsum) salesare relatively easy. Even more advanced calculations, such as impacts on boiler efficiency or auxiliarypower demand can be performed by any competent engineer. Overall, according to Eyre (2011),relatively simple, fast spreadsheet tools which can give 90% of the complete cost-in-use assessmentare generally sufficient for making correct fuel purchasing decisions, while Vista modelling can bevaluable for detailed engineering studies or major fuel-related projects.
5.3 The State Technologies Advancement Collaborative (STAC)project
The STAC is a collaborative project between the US DOE, National Association of State EnergyOfficials and the Association of State Energy Research and Technology Transfer Institutions. Theproject title is: ‘the use of real time measurement and artificial intelligence to improve efficiency andreduce emissions at coal-fired power plants’. The objectives of the project which are currently underdevelopment by the Energy Research Company (USA) are to develop a technique to measure coalproperties in real time and to process the data such that coal-fired electric utility operators can adjusttheir operation to avoid slagging and fouling (STACenergy, 2009).
The project involved laboratory coal measurements in which coal samples collected from powerplants that experience a range of problems typical of the power plant industry in relation to slaggingand fouling were measured. This was to define elemental concentrations that can be used to determineslagging and fouling indices for use to control boiler operations. Analysis was carried out with theLaser-Induced Breakdown Spectroscopy (LIBS). The data were analysed and a literature andtechnological review of coal/ash related slagging and fouling indicators were performed. According toRomero and others (2007) simulated coal tests were run in a custom-built LIBS analyser to determinethe capacity of the LIBS technology to detect the major elements present in the coals that are likely tohave an impact on slagging. An inventory was assembled and tested for coals used at utility boilers
44 IEA CLEAN COAL CENTRE
Expert systems
with a range of slagging propensities. Artificial neural networks were created to correlate the LIBSspectral signals to ash fusion temperature. In 2007, parametric tests were planned to be carried out at autility boiler to create a database to be used by an advisory expert system. Finally, an online advisoryexpert software would be deployed at the utility plant to work along with signals from the LIBSsystem and plant DCS, to recommend action for mitigating slagging (Romero and others, 2007).
The LIBS system was then installed at the Brayton Point 650 MW coal-fired plant to collect coalsamples which were then analysed. Three coals with distinct slagging/fouling characteristics wereprocessed through the LIBS system and indices determined from the elemental concentration analysiswere calculated. Parametric tests, coupled to the measurements made, were then performed. Fieldtests at the plant investigated the impact of the selected coals on boiler operation and emissions, inrelation to the differences in coal quality. The acquired data were analysed in terms of filtering data,determining trends and preparing the said data for artificial intelligence (AI) modelling anddevelopment. The demonstration results of the project were reported by Romero and others (2008).The results demonstrated that LIBS coal analysis performed on an hourly basis would be capable ofproviding feedback on ash deformation temperatures with sufficient resolution to alert the stationpersonnel to changes in as-fired coal quality. According to Romero and others (2008), by having atimely warning that the slagging potential of the coal ash has changed, the boiler operators would bein a position to take action to adjust the furnace exit gas temperature or initiate a more aggressivewater-wall or leading edge superheating soot blowing. These adjustments might involve parameterssuch as fuel air ratio, burner tilt angle, air register setting and mill loading patterns, depending on theboiler. Work on LIBS in the project continues. The results of the project upon completion will bedisseminated to other coal-fired power plants. Finally, a report detailing the project’s procedures,results and recommendations will be published (STACenergy, 2009).
5.4 Combustion optimisation systems
A key contributor to an overall expert system includes the methods used to optimise the coalcombustion in the boiler. This will be affected by coal quality, boiler cleanliness and equipmentdeterioration as well as by the even distribution of the pulverised fuel to the burners. In addition, theair supply to low NOx burners and to overfire air ports needs control.
Many of the variables, including fans, dampers, pumps and valves which control flows, can beoperated by the plant’s control system. Some methods model the furnace and make changes over timewhile others take measurements which can be used to change the operating conditions in real time.Either can be incorporated into an overall expert system.
Computational fluid dynamic (CFD) simulations can be used to improve the performance of systemsthroughout a power plant including combustion optimisation and thus improvements in efficienciesand reduction in emissions. There are numerous publications on the topic of CFD modelling in coal-fired plant including Moreea-Taha (2000), Stopford (2002), Schweitzer and others (2006) andLaborelec (2011).
There are a number of different systems (Spring, 2009b), including:� Zolo Technologies method for optimising combustion chamber conditions using turnable diode
laser absorption spectroscopy (TDLAS). This maps multiple paths across the fireball and canthus identify which burner may need tuning (Zolo Technologies, 2009).
� NeuCo’s CombustionOpt which combines neural network and model predictive controltechnologies to provide closed-loop optimisation of fuel and air mixing. It adjusts the controlsettings to position dampers, burner tilts, overfire air and other parameters (NeuCo, 2009). It hashelped more than 200 generating units to achieve reduced NOx emissions.
� the Babcock and Wilcox Flame Doctor which utilises signals from existing optical flamescanners to diagnose poor operation in individual burners (Babcock, 2009). By continuously
45Expert systems and coal quality in power generation
Expert systems
monitoring the status of all the burners, Flame Doctor makes it possible to optimise overallfurnace performance in spite of load changes, fuel quality variations and equipment deterioration.The current version is suitable for wall-fired and cyclone-fired units.
� ABB’s Predict&Control system which is based on combustion optimisation using advancedmodel predictive multi-variable controls. This has been applied at the Colstrip plant in Montana,USA where there are four units with a total capacity of 2094 MWe (2 x 307 MWe and2 x 740 MWe) using PRB subbituminous coal (Immonen and others, 2007). The background tothese developments is explained by Bonavita and others (2003).
� The Greenbank Group Advanced Instrumentation and Measurement (GAIM) StackMaster, whichis a real-time particle size analyser, and the PfMaster Coal Flow Monitoring System. The systemsare used for boiler optimisation. The GAIM StackMaster carries out an online, non-intrusivemeasurement of particulates in stack flue gas using laser technology. The PfMaster Coal FlowMonitoring System is designed for use on pulverised-coal feed into the boiler using sensors tomeasure the coal distribution and velocity during the feed. The system enables continuous onlinemeasurement, balancing and monitoring of the coal flow (The Greenbank Group UK, 2010).
The GE Energy Zonal™ combustion system measures local flue gas excess oxygen (O2) andcombustible gases, primarily carbon monoxide (CO), using a multi-point spatially distributedmonitoring grid placed in the upper back-pass region of a boiler. The System includes an array ofzonal combustion analysers in communication with the Zonal™ system interface providing systemlevel monitoring and control. The analysers comprise a sensor unit connected to a local controller viaa special cable. The analysers are located immediately outside the boiler and house an O2 sensor and athermistor combustibles sensor. The analysers draw exhaust gas flow through a particulate filter andprobe, across the sensors and return the gas to the boiler without the need for sample gas pumps andsample gas conditioning systems. The analysers are placed high in the boiler back pass where airin-leakage is minimal providing a more accurate measure of actual furnace excess air conditions. Alsoin this region the burner flow paths are highly stratified. This stratification along with the predominantboiler flow structure allows tracing of burners and overfire air to specific combustion sensors. Thesignals from the analysers are sent to the Zonal™ system interface computer for real-time combustionprofile topography mapping, data reduction, averaging and trending. The system allows operators torespond to poor combustion conditions rapidly, by adjusting boiler-operating conditions orredistributing air flows to select burners and overfire air injectors. Improving local combustionconditions allows the boiler to operate at reduced excess O2, reduced mean furnace exit gastemperatures, and lower carbon in ash levels (GE Energy, 2010; Widmer, 2011).
The Zonal™ System was recently installed on Lakeland Electric McIntosh Unit 3 (360 MW), opposedwall fired boiler equipped with overfire air. A series of baseline boiler tests were conducted todetermine how changes in overall excess O2, overfire air level, and local burner conditions affect zonalcombustion measurements. The trends in these measurements are used to illustrate how operators canutilise the system to monitor and improve local burner combustion conditions and overall boilerperformance (Nareddy and others, 2011). In June 2011, GE Energy started another Zonal system atLouisville Gas & Electric Mill Creek Unit 3. There are plans for further Zonal systems to be installedin the near future (Booth, 2011).
Boiler OP™ is an intelligent combustion optimisation software developed by the Energy ResearchCentre (USA) and the Potomac Electric Power Company (USA) (Sarunac and others, 2001). It utilisesan optimisation procedure that consists of the following three steps:� conduct parametric tests and build a database which relates the effect of boiler operating
parameters on emissions and performance-related parameters such as loss-on-ignition, steamtemperatures and heat rate;
� correlate the test data by riding spurious/errant points or outliners; develop a network model andverify it for accuracy and trending;
� employ an optimisation algorithm to determine optimal solutions based on optimisation objectivesand imposed constraints.
46 IEA CLEAN COAL CENTRE
Expert systems
The software combines an expert system, neural networks and an optimisation algorithm into a singleprogram. Boiler OP™ has been applied successfully to over 20 utility boilers, ranging in size from80 to 750 MWe. The NOx reductions achieved are between 15% and 35% (Wu, 2002).
Payson and others (2001) presented QuickStudy, an adaptive, model-predictive controller, developedby ESA/Environmental Solutions (USA). A dynamic model is built online during normal plantoperations or from historical data. The model is then used to predict future system trends so thatappropriate actions can be taken to optimise the process. The QuickStudy system contains up to16 predictive controller set-up (PCS) blocks. Each PCS consists of two closely-coupled subsystems:an adaptive signal processing element (ASPE) and a quadratic optimal controller (QOC). The ASPEcreates the process model in real time by minimising the difference between the predicted and actualprocess behaviour. Using the model prediction, the QOC then generates a control action thatminimises the projected future difference between the set point and the actual operating data. A PCScan accept up to 16 inputs including the output of another PCS. This allows construction ofde-couplers and general multiple input multiple output (MIMO) controllers. The adaptive processcontroller has several advantages including (Payson and others, 2001):� the models can be built from online or offline data;� the elimination of the need for plant tests;� the ability to control while learning;� capabilities for model management;� all parameters are visible to the user.
QuickStudy was installed on a 80 MWe single reheat drum-type boiler at Allegheny Energy SupplyAlbright Station (USA). The main objective was to reduce NOx emissions subject to all stackemission constraints, while maintaining optimum heat rate. The system reduced NOx emissions by anaverage of 15%. CO emissions were controlled below 250 ppm, and average opacity levels wereimproved slightly. In addition, there were no changes in furnace slagging conditions. The system alsoresulted in a minimum of 2% increase in the heat rate. The increase was considered to be due to lowerstack O2 levels, lower stack gas volumetric flow rates, and lower stack gas exit temperatures (Paysonand others, 2001).
Maxson (2005) presents Knowledge3™(Kn1, Kn2, Kn3) a platform for process modelling, optimisationand control, respectively. Rules written on the Knowledge3™ platform include mathematical andlogical operations, allowing the user to combine data for better and more detailed results. The rulescan also be used to visually alert users that an improper operating condition has occurred, or isdeveloping, allowing proactive intervention. The platform also allows the development of predictivemodels, using neural networks, for key outcomes resulting from a process. Knowledge3™ is designedto automatically retrain neural networks based on data acquired online, when their predictiveperformance has become inaccurate. In this way, the models are not static and accuracy is maintainedwhen conditions change. The optimisation tool uses the modelling described above to providepredicted results for a specified set of inputs. Control is achieved when coupling Knowledge3™ with adedicated control system to close the loop with the already determined optimised set points.Knowledge3™ comes with a graphical user interface that allows the product to be used offline oronline, thus permitting users to test and validate results, build models and perform diagnostics in bothreal time and archived environments. The interface is also configurable, allowing user to customise thelook and feel of individual screen s according to their needs (Maxson, 2005).
Voss and others (2009) discussed making the most of available assets (for example, existing coal-firedfleet) by using intelligent combustion optimisation software to upgrade boiler performance. Theauthors consider that in many cases software-based optimisation is the method of choice for upgradingexisting boilers as it offers the best achievable results cost-effectively or at cost-value ratio. Voss andothers (2009) declare that financial benefits are accomplished via numerous controllable-lossmanagement strategies, including excess O2 control, optimised air/fuel mixing, balancing oftemperature as well as reducing superheater and reheater spray flows, controlling emissions (NOx,
47Expert systems and coal quality in power generation
Expert systems
CO) and LOI (loss on ignition). Furthermore, the authors consider that in view of climate change, thereduction of greenhouse gas emissions, such as CO2, may offer further opportunities, that is bymarketing certified emission reductions. Typically, the payback of applying combustion optimisationis achieved within a year of utilisation. Thus the benefits of utilising such systems continue to accrueby providing ongoing annual savings that grow as the cost of fuel and environmental complianceincreases.
In 2002, the US DOE launched a Clean Coal Power Initiative (CCPI) to address 21st century energyissues through multiple solicitations. The CCPI-1 project established the application of advancedoptimisation software at Dynegy’s three-unit, 1768 MW Baldwin Energy complex located in Baldwin,Illinois (USA). NeuCo Inc, the project’s participant and technology provider, demonstrated fiveoptimisation products that were integrated through NeuCo’s ProcessLink® technology, see Figure 11.ProcessLink uses neural networks, expert systems, and fuzzy logic to link individual optimisationmodules to maximise specified performance objectives and operator priorities. These softwareproducts were developed to optimise the combustion and soot blowing processes, reduce the ammoniaconsumed by SCR systems, and improve unit thermal performance and plant-wide availability. Thesoftware installation was completed at the end of 2006 and was followed by a one-year evaluation anddocumentation period. Quantitative project benefits included: reduced NOx emissions by 12–14%;improved average heat rate (fuel efficiency) by 0.7%; increased available MWh by an estimated 1.5%;reduced ammonia consumption by 15–20%; and commensurate reductions in greenhouse gas,mercury, and particulates. These benefits translated to lower costs, improved reliability, and greatercommercial availability with significantly reduced environmental impacts. The optimisers,commercialised as part of this project, are expected to pay for themselves in well under one year whendeployed on typical plant types and fuel categories that comprise the US fossil power industry. Thisrepresents a highly cost-effective way of addressing some of the industry’s most pressing challengesand leverages the benefits of investments in SCR equipment, low NOx systems, and modern controland instrumentation systems (US DOE, 2009).
Many modern plants incorporate a continuous emissions monitoring system (CEMS) which may beable to contribute useful data relevant to boiler optimisation. This could be incorporated within anoverall expert system for a particular plant.
48 IEA CLEAN COAL CENTRE
Expert systems
MaintenanceOpt®streamlines detection, diagnosis and resolution of equipment and process anomalies
PerformanceOpt®pinpoints efficiency and capacity bottlenecks and their impacts
CombustionOpt®optimises fuel and air mixing to reduce
emissions and improve efficiency
SootOpt®dynamically directs boiler cleaning
actions toward achieving unit reliability,efficiency and emissions goals
In general, the overall expert system for controlling plant operations has to incorporate a number ofindividual contributions effectively involving control circuits covering parts of the plant.
These comprise principally:� the quantity and quality of the coal being fed to the pulverisers and hence to the burners;� the quantity and distribution of the air supplied to the burners and elsewhere;� the temperature and quantity of water supplied to the boiler walls;� the procedures for boiler and heat exchanger cleaning using soot blowers;� flue gas cleaning stages, including: – SCR for NOx reduction and removal; – an ESP or baghouse filter for particulate removal; – FGD for SO2 removal; and, in the future;
– carbon capture units to absorb most of the CO2 present.
In many places, the plant will also have to fit into the supply pattern from a number of differentgenerators supporting a market-led pricing structure. This means that the price paid for the powergenerated varies and it will almost certainly be most valuable at times of peak demand. Unplannedunit shut-downs can be particularly costly if alternative power sources have to be used to meetdemand.
Makansi (2005) discusses unifying process control and optimisation to achieve a sustainedperformance advantage in the market. He considers that integrating the many advanced applications,sensors and online analysers for control, automation and optimisation into a system can reflect processand financial objectives. One such technology is the PASS Monitoring, Energy and AssetManagement system which utilises one platform where data from online analysers and sensors areused for real-time decision making. For example, by interpreting real-time performance data, thesystem would provide information on how much ammonia the SCR system should be using at a giventime and the cost-benefit offset of that usage. It may also be used to advise on the best blend of coal tofire to minimise reagent use and maximise profit. The decisions are made based on the combined neteffect of real-time operational variables, performance and phenomena such as tube deterioration,deferred maintenance decisions, the coal heat content and ash characteristics and slagging. For worldsuppliers of automation systems for coal and other industries see Kirrmann (2010).
Hill (2009) presented his findings on application of data-driven combustion optimisation solutions tocase studies in two coal-fired units totalling 740 MW. Unit 1: 400 MW, wall-fired, load-following unitwith low NOx burners and overfire air (OFA) ports. The goal in this case study was optimisation forlow NOx emissions under low-load operation. Unit 2: 340 MW cyclone-fired, load-following unit alsowith OFA ports. The goal in the second case study was optimisation for stable cyclone flametemperature. Both units fire PRB subbituminous coal. According to Hill (2009) StatSoft PowerSolutions have developed a data-driven technology that:� uses all historical data routinely collected;� identifies in the data specific operational parameters that are critical for optimal boiler
performance;� builds data mining models, describing how exactly the important parameters affect the
performance of a furnace;� uses those models for combustion optimisation for robust, low-variability operations/
performance;� identifies optimised parameter ranges and relationships for critical operational parameters that can
be implemented into the existing control system.
Typical results for low NOx operations in Unit 1 showed lower NOx during testing and more robustperformance (that is, lower variability in NOx measurements with fewer or no spikes). Continuedimprovements were noted after formal validation testing ended. In Unit 2, the optimisation processresults showed higher flame temperatures and less variability in flame temperatures. Hill (2009)
49Expert systems and coal quality in power generation
Expert systems
concluded that:� the methods used in the case studies are applicable to any type of coal-fired furnace;� the only requirement is a process historian (that is a database that collected and stores operational
parameter data);� the techniques can be used to optimise boiler performance using the existing control systems and
methods;� the key for improved performance of any complex system (such as furnaces, SCR and selective
non-catalytic reduction (SNCR) processes) is optimisation in the presence of uncontrollableexternal factors (for example, fuel quality).
A substantial amount of software development was carried out during a unit optimisation project ofthe Hammond (USA) coal-fired facility. Turner and Mayes (2004, 2005) describe the development ofan integrated approach to unit optimisation and the development of an overall ‘unit optimiser’ that isable to resolve conflicts between individual optimisers. A demonstration project of the integratedapproach was conducted at Southern Company’s (USA) plant Hammond. The unit optimiser wasconsidered during the project together with the following individual optimisers:
� online thermal efficiency package;� Generic NOx Optimisation Control
Intelligent System (GNOCIS) boileroptimiser;
� GNOCIS steam side optimiser;� ESP optimisation;� Intelligent Soot-blowing System (ISBS).
The online thermal efficiency package is adetailed efficiency calculation for the powerunit. The calculation procedure started with adetailed (ultimate) coal analysis that isgenerally not available in real time. However,more recent developments in heat ratecalculation shows that coal composition canbe determined from online analysis of the fluegas composition. Figure 12 shows theprocedure for the online heat rate calculation.Following testing of the package goodagreement was noted between the results fromonline heat rate calculation and the ultimateanalysis methodology. However, a comparisonof a daily calculated online heat rate to anaccurate assessment showed that the onlinecalculation did not exhibit the same variabilityas is expected for plant operation during thatday. Turner and Mayes (2004) considered thatdevelopment of an online heat rate calculationwas an ambitious target and that the modelpredictions were not yet satisfactory.
GNOCIS, developed collaboratively by UK’sPowerGen and USA’s Southern Company andURS, is an online enhancement to DCS whichaims mainly to reduce NOx emissions andimprove boiler performance. It was one of thefirst closed loop optimisation systems installedon coal-fired boilers in the USA. As of
50 IEA CLEAN COAL CENTRE
Expert systems
Step 1: express fuel moisture and unburnt carbon in terms of molecular weight of SMAF coal using guessed coal analysis
Step 2: determine first approximation of coal analysisusing CEMS data on CO2, SO2 and O2
Step 3: determine all terms in the combustion equation
Step 4: calculate mass of flue gas and mass of air per unit mass of coal. Divide total air flow into its components. Perform energy balanceon boiler and obtain heat transfer to steam per unit mass of coal and losses per unit mass of coal
Step 5: calculate coal flow rate and higher heating value (HHV) of the coal
Step 6: is the difference between calculated HHV and input HHV less than 0.01%?
Figure 12 The procedure for the online heat ratecalculation (Turner and Mayes, 2004)
December 2001, GNOCIS has been installed on units representing more than 10,000 MWe ofgeneration capacity in both the USA and Europe. The system has achieved NOx reductions of morethan 10% and efficiency improvements of more than 0.5% (US DOE, 2001).
The new generation GNOCIS optimisation system, incorporates closed loop implementation,advanced neural network, and online learning techniques. It can accept information from severalsources including process, emissions and plant-wide cost data. The technology uses an integratedneural network based control system model of the combustion characteristics of the boiler that reflectboth short-term and long-term trends in boiler performance. It includes a radial basis function neuralnetwork engine and other proprietary code that interfaces with the control system and allows forcontinuous smooth optimisation. A constrained non-linear optimisation procedure is applied toidentify the best set-points for the boiler. The recommended set-points may be implementedautomatically without operator intervention (closed loop) or, at the operator’s discretion, displayed formanual implementation (open loop). The proprietary software ensures a smooth transfer of controlbiases into the DCS (Wu, 2002).
Turner and Mayes (2005) considered that the results of the project show the level of detail andcomplexity of optimiser modelling. The project also focused thinking on the actual application ofmultiple optimisers on a single unit. The authors recommended demonstration of the operation of theunit optimiser on a UK coal-fired power plant. A typical demonstration would include three separateoptimisers, namely:� emissions minimisation: GNOCIS to reduce NOx emissions and carbon in ash (CIA);� boiler optimisation: using online thermal efficiency modelling;� ESP optimisation: to optimise SO3 injection rate.
Turner and Mayes (2005) concluded that if several optimisers are installed on a unit then there shouldbe an audit of the variables controlled by each individual optimiser. The remote location of individualmodels/optimisers from a power plant distributed/digital control system (DCS) results in makingclosed loop installation difficult. Potential conflict between optimisers can be reduced by eitherprioritising the objectives of different optimisers (for example, environmental objectives achievedahead of efficiency objectives) or adding rules to optimisers (for example, including a steamtemperature model within the boiler optimiser, GNOCIS).
Dynamic NOx and heat rate optimisation at the Entergy White Bluff, Units 1 & 2, 800 MW coal-firedplant (USA) was discussed by Labbe and others (2006) and Coker and others (2006). The plant wasretrofitted with a modern DCS for the boiler and auxiliary controls in early 2000, which achievedsignificant control and ramp rate improvement. The modifications enhanced unit reliability, improvedthermal performance and provided continuous dispatch capability. However, in order to furtherimprove unit heat rate and reduce NOx emissions, while enhancing ramp rate capability, required adynamic optimisation approach that addressed unit limitations such as O2 and steam temperaturecontrol during unit ramping, coal mill changes and soot blowing. The optimisation process applied acombination of neural nets and model predictive control. The system achieved steam temperature andO2 control along with air damper optimisation resulting in NOx reduction of more than 15% and heatrate performance improvement approaching 1% with an estimated annual value of US$1 million(Labbe and others, 2006).
Coker and others (2006) also discussed the use of the model data and expert system for effective sootblowing at White Bluff which is equipped with a large number of soot blowers. Soot blowing servedseveral purposes including maintaining sufficient gas path openings to meet the air requirements forfull load, the prevention of large accumulation of slag that could have deleterious effects during slagfalls and the favourable distribution of energy for highest cycle efficiency. To achieve this the expertsystem, based on the model data, selects the most effective soot blower to meet the existing sootblowing requirements. The soot blower activates following an evaluation of satisfactory permissivelogic at the DCS level. The smart soot blowing automation system reduces the burden of soot blower
51Expert systems and coal quality in power generation
Expert systems
monitoring on the operator, soot blower steam consumption and soot blower tube erosion whileincreasing boiler efficiency and superheat steam temperature, thus contributing to the plant heat rateimprovements (Coker and others, 2006).
5.5 The ‘smart grid’
A new generation of software-based resources, technologies and devices are being introduced anddeployed to build what is called the ‘smart grid’ (Spring, 2009a; Charnah, 2009; Martini, 2009). Thisis a developing concept, but the ideas lying behind it are likely to become more widely deployed.According to ABB, a smart grid is a self-monitoring system, crossing international borders andparticipating in wholesale energy trading while providing a stable, secure, efficient andenvironmentally-sustainable network. The use of the smart grid would emphasise and integraterenewable generation, distributed generation and storage options, and include dispersed energystorage in electric vehicles. When established, the lines between generation, transmission, distributionand the consumer may become more blurred than they now are. For power generators, the smart gridmeans managing resources, integrating distributed generation and storage opportunities and gettingready for the growth in the use of plug-in electric vehicles.
In order to achieve the objectives of the smart grid, major developments are required:� in energy storage technologies. This presents major challenges, but work is ongoing, particularly
with the use of flywheels which can react in a matter of seconds to the system operators signal;� in the levels of grid monitoring and automation, particularly of the low voltage distribution
systems which are currently not well understood, and where there is limited information aboutthe condition and efficiency of the lines as well as about the amount of electricity being used;
� to provide more flexible conditions and meters which will allow for bi-directional flows of powerboth from and into the grid, so that small generators can supply the electricity they producewithout affecting the stability of the system;
� with the increased use of high voltage direct current transmission lines to transfer electricity overlong distances with minimal power losses (a concept which is commonly described as a supergrid);
� the cost structures used should encourage power usages including the charging of electricvehicles, in off-peak periods.
Mohseni (2010) discussed the passage of the American Recovery and Reinvestment Act of 2009, withUS$3.4 billion allocated to the development of a smart grid technologies. The Act is helping to drivenew utility sector investment in the USA. The technologies used to control power distribution gridsare likely to become ever more sophisticated, and the expert systems used to optimise the performanceof coal-fired generation units will need to fit into this new context.
According to Gruia (2011), a smart grid will enable utilities to:� increase power availability;� improve energy efficiency;� accommodate renewable power;� prepare for growing power load.
Gruia (2011) considers that a smart gird is increasingly being regarded as a way to drive the aim forincreasing efficiency in power generation. It is made up of three basic components: intelligent devices,two-way communications and information management. A smart grid overlays the electricitygeneration, transmission and distribution grid infrastructure with communication and informationinfrastructure to empower data collection and device control for energy management, efficiency andcost control. Gruia (2011) discusses helping utilities bridge the gap to smart grid, an emerging form oftelecommunication in the power industry.
52 IEA CLEAN COAL CENTRE
Expert systems
6 Conclusions
53Expert systems and coal quality in power generation
Coal quality, that is the properties of coal, affects many parts of a power plant including the coalhandling facilities, pulverising mills, boiler, air heater, ESP, ash disposal as well as stack emissions.Coals have different characteristics, and can have a heat content ranging widely, from 5 to 30 MJ/kg.The behaviour of a coal in a boiler is strongly influenced by the mineral matter and other impuritiesassociated with it. In particular, the mineral matter can form slagging and fouling deposits in theboiler. Coal properties can affect the efficient and consistent operation of both the boiler and theemissions control units. They therefore affect both the economics and short- and long-term operationof the plant. The major contributor to differences in coal properties is not only the mineral matter andother impurities but also the reactivity of the coal which is broadly associated with its rank.
The operation of coal-fired power plants involves multiple variables which have different levels ofimportance. Computer software in the form of neural networks and expert systems have been, andcontinue to be, developed to monitor, address and control, online, the many aspects of operation in acoal-fired power plant. These different expert systems need continuous development and validation indifferent locations, taking into account the many possible variations in plant design.
Typical application of real-time, online analysis in coal-based power generation include feed forwardand feed back control at mines, beneficiation plants and power plants. These systems can also providequality and control checks on shipments of coal and stockpiles (in the mine and/or power plant). Anumber of quality parameters and process variables can be measured and calculated with dedicatedonline analysers including moisture content, elemental content as well as sulphur, ash and the energycontent in the coal.
Real-time information allows mine/plant personnel or expert systems to make immediate decisionsand take necessary action to achieve best results. For example, real-time analysis which takes place ona conveyor belt gives a more representative result on immediate coal quality being fed into a furnacecompared to actual sampling and interference with the flow of the coal on the belt and the time lapsebetween the sampling and getting the laboratory results. Similarly, online monitoring and analysis ona boiler duct to measure carbon-in-ash can be used to improve boiler operation and thus result in afinancial benefit.
Coal analysis, laboratory and/or online, can determine which parts of a coal seam are extracted. Itprovides vital data relating to the design and operation of a coal preparation plant, and the informationestablishes the value of the coal product, and thus, broadly, the price at which it may be marketed andthe use to which it is put. For the power plant operator the analysis provides important informationwhich will affect the design, operation and economics of running the plant. This is because the qualityof the coal being used affects its heating value, the amount of ash deposition and corrosion in theboiler, and the costs associated with flue gas cleaning. However, laboratory and online methods ofanalysis have limitations, and for commercial users of coal it is important to understand what these arein order to make the best use of the information provided. This includes the data which are availableto be fed into the plant expert systems. The analysis is limited by the methodologies used which arenecessary to achieve reproducibility and consistency in the results obtained. These however, do notnecessarily represent or reproduce the conditions found during handling or inside the boiler andtherefore the behaviour of various impurities present.
Expert systems are software that behaves in much the same way as a human expert would in a certainfield of knowledge. An expert system is a class of computer programs developed by researchers inartificial intelligence during the 1970s and appeared commercially in the early 1980s. The programsare a set of rules that analyse information, usually supplied by the user of the system, about a specificclass of problems, as well as provide analysis of the problem and recommend a course of action for
correction. Every expert system consists of two principal parts: the knowledge base and the inferenceengine. The knowledge base contains both factual and heuristic knowledge. Factual knowledgeconsists of all information available to plant operators and included in the plant digital/distributedcontrol system (DCS). Heuristic knowledge is the less rigorous, more experiential and morejudgmental knowledge of performance. The knowledge base is used with either ‘if/then’ statements(condition and action). In an ‘if/then’ program, the ‘if part’ lists a set of conditions in some logicalcombination. Once the ‘if part’ of the rule is satisfied, the ‘then part’ can be carried out/concluded andthe appropriate action taken. Expert systems where knowledge is represented in rule form are calledrule-based systems. The inference engine makes inferences by determining which rules are satisfiedby facts, ordering the satisfied rules, and executing the rule with the highest priority.
Expert systems can be used to assess coal quality and to understand and manage the effects of itsvariations. These include computer programs which can be used to assess the practical impacts ofchanges in coal composition. The input to these programs can be based on empirical results and/or onmodelling various aspects of the process. The challenge is always to validate the outcomes. A numberof expert systems are available today for use in the coal-fired power generation field including at themine, in coal blending and the boiler feed system. Expert systems are used to assess the impacts ofcoal quality in the coal-fired power plant while other software aim to optimise the coal combustionprocess.
A new generation of software-based resources, technologies and devices are being introduced anddeployed to build a developing concept called the ‘smart grid’. A smart grid is a self-monitoringsystem, crossing international borders and participating in wholesale energy trading while providing astable, secure, efficient and environmentally sustainable network. The use of the smart grid wouldemphasise and integrate renewable generation, distributed generation and storage options.
A sustained performance advantage can be achieved by unifying process control and optimisation.Integrating the many advanced applications, sensors and online analysers for control, automation andoptimisation in a modern power plant into a unified system can reflect not only process performancebut also financial objectives. There are currently technologies in the market that utilise ‘one platform’where data from online analysers and sensors are used for real-time decision making. The decisionsare made based on the combined net effect of real-time operational variables, performance andphenomena such as tube deterioration, deferred maintenance decisions, coal heat content and ashcharacteristics and slagging.
Finally, and as stated above, expert systems are a recently-developed class of computer program thathave been in commercial use only since the beginning of 1980s. With the introduction of increasinglymore powerful and complex hardware and software, these systems will continue to develop and affectnot only coal-fired power generation but all aspects of energy production.
54 IEA CLEAN COAL CENTRE
Conclusions
7 References
55Expert systems and coal quality in power generation
Anderson A (2002) After the storm: the new bituminous coal landscape. Paper presented at theelectric power 2002 conference, St Louis, Missouri, USA, 19-21 Mar 2002, 10 pp (Mar 2002)http://www.myvistasource.com/Anderson A (2011) Black & Veatch (B&V), Overland Park, KS, USA. Personal communication;(7 Apr 2011)Anderson A, Deschaine R, Stallard S, Woodward R, Smolenack A (2007) 1+1=3: more from youronline coal analyzer. Black &Veatch/ThermoFisher Scientific, 12 pp, May 2007http://www.thermo.com/eThermo/CMA/PDFs/Product/productPDF_1663.pdfArnold B J, Klima M S, Bethell P J (2007) Designing the coal preparation plant of the future.Englewood, CO, USA, Society for Mining, Metallurgy and Exploration, 200 pp (2007)ASTM (2008) ASTM D7430-11 Standard Practice for Mechanical Sampling of Coal. vphttp://www.astm.org/Standards/D7430.htm (2008)ASTM (2009a) ASTM D5142-09 – Standard Test Methods for Proximate Analysis of the AnalysisSample of Coal and Coke by Instrumental Procedures. 5 pp,http://www.astm.org/Standards/D5142.htm (2009)ASTM (2009b) ASTM D3176 – 09 Standard Practice for Ultimate Analysis of Coal and Coke. 3 pp,http://www.astm.org/Standards/D3176.htm, (2009)Aykul H, Yalçin E (2004) Improvement of coal quality fed to power plant by using selectiveexcavation method at Seyitömer coal mines. In: Proccedings of the thirteenth internationalsymposium on mine planning and equipment selection 2004, Wroclaw, Poland 1-3 Sep 2004.Hardygóra M, Paszakowska G and Sikora M (eds.), London, UK, Taylor and Francis Group,pp 171-179 (2004)Babcock (2009) Field Engineering Services: Flame Doctor™. 3 pphttp://www.babcock.com/services/field_engineering_services/flame_doctor.html (2009)Barnes I (2009) Slagging and fouling in coal-fired boilers. CCC/147. London, UK, IEA Clean CoalCentre, 43 pp (Apr, 2009)Bartos F J (2005) Artificial intelligence: smart thinking for complex control. Milford, NH, USA, R.Morley Incorporated, 4 pp www.barn.org/pr01.htm (Nov, 2005)Belbot M, Vourvopoulos G, Paschal J (2001) A commercial on-line coal analyser using pulsedneutrons. Paper presented at the sixteenth international conference on applications of accelerators inresearch and industry, Denton, TX, USA, 1-5 Nov 2000, 4 pp (2001)Bennett P, Conroy A (1997) Project C3091: Australian coal quality impact model. Brisbane, Qld,Australia, Australian Coal Research Ltd, 3 pp (Aug 1997)Bethell P J (2007) Today’s coal preparation plant: a global perspective. Designing the coalpreparation plant of the future. B J Arnold, M S Klima, P J Bethell (eds.), Englewood, CO, USA,Society for Mining, Metallurgy and Exploration (SME), pp 9-19 (2007)B&V (2011) Introducing Vista™. Black & Veatch (B&V), Overland Park, KS, USA, 3 pp,http://myvistasource.com/files/vista/vistamain.htm (2011)Blenkinsop M (2003) Analysis advances. World Coal; 4 pp, www.worldcoal.com (2003) Bonavita N, Martini R, Matsko T (2003) Improvement in the performance of online controlapplications via enhanced modeling techniques. ERTC Computing, 27 pp, http://www05.abb.com/global/scot/scot267.nsf/veritydisplay/d4d83bd40816781c85256f9b005a4e4f/$File/Improvement%20in%20the%20Performance%20of%20Online%20Control%20Applications.pdf (2003)Booth M (2011) Irvine, CA, USA, General Electric Company, GE Energy, Power Services, BoilerOptimisation Services. Personal communication, vp (11 Jul 2011)Brummel H-G (2006) On-line monitoring of power plants. Berlin, Germany, Siemens PowerGeneration, 13 pp (2006)Bulsari A, Wemberg A, Anttila A, Multas A (2009) Combustion efficiency. World Coal. 18, (6);35-40, www.worldcoal.com (Jun 2009)Carpenter A M (1999) Management of coal stockpiles. CCC/23. London, UK, IEA Clean Coal
Centre, 65 pp (Oct 1999)Carpenter A M (2002) Coal quality assessment – the validity of empirical tests. CCC/63. London,UK, IEA Clean Coal Centre, 100 pp (Sep 2002)Cichoæ T (2004) Planning mines by digital methods. In: Proccedings of the thirteenth internationalsymposium on mine planning and equipment selection 2004, Wroclaw, Poland 1-3 Sep 2004.Hardygóra M, Paszakowska G and Sikora M (eds.), London, UK, Taylor and Francis Group, pp 7-12(2004)Cierpisz S (2001) Application of computer-based monitoring and control systems in coal preparationplants. In: Proceedings of the international conference on challenges in coal and mineralbeneficiation, Dhanbad, India, 7-8 Dec 2001. New Delhi, India Tata McGraw-Hill PublishingCompany Limited, pp 3-13 (Dec 2001)Charnah R (2009) Smart grids – how do we get there? Energy World; 376; 2 (Nov 2009)Clark D Harrison C D, Kehoe D B, O’Connor D C, Stallard G S (1997) Recent Experience withthe CQE™, 16 pp, http://www.netl.doe.gov/publications/proceedings/97/97cct/cct_pdf/97CCT1_1.PDF (1997)CoalTrans International (1997) Coal sampling and analysis: redefining the definitions. CoalTransInternational; 12 (1); 30-36 (Feb 1997)CoalTrans International (1998) Sampling and inspection: seeing to be coping with quality.CoalTrans International. 13 (1); 34-41 (Feb 1998)Coker S, Labbe D, Speziale A (2006) Netting a model predictive combo. InTech, 4 pp (Jul 2006)Cole R, Frank R (2004) Coal quality impacts on power generation. CPSA Journal; 3 (2); 10-15(Summer 2004)Connor S (2009) Alternative contract models increase the options for power generators. PEi, PowerEngineering International; 17 (5); 26-29, www.peimagazine.com (May 2009) Conroy A, Bennett P (1996) Australian coal quality impact model. Mulgrave, Victoria, Australia,Australian Coal Industries Research Laboratories Ltd (ACIRL), 2 pp, www.acarp.com.au (Oct 1996) Couch G R (1990) Lignite upgrading. IEACR/23. London, UK, IEA Coal Research, 72 pp (May1990)Couch G (1994) Understanding slagging and fouling during pf combustion. IEACR/72, London,UK, IEA Coal Research, 118 pp (Aug 1994)Couch G R (1996) Coal preparation – automation and control. IEAPER/22. London, UK, IEA CoalResearch, 61 pp (Feb 1996)Couch G R (2004) The potential for coal use in Pakistan. CCC/83. London, UK, IEA Clean CoalCentre, 39 pp (Apr 2004)Couch G R (2006) Ash management in coal-fired plants. CCC/118. London, UK, IEA Clean CoalCentre, 69 pp (Oct 2006)Couch G R (2009) Underground coal gasification. CCC/151. London, UK, IEA Clean Coal Centre,129 pp (Jul 2009)Crocker G, Kovalchuk A (2008) Prospects for coal and clean coal technologies in Russia.CCC/138, London, UK, IEA Clean Coal Centre, 56 pp (Oct 2008)Davis V L Jr (2007) Future challenges in coal preparation plant design and operation. Designing thecoal preparation plant of the future. B J Arnold, M S Klima, P J Bethell (eds.), Englewood, CO,USA, Society for Mining, Metallurgy and Exploration (SME), pp 21-29 (2007)DOE/NETL (2000) Development of a Coal Quality Expert™. A DOE assessment.http://www.osti.gov/bridge/purl.cover.jsp;jsessionid=047EC7166EFF8F6465393E3C28314516?purl=/68100-pLgMXF/webviewable/, 19 pp (Nov 2000)Dong N (2011) Utilisation of low rank coals. CCC/182, London, UK, IEA Clean Coal Centre, 92 pp(Apr 2011)Drax Group plc (2009) Annual report and accounts 2008. Selby, North Yorkshire, UK, Drax Powerplc, 4 pp, http://www.draxgroup.plc.uk (2009)Drenckhahn W, Riedle K (2005) Customer benefit and power plant development. VGB PowerTech.85, (5); 77-83 (2005)DTI (2001a) Pulverised fuel (PF) flow measurement and control methods for utility boilers.Technology status report 014; London, UK, Department of Trade and Industry (DTI); 14 pp (Jan 2001)
DTI (2001b) Coal Preparation. Technology status report 015; London, UK, Department of Tradeand Industry (DTI); 14 pp (Jan 2001) http://www.berr.gov.uk/files/file19296.pdfEdwards M (2004) Regarding quality . . . World Coal; 13 (12); 45-47, www.worldcoal.com (Dec2004)Edwards M, Harris A, Smith K (2005) Analysis matures. World Coal; 14 (12); 41-46,www.worldcoal.com (Dec 2005)EIA (2009) Coal production 1949-2008. Energy Information Administration. Annual Energy Review2008, http://www.eia.doe.gov/emeu/aer/pdf/pages/sec7_6.pdf, 1 pp (2009)Engelmore R S, Feigenbaum E (1993) Expert systems and artificial intelligence, 5 pp,http://www.wtec.org/loyola/kb/c1_s1.htm (May 1993)EPRI (1999) On-line analysis of heating value. TE-113817, Palo Alto, CA, USA, Electric PowerResearch Institute (EPRI), 84 pp (Nov 1999)Eyre D (2011) Fuel Technology, E.ON New Build & Technology Limited, Technology Centre,Ratcliffe-on-Soar, Nottingham, UK. Personal communication, vp (30 Jun 2011)France G (2005) Under control. World Coal; 14 (6); 19-21, www.worldcoal.com (Jun 2005)Foster S (2004) Two case studies – use of across-the-belt analysers to meet train quality targets.Paper presented at the international on-line coal analyser technical conference, St. Louis, Missouri,USA, 8-10 Nov 2004, 17 pp (Nov 2004)Foster S (2006) Using a nuclear elemental static sample analyzer to optimize the operation of apreparation plant. Paper presented at the Coal Prep 2006, coal & aggregate processing exhibitionand conference, Lexington, KY, USA, 1-4 May 2006; 18 pp (2006)Fuel Tech (2009) Technologies to enable clean efficient energy. www.ftek.com, vp (2009)Gelbar D, Kunkel R C (2002) Optimizing boiler design for PRB coal. Power; 146 (6); 66-74 (Sep2002)GE Energy (2010) Zonal* Combustion Tuning System: fact sheet. Irvine, CA, USA, General ElectricCompany, 2 pp (May 2010)Gruia R (2011) Helping utilities bridge the gap to smart grid. Mountain View, CA, USA, Frost &Sullivan, www.frost.com, 17 pp (2011)Harrison C D, Kehoe D B, O’Connor D C, Stallard G S (1997) Recent experience with theCQE™. Pittsburgh, PA, USA, National Energy Technology Laboratory (NETL), 16 pp,http://www.netl.doe.gov/technologies/coalpower/cctc/resources/pdfsprog/cctcnf95/97CCT1_1.PDF(Nov 1997)Hatt R (1998) Coping with coal quality impacts on power plant operation and maintenance. paperpresented at the Eleventh Utility Coal Conference, St Louis, MO, USA, 23-25 Feb 1998, 3 pp,http://www.coalcombustion.com/PDF%20Files/Coping103.pdf (1998)Hatt R (2007) Looking even closer. World Coal; 16 (12); 39-42, www.worldcoal.com (Dec 2007)Hedvall C, McKenzie F (2007) First response. World Coal; 16 (12); 37-38, www.worldcoal.com(Dec 2007)Hennessy M J, Pain A, Edwards M (2007) Looking online. World Coal; 16 (5); 47-48,www.worldcoal.com (May 2007)Hill T (2009) Optimization strategies based on historical data for existing coal burning furnacetechnologies. Paper presented at the 2009 energy and environment conference, Phoenix, AZ, USA,1-4 Feb 2009. www.statsoftpower.com, Tulsa, OK, USA, StatSoft Power Solutions, 22 pp (2009)Honaker R Q, Luttrell G H, Bethell P (2007) Status of current coal preparation research.Designing the coal preparation plant of the future. B J Arnold, M S Klima, P J Bethell (eds.),Englewood, CO, USA, Society for Mining, Metallurgy and Exploration (SME), pp 181-198 (2007)IEA (2009) Coal information 2009. Paris, France, OECD/IEA, vp (2009)Immonen P, Matsko T, Antoine M (2007) Efficiency up, emissions down. Wickliffe, OH, USA,ABB Utility Automation System, ABB Review 4; 53-57 (2007)http://www05.abb.com/global/scot/scot267.nsf/veritydisplay/a6a75a9549dd32ae85257404004c5041/$File/ABB_Review_07.pdfJuniper L, Pohl J (1997) What price coal quality in electric power generation. The Australian CoalReview; 37-41 (July 1997)Kavouridis K V, Pavloudakis F F (2007) Evaluation of an on-line analysis system for low-grade
57Expert systems and coal quality in power generation
and inhomogeneous Greek lignite. Energy & Fuels; 21 (4); 2204-2211 (7 Jun 2007)Kawalec W (2004) Short-term scheduling and blending in a lignite open-pit mine with BWEs. In:Proccedings of the thirteenth international symposium on mine planning and equipment selection2004, Wroclaw, Poland 1-3 Sep 2004. Hardygóra M, Paszakowska G and Sikora M (eds.), London,UK, Taylor and Francis Group, pp 53-59 (2004)Kirrmann H (2010) Automation overview. Baden, Switzerland, ABB Research Centre, EcolePolytechnique Fédérale de Lausanne, 17 pp (Jan 2010)Laborelec (2011) Computational fluid dynamics (CFD). www.laborelec.com, vp (2011)Labbe D, Hocking B, Ray B, Anderson J, Klepper P (2006) Dynamic NOx/heat rate optimization.Paper presented at the 16th annual joint POWID/EPRI control and instrumentation conference, 49th
annual ISA POWID symposium, San Jose, CA, USA, 4-9 Jun 2006, 11 pp (2006)Laurila M J (1997) Standard sampling and analysis. Coal Age; 102 (11); 43-44 (Nov 1997)Laurila M J, Corriveau M P (1995) The sampling of coal. The practice of quality control in coalprocessing and utilization. Chicago, IL, USA, Intertec Publishing, vp (1995)LCN (2009) Coal shortages plague NTPC stations. London commodity news. London CommodityBrokers, 7 (21 Jul 2009)Lenk U, Voigtländer P (2002) Power generation technologies in liberalised markets: potential andrisks. VGB PowerTech: 82 (6); 32-38 (2002)Lim C S, Abernethy D A (2004) On-line coal analysis using fast neutron-induced gamma-rays.Paper accepted for publication in Applied Radiation & Isotopes as part of the conferenceproceedings of the 8th international conference on applications of nuclear technology, Crete, Greece,Sep 2004, 13 pp (2004)Lim C S, Abernethy D A (2005) On-line coal analysis using fast neutron-induced gamma-rays.Applied Radiation and Isotopes; 63; 697-704 (2005)Liu D H F, Lipták B G (2003) Coal analyzers. In: Instrument engineers handbook, fourth edition,volume one: process measurement and analysis. Lipták B G (ed). Boca Raton, FL, USA, CRC Press.pp 1295-1298 (27 Jun 2003)Ma Z, Iman F, Lu P, Sears R, Kong L, Rokanuzzama A S, McCollor D P, Benson S A (2007) Acomprehensive slagging and fouling prediction tool for coal-fired boilers and itsvalidation/application. Fuel Processing Technology; 88; 1035-1043 (2007)Magni L, Paderno J, Pretolani F (2005) Kalman filter estimation of the coal flow in power plants.Paper presented at the 44th IEEE conference on decision and control, and the European controlconference, Seville, Spain, 12-15 Dec 2005, MolB 18.2, pp 1270-1275 (2005)Makansi J (2005) Unifying process control and optimization. Power; 149 (7); 56-63www.powermag.platts.com (Sep 2005)Makansi J (2001) Online coal analysis. World Coal; 10 (12); 35-40, www.worldcoal.com (Dec2001)Martini F (2009) Switching on the vision – towards smart grids. Energy World; 376; 14-17 (Nov 2009)Mathew P J, Aylmer J A, Barker D, Dow J C, Phillips P L, Vogel M (1993) Natural gamma ashgauges for coal stockpiles and wagons. Report no. 1466, Project no. C146, CSIRO Division ofMineral & Process Engineering, Clayton, South VIC, Australia, vp (Jul 1993)Maxson A (2005) Knowledge3™: a platform for process modelling, optimization, and control.ORBIT; 25 (3); 18-24, http://www.ge-mcs.com/download/bently-nevada-software/3q05_kn3.pdf(2005)McCartney R H, Williams R L Jr. (2009) Fuel blending with PRB coal. Power Engineering;113 (3); 54-60 (Mar 2009)McGinnis D G, Rader P C, Gansley R R, Wang W (2009) Cliffside 6 integrated emissions controlsystem. Power Engineering; 113 (4); 38-47 (Apr 2009)MCR (2011) McCloskey Coal Report (McCloskey Coal Information Services). Market round up:Asian and NW Europe steam coal markers. 252; 1 (28 Jan 2011)Mitas D, Stallard S, Anderson-Higgs A, O’Connor D (1991) Coal quality analysis linked to powerplant control. Power Engineering; 29-32 (May 1991)Mohseni M (2010) Smart grid: from concept through completion. Solutions; 31 (1); 6-7 (Summer2010)
Moreea-Taha R (2000) NOx modelling and prediction. CCC/31, London, UK, IEA Clean CoalCentre, 49 pp (Apr 2000)Nalbandian H (2004) Air pollution control technologies and their interactions. CCC/92, IEA CleanCoal Centre, London, UK, 75 pp (Nov 2004)Nalbandian H (2005) Online analysis and coal-fired power plants. CCC/100, London, UK, IEAClean Coal Centre, 66 pp (Sep 2005)Nalbandian H (2009) NOx control for coal-fired plant. CCC/157, London, UK, IEA Clean CoalCentre, 51 pp (Oct 2009)Nalbandian H (2010) Propensity of coal to self-heat. CCC/172, London, UK, IEA Clean CoalCentre, 47 pp (Oct 2010)Nalbandian Soud (2000) Developments in FGD. CCC/29, IEA Clean Coal Centre, London, UK,85 pp (Mar 2000)Nareddy S, Swanson L, Widmer N C, Krajna A (2011) Zonal* Combustion Monitoring System atLakeland Electric, McIntosh unit 3. Paper presented at the EUEC 2011 14th annual conference,Phoenix, AZ, USA, 31 Jan-2 Feb 2011, vp (2011)NeuCo (2009) CombustionOpt®. http://www.neuco.net/solutions/combustionopt/default.cfm (2009)Odgaard P F, Mataji B (2005) Estimation of moisture content in coal in coal mills. Aalborg,Denmark, Department of Control Engineering, Aalborg University, 6 pp (2005)OECD (2003) Glossary of statistical terms. Expert system,http://stats.oecd.org/glossary/detail.asp?ID=3384 (Mar 2003)Okamoto A (1998) Evaluation method for thermal coal quality (Japan) (III). Coal and Safety; (12);18-39 (Mar 1998)Osborne D, Hall R (1997) Characterisation in production and transportation of thermal coal. TheAustralian Coal Review; 29-32 (Nov 1997)Page D (1998) On-line coal quality monitoring. In: Proceedings of the XIII international coalpreparation congress, Brisbane, Qld, Australia, 4-10 Oct 1998. Indooroopilly, Qld, Australia,Australian Coal Preparation Society, Volume 2, pp 439-449 (1998)Payson E P, Burge R L, Kowalcheck J L, Schrecengost R A (2001) Adaptive process controllershaves NOx and cuts heat rate. Power Engineering; 105 (9); 70-74 (Sep 2001)Poncia G (2003) Chapter 7: multivariable power plant control. In: Thermal power plant simulationand control, D Flynn (ed.), Stevenage, Hertfordshire, UK, Institution of Engineering and Technology(IET), pp 179-202, www.knovel.com (2003)Powitec (2011) PiT Navigator for coal-fired steam generator. Essen, Germany, Powitec IntelligentTechnologies GmbH, vp, www.powitec.de (Apr 2011)Quick W (2004) Requirements for coal characterisation: a power generator’s view. Presented at theCoal Research Forum (CRF) 4th annual meeting, EDF Cottam Power Station, Cottam, UK, 19 May2004, 16 pp (May 2004)Rajoo P (2011) Johannesburg, South Africa, Eskom Technology Division, Research & DevelopmentDepartment, Fuels and Combustion Technologies. Personal communication, vp (27 June 2011)Reagan P (1999) Sampling innovations. World Coal; 8 (4); 28-34, www.worldcoal.com (Apr 1999)Reagan P, DeMatteo J (2007) Sampling considerations. World Coal; 16 (5); 41-45,www.worldcoal.com (May 2007)Renner C (1999) Applying on-line analysis. World Coal; 8 (6); 55-60 (Jun 1999)Richie M, Edwards M (2009) Natural gamma monitoring. World Coal; 18 (9); 29-32;www.worldcoal.com (Sep 2009)Roberts J (2009a) On-line system makes light of coal particle size analysis. Modern Power Systems;29 (8); 33-35 (Aug 2009)Roberts J (2009b) Measuring up. World Coal; 18 (8); 34-38, www.worldcoal.com (Aug 2009)Romero C E , Yao S, Moreno R X, Weisberg A, Craparo J, Mulligan L, De Saro R (2007) UsingLaser-Induced Breakdown Spectroscopy (LIBS) measurements for coal qulaity monitoring andupgraded power plant control. In: Proceedings of the 2007 conference on environmental monitoring,evaluation, and protection, Albany, NY, USA, 15-16 Nov 2007. Bethlehem, PA, USA, LehighUniversity, http://www4.lehigh.edu/default.aspx, vp (2007)Romero C E , Yao S, Moreno R X, Harlow D G, Delph T, Ozturk M (2008) Laser measurement
59Expert systems and coal quality in power generation
of coal ash composition demonstrated at power plant. Lehigh Energy Update; 26 (2); 2 pp (Jul 2008)http://www4.lehigh.edu/default.aspxRoumpos C, Akylas N, Terezopoulos N (2004) A decision making model for lignite depositsexploitability. In: Proccedings of the thirteenth international symposium on mine planning andequipment selection 2004, Wroclaw, Poland 1-3 Sep 2004. Hardygóra M, Paszakowska G and SikoraM (eds.), London, UK, Taylor and Francis Group, pp 721-726 (2004)Rozendaal C M, Witkamp J G, Meijer R, Benneker R J M, Hoogendoorn A (1998) Performanceprediction in advanced coal fired boilers. Contract no. JOF3-CT95-0005; project area 2-project 201;Laboratory and full scale blending studies. Arnhem, Netherlands, KEMA, 48 pp ftp://ftp.euro-cleancoal.net/pub/pdf/JOF3-CT95-0005-pdf-files/JOF3-CT95-0005-201-Rozendaal-KEMA.pdf(1998)Sarunac N, Romero C E, Levy E K, Weston W C (2001) Anatomy of a successful combustionoptimization project. In: Proceedings of the MEGA symposium, Chicago, IL, USA, 20-23 Aug 2001.Air & Waste Management Association (2001)Schimmoller B K (2003) Coal and ash handling: in search of cost savings. Power Engineering;107 (4); 22-27, www.power-eng.com (Apr 2003)Schweitzer Y, Cartina G, Chudnovsky B (2006) Application of neural network combined withCFD modelling and combustion tuning in large coal-fired boilers. Paper presented at the ASME 2006power conference (Power 2006), Atlanta, GA, USA, 2-4 May 2006, pp 417-428 (2006)Schiffer H-W (2006) All around the world. World Coal; 15 (1); 25-30, www.worldcoal.com (Jan2006)Schuster H, Penterson C (2002) Experience with various coals in power plants in the United Statesand Europe. Danvers, MA, USA, Babcock Borsing Power Inc, 18 pphttp://www.babcockpower.com/pdf/t-175.pdf (2002)Sehgal R, Hickinbotham A (2001) TransAlta adopts dynamic coal blending to deliver the right fuelat the right time. Power Engineering; 105 (11); 86-88 (Nov 2001)Sehgal R, Shea S (2001) Dynamic coal blending helps improve the bottom line. Power; 145 (3);59-62, http://findarticles.com/p/articles/mi_qa5392/is_200105/ai_n21474387/pg_2/?tag=content;col1(May/Jun 2001)Seltzer M D, Meyer G A (1997) Inductively coupled argon plasma continuous emissions monitorfor hazardous air pollutant metals. Environmental Science and Technology; 31 (9); 2665-2672 (1997)Shea S, Sehgal R, Maxson A, Celmins I (2002) Demonstration of an advanced integrated controlsystem for simultaneous emissions reduction. Final Technical Report. DOE Project No. DE-AC22-95PC95254, http://www.osti.gov/bridge/servlets/purl/794282-0DZnCl/native/794282.pdf, 301 pp(Feb 2002)Smyrniotis C (2005) Computer modelling brings slag control into the 21st century. Power; 149 (8);61-62 (Oct 2005)Soud H N (1995) Developments in particulate control for coal combustion. IEACR/78, London, UK,IEA Coal Research, 57 pp (Apr 1995)Speight J G (2005) Handbook of coal analysis. Hoboken, NJ, USA, John Wiley & Sons, 240 pp(2005)Spring N (2009a) The smart grid and generation. Power Engineering; 113, (9); 44-50 (Sep 2009)Spring N (2009b) Putting combustion optimisation to work. Power Engineering; 113, (5); 44-48(May 2009)STACenergy (2009) The use of real time measurement and artificial intelligence to improveefficiency and reduce emissions at coal-fired power plants. State Technologies AdvancementCollaborative, www.stacenergy.org, 5 pp (2009)Stopford P J (2002) Recent applications of CFD modelling in the power generation and combustionindustries. Applied Mathematical Modelling; 26 (2); 351-374 (Feb 2002)TA-129 (2009) Thermal analysis application brief. Proximate analysis of coal and coke.http://www.tainstruments.co.jp/application/pdf/Thermal_Library/Applications_Briefs/TA129.PDF,Tokyo, Japan, TA Instruments Japan, 2 pp (2009)Taylor P M (2001) Natural gamma technology put to the test. World Coal; 10 (12); 51-53www.worldcoal.com (Dec 2001)
The Greenbank Group UK (2010) Greenbank enhancing performance. www.greenbankgroup.com,Woodville, Derbyshire, UK, 8 pp (2010)Thermo Electron Corp (2005)Woburn, MA, USA, Thermo Electron Corporation, vp,http://www.thermo.com/com/cda/product/detail/1,1055,14590,00.html (2005)Tillman D, Duong D (2007) Managing slagging at Monroe power plant using on-line coal analysisand fuel blending. Fuel Processing Technology; 88; 1094-1098 (2007)Trecazzi C S, Clemente F A, Freme F L, Keen D L, Luppens J A, Pierce B S, Rockey C F,Welham K (2007) Working document of the NPC global oil & gas study. Washington DC USA,National Petroleum Council, Coal Impact Subgroup of the Demand Task Group of the NPCCommittee on Global Oil and Gas, 53 pp (Jul 2007)Turner D M, Mayes I (2005) Advanced optimisation – coal fired power plant operations. Reportnumber: COAL R279, DTI/Pub URN-05/660, Nottingham, UK, E.ON Uk, PoweTechnology Centre,29 pp (Mar 2005)Turner D M, Mayes I (2004) Advanced optimisation of coal-fired power plant operations – finalproject report. DTI P140, Ratcliffe-On-Soar, Nottinghamshire, UK, Power Technology, 29 pp (Aug2004)US BLM (2009) US Bureau of Land Management. Powder River Basin Coal Production,http://www.blm.gov/wy/st/en/programs/energy/Coal_Resources/PRB_Coal/production.htmlUS DOE (2001) Clean coal technology: software systems in clean coal demonstration projects.Topical report number 17; Washington, DC, USA, US Department of Energy; 20 pp (Dec 2001)US DOE (2007) Power plant optimization demonstration projects. Albany, OR, USA, USDepartment of Energy (US DOE), National Energy Technology Laboratory (NETL), 27 ppwww.netl.doe.gov (Sep 2007)US DOE (2009) Clean coal technology programs: program update 2009: includes power plantimprovement initiative (PPII) and clean coal power initiative (CCPI) projects. Washington, DC, USA,US Department of Energy (DOE), 100 pp (Oct 2009)Van Kroonenberg L J (1996) XRF-analysis at a power plant. Amsterdam, Netherlands, NVEnergieproduktiebedrijf UNA (Power Production Company UNA), 6 pp (Oct 1996)Vesel R (2009) The million dollar annual payback. Power Engineering; 113 (7); 72-76, www.power-eng.com (Jul 2009)Voss A, Hlawenka A, Haug M, Schreiber M (2009) Making the most of available assets – howintelligent add-on technology helps to upgrade boiler performance. VGB PowerTech; 89 (6); 73-76(2009)Walker S (2000) Major coalfields of the world. CCC/32. London, UK, IEA Clean Coal Centre,131 pp (Jun 2000)Wall T, Elliott L, Sanders D, Conroy A (2001) A review of the state-of-the-art in coal blending forpower generation: final report – project 3.16. Technology assessment report 14, Callaghan, NSW,Australia, Advanced Technology Centre, The University of Newcastle, 93 pp (May 2001)Ward C R (1984) Chemical analysis and classification of coal. In: Coal geology and coaltechnology. Ward C R (ed), Melbourne, Vic, Australia, Blackwell Scientific Publications, pp 40-73(1984)Ward C R (2002) Analysis and significance of mineral matter in coal seams. International Journalof Coal Geology; 50; 135-168 (2002)Welch G, Bishop G (2006) An introduction to the Kalman Filter. TR 95-041, Chapel Hill, NC, USA,Department of Computer Science, University of North Carolina at Chapel Hill, 16 ppwww.cs.unc.edu/~welch and www.cs.unc.edu/~gb (Jul 2006)Widmer N (2011) Irvine, CA, USA, General Electric Company, GE Energy, Power Services, BoilerOptimisation Services. Personal communication, vp (2 Jun 2011)Whitworth S, Shah S, Zhuang H (2006) DCS Integration for Intelligent Sootblowing. ElectricPower 2006, Atlanta, GA, USA, 9 pp, http://www.clydebergemann.com/_upload/ISB_DCS_Integration.pdf?documentID=41688 (2006)Woodward R (2005) Precision sorting. World Coal; 14 (12); 35-40, www.worldcoal.com (Dec 2005)Woodward R (2007) Coal analyzers applied to coal cleaning: the past, present and future. Designingthe coal preparation plant of the future. B J Arnold, M S Klima, P J Bethell (eds.), Englewood, CO,
61Expert systems and coal quality in power generation
USA, Society for Mining, Metallurgy and Exploration (SME), pp 135-143 (2007)World Coal Association (2010) Coal facts 2010: coal statistics. London, UK, World CoalAssociation, 3 pp (Sep 2010)Wu Z (2002) NOx control for pulverised coal fired power stations. CCC/69, London, UK, IEA CleanCoal Centre, 64 pp (Dec 2002)Zehner H P (2002) Characterisation of power plant coals. VGB PowerTech; 9; 36-43 (2002)Zhu Q (2003) Developments in particulate control. CCC/72, London, UK, IEA Clean Coal Centre,50 pp (Sep 2003)Zolo Technologies (2009) About Zolo Technologies Inc, http://www.zolotech.com/sub/about-us/index.php (2009)