AMEC Environment & Infrastructure, a division of AMEC Americas Limited Suite 600 - 4445 Lougheed Highway, Burnaby, BC Canada V5C 0E4 Tel +1 (604) 294-3811 Fax +1 (604) 294-4664 www.amec.com MOUNT POLLEY MINE Tailings Storage Facility 2011 Construction As-Built Report and Annual Review Submitted to: Mount Polley Mining Corporation, Likely, BC Submitted by: AMEC Environment & Infrastructure, a division of AMEC Americas Limited Burnaby, BC 06 April 2012 VM00560A AMEC010594_0001
Transcript
AMEC Environment & Infrastructure, a division of AMEC Americas Limited Suite 600 - 4445 Lougheed Highway, Burnaby, BC Canada V5C 0E4 Tel +1 (604) 294-3811 Fax +1 (604) 294-4664 www.amec.com
MOUNT POLLEY MINE
Tailings Storage Facility 2011 Construction
As-Built Report and Annual Review
Submitted to:
Mount Polley Mining Corporation, Likely, BC
Submitted by:
AMEC Environment & Infrastructure, a division of AMEC Americas Limited
IMPORTANT NOTICE This report was prepared exclusively for Mount Polley Mining Corporation by AMEC Environment & Infrastructure, a wholly owned subsidiary of AMEC Americas Limited. The quality of information, conclusions and estimates contained herein is consistent with the level of effort involved in AMEC services and based on: i) information available at the time of preparation, ii) data supplied by outside sources, and iii) the assumptions, conditions and qualifications set forth in this report. This report is intended to be used by Mount Polley Mining Corporation only, subject to the terms and conditions of its contract with AMEC. Any other use of, or reliance on, this report by any third party is at that party’s sole risk.
AMEC010594_0002
Mount Polley Mining Corporation Mount Polley Tailings Management Facility 2011 Construction As-Built and Annual Review 06 April 2012
VM00560A Page i \\canlitfs01\data_fiber7\VAN_AMECreMtPolleyMine_196927_466458\Documents\20140925-02\23883.docx
5.3.1 Zone U – Upstream Shell ............................................................................. 22 5.3.2 Zone S – Till Core ........................................................................................ 23 5.3.3 Zone F – NAG Filter Rock ............................................................................ 23 5.3.4 Zone T – Transition NAG Rock .................................................................... 24 5.3.5 Zone C – NAG Rock .................................................................................... 24
5.4 Survey Control ......................................................................................................... 24 5.5 Quality Control and Quality Assurance Testing ........................................................ 24
7.0 MASS BALANCE UPDATE [UNTOUCHED FROM 2010 REPORT] ............................... 26 7.1 Updates for 2011 ..................................................................................................... 26 7.2 Overview of Mass Balance Model ............................................................................ 26 7.3 Updated Mine Planning............................................................................................ 26
8.0 SURFACE WATER CONTROL ....................................................................................... 26
9.0 REVIEW OF SEEPAGE CONDITIONS ............................................................................ 26 9.1 General .................................................................................................................... 26 9.2 Site Precipitation Data ............................................................................................. 26 9.3 SC Flows Downstream of TMF-2 Dam ..................................................................... 26
Mount Polley Mining Corporation Mount Polley Tailings Management Facility 2011 Construction As-Built and Annual Review 06 April 2012
VM00560A Page ii \\canlitfs01\data_fiber7\VAN_AMECreMtPolleyMine_196927_466458\Documents\20140925-02\23883.docx
TABLE OF CONTENTS Page
9.3.2 SC-3 – Downstream of East Wing of TMF-2 Dam ........................................ 27 9.3.3 SC-2 – Maximum Section of TMF-2 Dam ..................................................... 27 9.3.4 SC-1 – Western Portion of TMF-2 Dam ........................................................ 28 9.3.5 TMF-2 Dam Summary .................................................................................. 28
9.4 East Dam ................................................................................................................. 29
10.0 WATER QUALITY INTERPRETATION AND TRENDS FOR 2011 .................................. 29 10.1 SC-2 ........................................................................................................................ 29 10.2 SC-3 ........................................................................................................................ 29 10.3 SC-4 ........................................................................................................................ 30 10.4 SC-5 ........................................................................................................................ 30 10.5 TMF-2 ...................................................................................................................... 31
11.0 CONCLUSIONS AND RECOMMENDATIONS ................................................................ 32
Table 2.1: Key TMF-2 and EZP Impoundments Design Criteria ....................................14 Table 3.1: Summary of Dam Elevations ........................................................................18 Table 3.2: TMF-2 Dam Final Elevations ........................................................................18 Table 3.3: Material Types, Specifications and Quantities used in Construction of the
EPPD during 2011 .......................................................................................19 Table 4.1: Embankment Material Types and QA/QC Testing Requirements .................21 Table 5.1: EPPD Summary of Material Quantities and Laboratory testing .....................25 Table 6.1: 2011 TMF-2 Piezometer Summary................. Error! Bookmark not defined. Table 6.2: Till Fill Pore Pressure and Ru Data ................. Error! Bookmark not defined. Table 7.1: Instruments Used to Monitor the East Dam .... Error! Bookmark not defined. Table 7.2: 2011 East Dam Piezometer Summary ........... Error! Bookmark not defined. Table 8.1: 2010 Orica Saddle Dam Piezometer SummaryError! Bookmark not
defined. Table 9.1: 2011 East Pit Plug Dam Piezometer SummaryError! Bookmark not
defined. Table 12.1: Summary of Inferred TMF-2 Dam Seepage Rates .......................................28
AMEC010594_0004
Mount Polley Mining Corporation Mount Polley Tailings Management Facility 2011 Construction As-Built and Annual Review 06 April 2012
VM00560A Page iii \\canlitfs01\data_fiber7\VAN_AMECreMtPolleyMine_196927_466458\Documents\20140925-02\23883.docx
TABLE OF CONTENTS Page
LIST OF FIGURES
Figure 1.1: Huckleberry Mine Site (EZP), Looking East 2011Error! Bookmark not defined.
Figure 1.2: Aerial View of Mine Site: 2010 ........................ Error! Bookmark not defined. Figure 2.1: Site Water Management Schematic .............................................................13 Figure 7.1: Ru versus Height Data with Huckleberry Data Error! Bookmark not defined. Figure 13.1: Annual Site Precipitation Summary ..............................................................26 Figure 13.2: SC-5 Monitored Flows ..................................................................................27 Figure 13.3: SC-3 Monitored Flows ..................................................................................27 Figure 13.4: SC-2 Monitored Flows ..................................................................................27 Figure 13.5 SC-1 Monitored Flows ..................................................................................28 Figure 13.6: East Dam Weir Data ....................................................................................29 Figure 13.7: SC-4 Flows since Construction of EPPD and Tailings Discharge in EZP Error!
Bookmark not defined.
LIST OF DRAWINGS
2012.01 Huckleberry Mine Site – 2011 As-Built Plan 2012.02 Huckleberry Mine – Surface Water Monitoring Plan 2012.03 East Pit Plug Dam As-Built Plan 2012.04 As-Built East Pit Plug Dam Sections 0+300 and 0+400 2012.05 As-Built East Pit Plug Dam Sections 0+460 and 0+545 2012.06 As-Built East Pit Plug Dam Sections 0+600 and 0+700 2012. SC4A Dam As-Built Plan 2012. As-Built SC4A Dam Typical Section 2012.07 TMF-2 Dam As-Built Plan 2012.08 TMF-2 Dam As-Built Section Station 0+250 2012.09 TMF-2 Dam As-Built Section Station 0+550 2012.10 TMF-2 Dam As-Built Section Station 0+625 2012.11 TMF-2 Dam As-Built Section Station 1+200 2012.12 East Dam As-Built Plan 2012.13 East Dam As-Built Section Station 0+250 2012.14 East Dam As-Built Section Station 0+390 2012.15 Orica Saddle Dam As-Built Plan 2012.16 Orica Saddle Dam As-Built Section 2012.17 Tailings Impoundment Construction: Notes & Specifications 2012.18 East Pit Plug Dam Instrumentation Plan 2012.19 As-Built East Pit Plug Dam Instrumentation Sections 0+400 and 0+500 2012.20 As-Built East Pit Plug Dam Instrumentation Sections 0+600 and 0+700 2012.21 TMF-2 Dam and Orica Saddle Dam Instrumentation Plan 2012.22 TMF-2 Dam: Instrumentation Location Sections 2012.23 East Dam 2011 Instrumentation Plan
LIST OF APPENDICES
APPENDIX A FIGURES
AMEC010594_0005
Mount Polley Mining Corporation Mount Polley Tailings Management Facility 2011 Construction As-Built and Annual Review 06 April 2012
VM00560A Page iv \\canlitfs01\data_fiber7\VAN_AMECreMtPolleyMine_196927_466458\Documents\20140925-02\23883.docx
TABLE OF CONTENTS Page
APPENDIX B TILL COMPACTION TESTING AND RESULTS APPENDIX C SAND AND GRAVEL FILTER GRADATIONS APPENDIX D INSTRUMENTATION PLOTS APPENDIX E WATER QUALITY DATA APPENDIX F 2011 CONSTRUCTION SEASON PHOTOS APPENDIX G SC4A CONSTRUCTION PHOTOS
AMEC010594_0006
Mount Polley Mining Corporation Mount Polley Tailings Management Facility 2011 Construction As-Built and Annual Review 06 April 2011
VM00109.2011.1 23883.docx Page 5
SUMMARY
This report presents the annual review of the operation and performance of the Mount Polley Mine Corporation (MPMC) tailings storage facility (TSF) for 2011, together with the as-built report documenting the 2011 construction of the TSF embankment. This report has been prepared in accordance with the requirements of the British Columbia Ministry of Energy and Mines (MEM), including MEM’s updated guidelines for Annual Reports, issued 14 February 2003 (as the Ministry of Energy and Mines). The following points give a general summary of the 2011 TSF activities and key developments.
1) Classification of the dam(s) in terms of Consequence of Failure (ref. Canadian Dam Association, Dam Safety Guidelines [2007]).
A formal dam safety review was conducted in 2006. (AMEC 2006). This review assigned a “LOW” hazard classification based on 1999 Canadian Dam Association (CDA 1999) guidelines. CDA updated their Dam Safety Guidelines rating in 2007 (CDA 2007) and under the new classification the TSF is classified under “Significant” category (see Classification System .
AMEC010594_0007
Mount Polley Mines Corporation Mount Polley Tailings Management Facility 2011 Construction As-Built and Annual Review 06 April 2012
VM00560A 23883.docx Page 6
Table 1.1).
2) Change in Engineer of Record for the TSF
The design and construction monitoring of the TSF embankments from mine start up to early 2011 had been completed under the direction of Knight Piésold Limited (KP). AMEC Environment & Infrastructure, a division AMEC Americas (AMEC) assumed the role of engineer of record for the TSF embankment as of 28 January 2011.
3) Renumbering of embankment instrumentation
KP provided the historical raw instrumentation data collected from the impoundment instrumentation. The raw data was reprocessed, and working piezometers renamed to simplify data management. The revised naming convention for piezometers is presented on Drawing X. The piezometric data organized by planes is presented in Appendix X
4) Embankment instrumentation summary
In 2011, a site investigation program was conducted. During the site investigation additional vibratory wires and slope inclinometers were installed. Table 1.2, summarizes previously and newly installed vibrating wire (VW) installations.
AMEC010594_0008
Mount Polley Mines Corporation Mount Polley Tailings Management Facility 2011 Construction As-Built and Annual Review 06 April 2012
Low None 0 Minimal short-term loss No long-term loss
Low economic losses; area contains limited infrastructure or services
Significant Temporary only Unspecified
No significant loss or deterioration of fish or wildlife habitat Loss of marginal habitat only Restoration or compensation in kind highly possible
Losses to recreational facilities, seasonal workplaces, and infrequently used transportation routes
High Permanent 10 or fewer
Significant loss or deterioration of important fish or wildlife habitat Restoration or compensation in kind highly possible
High economic losses affecting infrastructure, public transportation, and commercial facilities
Very High Permanent 100 or fewer
Significant loss or deterioration of critical fish or wildlife habitat Restoration or compensation in kind possible but impractical
Very high economic losses affecting important infrastructure or services (e.g. highway, industrial facility, storage facilities for dangerous substances)
Extreme Permanent More than 100
Major loss of critical fish or wildlife habitat Restoration or compensation in kind impossible
Extreme losses affecting critical infrastructure or services (e.g. hospital, major industrial complex, major storage facilities for dangerous substances)
Note 1. Definitions for population at risk: None – There is no identifiable population at risk, so there is no possibility of loss of life other than through unforeseeable misadventure. Temporary – People are only temporarily in the dam-breach inundation zone (e.g. seasonal cottage use, passing through on transportation routes, participating in recreational activities). Permanent – The population at risk is ordinarily located in the dam-breach inundation zone (e.g. as permanent residents); three consequence classes (high, very high, extreme) are proposed to allow for more detailed estimates of potential loss of life (to assist in decision-making if the appropriate analysis is carried out).
Note 2. Implications for loss of life: Unspecified – The appropriate level of safety required at a dam where people are temporarily at risk depends on the number of people, the exposure time, the nature of their activity, and other conditions. A higher class could be appropriate, depending on the requirements. However, the design flood requirement, for example, might not be higher if the temporary population is not likely to be present during the flood season.
AMEC010594_0009
Mount Polley Mines Corporation Mount Polley Tailings Management Facility 2011 Construction As-Built and Annual Review 06 April 2012
VM00560A 23883.docx Page 8
In general, in 2011 the piezometers indicated the following general trends for the TSF embankment:
Pore pressures in foundation soils in around the TSF embankment were generally noted as stable with minor fluctuations, except for D1 were an upward trending piezometer is noted. Newly installed piezometers appear to have stabilized but insufficient data has been collected to show any trends at this point.
Pore pressures in the till core are generally found to be stable, with a slightly increasing trend in response to the rising pond level. A14 piezometer shows a greater than typical pore pressure increase; however it appears that it has stabilized at the end of the year. This can be most likely explained by the vertical placement of the piezometer and the lack of an established fine grain beach at that section of the embankment.
Pore pressures in filter and drains remained unchanged throughout the year. Pore pressures in the tailings and upstream fill generally experienced an upwards trend
in response to the rising pond level. In addition, piezometers that were installed at a lower elevation experienced lower response relative to the piezometers near the pond elevation.
Table 1.2 Vibratory Wire Summary
Embankment Previously Installed
(Working)
Previously Installed (Dead)
Installed in 2011
Installed Overall
Overall (Working)
Main 40 26 15 81 55
Perimeter 10 9 5 24 15
South 8 2 3 13 11
Total 58 37 23 118 81
As part of the 2011 site investigation three (3) additional inclinometers were also installed in around the embankment for a total of 7 functioning slope inclinometers as shown in Table 1.3. Newly installed slope inclinometers were not initialized until January 24th, 2012. The last record reading of site slope inclinometers was conducted on September 6, 2011, as such the inclinometer data collected in early 2012 has been included as part of this report, and is presented in Appendix X.
Table 1.3 Slope Inclinometer Summary
Embankment Previously Installed
(Working)
Previously Installed (Dead)
Installed in 2011
Installed Overall
Overall (Working)
Main 4 1 2 7 6
Perimeter 0 0 1 1 1
Total 4 1 3 8 7
AMEC010594_0010
Mount Polley Mines Corporation Mount Polley Tailings Management Facility 2011 Construction As-Built and Annual Review 06 April 2012
VM00560A 23883.docx Page 9
5) Significant changes (was there significant changes?...if so you certainly don’t explain them below) to dam stability and/or surface water control.
The limit equilibrium analyses, for the Stage 7 raise was conducted prior to commencement of the construction period, utilizing the provided cross sections from KP and material parameters established by KP with minor changes to better model the sections (how did your minor changes make for better model sections – you can’t say you changed something without explaining for what purpose). The Stage 7 stability analysis is presented in Appendix XX of the 2011 Construction Manual
The runoff cut-off trench (?? Is that really what it is called>>), at the northeast/southwest wherever?? corner of the impoundment, near Corner 4 was realigned (how much? In what direction? Upslope?) to accommodate the 2011 embankment raise, no other significant (or notable? As this doesn’t sound significant to me) changes to the to the surface water control was implemented in 2011.
6) For major tailings impoundments, as described in Part 9.1.3 of the Health, Safety and Reclamation Code for Mines in British Columbia, all operating dams shall have a current Operations, Maintenance and Surveillance (OMS) Manual. The annual report shall indicate the latest revision date of the OMS Manual.
The OMS manual was last updated by MPMC in October 2006 and requires an update in 2012.
7) Scheduled date for formal Dam Safety Review (ref. Canadian Dam Association, Dam Safety Guidelines).
A formal Dam Safety Review in planned to be conducted in 2016 or during detailed closure design, whichever is earliest.
8) Summary of 2011 construction.
AMEC was present on site at commencement of critical material placement. During this period AMEC verified that construction methods employed were consistent with design expectations during dam construction, material specifications were adhered to and that the monitoring and testing requirements were understood by MPMC personnel. This time was also used to make certain that daily technical/progress reports were being completed properly, site and AMEC home office responsibilities were thoroughly understood by all parties, and lines of communication between the site and AMEC office-based support were clearly established and functional. Once AMEC was satisfied that the MPMC’s field inspectors were fully trained and prepared to undertake the construction monitoring and reporting role with primarily remote support required by AMEC, AMEC reduced their monitoring presence to monthly visits, though actual timing varied somewhat with visits timed for key construction activities such as foundation preparation and approval, and till core trench approval.
Stage 7 construction involved raising the crest of the embankment to a minimum elevation of 960.1m began mid June with placement of upstream fill (Zone U), and was completed by mid November with placement of NAG rock (ZONE C). The majority of construction monitoring was
AMEC010594_0011
Mount Polley Mines Corporation Mount Polley Tailings Management Facility 2011 Construction As-Built and Annual Review 06 April 2012
VM00560A 23883.docx Page 10
conducted directly by MPMC field inspectors with submission of daily reports to AMEC during placement of critical materials Till Core (Zone S) and Filter (Zone F). Zone S placement was conducted by Peterson Contracting Ltd (did they place anything else?).
9) Overall performance of the Tailings Management Facility
Observations and data obtained over the course of 2011 indicate that the tailings management facility continues to perform in a satisfactory manner.
AMEC010594_0012
Mount Polley Mines Corporation Mount Polley Tailings Management Facility 2011 Construction As-Built and Annual Review 06 April 2012
VM00560A 23883.docx Page 11
1.0 INTRODUCTION
The Mount Polley Mine is located in central British Columbia, approximately 60 km northeast of Williams Lake. The main access route is via Likely Road. The turn to the Mine is located approximately 1.5 km east of Morehead Lake. The Mine is located a further 11 km to the southeast, on the Bootjack Lake Forest Service Road. The Mount Polley mine commenced production in June 13, 1997. Ore is crushed and processed by selective flotation to produce a copper-gold concentrate. The mill throughput rate is approximately 18,500 tonnes per day (approx. 6.8 million tonnes per year). Mill tailings are discharged as slurry into the Tailings Storage Facility located on the south area of the Mine property.
Tailings slurry is conveyed from the Concentrator to the TSF via a tailings discharge pipeline. The tailings are deposited into the impoundment through moveable or fixed spigots on the embankment crest. A floating reclaim pump recycles process water from the supernatant pond in the TSF for use in the mill processing circuit. Sediment ponds and seepage collection ponds are designed to intercept runoff from the surface and seepage from the embankment respectively. Drains, instrumentation and monitoring wells are constructed in and around the TSF to assist in monitoring the performance of the facility.
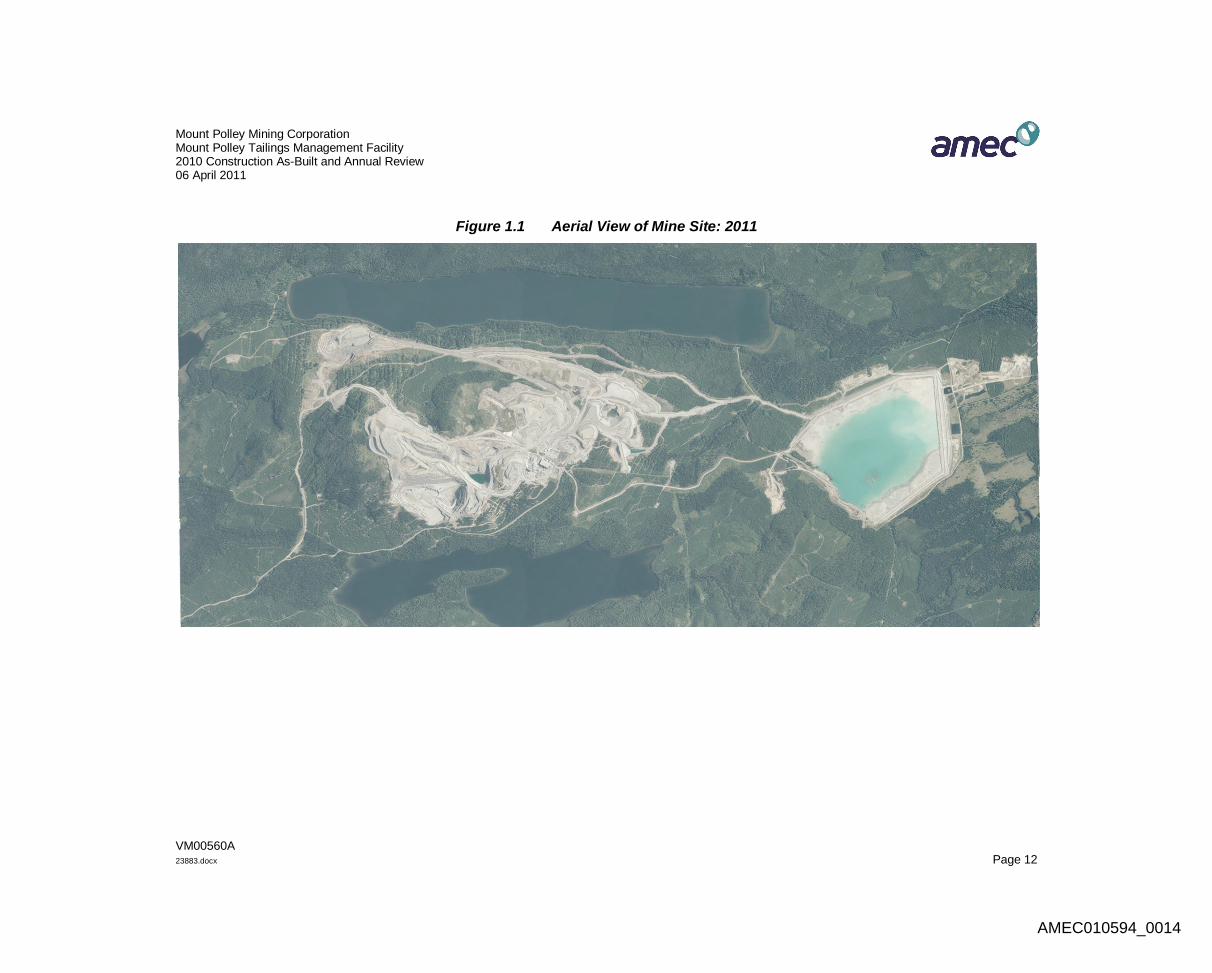
Drawing 2011AB.01 presents a plan of the as-built condition of the Mount Polley Mine site. Figure 1.1 shows an aerial view of the site from 2011.
MPMC milled approximately 28 M tonnes of ore prior to entering into care and maintenance status for the period from October 2001 to February 2005.
The starter dam for the TSF embankment was constructed in 1996 to a crest elevation of 927.0m. AMEC understands that the starter dam was constructed out of a homogeneous compacted till fill. Discharge of the tailings into the impoundment commenced in the summer of 1997. The TSF embankment was raised in subsequent years as follows:
To elevation 934.0 m in 1997. To elevation 936.0 m in 1998. To elevation 937.0 m in 1999. To elevation 941.0 m in 2000. To elevation 942.5 m in 2001. To elevation 944.0 m in 2004. To elevation 946.0 m in 2005.
To elevation 949.0 m in 2006. To elevation 950.9 m in 2007. To elevation 951.9 m in 2008. To elevation 953.9 m in 2009. To elevation 958.0 m in 2010. To elevation 960.1 m in 2011.
MPMC crews and equipment looked after the placement of Zone U, Zone T, and Zone C, while placement of Zone S and Zone F was performed by Peterson Contracting Ltd. (Peterson).
This report documents the construction monitoring, construction methods, and the results of the quality control testing performed during the 2011 construction of the Mount Polley TSF raise to approximately El. 960.1 m.
This report also represents the 2011 annual review of the MPMC TSF.
AMEC010594_0013
Mount Polley Mining Corporation Mount Polley Tailings Management Facility 2010 Construction As-Built and Annual Review 06 April 2011
VM00560A 23883.docx Page 12
Figure 1.1 Aerial View of Mine Site: 2011
Main Zone Expansion Pit
East Dam
AMEC010594_0014
Mount Polley Mining Corporation Mount Polley Tailings Management Facility 2011 Construction As-Built and Annual Review 06 April 2012
VM00109A 23883.docx Page 13
2.0 OPERATION OF THE TAILINGS STORAGE FACILITY
2.1 General The Mount Polley The TSF is comprised of one overall embankment that is approximately 4.2km in length. The embankment, based upon original separate embankments, is subdivided into three (3) sections; referred to as the Main Embankment, Perimeter Embankment and South Embankment. Heights vary along the embankment and are approximately 45 m, 27 m, and 17 m respectively (based upon the Main, Perimeter and South nomenclature). . An as-built plans of the embankment is shown on Drawing XXXXX.
2.2 Tailings Discharge Tailings are transported from the mill to the impoundment via an approximately 7 km long HDPE pipeline. The tailings pipeline and discharge system extends around the TSF ..... where does it go and where do they spigot from ? The pipeline design flow is 20,000 tpd at about 35% solids by dry weight.
2.3 Process Water Reclaim The tailings pond supernatant is recycled to the mill for use as process water. It is transported via the reclaim pumping system, which consists of a barge, pipeline and booster pump station. The reclaim pipeline system returns water from the TSF to the mill for use in the mill process.
.
The mill also requires fresh water for its operations. Fresh water is pumped from a barge located in Tahtsa Reach to the fresh water tank located on the hill above the mill and camp area. Fresh water pumped at approximately 130 m3/hr, was utilized for pump gland water, cooling water and for the molybdenum recovery circuit. In late 2010, HML modified the process plant such that fresh water makeup is now only required at a rate of about 30 m3/hr.
the old main zone pit was at El. 982 m and the water level in the MZX pit was at El. 946 m.
A schematic of the site water management system is given in Figure 2.1.
AMEC010594_0015
Mount Polley Mining Corporation Mount Polley Tailings Management Facility 2011 Construction As-Built and Annual Review 06 April 2011
VM00560A 23883.docx Page 14
Figure 2.1: Site Water Management Schematic
AMEC010594_0016
Mount Polley Mining Corporation Mount Polley Tailings Management Facility 2010 Construction As-Built and Annual Review 06 April 2012
VM00560A 23883.docx Page 15
2.4 Sediment Control Ponds A series of small sediment control ponds are located downstream of the TMF-2 Dam. The ponds collect runoff and seepage water from the area immediately downstream of the dam, as shown on Drawing 2011.02. Flocculants are added as required to the incoming streams to promote settling of suspended solids within the ponds. To date, water quality within these ponds has typically been suitable for direct discharge and HML anticipates that it will remain acceptable throughout the remaining mine life. The sediment control ponds located downstream of the TMF-2 impoundment include SC-1, SC-2, SC-3 and SC-5. Downstream of the EPPD a new pond, SC-4A, was constructed during the construction season of 2011. The relocation of SC-4 to SC-4A was completed in October, as the EPPD toe design was extended further downstream.
2.5 Design Criteria Key design criteria for the TMF are summarized in Table 2.1 below.
Sufficient storage capacity to store the Probable Maximum Flood (PMF), with no release. The PMF is defined as follows:
Summer PMP (from June to November): 750 mm of rain over 4 days
Winter PMP (from December to May): 750 mm of rain over 4 days plus 222 mm of snowmelt.
Zero freeboard is required above the pond level that would result from the PMF, because the TMF-2, Orica Saddle Dam and East Dam raising schedule is such that PMF storage volume requirements are exceeded provided that surplus water accumulated in the impoundment is discharged as planned in the water balance. The same applies for the EPPD.
During operations, there is no emergency spillway, for either impoundment. A closure spillway will be constructed to the east of the east abutment of the TMF-2 Dam, between that dam and the Orica Saddle Dam. Should the PMF or similar inflow conditions occur prior to the spillway construction; a temporary spillway can be quickly constructed at the Orica Saddle Dam (TMF-2 impoundment) or on the west abutment of the EPPD (EZP impoundment).
Flood storage & freeboard (closure)
An open channel closure spillway will be constructed. For the TMF-2 impoundment, this will consist of an open channel excavated into competent bedrock between the east abutment of the TMF-2 Dam and west abutment of the Orica Saddle Dam. For the EZP, the bedrock channel spillway will be located on the west abutment of the EPPD. At closure, for both impoundments, there will be a sufficient combination of flood storage, freeboard, and spillway release (i.e. flood routing) capacity to accommodate the critical PMF event (4-day PMP event with 100-year snowmelt component).
AMEC010594_0017
Mount Polley Mines Corporation Mount Polley Tailings Management Facility 2011 Construction As-Built and Annual Review 06 April 2012
Defined as factor of safety (FoS) derived from limit equilibrium stability analysis. Governing criteria as follows:
Short term, end-of-construction conditions (with construction-induced pore pressures within the compacted till core of the dam): FoS 1.3.
Long term, steady state (closure) conditions: FoS 1.5.
Design of the TMF-2 Dam is governed by short term, end-of-construction conditions, meaning that over the long term FoS values in excess of 1.5 are projected. Design of the East Dam, EPPD, and Orica Saddle Dam are governed by long term, steady state conditions.
Dam stability (design earthquake loading conditions)
Design earthquake for both operations and closure phases is the Maximum Credible Earthquake (MCE), estimated to have the following characteristics:
Moment Magnitude (Mw) = 6
Peak horizontal ground acceleration (PGA) = 0.17g
These parameters were updated in 2007 to incorporate the revised seismic hazard zonation of Canada as part of the seismic stability analysis.
Management of PAG waste rock and tailings
Potentially acid generating waste rock and tailings are to be permanently submerged below a suitable depth of water cover. PAG tailings within the limits of the final, above-water NAG tailings beaches (required upstream of the TMF-2 Dam and the EPPD) will be blanketed by NAG tailings.
Above-water tailings beaches during operations
Above-water tailings beaches to be maintained upstream of the TMF-2 Dam and the EPPD to the extent practical during operations. Beaches during operations are formed of rougher tailings, from which most of the pyrites have been removed.
Above-water tailings beaches at closure
At closure, above-water tailings beaches at least 50 m wide are required upstream of the TMF-2 Dam, and 100 m upstream of the EPPD. Beaches to consist of NAG tailings produced via flotation removal of sulphides during final stages of mine life (if required to achieve acceptable neutralization potential ratios), or other such measures that satisfy environmental (i.e. water quality) criteria and provide the required above-water beach width. Separation of the closure water pond from the East Dam crest to be achieved via NAG tailings or else NAG mine waste from the MZX stripping operations.
Water management
TMF-2 is no longer operated as a zero discharge facility, with surplus water being discharged into the Tahtsa Reach when discharge water quality objectives are satisfied. Huckleberry obtained a permit for discharge of surplus water from the TMF-2 impoundment in 2006.
AMEC010594_0018
Mount Polley Mines Corporation Mount Polley Tailings Management Facility 2011 Construction As-Built and Annual Review 06 April 2012
VM00560A 23883.docx Page 17
3.0 2011 DAM DESIGN & CONSTRUCTION OVERVIEW
3.1 General The drawings appended to this report include design and as-built sections of the TSF embankment.
The 2011 stage 7 TSF embankment raise design followed the following criteria:
The design elevation as requested by MPMC was 960.5 m To provide bearing capacity for the core till (Zone S) the upstream fill was to be
constructed prior to the
The drawings appended to this report include design and as-built sections of the TMF-2 Dam, Orica Saddle Dam and East Dam current as of the end of 2007. They also show the design and as-built drawings for the EPPD, associated EZP highwall stabilization buttress and tailings causeway, and design and as-built drawings for the SC4A Dam. These drawings identify, in plan and section, the locations of instrumentation (piezometers, survey monuments and inclinometers) within the dams and their foundations. A summary of dam elevations is shown in Table 3.1. The TMF-2 Dam, the Orica Saddle Dam (OSD), the East Dam and the EPPD share a similar design cross section consisting of a downstream shell of NAG rockfill, a central, low permeability till core and a filter sequence downstream of the core. Tailings are co-deposited into the impoundment with a shell of PAG waste rock to provide upstream support for the dams, progressively raised in a centerline configuration. For both impoundments, there is a maximum elevation to which PAG waste rock can be utilized. This elevation is 1075 m for the TMF-2 impoundment and 1034 m for the EZP impoundment1. This maximum elevation is intended to mitigate potential ARD issues by providing sufficient NAG tailings and water cover over the PAG waste rock and PAG tailings. Above these maximum elevations, NAG rock must be used as upstream support for the core.
The TMF-2 Dam was raised to crest El. 1064 m in 2002, did not require raising in 2003, was raised 3 m to El. 1067 m in 2004, and was raised 6.0 m to El. 1073 m in 2005 and early 2006. By late 2006, the dam crest raise was completed to 1077 m (1078 m in the deepest sections of the dam). In August 2007 the crest was raised to the final El. of 1079 m (1080 m in the deepest sections of the dam), representing the minimum top elevation of the till core (some sections were constructed higher to allow for anticipated long term settlement and construction induced excess pore pressures gradually dissipate). Placement of NAG rockfill for extension of the downstream shell of the TMF-2 Dam was carried out in the 2005 and early 2006 construction seasons. In addition, a buttress extension of the downstream shell was constructed in two phases between Sta. 0+400 m and 0+800 m.
1 During the 2009 construction season, PAG rock in the EZP impoundment was limited to El. 1002 m, as there was uncertainty over the final crest elevation of the EPPD. Since then, however, the decision was taken to raise the EPPD to El. 1040 m, meaning that PAG rock can be placed up to El. 1034 m.
AMEC010594_0019
Mount Polley Mines Corporation Mount Polley Tailings Management Facility 2011 Construction As-Built and Annual Review 06 April 2012
VM00560A 23883.docx Page 18
In setting the final target crest elevations for the TMF-2 Dam, post-construction settlement (due to consolidation of the till fill as construction-induced pore pressures gradually dissipate over a period of years) had to be accounted for. An allowance of 1 m was judged sufficient for the maximum section of the TMF-2 Dam, with lesser allowances for sections of the dam that are not as high. Adding this settlement allowance to the final core elevation of 1079 m, a target core elevation for 2007 construction of dam crest El. 1080 m was obtained for the maximum section of the TMF-2 Dam. Target elevations for the TMF-2 Dam, relative to that for the deep section of the dam, are given in Table 3.2 on the basis of reduced settlement allowances for lesser dam heights.
The majority of the East Dam was constructed to crest El. 1064 m in 2003, those areas below El. 1064 m were completed in June 2004 and then the dam was raised (for most of its length) to crest El. 1067 m in 2004. In 2005, the East Dam was raised to El. 1071.5 m. The 2006 crest raising for the East Dam was completed in August 2006 to El. 1077 m. The final crest raise of the East Dam was completed in September 2007 to El. 1079 m (top of till core). No settlement allowance for the East Dam was required due to the lack of a significant till starter dam section (as existed for the TMF-2 starter dam).
The East Dam design section is similar to the TMF-2 Dam, except that, rather than having a significant till starter dam section within the overall dam as is the case for the TMF-2 Dam, the core of the East Dam is limited in width to 10 m (except where overbuilt in width against the abutments) up to elevation 1068.0 m. Above El. 1068 m the till crest was narrowed with the downstream limit sloped upstream at a 1H:1.75V slope to El. 1073 m; with a working crest width of 8 m maintained. Upstream support for the East Dam is provided by a large, PAG waste rock dump (extending about 200 m upstream of the East Dam centreline) to elevation 1075 m. Above elevation 1075 m NAG waste rock is placed for upstream support. An above water tailings beach against the East Dam (burying the PAG rock dump) will only be developed towards closure. Alternatively, a widened NAG waste fill section, suitably designed to resist wave erosion, will be developed in lieu of an above-water tailings beach.
The construction of the Orica Saddle Dam (OSD) started in March of 2006. By June 2006, it was up to the 2006 target elevation of 1077 m. Since the OSD will not have the tailings beach, a 10 m wide by 1 m thick till blanket, was constructed upstream of the till core limit to extend the seepage path below the dam. The OSD was completed to its final till core elevation of 1079 m in July 2007. No settlement allowance was required for the Orica Saddle Dam, due to its minimal height.
The Orica Saddle Dam final crest elevation is a 0.3 m below that of the East Dam so that, in the event of spillway blockage, the Orica Saddle Dam would be the dam that would be overtopped. The consequences of overtopping of the Orica Saddle Dam are much lower than those associated with overtopping of the TMF-2 and East Dams. In a sense, the reduced crest elevation for the Orica Saddle Dam represents a backup spillway.
The SC4A Dam design section consists of a downstream shell of NAG rockfill, a central, low permeability till core, a fine NAG filter downstream of the core and a NAG rockfill zone upstream of the till core. The dam is constructed to a maximum height of 15 m, with an upstream slope of 2H:1V and a downstream slope of 1.5H:1V.
AMEC010594_0020
Mount Polley Mines Corporation Mount Polley Tailings Management Facility 2011 Construction As-Built and Annual Review 06 April 2012
VM00560A 23883.docx Page 19
The design basis, design drawings and recommended construction procedures for the SC4A Dam are detailed in the SC4A Design Report (AMEC 2011b). The construction of the SC4A Dam started in August of 2011. By October XX, 2011, it was up to the final elevation of 917 m. As ablation till was encountered throughout the majority of the foundation-core contact, a 1 m thick till blanket was constructed approximately XX m upstream of the till core limit to extend the seepage path below the dam. No settlement allowance was required for the SC4A Dam, due to its minimal height.
Notes: 1. Crest elevation for the TMF-2 dam includes a settlement allowance of up to one meter to account for long term
consolidation of the compacted till fill. At completion of such consolidation, the till core is projected to be at crest El. 1079 m.
2. A 1 m cap of non acid generating rockfill is to be placed over the final crest of the dams to form an access road. As such, the top of the till core is 1 m below the crest elevations indicated.
3. The East Dam is not expected to undergo any significant post-construction settlement due to the essentially vertical nature of the till core and the lesser height of this dam.
4. The crest elevation of the Orica Saddle Dam was to be slightly lower than the larger dams such that, should there be a blockage of the spillway, it is the Orica Saddle Dam that would be overtopped rather than the larger dams for which the consequences of overtopping would be more severe.
Table 3.2: TMF-2 Dam Final Elevations From Station To Station Till core crest El. (m) West abutment 0+000 m 1079
The design basis, design drawings and recommended construction procedures for the EPPD are detailed in the EPPD design report (AMEC 2007c). The construction of the EPPD began in April 2008 with foundation preparation on the El. 950 m bench of the mined-out East Pit. Construction continued through to the end of December 2008 and reached a minimum elevation
AMEC010594_0021
Mount Polley Mines Corporation Mount Polley Tailings Management Facility 2011 Construction As-Built and Annual Review 06 April 2012
VM00560A 23883.docx Page 20
of 982 m when construction was halted. The initial targeted minimum elevation in 2009 for Stage II of the EPPD was 1008 m. However, construction was suspended before the target elevation was achieved and the 2009 construction season minimum crest elevation achieved (as defined by the till core) was 1005.3 m. In 2010, the target final crest elevation of 1014 m was achieved. However, the mine plan was revised to include an EPPD final crest elevation of 1040 m to accommodate extra storage needed from a pushback of the highwall of the MZX. During the 2011 construction season, the target minimum crest elevation of 1030 m was achieved. The current as-built condition of the EPPD is shown in both plan and section on Drawings 2012.03 to 2012.06.
The upstream tailings beach for the EPPD will be constructed and maintained throughout the operation of the EZP impoundment. The rougher tailings are discharged into the east cell (between the causeway and the EPPD). Slurry water seeps through the permeable PAG waste rock causeway into the west cell, with the tailings solids retained in the east cell to form the EPPD tailings beach. The EZP reclaim water pond forms in the west cell at elevations approximately 10 m lower than the level of the tailings retained in the east cell (where there is no significant free water pond). It should be noted, that while the original design of the EPPD called for a separate stabilization buttress and tailings causeway, HML decided to merge these features into the single larger stabilization buttress.
3.2 Dam Sections
As-built sections of the dams are shown on the appended drawings. 3.3 Construction Materials The design sections of the TMF-2, East and Orica Saddle dams are shown on Drawings 2011.08 to 2011.11, 2011.13, 2011.14 and 2011.16, with material specifications on Drawing 2011.17. The design sections for the EPPD are shown on Drawings 2011.04 to 2011.06, with the same material specifications as the other dams. The material types, specifications and quantities used for dam construction in 2011 are provided below in Table 3.3. A discussion on the placement methods of each fill type is carried out in Section 5.3 and the results of quality assurance and quality control testing are provided in Section 5.5.
Table 3.3: Material Types, Specifications and Quantities used in Construction of the EPPD during 2011
Material Type Specifications Surveyed Quantity (m3)
Zone 1 Till Core
Well graded basal till (within gradation envelope provided, Drawing 910.11), with moisture content at -2% to +1% of optimum as defined by standard Proctor test (ASTM D608). Compacted to minimum 98% maximum dry density as determined by the Standard Proctor compaction test.
XXX
Zone 2 PAG Rock Shell
Nominal 1 m maximum particle size. Rockfill may be potentially acid generating (PAG). Compaction to be achieved by uniform routing of loaded haul truck traffic.
Unknown
Zone 3 NAG Rock Shell
Nominal 1 m maximum particle size. Rockfill to be non-acid generating (NAG). Compaction to be achieved by uniform routing of loaded haul truck traffic.
XXX
AMEC010594_0022
Mount Polley Mines Corporation Mount Polley Tailings Management Facility 2011 Construction As-Built and Annual Review 06 April 2012
VM00560A 23883.docx Page 21
Zone 4 Fine Transition NAG Rock
Cobble and gravel sized material (within gradation envelope provided, Drawing 2010.16). Rockfill to be non-acid generating (NAG). Compaction to be achieved by uniform routing of loaded haul truck traffic.
Zone 5 Sand and Gravel Filter
Sand and gravel sized material (within gradation envelope provided, Drawing 2011.16). XXX
Total XXX *Estimated densities: Till = 2 tonnes/m3, NAG = 1.8 tonnes/m3, Filter = 1.8 tonnes/m3
4.0 CONSTRUCTION MONITORING PROGRAM
Construction Monitoring during the 2011 construction season was mainly carried out by MPMC personnel. AMEC Support Engineer, reviewed daily construction records and perform regular site visits to monitoring the quality of construction and assess MPMC monitoring of the construction.
4.1 AMEC Support Engineer AMEC’s Support Engineer provided on site supervision during the following:
Pre-construction Meeting: May 31 to June 1 Construction Kick-off: June 13 to June 16, June 20 to June 24, June 27 to June 28 July Site Visit: July 25 to July 28 August Site Visit: August 19 to Aus 25
While on site the responsibilities of AMEC’s Support Engineer were as follows:
Monitor, train, and assist MPMC personnel with the requirement of construction monitoring;
Monitor, sample, and requisition tests of the borrow areas, as required; Monitor and perform QA testing of compacted till core soils, as required; Review and approval of proposed borrow soils; Review and approval of transition and filter material, processed methodology and
monitoring practices. Monitor and approval of the filter trench excavation and preparation; Monitor and approval of abutment preparation; Address any concerns or out-of-compliance situations observed and recorded during
construction; Carrying out the quality control field and laboratory testing; Directing the MPMC personnel to address the survey requirements, results, etc.; and Meeting as required with MPMC to review the construction program.
While in the office the responsibilities of AMEC’s Support Engineer were as follows:
Review daily construction reports submitted by MPMC personnel; Review compaction results submitted by MPMC personnel; Plot and review instrumentation readings submitted by MPMC personnel; Address any concerns or out-of-compliance situations noted by MPMC personnel; and Coordinate with MPMC personnel and AMEC’s Project Manager/Senior Engineer.
AMEC010594_0023
Mount Polley Mines Corporation Mount Polley Tailings Management Facility 2011 Construction As-Built and Annual Review 06 April 2012
VM00560A 23883.docx Page 22
4.2 MPMC Field Inspector MPMC Field Inspectors were responsible for the following:
Monitor and photograph on going construction activities; Review borrow pit material to consistency Delineate embankment zones with regularly placed (every 50m) skates. Monitor preparation, placement, and compaction practices utilized by the contractor
various zones of the embankment; Perform QC compactor testing of placed Zone S material (every 150m); Collect material samples for QC laboratory testing; Conduct as-built surveys of various zones; Prepare and submit daily construction reports; Collect and submit instrumentation data; and Report and out-of-compliance situations to AMEC’s Support Engineer
4.3 QA/QC Testing A summary of the testing requirements is given in Table 4.1.
Table 4.1: Embankment Material Types and QA/QC Testing Requirements
Material Type Construction Testing Requirements
ZONE S TILL CORE
Source Classification D422-07: 1 per 10,000 m3 per source. In-Place Testing D6780-05: 1 per lift per 150 linear m or 1 per day per lift; D422-07: 1 per 10,000m3 offset to source.
ZONE F FILTER
Source Classification D422-07: 1 per 5,000 m3 per source.
In-Place Testing D422-07: 1 per 5,000 m3 offset to source. Visual in-place inspection of compaction and zone dimension.
ZONE T TRANSITION
Confirmation of waste rock inertness, as required. D422-07: 1 per 5,000m3. Visual in-place inspection of material size, compaction, and zone dimension.
ZONE C ROCKFILL
Confirmation of waste rock inertness, as required. Visual in-place inspection of material size and placement.
ZONE U UPSTREAM FILL Visual in-place inspection of material size and placement.
During the 2011 construction season, the testing frequencies as outlined above were generally maintained.
4.4 Instrumentation Monitoring Between the 2010 construction period and 2011 construction period instrumentation readings were not conducted.
During 2011 construction period, MPMC personnel monitored the vibratory wire instrumentation along the embankments generally once every two weeks. Inclinometers were monitored during 2011 construction period generally every two weeks offset from vibratory wires.
AMEC010594_0024
Mount Polley Mines Corporation Mount Polley Tailings Management Facility 2011 Construction As-Built and Annual Review 06 April 2012
VM00560A 23883.docx Page 23
After the 2011 construction period, MPMC personnel did not adhere to the set schedule. This out-of-compliance was rectified in January 2012.
5.0 2011 TSF STAGE 7 EMBANKMENT RAISE
5.1 General Construction of the stage 7 entailed a raise of approximately 2.1m from approximate EL.958 m to EL. 960.1 m and it took place from June 13 through to September 21, 2011. This section provides a brief summary of the 2011 construction activities for the TSF. Drawings AB2011.03 through AB2011.06 show the plan and sections for the construction, modified to reflect the as-built conditions. A selection of photographs showing various stages of the 2011 TSF construction are presented in Appendix F.
5.2 Abutment Preparation To accommodate the 2011 embankment raise, the south and perimeter abutments were required. The preparation was conducted as follows:
The topsoil and unacceptable material (including previously placed rock) were removed with the air of an excavator and dozer provided and operated directly by MPMC personnel.
Test pits were conducted to confirm that a minimum of 2 m of till is present beneath the embankment core. The test pits were located such that not to compromised the existing soils found under the till core. Bedrock was not encountered in any of the test pits.
To accommodate a drainage trench detail implemented in past raises a ditch approximately 1.0 m in depth and 2.0 m in width was excavated. On the south embankment it was noted that a corrugated drainage pipe was present. The pipe was extended and placed at the base of the trench. No drainage pipe was noted on the perimeter embankment. The Trench was than backfilled with filter material (Zone F).
Prior to placement of the drainage blanket the exposed native abutment material was proof-rolled with a 10 ton vibratory smooth drum roller.
The drainage blanket was placed to the full extents of the embankment shell. The blanket consisted of 0.3 m thick lift of Zone F material overlayed by a 0.3 m thick of Zone T material.
5.3 Fill Placement 5.3.1 Zone U – Upstream Shell
The upstream shell was mainly constructed prior to AMEC visiting the site. The upstream shell was constructed utilizing cells, reworked with a dozer, and shaped with the aid of en excavator. Where the tailings were unable to be utilized for shell construction waste NAG was utilized. This mainly occurred between corner 2 and corner 3. The NAG was transported by haul truck and paced/shaped by excavator. Prior to 2011 Zone S placement AMEC’s Support Engineer
AMEC010594_0025
Mount Polley Mines Corporation Mount Polley Tailings Management Facility 2011 Construction As-Built and Annual Review 06 April 2012
VM00560A 23883.docx Page 24
inspected the NAG to ensure that large boulders (diameter >1m) were not placed near the Zone U/Zone S interface.
5.3.2 Zone S – Till Core
During the 2011 construction season two (2) separate borrow pits were utilized. For the 2011 predominate borrow source utilized was the perimeter borrow. This borrow pit is located downstream of the perimeter dam between Corner 1 and Corner 1.5. The second borrow utilized was near Corner 5. The second borrow source was only utilized for the small section between Corner 1 and Corner 5 of the embankment.
Prior to placement of the first lift of till core for the 2011 raise the existing Zone S/abutments were prepared by proof-rolling with a 10 ton vibratory smooth drum roller. Areas that were noted to be soft or affected by the frost were removed and replaced.
The placement of Zone S material was performed by Peterson Contracting Ltd. and generally was as follows:
The top 0.1 m of the prepared surface was scarified with the aid of a dozer/grader.
If needed the grade was watered with the aid of a water truck to assist with inter-bonding of the till lifts.
The till lifts were placed in 0.3 m thick lifts utilizing scrappers, and shaped/spread with the aid of dozer/excavator/grader.
A 10 ton vibratory smooth drum roller compacted the placed till
The in-situ density and moisture content of the compacted fill were determined by performing MDI tests (ASTM ####) by MPMC personnel. AMEC conducted some QA testing with the aid of a nuclear densometer (ASTM D-2922-91, ND). Where field test results indicated that the specified 98% Standard Proctor Maximum Dry Density (SPMDD) was not achieved, the area was further compacted and then re-tested. Samples of till were also collected and periodically sent to AMEC’s Prince George lab facility for further testing. Additional discussion about the QC/QA tests performed and the results of these tests are provided in Section 5.5.
This process was repeated for the entirety of the Stage 7 TSF construction.
5.3.3 Zone F – NAG Filter Rock
The material utilized for Zone F is crushed on site and stock piled around the embankment until needed. Haul trucks are utilized to stock pile and transport the material to the TSF embankment. Refer to Drawing 2011.02 for stock pile locations used during the 2011 construction.
Prior to placement of Zone F material on-grade the previously placed Filter material was exposed to enable a completely free draining interface The Zone F was placed on grade by
AMEC010594_0026
Mount Polley Mines Corporation Mount Polley Tailings Management Facility 2011 Construction As-Built and Annual Review 06 April 2012
VM00560A 23883.docx Page 25
Peterson Contracting Ltd. in 0.6 m lifts. The material was transported by dump trucks and spread/shaped with the aid of excavator, grader and loader.
The placed Zone F material was compacted in conjunction with Zone T material, by 10 ton vibratory smooth drum compactor and scrapers routing.
5.3.4 Zone T – Transition NAG Rock
AMEC understands that historically the Zone T material was a finer gradation of Zone C material. This process required experienced operators to hand pick and remove oversized rocks from the material matrix. This process was time consuming and required constant supervision to be achieved. For the 2011 construction period this methodology was implemented, however as consistency was not achieved after the initial placement of this material, MPMC suggested that they can utilized a crushed product that had a nominal particle size of < 130mm. This particle gradation met the specification and allowed to have consistency within the material. Samples of this material were collected and are presented in Appendix XX.
Prior to placement of the Zone T material the interface between the different lifts was exposed and scarified were pavement like surfaces were noted. Zone T material was hauled by MPMC and placed by MPMC in 0.6m thick lifts with the aid of a loader and grader. Additional material was placed to provide a continuous ramp to aid with scraper access to the Zone S. After the Zone S was completed the Zone T material was reshaped with the aid of an excavator.
5.3.5 Zone C – NAG Rock
Zone C material was placed by MPMC. Prior to placement were pavement like grade was noted the grade was scarified with the aid of grader. The NAG rock was transported from active mining areas to the embankment with the aid of haul truck and placed and shaped with the aid of a dozer.
5.4 Survey Control Survey control requirements for the 2011 raise of the TSF included the following:
Staking out the upstream and downstream of the Zone S; the stakes were generally placed every 50m along the entire length of the embankment.
Maintaining the downstream crest stationing during embankment construction. Verifying that a 5m width was maintained during construction, by spot checks. Establishing and verifying the Zone F/T transition line for placement of Zone T material. Varying that the minimum width of Zone F and Zone T are achieved by conducting spot
checks. Collecting in-situ density tests conducted. Collecting and storing data as required for the as-built record; and Providing location and elevation data as required by the AMEC Support Engineer.
5.5 Quality Control and Quality Assurance Testing QA/QC testing of the fills used in the construction of the dam involved mainly off-site testing. On-site testing was limited due to the availability of the on-site laboratory.
AMEC010594_0027
Mount Polley Mines Corporation Mount Polley Tailings Management Facility 2011 Construction As-Built and Annual Review 06 April 2012
VM00560A 23883.docx Page 26
Prior to commencement of the 2011 construction season; a complete two point MDI test on the till was conducted as per (ASTM XXXX) to provide calibration given the actual material going to be utilized. In the past a general calibration of the material was utilized with the MDI density tests. In addition, a proctor test was conducted to establish a maximum density and optimal moisture content as per (ASTM XXXX).
A summary of the quantities of each different material type and the number and types of tests performed on the fills is provided in Table 5.1.
Table 5.1: TSF Summary of Material Quantities and Laboratory testing
Material Type Source Of Material Volume Placed (m3) QA/QC Tests Performed
Zone 1 Till Core
Till Pit 1 (West Shop Till Ext. Borrow) X
2 Proctor 2 Gradation 2 Atterberg limits 173 field density tests
Zone 2 PAG Fill MXZ Pit unknown n/a
Zones 3 & 4 NAG Rock shell and Fine Transition NAG Rock
MZX Pit X 1 Gradation
NAG quarry Zone 5 Sand and Gravel Filter
Vihar crushed NAG rock (MZX Pit) X 28 Gradations (As placed)
41 Gradations (Conveyor) Total Fill Volume Placed X
6.0 INSTRUMENTATION MONITORING
6.1 General Prior to the 2011 construction period an engineer on record was switched from Knight Piésold Ltd. to AMEC. During the transition only the raw data collected from the instrumentation was presented. Thus prior to utilizing the data set all the raw data had to be reprocessed, the reprocessed data is presented in Appendix XX. In addition a full review of the existing instrumentation was conducted. A copy of the report is presented in Appendix XX.
6.2 Piezometers Over the years several piezometers failed and thus only XX active piezometers remained around the embankment prior to the 2011 construction period. In 2007 AMEC conducted an independent review of this dam, and one of the recommendations was to replace the failed piezometers, especially alone the foundation of the embankment.
In addition, due to this transition instrumentation monitoring was not conducted between the 2010 and the 2011 construction periods, and since only the raw data was provided by Knight Piésold, the vibratory wire data and the slope inclinometer data had to be reprocessed The complete piezometer data collected over the 2011 construction season is presented in Appendix XX.
.
AMEC010594_0028
Mount Polley Mines Corporation Mount Polley Tailings Management Facility 2011 Construction As-Built and Annual Review 06 April 2012
VM00560A 23883.docx Page 27
7.0 MASS BALANCE UPDATE [UNTOUCHED FROM 2010 REPORT]
7.1 Updates for 2011 7.2 Overview of Mass Balance Model 7.3 Updated Mine Planning .
8.0 SURFACE WATER CONTROL
.
9.0 REVIEW OF SEEPAGE CONDITIONS
9.1 General 9.2 Site Precipitation Data HML monitors precipitation at the site. Figure 13.1 presents the annual precipitation data. The record spans 1993 through 2010, with the exception of 1996, during which no data was collected.
Figure 9.1: Annual Site Precipitation Summary
In the AGRA design report (1997a), the average annual precipitation was estimated to be 1,074 mm, and the net runoff in an average year was assumed to be 570 mm (i.e. 53% of annual precipitation)2. In 2004, AMEC re-evaluated site precipitation on the basis of site and regional data collected through 2002, and estimated the average annual precipitation to be 1,091 mm (AMEC, 2004b). That estimate included adjustment of regional data collected as far back as 1951. The average for the data collected at site is 1,028 mm.
9.3 SC Flows Downstream of TMF-2 Dam The following sections present such a review for each of the SC locations downstream of the TMF-2 Dam.
9.3.1 SC-5
The monitored flow rates at SC-5 are shown on Figure 13.2, along with the water pond level within the TMF-2 impoundment. Note that the water pond for the TMF-2 impoundment is only shown until May of 2009. The plot terminates at that date because, from that date onwards, water in the TMF-2 impoundment is confined to dewatering sumps and thus for all intents and purposes the TMF-2 impoundment was essentially “dewatered” in terms of a significant free water pond.
2 The SCS curve number (CN) assumed in the 1997 AGRA letter report was 80.
AMEC010594_0029
Mount Polley Mines Corporation Mount Polley Tailings Management Facility 2011 Construction As-Built and Annual Review 06 April 2012
VM00560A 23883.docx Page 28
It is frequently the case that zero flow has been recorded at the SC-5 weir. That being the case, it is reasonable to conclude that the TMF-2 impoundment seepage contribution to SC-5 flows is essentially zero.
Figure 9.2: SC-5 Monitored Flows
9.3.2 SC-3 – Downstream of East Wing of TMF-2 Dam
The monitored flow rates at SC-3 are shown on Figure 13.3,
Figure 9.3: SC-3 Monitored Flows
It is noteworthy that the low flow trend line for SC-3 appears insensitive to the water level within the TMF-2 impoundment. There did appear to be a period of higher flow minima in 2004 and 2005. The possible increase in the low flow level in 2004 coincided with a pond level decrease in TMF-2, as water was transferred to the Main Zone Pit (MZP), where tailings and waste rock were then being directed. It may be that recharge from the MZP, with pond water in direct contact with the pit walls, would explain somewhat higher flow flows in 2004 and 2005. As the MZP was gradually filled with tailings (and waste rock), the ease with which water could access the fractured bedrock pathways may have been somewhat lessened, consistent with the 2005 decline in the low flows trend.
In 2009, the TMF-2 impoundment was essentially drained of a significant free water pond. There has not been, to date, a corresponding decrease in the low flows in SC-3, which is consistent with the lack of increase associated with the prior raising of the water pond level. These observations would tend to suggest that the rate at which seepage from the TMF-2 impoundment enters the groundwater system is to a large degree limited by the hydraulic conductivity of the tailings.
9.3.3 SC-2 – Maximum Section of TMF-2 Dam
Monitored flow rates at SC-2, downstream of the maximum (highest) section of the TMF-2 Dam, are plotted on Figure 13.4.
Figure 9.4: SC-2 Monitored Flows
Monitored flows at SC-2 suggest the following:
There was a “step change” in terms of the low flow from about 100 m3/day to the end of 2001, to about 250 m3/day thereafter. Prior to this change, the low flow rate remained relatively constant despite a rapid rate of rise of the tailings pond level. The step change could have been the result of the water pond coming in contact with bedrock,
AMEC010594_0030
Mount Polley Mines Corporation Mount Polley Tailings Management Facility 2011 Construction As-Built and Annual Review 06 April 2012
VM00560A 23883.docx Page 29
with no intervening veneer of lower hydraulic conductivity till, at high ground that has since been buried within the impoundment.
The low flows began a declining trend, apparently sometime in 2007, a decline that has continued through 2009. It is noteworthy that the decline commenced while the water pond level within TMF-2 was still increasing. It is likely that the decline occurred in part due to the development and maintenance of a wide, above-water tailings beach that separated the TMF-2 Dam from the water pond. Prior to 2007, beach widths had been inconsistent, and there were frequent periods when the water pond was in direct contact with the upstream PAG waste rock shell.
Assuming that the low flow rate from SC-2 prior to the recent decline of the TMF-2 water pond level best represents seepage rates at closure, SC-2 is suggestive of a seepage rate of about 200 m3/day. At present, it appears that flows at SC-2 are decreasing in response to the dewatering of the TMF-2 impoundment.
9.3.4 SC-1 – Western Portion of TMF-2 Dam
SC-1, which monitors runoff and seepage from the western portion of the TMF-2 Dam, was installed in the summer of 2009 Monitored flow rates to date for this location is plotted on Figure 13.5. The minimum flow recorded to date at SC-1 is 94 m3/day. Given that this followed a period of relatively dry weather on site, it is reasonable at the present time to assume this represents 100% seepage, but it will require some years of monitoring at this location to establish a low flow trend as has been done for the other SC locations.
Figure 9.5 SC-1 Monitored Flows
9.3.5 TMF-2 Dam Summary
Table 13.1 summarizes the current estimate of TMF-2 seepage rates as inferred from the low flows data at the downstream SC locations downstream of the TMF-2 Dam. Note that the rate inferred for SC-2 (200 m3/day) is higher than currently inferred seepage flows, but is judged reasonable as an estimate for the closure configuration of the TMF-2 impoundment, once the water pond is restored and reaches the closure spillway invert elevation.
Table 9.1: Summary of Inferred TMF-2 Dam Seepage Rates
Location Inferred Seepage Rate
Length of record (m3/day) litres/sec litres/min per meter
length of dam SC1 100 1.2 Since summer 2009 SC2 200 2.3 Since 1998 SC3 250 2.9 Since 1998 SC5 0 0.0 Since 1998 Total 544 6.4 0.21
AMEC010594_0031
Mount Polley Mines Corporation Mount Polley Tailings Management Facility 2011 Construction As-Built and Annual Review 06 April 2012
VM00560A 23883.docx Page 30
9.4 East Dam HML installed a seepage weir at a location downstream of the East Dam (between the East Dam toe and the EZP) in the fall of 2009. The period of record to date is too short for any clear trends to be established, and is provided in Figure 13.6 below. It does appear that seepage is minimal, unsurprisingly so given the dewatering of the TMF-2 impoundment.
Figure 9.6: East Dam Weir Data
10.0 WATER QUALITY INTERPRETATION AND TRENDS FOR 2011
Water quality data for 2011 is attached in Appendix E. The tables include all monthly water quality sampling data in accordance with Permit PE-14483, in addition to calculated maximum, minimum, mean, median values.
Less than detection values are treated as the actual value for the purpose of calculating statistical summaries.
The water quality results are compared to the BC Guidelines in the attached tables.
Discussions are focused on the 2010 data, as earlier water quality information was discussed in previous annual water quality reports.
10.1 SC-2 The SC-2 pond was designed to collect tailings impoundment seepage (if any), runoff from the downstream tailings dam face and mine site runoff.
There were no non-compliant results at SC-2 for 2010 under the general permitted water quality parameters.
Dissolved molybdenum values averaged 3.34 mg/L compared to 3.46 mg/L for 2009. Molybdenum values recorded at SC-2 are most likely associated to the placement of NPAG rock on the downstream side of the TMF-2, which originates from the former NPAG quarry adjacent to the Main Zone Pit.
Copper values averaged 0.002 mg/L compared to 0.0016 mg/L for 2009. All other metal levels and nutrients remained low and stable for 2010 Two toxicity samples were taken in 2010 and both passed with 100% survival in 100%
concentration. 10.2 SC-3 Ambiguous pond is located at the south end of the East Wing of the TMF-2 tailings dam and serves as a primary settling area for SC-3. The pond area and volume are estimated at 4,100 m2 and 8,100 m3, respectively. Water is collected in this pond and eventually meanders through 170 m of swampy area. The sediment control pond SC-3 consists of a man made pond excavated to bedrock. The sediment control structure is lined with basal till along the downstream side of the pond. The final SC-3 pond volume is estimated at 40 m3.
AMEC010594_0032
Mount Polley Mines Corporation Mount Polley Tailings Management Facility 2011 Construction As-Built and Annual Review 06 April 2012
VM00560A 23883.docx Page 31
The SC-3 pond was designed to collect tailings impoundment seepage (if any), runoff from the down-stream tailings dam face and mine site runoff.
No non-compliances were recorded at SC-3 during 2010 under the general permitted water quality parameters.
During March 2 to May 13, excess water from the NAG quarry was sent to Tahtsa Reach via SC-3. During this time, an additional 152,232m3 were released from the NAG quarry. A flow meter was installed on a pipe carrying the water to SC-3. Refer to Appendix E for details.
Water quality data suggests that dissolved copper values have been slowly decreasing since 2006. The water quality data of 2010 suggests a similar downward trend in relation to dissolved copper values.
Nitrite values averaged 0.006 mg/L compared to 0.009 mg/L for 2009. Dissolved copper averaged 0.0213 mg/L compared to 0.0277 mg/L for 2009. Dissolved molybdenum averaged 6.00 mg/L compared to 6.51 mg/L for 2009. All other metal levels remained stable. TSS values remained at or below detection limit for the entire sampling year. Acute lethality tests (toxicity/bioassay test-trout) are conducted on a biannual basis
under provincial requirements and quarterly (trout/daphnia) under the MMER. All acute lethality tests have passed at the SC-3 discharge under the provincial monitoring program.
10.3 SC-4 The SC-4 pond was designed to collect tailings impoundment seepage (if any), runoff from the EPPD downstream face and mine site runoff.
No non-compliances were recorded at SC-4 during 2010 under the general permitted water quality parameters.
Nitrite values averaged 0.007 mg/L. Dissolved copper averaged 0.0156 mg/L. Dissolved molybdenum averaged 0.160 mg/L. All other metal levels remained stable. TSS values remained at or below detection limit for the entire sampling year. Acute lethality tests (toxicity/bioassay test-trout) are conducted on a biannual basis
under provincial requirements and quarterly (trout/daphnia) under the MMER. All acute lethality tests have passed at the SC-4 discharge under the provincial monitoring program.
10.4 SC-5 Sediment Control structure #5 (SC-5) was originally designed to collect runoff from in and around the main zone pit. The current SC-5 pond has the function of collecting; tailings impoundment seepage (if any), runoff from the down-stream tailings dam face and mine site runoff and general runoff in and around the NAG quarry.
No non-compliances were recorded at SC-5 during 2010 under the general permitted water quality parameters.
AMEC010594_0033
Mount Polley Mines Corporation Mount Polley Tailings Management Facility 2011 Construction As-Built and Annual Review 06 April 2012
VM00560A 23883.docx Page 32
TSS values were at or below detection limit. Nitrite values averaged 0.002 mg/L. Iron levels averaged 0.177 mg/L. Dissolved molybdenum averaged 0.482 mg/L.
10.5 TMF-2 An amendment to Provincial Permit 14483 issued under the Environmental Management Act, was granted on July 15, 2006 and discharge of excess pond water began on July 18, 2006. The excess TMF-2 pond water is pumped via a 1.5 km pipeline from the impoundment and follows the course of Creek 3 to Tahtsa Reach. The excess water is released from the impoundment in order to maintain optimal operational requirements. An annual rate of 5 million m3 is permitted for release annually under Permit PE-14483 if water quality meets permitted discharge levels. This rate of discharge is proposed until the end of mine operations. Samples are collected weekly.
A baseline study was conducted in 2006 in Tahtsa Reach as part of the Environmental Effects Monitoring report under provincial requirements for the TMF-2 discharge. Environmental Effects Monitoring (EEM) was conducted in 2007, 2008 and 2009 under provincial and federal EEM programs.
A carbon dioxide plant was commissioned on May 9, 2008 to lower the pH within TMF-2 and allow the release of excess water from the Tailings Management Facility. For internal water quality management, pH is measured daily. A pH analyzer is installed (in line) 100 m downstream of the Carbon Dioxide Plant and flow meters. pH is also done manually in order to confirm analyzer readings. The pH analyzer is calibrated often to assure accuracy.
There was one non-compliance recorded on March 31, 2010 recorded. Nitrite was recorded with a value of 0.631mg/L, with the limit set at 0.6 mg/L. Pumping was stopped on March 31 and resumed on May 8, when nitrite values were well below permit limits.
Monthly sublethal toxicity samples were collected in January, February, May, June, July, September, October, November and December of 2010 from TMF-2 effluent. All samples passed.
Quarterly acute toxicity samples were collected in March, May, August and November. All samples passed.
NPAG tails were re-directed to TMF-2 in 2009 to complete the reclamation process of covering reactive tailings within the exposed beach faces. Soils were hauled and dumped on the downstream sections of the dam for future reclamation objectives.
The de-watering of the TMF-2 continued in 2010 in order to continue mining in the Main Zone Extension Pit.
Nitrite averaged 0.104 mg/L compared to 0.141 mg/L for 2009. Sulphates averaged 1540 mg/L compared to 1491 mg/L for 2009. Dissolved copper averaged 0.0016 mg/L compared to 0.0019 mg/L for 2009.
AMEC010594_0034
Mount Polley Mines Corporation Mount Polley Tailings Management Facility 2011 Construction As-Built and Annual Review 06 April 2012
VM00560A 23883.docx Page 33
Dissolved molybdenum averaged 0.181 mg/L compared to 0.114 mg/L for 2009. Dissolved Zinc averaged 0.0011 mg/L compared to 0.0017 mg/L for 2009. The pH averaged 7.6 compared to 7.7 for 2009.
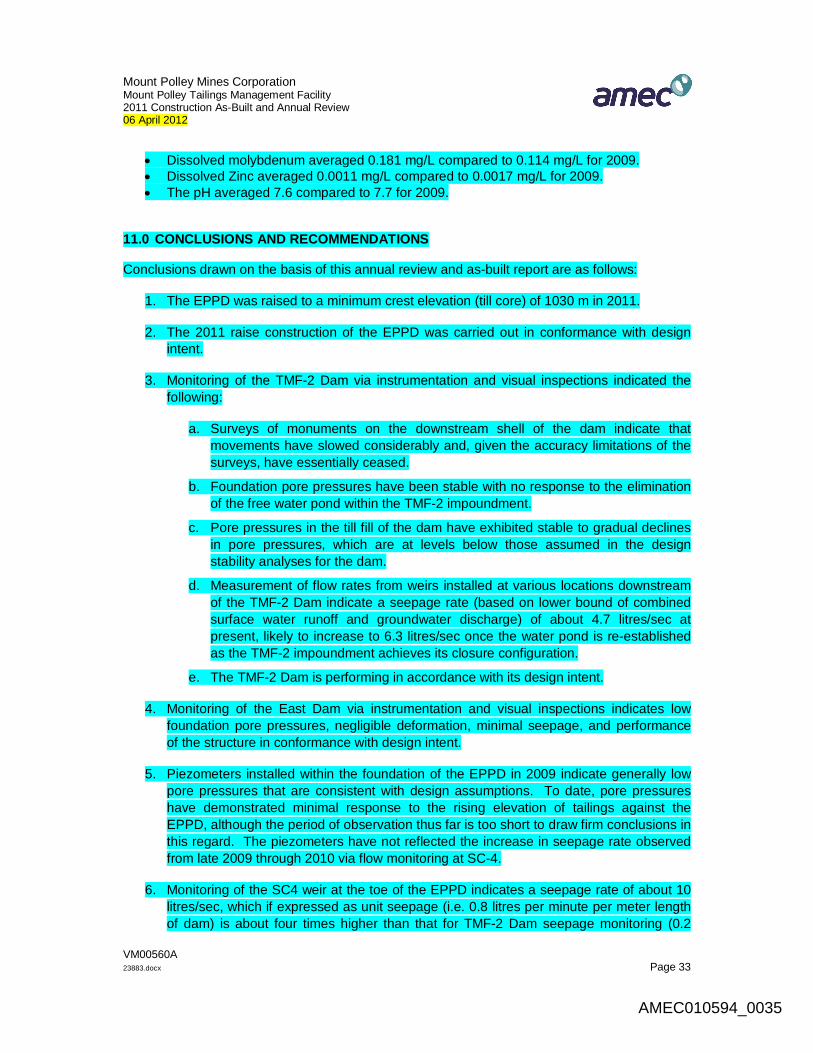
11.0 CONCLUSIONS AND RECOMMENDATIONS
Conclusions drawn on the basis of this annual review and as-built report are as follows:
1. The EPPD was raised to a minimum crest elevation (till core) of 1030 m in 2011.
2. The 2011 raise construction of the EPPD was carried out in conformance with design intent.
3. Monitoring of the TMF-2 Dam via instrumentation and visual inspections indicated the following:
a. Surveys of monuments on the downstream shell of the dam indicate that movements have slowed considerably and, given the accuracy limitations of the surveys, have essentially ceased.
b. Foundation pore pressures have been stable with no response to the elimination of the free water pond within the TMF-2 impoundment.
c. Pore pressures in the till fill of the dam have exhibited stable to gradual declines in pore pressures, which are at levels below those assumed in the design stability analyses for the dam.
d. Measurement of flow rates from weirs installed at various locations downstream of the TMF-2 Dam indicate a seepage rate (based on lower bound of combined surface water runoff and groundwater discharge) of about 4.7 litres/sec at present, likely to increase to 6.3 litres/sec once the water pond is re-established as the TMF-2 impoundment achieves its closure configuration.
e. The TMF-2 Dam is performing in accordance with its design intent.
4. Monitoring of the East Dam via instrumentation and visual inspections indicates low foundation pore pressures, negligible deformation, minimal seepage, and performance of the structure in conformance with design intent.
5. Piezometers installed within the foundation of the EPPD in 2009 indicate generally low pore pressures that are consistent with design assumptions. To date, pore pressures have demonstrated minimal response to the rising elevation of tailings against the EPPD, although the period of observation thus far is too short to draw firm conclusions in this regard. The piezometers have not reflected the increase in seepage rate observed from late 2009 through 2010 via flow monitoring at SC-4.
6. Monitoring of the SC4 weir at the toe of the EPPD indicates a seepage rate of about 10 litres/sec, which if expressed as unit seepage (i.e. 0.8 litres per minute per meter length of dam) is about four times higher than that for TMF-2 Dam seepage monitoring (0.2
AMEC010594_0035
Mount Polley Mines Corporation Mount Polley Tailings Management Facility 2011 Construction As-Built and Annual Review 06 April 2012
VM00560A 23883.docx Page 34
litres per minute per meter length of dam). The higher seepage rate is the result of the water pond in the EZP impoundment in contact with the open pit walls and the PAG rock dump, without the intervening till blanket as exists upstream of the TMF-2 Dam.
7. With the TMF-2 impoundment essentially without a free water pond, there is more than ample storage capacity to accommodate the Inflow Design Flood (IDF), which for the Huckleberry tailings impoundments is a 4-day duration Probable Maximum Flood (PMF).
8. The EPPD, at its current crest elevation of 1014 m, provides for sufficient tailings, waste rock, and flood storage capacity in the EZP impoundment through 2011, by which time the EPPD will have been raised to its 2011 target crest El. 1030 m.
Recommendations made on the basis of this annual review and as-built report are as follows:
1. A crest survey of the TMF-2 Dam on centerline should be undertaken in the summer of 2011. This survey should be compared to that completed for the finished dam in 2007, to estimate any potential crest settlement that has occurred since that as-built survey. Given haul truck traffic on the crest of the dam, it is likely that some degree of compaction of the NAG rockfill subsequent to the as-built survey would be included in any indicated settlements.
2. In 2011, alignments for the EZP impoundment closure spillway should be investigated and assessed, and the closure spillway design prepared.
12.0 REPORT CLOSURE
This report has been prepared for the exclusive use of Mount Polley Mine Corporation for specific application to the area within this report. Any use which a third party makes of this report, or any reliance on or decisions made based on it, are the responsibility of such third parties. AMEC accepts no responsibility for damages, if any, suffered by any third party as a result of decisions made or actions based on this report. It has been prepared in accordance with generally accepted geotechnical and tailings dam engineering practices. No other warranty, expressed or implied, is made.
Respectfully submitted,
AMEC Earth & Environmental, a division of AMEC Americas Limited
Reviewed by:
Dmitri Ostritchenko, EIT Geotechnical Engineer
Michael Davies, Ph.D, P.Eng. Vice President Mining
AMEC010594_0036
Mount Polley Mines Corporation Mount Polley Tailings Management Facility 2011 Construction As-Built and Annual Review 06 April 2012
VM00560A 23883.docx Page 35
Daryl Dufault, P.Eng. Project Manager
Todd E. Martin, P.Eng., P.Geo. Technical Advisor
AMEC010594_0037
Mount Polley Mines Corporation Mount Polley Tailings Management Facility 2011 Construction As-Built and Annual Review 06 April 2012
VM00560A 23883.docx Page 36
REFERENCES
AGRA (1996). “Huckleberry Project – Sediment Control Plan” November.
AGRA (1997a). “Huckleberry Project Design Report - Tailings and Waste Management Facilities.” February 28.
AGRA (1997b). “Huckleberry Project – As-built Report for the TMF-2 Starter Dam and Related Structures.” September 30.
AGRA (1997c). “Estimate of Runoff flows and TMF-2 Impoundment Seepages at Sediment Control Structures and Tahtsa Reach”, letter report, April 17.
AGRA (1998a). “Huckleberry Mine - 1998 (Year 1) Construction, Revised Design for the East Section of the TMF-2 Dam.” March 25.
AGRA (1998b). “Huckleberry Mine – Mass Balance Model for Tailings Management Facilities.” May.
AGRA (1998c). “Huckleberry Mine - 1998 Construction, Construction Monitoring Manual.” June 12.
AMEC (2002a). “Huckleberry TMF-2 Tailings Dam – Winter Construction Procedures for Acceptance of Frozen Core Material Below New Fill”, April 4.
AMEC (2002b). “TMF-2 2001 Construction As-Built Report.” May.
AMEC (2002c). “Huckleberry Mine Tailings Management Facility – Final Dam Configuration for El. 1075 m Crest Elevation: Stability Analyses and Volume Estimates.” December 17.
AMEC010594_0038
Mount Polley Mines Corporation Mount Polley Tailings Management Facility 2011 Construction As-Built and Annual Review 06 April 2012
VM00560A 23883.docx Page 37
AMEC (2002d). “TMF-2 Tailings Dam Raising Winter Construction and QA/QC Procedures.” December 18.
AMEC (2009c) “Huckleberry TMF-2 and East Pit Plug Dams – Review of Seepage Conditions”, memorandum, 14 December 2009.
AMEC (2010a). “TMF-2 Spillway and Outfall Channel for Closure - Hydrotechnical Design Report”.
AMEC (2010b). “Huckleberry Mine Tailings Management Facilities – 2009 Construction As-Built Report and Annual Review”
AMEC010594_0039
Mount Polley Mines Corporation Mount Polley Tailings Management Facility 2011 Construction As-Built and Annual Review 06 April 2012
VM00560A 23883.docx Page 38
AMEC (2011a). “Huckleberry Mine Tailings Management Facilities – 2010 Construction As-Built Report and Annual Review”
AMEC (2011b). “Huckleberry Mine Tailings Management Facilities – Sediment Control Pond SC4A: Design Report,” September 02.
Canadian Dam Association (1999). “Dam Safety Guidelines” January.
Cundall, P. (1995). “FLAC V3. Fast Lagrangian Analysis of Continua”. Itasca Consulting Group Inc., Minneapolis, Minnesota.
Li, C.Y. (1967). “Construction pore pressures in three earth dams”, ASCE Journ. of Soil Mech. & Fdns. Div., SM2, March, pp. 1-26.
MEM (2002). “Guidelines for Annual Reports; Dam Safety Inspections.” February 14.
Rivard, P.J. and T.E. Goodwin (1978). “Geotechnical Characteristics of Compacted Clays for Earth Embankments in the Prairie Provinces”, Canadian Geotech. Journal Vol. 15, pp. 391-401.
Sherman, W.C. and G.W. Clough (1968). “Embankment pore pressures during construction”, ASCE Journ. of Soil Mech. & Fdns. Div., SM2, March, pp. 527-553.