47
America’s Dirtiest Power Plants Their Oversized Contribution to Global Warming and What We Can Do About It

America’s Dirtiest Power PlantsTheir Oversized Contribution to Global
Warming and What We Can Do About It

Written by:
Jordan Schneider and Travis Madsen, Frontier Group
Julian Boggs, Environment America Research & Policy Center
September 2013
America’s Dirtiest Power Plants
Their Oversized Contribution to Global Warming and What We Can Do About It

AcknowledgmentsThe authors thank Jeff Deyette, Senior Energy Analyst at Union of Concerned Scientists; Liz Perera, Senior Washington Representative, and Debbie Sease, Legislative Director, at Sierra Club; Mike Obeiter, Senior Associate, Climate and Energy Program at World Resources Institute; Starla Yeh, Policy Analyst, Climate and Clean Air Program at Natural Resources Defense Council; and others for providing useful feedback and insightful suggestions on drafts of this report. We also thank Frank Iannuzzi at Environment America Research & Policy Center for contributing to this report; and Tony Dutzik and Ben Davis at Frontier Group for providing editorial support.
The authors bear responsibility for any factual errors. The views expressed in this report are those of the authors and do not necessarily reflect the views of our funders or those who provided review.
© 2013 Environment America Research & Policy Center
Environment America Research & Policy Center is a 501(c)(3) organization. We are dedicated to protecting our air, water and open spaces. We investigate problems, craft solutions, educate the public and decision-makers, and help the public make their voices heard in local, state and national debates over the quality of our environment and our lives. For
more information about Environment America Research & Policy Center or for additional copies of this report, please visit www.environmentamericacenter.org.
Frontier Group conducts independent research and policy analysis to support a cleaner, healthier and more democratic society. Our mission is to inject accurate information and compelling ideas into public policy debates at the local, state and federal levels. For more information about Frontier Group, please visit www.frontiergroup.org.
Cover photo: Georgia Power Company’s Plant Scherer in Juliette, Georgia, is the nation’s most-polluting power plant. Each year, it emits more carbon dioxide pollution than that produced by energy consumption in Maine. See Table 1 in report.
Photo Credit: TinRoof Marketing & Design
Design and Layout: To the Point Publications, www.tothepointpublications.com

Table of Contents
Executive Summary . . . . . . . . . . . . . . . . . . . . . . . . . . . . . . . . . . . . . . . . . . . . . 4
Introduction . . . . . . . . . . . . . . . . . . . . . . . . . . . . . . . . . . . . . . . . . . . . . . . . . . . 8
The Dirtiest U.S. Power Plants Are a Major Source of Global Warming Pollution . . . . . . . . . . . . . . . . . . . . . . . . . . . . . . . . . . . . . . 10
Cutting U.S. Power Plant Pollution Can Help Prevent the Worst Impacts of Global Warming . . . . . . . . . . . . . . . . . . . . . . . . . . . . . . . 16
Carbon Pollution Standards Are Needed to Clean Up Existing Power Plants. . . . . . . . . . . . . . . . . . . . . . . . . . . . . . . . . . . . . . . . . . . 20
Policy Recommendations. . . . . . . . . . . . . . . . . . . . . . . . . . . . . . . . . . . . . . . . 22
Methodology . . . . . . . . . . . . . . . . . . . . . . . . . . . . . . . . . . . . . . . . . . . . . . . . . . 24
Appendices . . . . . . . . . . . . . . . . . . . . . . . . . . . . . . . . . . . . . . . . . . . . . . . . . . . . . 26
Notes . . . . . . . . . . . . . . . . . . . . . . . . . . . . . . . . . . . . . . . . . . . . . . . . . . . . . . . . . 42

4 America’s Dirtiest Power Plants
Executive Summary
Global warming is one of the most profound threats of our time, and we’re already start-ing to feel the impacts – especially when it
comes to extreme weather. From Hurricane Sandy to devastating droughts and deadly heat waves, ex-treme weather events threaten our safety, our health and our environment, and scientists predict things will only get worse for future generations unless we cut the dangerous global warming pollution that is fueling the problem. Power plants are the largest source of global warming pollution in the United States, responsible for 41 percent of the nation’s production of carbon dioxide pollution, the leading greenhouse gas driving global warming.
America’s power plants are among the most signifi-cant sources of carbon dioxide pollution in the world. The 50 most-polluting U.S. power plants emit more than 2 percent of the world’s energy-related carbon dioxide pollution – or more pollution than every nation except six worldwide.
Despite their enormous contribution to global warm-ing, U.S. power plants do not face any federal limits on carbon dioxide pollution. To protect our health, our safety and our environment from the worst impacts of global warming, the United States should clean up the dirtiest power plants.
A small handful of the dirtiest power plants produce a massive and disproportionate share of the nation’s global warming pollution.
• In 2011, the U.S. power sector contributed 41 percent of all U.S. emissions of carbon dioxide, the leading pollutant driving global warming.
• There are nearly 6,000 electricity generating facili-ties in the United States, but most of the global warming pollution emitted by the U.S. power sector comes from a handful of exceptionally dirty power plants. For example, about 30 percent of all power-sector carbon dioxide emissions in 2011 came from the 50 dirtiest power plants; about half came from the 100 dirtiest plants; and about 90 percent came from the 500 dirtiest plants. (See Figure ES-1.)
Figure ES-1. The 50 Dirtiest Power Plants Contribute Significantly to U.S. Carbon Dioxide Pollution (Million Metric Tons – MMT), 2011

Executive Summary 5
• The dirtiest power plant in the United States, Georgia Power’s Plant Scherer, produced more than 21 million metric tons of carbon dioxide in 2011 – more than the total energy-related emissions of Maine. (See Table ES-1.)
• Dirty power plants produce a disproportionate share of the nation’s global warming pollution – especially given the relatively small share of total electricity they produce. For example, despite producing 30 percent of all power-sector carbon dioxide emissions, the 50 dirtiest power plants only produced 16 percent of the nation’s electricity in 2011.
The dirtiest U.S. power plants are major sources of global warming pollution on a global scale.
• If the 50 most-polluting U.S. power plants were an independent nation, they would be the seventh-largest emitter of carbon dioxide in the world, behind Germany and ahead of South Korea. (See Figure ES-2.) These power plants emitted carbon dioxide pollution equivalent to more than half the emissions of all passenger vehicles in the United States in 2010.
Table ES-1. Emissions Equivalencies for the Nation’s Top Emitters of Global Warming Pollution
Total 2011
Emissions (Million Metric Tons of
Carbon Dioxide)
Percent of Total U.S.
Carbon Dioxide Emissions
Percent of Global Carbon Dioxide Emissions from
Energy UseThese Plants Produce Carbon Dioxide
Greater Than or Equivalent To…
Top Polluting Plant (Scherer
Power Plant, GA)21 0.4% 0.1%
•The total energy-related emissions of Maine
•The pollution produced by electricity use in all New England homes in a year
Top 10 Polluting Power Plants
179 3.4% 0.5%
•The pollution emitted by all the passenger vehicles in New York and California
•The total energy-related emissions of Venezuela
Top 50 Polluting Power Plants
656 12.4% 2.0%
•Half the emissions of all passenger vehicles in the United States
•The total energy-related emissions of Texas
Top 100 Polluting Power Plants
1,052 19.9% 3.2%
•The emissions of all passenger vehicles in the United States
•The pollution produced by electricity use in all U.S. homes in a year

6 America’s Dirtiest Power Plants
0
1,000
2,000
3,000
4,000
5,000
6,000
7,000
8,000
9,000
10,000
China UnitedStates
All U.S.PowerPlants
India Russia Japan Germany 50 DirtiestU.S.
PowerPlants
SouthKorea
Canada
Figure ES-2. Carbon Dioxide Pollution Emitted by the 50 Dirtiest Power Plants Compared to Other Countries (MMT CO2)
• The 100 most-polluting U.S. power plants produced more than 3 percent of the world’s carbon dioxide emissions from energy use in 2011, while the 500 most-polluting power plants were responsible for about 6 percent.
To protect our health, our safety, and our environment from the dangers of global warming, America must clean up polluting power plants.
• The Obama Administration should set strong limits on carbon dioxide pollution from new power plants to prevent the construction of a new generation of dirty power plants, and force exist-ing power plants to clean up by setting strong limits on carbon dioxide emissions from all exist-ing power plants.
º New plants – The Environmental Protection Agency (EPA) should work to meet its Sep-tember 2013 deadline for re-proposing a stringent emissions standard for new power plants. It should also set a deadline for final-izing these standards no later than June 2015.
º Existing plants – The EPA should work to meet the timeline put forth by President Obama for proposing and finalizing emis-sions standards for existing power plants. This timeline calls for limits on existing plants to be proposed by June 2014 and finalized by June 2015. The standards should be based on the most recent climate science and designed to achieve the emissions reduction targets that are necessary to avoid the worst impacts of global warming.
Executive Summary 7
In addition to cutting pollution from power plants, the United States should adopt a suite of clean energy policies at the local, state, and federal levels to curb emissions of carbon dioxide from energy use in other sectors. In particular, the United States should prioritize es-tablishing a comprehensive, national plan to reduce carbon pollution from all sources – including trans-portation, industrial activities, and the commercial and residential sectors.
Other policies to curb emissions include:
• Retrofitting three-quarters of America’s homes and businesses for improved energy efficiency, and implementing strong building energy codes to dramatically reduce fossil fuel consumption in new homes and businesses.
• Adopting a federal renewable electricity standard that calls for 25 percent of America’s electricity to come from clean, renewable sources by 2025.
• Strengthening and implementing state energy efficiency resource standards that require utili-ties to deliver energy efficiency improvements in homes, businesses and industries.
• Installing more than 200 gigawatts of solar panels and other forms of distributed renewable energy
at residential, commercial and industrial buildings over the next two decades.
• Encouraging the use of energy-saving combined heat-and-power systems in industry.
• Facilitating the deployment of millions of plug-in vehicles that operate partly or solely on electricity, and adopting clean fuel standards that require a reduction in the carbon intensity of transportation fuels.
• Ensuring that the majority of new residential and commercial development in metropolitan areas takes place in compact, walkable communities with access to a range of transportation options.
• Expanding public transportation service to double ridership by 2030, encouraging further rider-ship increases through better transit service, and reducing per-mile global warming pollution from transit vehicles. The U.S. should also build high-speed rail lines in 11 high-priority corridors by 2030.
• Strengthening and expanding the Regional Green-house Gas Initiative, which limits carbon dioxide pollution from power plants in nine northeast-ern state, and implementing California’s Global Warming Solutions Act (AB32), which places an economy-wide cap on the state’s greenhouse gas emissions.

8 America’s Dirtiest Power Plants
Introduction
It doesn’t take a trip to the Arctic Circle to see evidence of global warming these days. The im-pacts of a warming planet are now appearing
on our doorsteps, making headlines in the morning paper. The United States has seen much more than its usual share of extreme downpours and intense heat waves in recent years, and emerging science links the increase in frequency and severity of some of these events to global warming.1 New research also shows that a warmer world is likely to exacer-bate the impacts of extreme weather events, such as hurricanes, floods, drought and wildfires.2 Many extreme weather events of 2012 foreshadow the kind of disruption global warming may cause in the future. From the late-season “superstorm” Hurricane Sandy wreaking havoc on the East Coast, to early-season wildfires destroying thousands of homes in the West, to year-round drought conditions parch-ing the largest area of the continental U.S. since 1956, extreme weather events are occurring with increasing frequency and severity.3
Since 2007, federally declared weather-related disasters in the United States have affected counties housing 243 million people – or nearly four out of five Americans.4 These events have caused billions of dollars in economic damage, have harmed our natural environment, and have jeopardized the lives of thousands of people. Climate science tells us that the impacts of these events will only worsen
for future generations unless we immediately and dramatically reduce the dangerous carbon pollution that is fueling the problem. Meeting that challenge can seem overwhelming, and it’s certainly not going to be easy. But the United States and the world can make a major down-payment toward those emission reductions by cleaning up our biggest sources of pollution.
In the case of the United States, that means power plants. As this report will show, a small number of dirty power plants make a massive and dispropor-tionate contribution to the nation’s global warming emissions. Cleaning up our existing power plants – and preventing construction of a new generation of dirty power plants – would make a significant differ-ence in fighting global warming.
For the first time in history, the United States is preparing to take action to clean up these massive sources of carbon pollution. In 2012, the Environ-mental Protection Agency (EPA) issued the first-ever pollution standards for new power plants, and this summer President Obama directed the EPA to estab-lish a standard for existing power plants by 2015.5
By finalizing strong carbon pollution standards for new and existing power plants, the U.S. will seize one of its best available opportunities to significantly re-duce carbon pollution – helping to forestall the worst impacts of global warming for future generations.

Introduction 9
Photo: Keith Syvinski
By finalizing strong carbon pollution standards for new and existing power plants, the U.S. will seize one of its best available opportunities to significantly reduce carbon pollution – helping to forestall the worst impacts of global warming for future generations.
Indiana Michigan Power Company’s coal-fired Rockport power plant in Spencer County, Indiana, is the 11th largest emitter of carbon dioxide pollution in the U.S. power sector. It produces global warming pollution equivalent to that produced by 3.2 million passenger vehicles in a year. See Table A-2 in Appendix.

10 America’s Dirtiest Power Plants
Carbon dioxide is the leading greenhouse gas driving global warming, and power plants are the largest source of carbon dioxide
pollution in the United States.6 Burning fossil fuels for electricity generation produced about 41 percent of total U.S. carbon dioxide emissions in 2011.7 A disproportionate share of these power-sector carbon dioxide emissions come from a small subset of the nation’s dirtiest power plants, particularly coal-fired power plants. However, despite their enormous contribution to global warming, U.S. power plants currently face no federal limits on carbon dioxide pollution. Cleaning up these dirty power plants with strong, nationwide pollution standards is one of the most important steps the U.S. can take to curb global warming pollution.
The 50 Dirtiest Power Plants Contribute a Massive and Disproportionate Share of Carbon Dioxide EmissionsThere are nearly 6,000 electricity generating facilities in the United States, but most of the global warming pollution emitted by the U.S. power sector comes from a handful of exceptionally dirty power plants.8 These dirty power plants also produce a dispropor-tionately large amount of the nation’s total global warming pollution. For example, just one of these
dirty power plants, Georgia Power’s Plant Scherer, produces more global warming pollution each year than all the energy-related emissions of Maine.9
• In 2011, the 50 dirtiest U.S. power plants were responsible for 30 percent of all U.S. power-sector emissions of carbon dioxide, 12 percent of total U.S. energy-related emissions, and 2 percent of worldwide energy-related emissions.10 (See Figure 1.) If the 50 dirtiest power plants were an independent nation, they would be the seventh-largest emitter of carbon dioxide pollution in the world, behind Germany and ahead of South Korea.11 (See Figure 2.) Their emissions in 2011 were greater than half the emissions of all passenger vehicles in the United States in 2010.12 (See Table 1 for additional comparisons.)
• The 100 dirtiest plants were responsible for about half of total carbon dioxide emissions from the U.S. electricity sector in 2011, and more than 3 percent of total worldwide emissions from energy use.13
• The 500 dirtiest power plants were responsible for around 90 percent of total carbon dioxide emissions from the U.S. electricity sector, and about 6 percent of total worldwide emissions from energy use.14
The Dirtiest U.S. Power Plants Are a Major Source of Global Warming Pollution

The Dirtiest U.S. Power Plants Are a Major Source of Global Warming Pollution 11
Figure 1. The 50 Dirtiest Power Plants Contribute Significantly to U.S. Carbon Dioxide Emissions
0
1,000
2,000
3,000
4,000
5,000
6,000
7,000
8,000
9,000
10,000
China UnitedStates
All U.S.PowerPlants
India Russia Japan Germany 50 DirtiestU.S.
PowerPlants
SouthKorea
Canada
Figure 2. Carbon Dioxide (CO2) Pollution Emitted by the 50 Dirtiest Power Plants Compared to CO2
Pollution in Other Countries (MMT)
12 America’s Dirtiest Power Plants
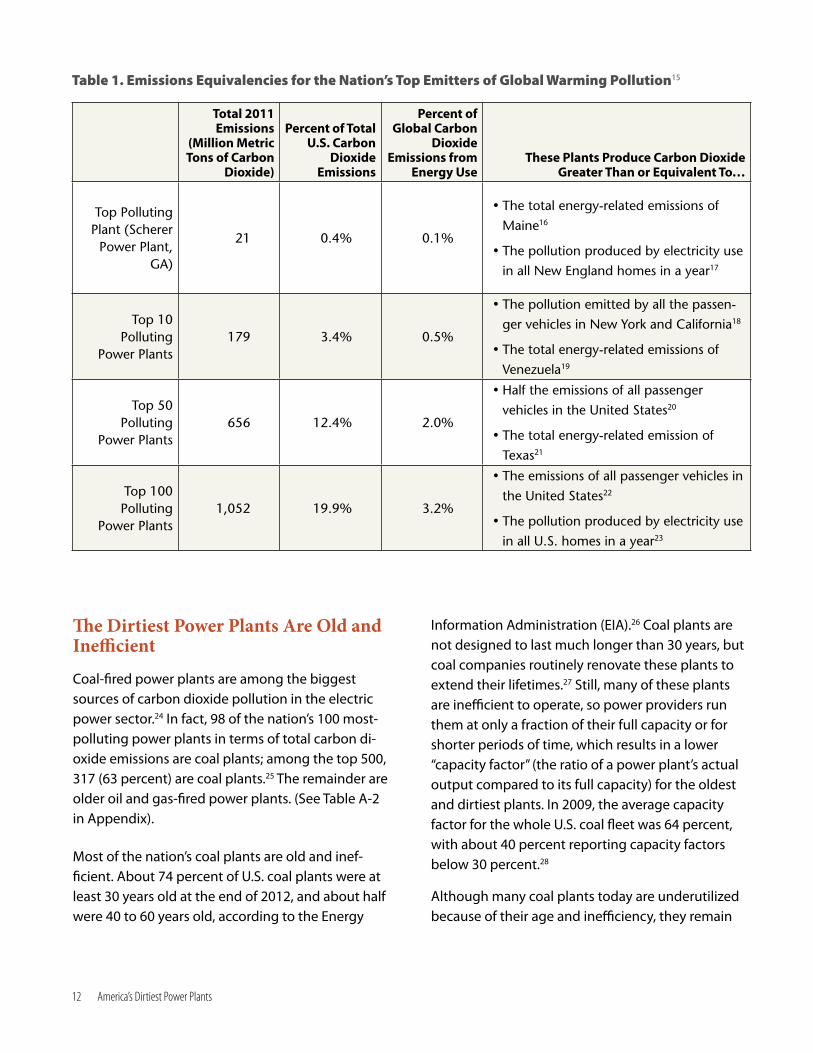
The Dirtiest Power Plants Are Old and Inefficient
Coal-fired power plants are among the biggest sources of carbon dioxide pollution in the electric power sector.24 In fact, 98 of the nation’s 100 most-polluting power plants in terms of total carbon di-oxide emissions are coal plants; among the top 500, 317 (63 percent) are coal plants.25 The remainder are older oil and gas-fired power plants. (See Table A-2 in Appendix).
Most of the nation’s coal plants are old and inef-ficient. About 74 percent of U.S. coal plants were at least 30 years old at the end of 2012, and about half were 40 to 60 years old, according to the Energy
Table 1. Emissions Equivalencies for the Nation’s Top Emitters of Global Warming Pollution15
Total 2011 Emissions
(Million Metric Tons of Carbon
Dioxide)
Percent of Total U.S. Carbon
Dioxide Emissions
Percent of Global Carbon
Dioxide Emissions from
Energy UseThese Plants Produce Carbon Dioxide
Greater Than or Equivalent To…
Top Polluting Plant (Scherer
Power Plant, GA)
21 0.4% 0.1%
•The total energy-related emissions of
Maine16
•The pollution produced by electricity use
in all New England homes in a year17
Top 10 Polluting
Power Plants 179 3.4% 0.5%
•The pollution emitted by all the passen-
ger vehicles in New York and California18
•The total energy-related emissions of
Venezuela19
Top 50 Polluting
Power Plants656 12.4% 2.0%
•Half the emissions of all passenger
vehicles in the United States20
•The total energy-related emission of
Texas21
Top 100 Polluting
Power Plants1,052 19.9% 3.2%
•The emissions of all passenger vehicles in
the United States22
•The pollution produced by electricity use
in all U.S. homes in a year23
Information Administration (EIA).26 Coal plants are not designed to last much longer than 30 years, but coal companies routinely renovate these plants to extend their lifetimes.27 Still, many of these plants are inefficient to operate, so power providers run them at only a fraction of their full capacity or for shorter periods of time, which results in a lower “capacity factor” (the ratio of a power plant’s actual output compared to its full capacity) for the oldest and dirtiest plants. In 2009, the average capacity factor for the whole U.S. coal fleet was 64 percent, with about 40 percent reporting capacity factors below 30 percent.28
Although many coal plants today are underutilized because of their age and inefficiency, they remain

The Dirtiest U.S. Power Plants Are a Major Source of Global Warming Pollution 13
among the worst contributors to global warming pollution. For example, coal-fired power plants were responsible for nearly 80 percent of the global warming pollution produced by electric power plants in 2011, even though they produced only 42 percent of the nation’s electricity.29 The 50 dirti-est plants produced 30 percent of all power-sector carbon dioxide emissions, but only 16 percent of electricity nationwide in 2011.30 In some states, this imbalance is even more extreme. (See Figure 3.)
Figure 3. Share of Statewide Power-Sector Emissions vs. Share of Electricity Generation for Top 5 Emitters in 20 States31
81%
82%
83%
85%
88%
88%
89%
89%
90%
91%
92%
93%
93%
94%
96%
96%
97%
99%
99%
100%
22%
11%
40%
46%
35%
60%
44%
46%
78%
69%
8%
65%
50%
23%
52%
48%
3%
53%
49%
46%
0% 20% 40% 60% 80% 100%
AZMETN
MNWA
KSWYORUTID
AKNDNE
NMMTVTNH
RIDESD
Top 5 Shareof TotalElectricityGeneration(2011)
Top 5 Shareof TotalPower-SectorEmissions(2011)
In some states, emissions from a handful of the dirtiest power plants can exceed emissions from the rest of the economy, including the industrial and transportation sectors. For example, in five states – Wyoming, Montana, North Dakota, West Virginia, and New Mexico – the five dirtiest power plants are responsible for about half of total state-wide energy-related emissions; and in 31 states, these top polluters are responsible for at least one-quarter of statewide energy-related emis-sions. (See Table 2 and Table A-3 in the Appendix.)

14 America’s Dirtiest Power Plants
Table 2. Emissions of Top 5 Polluting Plants as a Share of Power-Sector and Statewide Total Carbon Dioxide Emissions in 50 States, 201132
State
Total Emissions of Top 5 Power Plants (Million
Metric Tons of Carbon Dioxide)
Top 5 Share of Power-Sector Emissions (2011) Top 5 Share of Total Emissions33
Wyoming 38.1 89% 59%
Montana 16.1 96% 55%
North Dakota 27.1 93% 52%
West Virginia 49.3 69% 52%
New Mexico 29.1 94% 50%
Utah 30.6 90% 49%
Arizona 43.0 81% 46%
Nebraska 24.7 93% 45%
Arkansas 32.0 92% 45%
Kansas 30.8 88% 41%
Alabama 48.1 63% 36%
Delaware 3.9 99% 36%
North Carolina 43.0 71% 36%
Missouri 50.1 62% 35%
Georgia 52.1 76% 34%
Iowa 29.7 75% 34%
Kentucky 50.4 54% 34%
South Carolina 26.3 70% 34%
Tennessee 34.4 83% 34%
Oklahoma 35.0 69% 32%
Hawaii 5.6 77% 31%
New Hampshire 4.9 97% 31%
Wisconsin 29.1 67% 29%
Maryland 18.6 80% 28%
Nevada 9.3 64% 28%
Colorado 26.2 67% 28%
Rhode Island 3.5 99% 28%
Michigan 42.8 64% 27%
Indiana 58.7 52% 27%
Minnesota 26.3 85% 27%
Mississippi 14.1 61% 25%
Ohio 54.7 50% 24%
South Dakota 2.9 100% 23%
Pennsylvania 55.7 48% 22%

The Dirtiest U.S. Power Plants Are a Major Source of Global Warming Pollution 15
State
Total Emissions of Top 5 Power Plants (Million
Metric Tons of Carbon Dioxide)
Top 5 Share of Power-Sector Emissions (2011) Top 5 Share of Total Emissions33
Oregon 5.9 89% 22%
Illinois 44.0 46% 19%
Virginia 16.8 60% 19%
Florida 41.7 37% 18%
Massachusetts 10.5 66% 16%
Connecticut 5.9 75% 16%
Washington 6.7 88% 15%
Louisiana 35.0 61% 12%
Maine 2.8 82% 11%
Texas 74.6 30% 10%
New Jersey 9.9 64% 10%
New York 11.0 32% 7%
Alaska 2.8 75% 6%
Idaho 0.4 91% 4%
California 7.5 19% 2%
Vermont 0.0 96% 0%
Despite the large contribution of fossil fuel-fired power plants to U.S. global warming emissions, neither these highly polluting plants nor proposed new power plants face any federal regulations limit-ing emissions of carbon dioxide or other greenhouse
gases. As a result, these power plants have emitted carbon dioxide pollution unchecked for decades, and there is no guarantee that new power plants will be built in ways that minimize their contribution to global warming.
Table 2. (continued)

16 America’s Dirtiest Power Plants
Cutting U.S. Power Plant Pollution Can Help Prevent the Worst Impacts of Global Warming
Global warming threatens our health, our safety, and our environment. Rising global average temperatures and other climate
impacts have already resulted in extreme precipita-tion events and heat waves in the United States, and climate science tells us that global warming will likely lead to further changes in weather extremes.34 Extreme weather events such as Hurricane Sandy, extended droughts, heat waves, and floods caused by heavy precipitation are likely to become more common in a warming world.35 At the same time, global warming-induced sea-level rise, changes in summer and winter precipitation patterns, and eco-system changes could reduce the ability of natural and man-made systems to withstand even normal weather events.
To avoid the worst impacts of global warming, worldwide emissions of carbon dioxide and other global warming pollutants will have to peak roughly three years from now, and then decline quickly and dramatically – dropping by more than 50 percent by 2050.36 In the United States, addressing this chal-lenge means cleaning up our biggest sources of global warming pollution – especially dirty power plants, which are responsible for more than 40 per-cent of our emissions of carbon dioxide each year.37
A handful of exceptionally dirty power plants are the worst contributors to this problem. By focusing on cleaning up power plants – our country’s largest single source of carbon pollution – and preventing construction of a new generation of dirty power
plants in the United States, America can make a meaningful difference in preventing the worst im-pacts of global warming.
The U.S. must act now to prevent the worst impacts of global warmingIn 2007, the Intergovernmental Panel on Climate Change (IPCC) – the world’s foremost scientific authority on the subject – concluded that “warm-ing of the climate system is unequivocal” and that “[m]ost of the observed increase in global average temperatures since the mid-20th century is very likely due to the observed increase in anthropo-genic [greenhouse gas] concentrations.”38 In 2013, in a draft of its upcoming Fifth Assessment Report on climate change, the IPCC strengthened this asser-tion, citing “near certainty” that global warming is human-caused and suggesting that seas could rise by as much as three feet by the end of the century if greenhouse gas emissions continue unabated.39
Clear signs of global warming have already begun to emerge:
• Global average sea and air temperatures in 2010 were tied for the hottest on record, according to the National Oceanic and Atmospheric Admin-istration (NOAA).40 2001 to 2010 was the hottest decade on record, with average temperatures estimated to be 0.83˚F hotter than the 1961-1990 norm.41 2010 was also the wettest year on record based on global average precipitation.42
Cutting U.S. Power Plant Pollution Can Help Prevent the Worst Impacts of Global Warming 17
• Oceans have absorbed 80 percent of the extra heat in the climate system, causing ocean water to expand.43 Coupled with melting glaciers, this has caused sea levels to rise by about eight inches – with the rate of increase accelerating.44
• Hurricanes have become more intense, and the frequency of extreme rain and snowstorms has increased.45
• At the same time, droughts in many parts of the world have become longer and more severe, especially in the tropics and subtropics.46
• In the United States, warmer average annual temperatures are connected to increases in extreme precipitation and more intense heat waves. Furthermore, the U.S. has experienced an increase in the frequency and severity of extreme weather events, including floods, prolonged drought, more intense wildfires, and stronger tropi-cal storms and hurricanes.47
The more global warming pollution that humanity emits, the more serious the consequences. And the changes will be largely irreversible for a thousand years after emissions stop.48
On our current emissions path, humanity risks in-creasing the average global temperature by 4°C (7.2°F) or more (above the pre-industrial era) by the end of this century even if current emission reduc-tion commitments and pledges are met, according to a 2012 report by the World Bank.49 Warming on this scale would have catastrophic consequences, includ-ing:
• Sea level rise of as much as 3 feet in the next century, causing extensive coastal inundation and increasing the risk of storm surge flooding in major coastal cities.50 By 2300, global mean sea levels could rise as high as 13 feet above present-day levels.51
• A 150 percent increase in ocean acidity above pre-industrial levels, resulting in wide-ranging, negative impacts on marine species and ecosys-tems, with particularly severe damage to coral reefs and fisheries.52
• An increase of 20-30 percent in the amount of precipitation falling during heavy rainstorms, increasing the risk of major flooding events in many parts of the world.53
• Increasing aridity, drought and extreme tempera-tures in Africa, southern Europe and the Middle East, and most of the Americas, Australia, and Southeast Asia.54
Global Warming Endangers Public HealthHotter temperatures bring about numerous threats to public health. High temperatures combine with sunlight, nitrogen oxides and volatile organic com-pounds to create ozone “smog,” which damages the respiratory system, reduces lung function, and aggravates asthma and other respiratory diseases.55 The Union of Concerned Scientists estimates that, by 2020, students in the United States could experience more than 900,000 additional missed school days, and seniors and infants could experience more than 5,000 additional hospitalizations due to increases of ozone smog exposure that result from the higher temperatures caused by global warming.56 Higher temperatures will also allow pollen allergens such as ragweed to proliferate, causing those who suf-fer from seasonal allergies to experience worsening symptoms, such as hay fever and asthma.57
Global warming can also be expected to increase the number of deaths caused by heat stress.58 Exces-sive heat events happen when high temperatures combine with other weather conditions – such as dew point temperature, cloud cover, wind speed and surface atmospheric pressure throughout the day –

18 America’s Dirtiest Power Plants
and contribute to heat-related deaths in a particular location.59 According to a 2012 study by the Natural Resources Defense Council (NRDC), excessive heat events caused by global warming could kill up to 150,000 people in America’s 40 largest cities by the end of the century.60
Higher temperatures may also change the patterns of occurrence of various infectious diseases. A 2009 study, for example, found a correlation between warmer temperatures and increased reports of infec-tion by West Nile Virus.61 Global warming may also increase the risk of more frequent and more wide-spread outbreaks of waterborne illnesses by allow-ing warm-water pathogens to expand into cooler climates, or by exposing more urban water bodies to sewage contamination after flooding caused by major precipitation events, according to NRDC.62
Increases in droughts and flooding caused by global warming can also reduce water available for drinking or for irrigation; they can also harm crops directly, diminishing food variety, nutritional content, and availability, all of which can contribute to malnutri-tion and the spread of disease.63 Finally, sea-level rise and disasters such as strong storms and floods can damage urban infrastructure and displace existing communities.64
Global warming pollutants are not the only emis-sions from power plants that harm human health. For example, in 2010, two-thirds of all airborne mercury pollution in the United States came from the smokestacks of coal-fired power plants.65 Mercury is a potent neurotoxicant, and exposure to mercury during critical periods of brain development can contribute to irreversible deficits in verbal skills, dam-age to attention and motor control, and reduced IQ.66 Coal- and natural gas-fired power plants also emit nitrogen oxides (NOX), which exacerbate ozone smog pollution, as well as other pollutants that contrib-ute to particulate matter and acid rain. Like smog, particulate matter pollution contributes to a host of respiratory and cardiovascular ailments.67 Sulfur
dioxide, too, is a respiratory irritant for sensitive populations.68 In addition, it is a major component of acid rain that has damaged forests across the eastern United States.69
Cleaning Up U.S. Power Plants Would Cut Carbon Pollution at a Global ScaleHumanity as a whole must limit emissions to no more than 1 trillion metric tons of carbon dioxide from 2000 through 2050 in order to have a 75 percent chance of limiting the global temperature increase to 3.6° F (2° C) above the pre-industrial era – a target the international community has set to limit the most severe global warming impacts.70 For the world, this means that emissions will need to peak by 2015 and decline by more than half by 2050 to have a chance at preventing the worst impacts of climate change.71 For the United States and other developed countries, emission reductions must occur more quickly and more steeply, with reductions of at least 25 to 40 per-cent below 1990 levels by 2020 and 80 to 95 percent by 2050.72
As of 2011, annual U.S. greenhouse gas emissions were still 10 percent above 1990 levels.73 The annual emissions from a small group of the nation’s dirti-est power plants are greatly hindering our ability to meet the emissions reduction targets necessary to avoid the worst impacts of global warming. Replac-ing these power plants with zero-emission energy sources such as wind and solar power, or eliminating the need for the power they produce through en-ergy efficiency and conservation, would reduce U.S. greenhouse gas emissions to 11 percent below 1990 levels, even in the absence of other efforts to reduce emissions.74
Limiting carbon dioxide pollution from new and ex-isting power plants is one of the most effective ways to reduce U.S. global warming pollution in the short run and for decades to come, reducing the risk that
Cutting U.S. Power Plant Pollution Can Help Prevent the Worst Impacts of Global Warming 19
emissions will reach a level that triggers dangerous, irreversible climate change impacts.
Adopting federal limits on carbon dioxide pollution from power plants as part of a suite of policies to reduce global warming pollution at all levels of gov-ernment would help the United States achieve 2020 emissions reduction targets – even in the absence of a federal, economy-wide cap on carbon pollu-tion. For example, Environment America Research & Policy Center’s 2011 report, The Way Forward on Global Warming, demonstrated that with a suite of
local, state and federal policies to increase energy efficiency, deploy clean energy technologies and improve public transportation, the United States could curb emissions of carbon dioxide from en-ergy use by as much as 3.5 percent below 1990 levels by 2020 and 20 percent below 1990 levels by 2030.75 A nationwide cap on carbon pollution from all sources – not just power plants – would al-low the United States to make the remaining emis-sions reductions necessary to prevent the worst impacts of global warming.

20 America’s Dirtiest Power Plants
Carbon Pollution Standards Are Needed to Clean Up Existing Power Plants
The unprecedented threat that global warm-ing poses to our health, our safety and our environment demands that the United
States takes urgent action to reduce emissions of global warming pollution. However, U.S. power plants currently face no federal limits on the amount of carbon dioxide pollution they can emit.
Given the enormous share of global warming pollu-tion contributed by U.S. power plants, limiting car-bon dioxide emissions from both new and existing power plants must be a key part of any strategy to reduce U.S. global warming emissions. Fortunately, the first steps toward setting these standards are already being taken. On June 25, 2013, President Obama announced his plan to address global warm-ing through executive action, using existing statu-tory authority and funds.76 The two most important elements of this plan are finalizing carbon emissions standards for new power plants and directing the EPA to quickly propose and implement a limit on existing plants.77
The EPA proposed a limit on new power plants in March 2012. Since then, the EPA has received more than 3.2 million public comments supporting limiting carbon pollution from power plants, and President Obama has asked the EPA to re-propose a carbon pollution standard for new power plants by September 20, 2013.78
The originally proposed limit restricts global warm-ing pollution for facilities 25 megawatts (MW) or
larger to 1,000 pounds of CO2 per megawatt-hour (MWh) of electricity they produce.79 According to the EPA, this standard was based on commonly used combined-cycle natural gas power plants – a standard that new coal plants are highly unlikely to meet.80 Existing coal plants produce an average of 2,180 lbs CO2/MWh, with the worst plants producing more than 3,000 lbs CO2/MWh.81
The EPA has yet to propose a standard for existing power plants, a large portion of which are aging coal-fired plants. However, the president has directed the EPA to propose and submit carbon pollution limits for existing plants by June 2014 and to finalize those limits the following year.82 (See “The Long Road to Carbon Pollution Limits” on page 21.)
Some states already limit carbon pollution from pow-er plants. California has an economy-wide cap on car-bon dioxide emissions, and nine states from Maine to Maryland participate in the Regional Greenhouse Gas Initiative (RGGI), which caps pollution from power plants in the Northeast. Once finalized, the EPA’s carbon pollution limits for all new power plants nationwide would go a long way toward reducing future U.S. global warming pollution. However, the agency must also move quickly to establish strong federal standards for existing power plants – and force the nation’s largest sources of carbon pollution to clean up.
Carbon Pollution Standards Are Needed to Clean Up Existing Power Plants 21
The Long Road to Carbon Pollution LimitsThe Obama administration’s recent actions indicating progress toward carbon dioxide pollution from power plants are the culmination of a 14-year campaign to clean up the nation’s power plants. In 1999, one year after the EPA declined to include carbon dioxide pollution limits in new vehicle emissions standards, 19 environmental and public interest groups petitioned the EPA to classify carbon dioxide as an air pollutant subject to the Clean Air Act regulation.83 They cited car-bon dioxide’s contribution to global warming – which threatens human health and the environ-ment – as rationale for regulation.84
In 2003, the EPA released an official statement that it did not believe the Act authorized the EPA to regulate global warming pollution, and that even if it did authorize regulating greenhouse gases, the EPA objected to doing so on policy grounds.85 However, the U.S. Supreme Court dis-agreed with the EPA in 2007, ruling with several states and environmental groups that the EPA does indeed have the authority to regulate greenhouse gases, and that its policy objections were insufficient to decline to regulate.86 The court also directed the EPA to determine if greenhouse gases contribute to global warming and, if so, whether global warming endangered public health and welfare.87 By the end of 2009, the EPA officially determined that emissions of carbon dioxide endanger public health and welfare by contributing to global warming.88
In December 2010, the EPA announced its plan to release new performance standards and manda-tory emissions guidelines for all new fossil fuel-fired power plants.89 The EPA proposed an interim carbon pollution standard for new power plants in April 2012 that is in effect until a rule can be finalized.90 This step set the first-ever national limits on the amount of carbon pollution power plants can emit.91

22 America’s Dirtiest Power Plants
Policy Recommendations
To protect our health, our economy, and our environment from the dangers of global warming, America must clean up its dirtiest power plants.
• The Obama Administration should set strong limits on carbon dioxide pollution from new power plants to prevent the construction of a new generation of dirty power plants, and force exist-ing power plants to clean up by setting strong limits on carbon dioxide emissions for all existing power plants.
º New plants – The EPA should work to meet its September 2013 deadline for re-proposing a stringent emissions standard for new power plants. It should also set a deadline for finalizing these standards no later than June 2015.
º Existing plants – The EPA should work to meet the timeline put forth by President Obama for proposing and finalizing emissions standards for existing power plants. This timeline calls for limits on existing plants to be proposed by June 2014 and finalized by June 2015.92 The stan-dards should be based on climate science and designed to achieve the emissions reductions targets that are necessary to avoid the worst impacts of global warming.
In addition to cutting pollution from power plants, the United States should adopt a suite of clean energy policies at the local, state, and federal level to curb emissions of carbon dioxide from energy use in other sectors.
In particular, the United States should prioritize establishing a comprehensive, national plan to reduce carbon pollution from all sources – includ-ing transportation, industrial activities, and the commercial and residential sectors.
Other policies to curb emissions include:
• Retrofitting three-quarters of America’s homes and businesses for improved energy efficiency, and implementing strong building energy codes to dramatically reduce fossil fuel consumption in new homes and businesses.
• Adopting a federal renewable electricity standard that calls for 25 percent of America’s electricity to come from clean, renewable sources by 2025.
• Installing more than 200 gigawatts of solar panels and other forms of distributed renew-able energy at residential, commercial and industrial buildings over the next two decades.
• Strengthening and implementing state energy efficiency resource standards that require utili-ties to deliver energy efficiency improvements in homes, businesses and industries.

Policy Recommendations 23
• Encouraging the use of energy-saving combined heat-and-power systems in industry.
• Setting strong energy efficiency standards for household appliances and commercial equip-ment, and promoting the use of energy-efficient boilers, process heat systems, and energy-saving combined heat-and-power in industrial facilities.
• Facilitating the deployment of millions of plug-in vehicles that operate partly or solely on electric-ity, and adopting clean fuel standards that require a reduction in the carbon intensity of transporta-tion fuels. The U.S. should also adopt strong fuel economy standards for heavy-duty trucks.
• Ensuring that the majority of new residential and commercial development in metropolitan areas takes place in compact, walkable communities with access to a range of transportation options.
• Expanding public transportation service to double ridership by 2030, encouraging further ridership increases through better transit service,
and reducing per-mile global warming pollution from transit vehicles. The U.S. should also build high-speed rail lines in 11 high-priority corridors by 2030.
• Carrying out President Obama’s Executive Order 13514, which requires large reductions in global warming pollution from federal agencies.
• Rejecting proposals to increase our access to and use of carbon-intensive fuels, including current proposals to import tar sands oil from Canada via the Keystone XL pipeline and to open more land to hydraulic fracturing for shale oil and natural gas.
• Strengthening and expanding the Regional Greenhouse Gas Initiative, which limits carbon dioxide pollution from power plants in nine northeastern states, and implementing Califor-nia’s Global Warming Solutions Act (AB32), which places an economy-wide cap on the state’s greenhouse gas emissions.

24 America’s Dirtiest Power Plants
In this report we examine emissions of carbon di-oxide from all utility and non-utility power plants within the United States in 2011. We derive emis-
sions data from fuel consumption figures reported to the U.S. Department of Energy and estimates of the carbon content of each fuel source developed by the U.S. Environmental Protection Agency. Details follow.
• We obtained fuel consumption and electricity generation data for power plants operating in the United States from the U.S. Department of Energy’s Energy Information Administration (EIA), 2011 December EIA-923 Monthly Time Series.93 We focused on fuel consumption for electricity generation, excluding any fuel consumption for the purposes of generating heat.
• We obtained estimates of the carbon dioxide emissions created per unit of energy output of the different fuels used in electricity generation from the U.S. Environmental Protection Agency, Center for Climate Leadership, Emission Factors for Green-house Gas Inventories, November 2011; and U.S. Environmental Protection Agency, Inventory of U.S. Greenhouse Gas Emissions and Sinks: 1990-2011, April 2013. Table 3 lists these coefficients. For all biomass fuels, including wood waste and the biogenic fraction of municipal solid waste, we assigned an emissions value of zero, since these
fuels are already part of the non-fossil portion of the world’s carbon cycle.
• We multiplied fuel consumption in terms of heat content by the appropriate carbon dioxide emissions factors, yielding an estimate of 2011 carbon dioxide emissions by plant. Using database tools, we sorted or aggregated the data in various ways to generate the facts in this report. Our methodology resulted in a value for 2011 carbon dioxide pollution from the power sector very similar to that listed in the EPA’s 2011 greenhouse gas emissions inventory (see above); our analy-sis resulted in a value of 2,202 MMT of carbon dioxide from all U.S. power plants, while the EPA’s emissions inventory gave a value of 2,159 MMT of carbon dioxide emissions from the power sector – a difference of less than 2 percent. EIA’s 2011 Annual Energy Review lists a value of 2,166 MMT of carbon dioxide emitted by power plants in 2011.94
• We chose to estimate 2011 carbon dioxide pollu-tion based on plant-level energy consumption data because EIA’s Form 923 database (which contains such data) includes information on a broader range of power plants than the EPA’s Air Markets Program Data, which provides estimates of carbon dioxide emissions for a subset of large electric power plants.95
Methodology

Methodology 25
Table 3: Carbon Dioxide Emission Coefficients
Category Fuel Emission Coefficient (Kg CO2 / MMBtu)
Coal Bituminous 93.40
Coal Lignite 96.36
Coal Sub-Bituminous 97.02
Coal Waste Coal96 94.38
Coal Coal-Derived Synthesis Gas97 94.38
Coal Anthracite 103.54
Coal Coal-Based Synfuel98 92.91
Petroleum Products Distillate Fuel Oil99 73.15
Petroleum Products Jet Fuel 72.22
Petroleum Products Kerosene 75.20
Petroleum Products Petroleum Coke 102.41
Petroleum ProductsPetroleum Coke-Derived
Synthesis Gas100 102.41
Petroleum Products Residual Fuel Oil101 78.80
Petroleum Products Propane 61.46
Petroleum Products Waste Oil102 66.53
Natural Gas and other gases Natural Gas103 53.02
Natural Gas and other gases Blast Furnace Gas104 274.32
Natural Gas and other gases Other Fossil-Fuel Gas105 59.00
Other Purchased Steam106 88.18
Other Tire-Derived Fuels107 85.97
OtherMunicipal Solid Waste - Non-
Biogenic Fraction90.70

26 America’s Dirtiest Power Plants
AppendicesTable A-1. Power Plant Carbon Dioxide Emissions as a Share of Total State-Level Emissions (MMT), 2010108
State
Electric Power Sector
Emissions
Total Statewide
Energy-Related
Emissions
Percentage of
Statewide Emissions
from Power Plants
Estimated Share of Statewide
Emissions Contributed by Top
5 Emitting Power Plants±
Total Power Sector Emissions
Equivalent in Number
of Passenger Vehicles
(Millions)109
Alabama 76.7 132.7 58% 36% 16.0
Alaska 3.0 38.7 8% 6% 0.6
Arizona 54.4 95.9 57% 46% 11.3
Arkansas 32.3 66.1 49% 45% 6.7
California 43.5 369.8 12% 2% 99.1
Colorado 39.9 96.5 41% 28% 8.3
Connecticut 7.7 36.9 21% 16% 1.6
Delaware 4.2 11.7 36% 36% 0.9
District of Columbia 0.2 3.3 6% 6% 0.0
Florida 119.6 246.0 49% 18% 24.9
Georgia 79.1 173.7 46% 34% 16.5
Hawaii 7.6 18.9 40% 31% 1.6
Idaho 0.7 16.2 4% 4% 0.1
Illinois 94.0 230.4 41% 19% 19.6
Indiana 114.3 219.1 52% 27% 23.8
Iowa 40.6 88.7 46% 34% 8.5
Kansas 35.4 75.0 47% 41% 7.4
Kentucky 94.2 150.7 63% 34% 19.6
Louisiana 42.6 223.5 19% 12% 8.9
Maine 2.6 18.5 14% 11% 0.5
Maryland 24.9 70.5 35% 28% 5.2
Massachusetts 18.2 73.0 25% 16% 3.8
Michigan 70.4 165.9 42% 27% 14.7
Minnesota 29.3 93.4 31% 27% 6.1
Mississippi 26.4 65.5 40% 25% 5.5
Missouri 76.0 135.7 56% 35% 15.8
Montana 19.8 34.9 57% 55% 4.1
Nebraska 23.1 48.0 48% 45% 4.8

Appendices 27
State
Electric Power Sector
Emissions
Total Statewide
Energy-Related
Emissions
Percentage of
Statewide Emissions
from Power Plants
Estimated Share of Statewide
Emissions Contributed by Top
5 Emitting Power Plants±
Total Power Sector Emissions
Equivalent in Number
of Passenger Vehicles
(Millions)109
Nevada 16.8 38.1 44% 28% 3.5
New Hampshire 5.4 17.0 32% 31% 1.1
New Jersey 17.7 115.4 15% 10% 3.7
New Mexico 29.0 54.8 53% 50% 0.6
New York 38.1 172.8 22% 7% 7.9
North Carolina 72.2 142.9 51% 36% 15
North Dakota 29.5 52.5 56% 52% 6.2
Ohio 120.8 249.1 48% 24% 25.2
Oklahoma 47.4 103.4 46% 32% 9.9
Oregon 9.8 40.3 24% 22% 0.2
Pennsylvania 119.6 256.6 47% 22% 24.9
Rhode Island 3.1 11.0 28% 28% 0.6
South Carolina 40.9 84.0 49% 34% 8.5
South Dakota 3.5 15.1 23% 23% 0.7
Tennessee 43.3 107.1 40% 34% 0.9
Texas 220.4 652.6 34% 10% 45.9
Utah 34.8 64.2 54% 49% 7.2
Vermont 0.0 6.0 0% 0% 0.0
Virginia 34.3 109.8 31% 19% 7.1
Washington 13.1 76.1 17% 15% 2.7
West Virginia 74.3 98.9 75% 52% 15.5
Wisconsin 42.6 99.2 43% 29% 8.9
Wyoming 42.8 64.9 66% 59% 8.9
Total* 2,240.0 5,631.3 40% 24% 466.7
* For the emissions of the United States as a country see, U.S. Energy Information Administration, Monthly Energy Review, Section 12: Environment, August 2013. Differing methodologies between that data series and the state-by-state data list-ed here causes the total for all states to be slightly different from the national-level estimate. The amount varies no more than 0.5 percent. NOTE: The District of Columbia is included in the data tables, but not in the analysis as it is not a state.
± Estimates obtained by multiplying Emissions for Top 5 as a Share of Power-Sector Total (2011) by Emissions for Power-Sector as a Share of Statewide Total (2010). U.S. EIA does not have state-by-state data on power-sector emissions from 2011. See Table A-3.
Contined from page 26
Table A-1. Power Plant Carbon Dioxide Emissions as a Share of Total State-Level Emissions (MMT), 2010108

28 America’s Dirtiest Power Plants
Table A-2. The Nation’s 100 Most-Polluting Power Plants, Carbon Dioxide Emissions Equivalent in Passenger Vehicles and Primary Fuel Category, 2011
Rank State
Operator Name Plant NamePrimary Fuel
Category
Emissions (Million Metric
Tons)112
Emissions Equivalent in Passenger Vehicles
(Millions)113
1 GA Georgia Power Co. Scherer Coal 21.3 4.44
2 AL Alabama Power Co. James H. Miller Jr. Coal 20.7 4.3
3 TX Luminant Generation
Company, LLC
Martin Lake Coal 18.8 3.91
4 MO Union Electric Co. (MO) Labadie Coal 18.5 3.85
5 TX NRG Texas Power, LLC W. A. Parish Coal 17.8 3.71
6 IN Duke Energy Indiana Inc. Gibson Coal 16.9 3.53
7 OH Ohio Power Co. General James M.
Gavin
Coal 16.6 3.46
8 PA FirstEnergy Generation Corp. FirstEnergy Bruce
Mansfield
Coal 16.4 3.41
9 MI Detroit Edison Co. Monroe Coal 16.4 3.41
10 AZ Salt River Project Navajo Coal 15.9 3.32
11 IN Indiana Michigan Power Co. Rockport Coal 15.4 3.22
12 KS Westar Energy Inc. Jeffrey Energy
Center
Coal 14.7 3.05
13 GA Georgia Power Co. Bowen Coal 14.2 2.97
14 WV Appalachian Power Co. John E. Amos Coal 13.9 2.89
15 NM Arizona Public Service Co. Four Corners* Coal 13.8 2.88
16 NC Duke Energy Carolinas, LLC Belews Creek Coal 13.8 2.87
17 TX Luminant Generation
Company, LLC
Monticello Coal 13.7 2.85
18 MT PPL Montana, LLC Colstrip Coal 13.6 2.82
19 TX NRG Texas Power, LLC Limestone Coal 13.3 2.77
20 LA Louisiana Generating LLC Big Cajun 2 Coal 13.2 2.75
21 MN Northern States Power Co. –
Minnesota
Sherburne
County
Coal 13.1 2.73
22 SC South Carolina Public Service
Authority
Cross Coal 12.9 2.69
23 WY PacifiCorp Jim Bridger Coal 12.9 2.68
24 IL Dynegy Midwest Generation
Inc.
Baldwin Energy
Complex
Coal 12.8 2.67
25 OH Dayton Power & Light Co. J. M. Stuart Coal 12.7 2.66
26 KY Kentucky Utilities Co. Ghent Coal 12.7 2.65
27 TN Tennessee Valley Authority Cumberland Coal 12.4 2.57
28 WY Basin Electric Power Coop Laramie River
Station
Coal 12.2 2.54
29 UT Los Angeles Department of
Water & Power
Intermountain
Power Project*
Coal 12.0 2.51
30 KY Tennessee Valley Authority Paradise Coal 12.0 2.49
*Indicates that this power plant is scheduled for retirement.110

Appendices 29
Table A-2. The Nation’s 100 Most-Polluting Power Plants, Carbon Dioxide Emissions Equivalent in Passenger Vehicles and Primary Fuel Category, 2011
Rank State
Operator Name Plant NamePrimary Fuel
Category
Emissions (Million Metric
Tons)112
Emissions Equivalent in Passenger Vehicles
(Millions)113
31 IA MidAmerican Energy Co. Walter Scott Jr. Energy Center*
Coal 11.7 2.43
32 NC Progress Energy Carolinas Inc. Roxboro Coal 11.6 2.42
33 NM Public Service Co. of NM San Juan* Coal 11.5 2.4
34 AZ Tucson Electric Power Co. Springerville Coal 11.5 2.39
35 AR Entergy Arkansas Inc. Independence Coal 11.1 2.3
36 TX Southwestern Electric Power
Co.
Welsh* Coal 11.0 2.29
37 TX Lower Colorado River Authority Fayette Power
Project
Coal 10.9 2.26
38 TX Oak Grove Management Co.,
LLC
Oak Grove Coal 10.8 2.26
39 OH FirstEnergy Generation Corp. FirstEnergy W. H.
Sammis
Coal 10.6 2.2
40 PA Allegheny Energy Supply Co.,
LLC
Hatfields Ferry
Power Station*
Coal 10.5 2.18
41 WV Allegheny Energy Supply Co.,
LLC
FirstEnergy
Harrison Power
Station
Coal 10.4 2.16
42 AR Entergy Arkansas Inc. White Bluff Coal 10.4 2.16
43 AL Alabama Power Co. E. C. Gaston Coal 10.3 2.14
44 FL Progress Energy Florida Inc. Crystal River* Coal 10.2 2.13
45 NC Duke Energy Carolinas, LLC Marshall Coal 10.1 2.09
46 IN Indianapolis Power & Light Co. AES Petersburg Coal 10.0 2.09
47 PA GenOn Northeast Management
Company
Keystone Coal 10.0 2.08
48 PA GenOn Northeast Management
Company
Conemaugh Coal 9.9 2.06
49 IL Midwest Generations EME, LLC Powerton Coal 9.8 2.04
50 NE Nebraska Public Power District Gerald Gentleman Coal 9.3 1.94
51 OK Oklahoma Gas & Electric Co. Muskogee Coal 9.2 1.92
52 FL Tampa Electric Co. Big Bend Coal 9.2 1.91
53 KY Louisville Gas & Electric Co. Mill Creek Coal 9.1 1.89
54 PA Midwest Generations EME, LLC Homer City Station Coal 9.0 1.87
55 CO Tri-State G & T Assn., Inc. Craig Coal 9.0 1.87
56 KY East Kentucky Power Coop, Inc. H. L. Spurlock Coal 8.9 1.86
57 ND Great River Energy Coal Creek Coal 8.8 1.84
58 NE Omaha Public Power District Nebraska City Coal 8.7 1.82
59 PA PPL Brunner Island, LLC PPL Brunner Island Coal 8.6 1.79
60 OK Public Service Co. of Oklahoma Northeastern* Coal 8.6 1.79
Contined from page 28
*Indicates that this power plant is scheduled for retirement.110

30 America’s Dirtiest Power Plants
Table A-2. The Nation’s 100 Most-Polluting Power Plants, Carbon Dioxide Emissions Equivalent in Passenger Vehicles and Primary Fuel Category, 2011
Rank State
Operator Name Plant NamePrimary Fuel
Category
Emissions (Million Metric
Tons)112
Emissions Equivalent in Passenger Vehicles
(Millions)113
61 TX Big Brown Power Company, LLC Big Brown Coal 8.6 1.79
62 WV Appalachian Power Co. Mountaineer Coal 8.5 1.77
63 UT PacifiCorp Hunter Coal 8.4 1.76
64 MO Kansas City Power & Light Co. Iatan Coal 8.4 1.75
65 PA PPL Montour, LLC PPL Montour Coal 8.4 1.75
66 WV Ohio Power Co. Mitchell Coal 8.4 1.74
67 TX City of San Antonio – (TX) J. K. Spruce Coal 8.3 1.73
68 MO Associated Electric Coop, Inc. Thomas Hill Coal 8.3 1.73
69 KS Kansas City Power & Light Co La Cygne Coal 8.2 1.71
70 WV Virginia Electric & Power Co. Mt. Storm Coal 8.2 1.7
71 MI Consumers Energy Co. J. H. Campbell Coal 8.2 1.7
72 IN Northern Indiana Pub Serv Co. R. M. Schahfer Coal 8.1 1.7
73 IN Indiana-Kentucky Electric Corp. Clifty Creek Coal 8.1 1.69
74 MI Detroit Edison Co. Belle River Coal 7.9 1.65
75 FL Florida Power & Light Co. West County Energy Center
Natural Gas and other gases
7.9 1.64
76 FL Seminole Electric Cooperative Inc. Seminole Coal 7.9 1.64
77 MO Union Electric Co. – (MO) Rush Island Coal 7.9 1.64
78 WV Allegheny Energy Supply Co., LLC FirstEnergy Pleas-ants Power Station
Coal 7.8 1.63
79 KY Tennessee Valley Authority Shawnee Coal 7.8 1.62
80 IL Electric Energy Inc. Joppa Steam Coal 7.8 1.62
81 OH Cardinal Operating Co. Cardinal Coal 7.6 1.58
82 TX Southwestern Public Service Co. Tolk Coal 7.5 1.57
83 IL Ameren Energy Generating Co. Newton Coal 7.5 1.55
84 MN Minnesota Power Inc. Clay Boswell Coal 7.4 1.55
85 AZ Arizona Public Service Co. Cholla Coal 7.4 1.55
86 AL Alabama Power Co. Barry Natural Gas and other gases
7.3 1.53
87 TN Tennessee Valley Authority Gallatin Coal 7.3 1.51
88 WI Wisconsin Power & Light Co. Columbia Coal 7.2 1.51
89 CO Public Service Co. of Colorado Comanche Coal 7.2 1.5
90 GA Georgia Power Co. Wansley Coal 7.2 1.5
91 OK Grand River Dam Authority GRDA Coal 7.2 1.49
92 OH Duke Energy Ohio Inc. Miami Fort* Coal 7.2 1.49
93 MO Associated Electric Coop, Inc. New Madrid Coal 7.1 1.48
94 OH Ohio Power Co. Conesville* Coal 7.1 1.47
Contined from page 29
*Indicates that this power plant is scheduled for retirement.110
Appendices 31
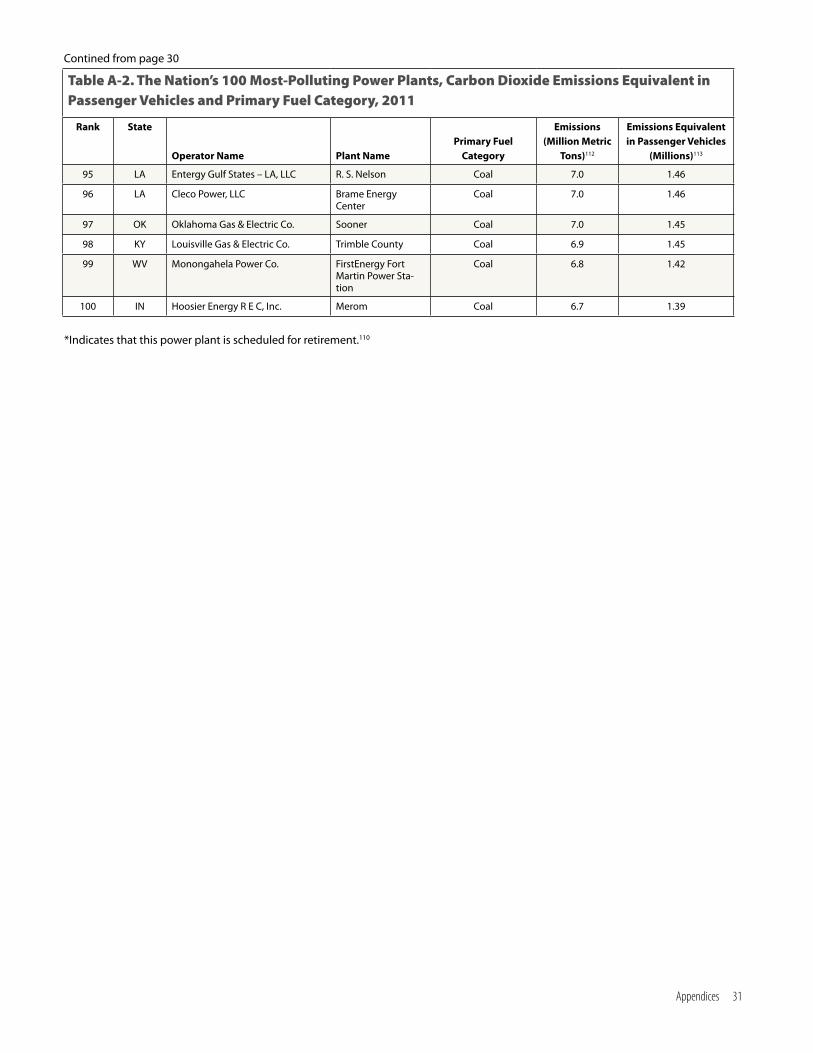
Table A-2. The Nation’s 100 Most-Polluting Power Plants, Carbon Dioxide Emissions Equivalent in Passenger Vehicles and Primary Fuel Category, 2011
Rank State
Operator Name Plant NamePrimary Fuel
Category
Emissions (Million Metric
Tons)112
Emissions Equivalent in Passenger Vehicles
(Millions)113
95 LA Entergy Gulf States – LA, LLC R. S. Nelson Coal 7.0 1.46
96 LA Cleco Power, LLC Brame Energy Center
Coal 7.0 1.46
97 OK Oklahoma Gas & Electric Co. Sooner Coal 7.0 1.45
98 KY Louisville Gas & Electric Co. Trimble County Coal 6.9 1.45
99 WV Monongahela Power Co. FirstEnergy Fort Martin Power Sta-tion
Coal 6.8 1.42
100 IN Hoosier Energy R E C, Inc. Merom Coal 6.7 1.39
Contined from page 30
*Indicates that this power plant is scheduled for retirement.110

32 America’s Dirtiest Power Plants
Tab
le A
-3. T
he
Shar
e o
f Eac
h S
tate
’s E
lect
rici
ty-S
ecto
r C
arb
on
Dio
xid
e Po
llu
tio
n C
on
trib
ute
d b
y th
e To
p 5
Mo
st-P
oll
uti
ng
Po
wer
Pla
nts
Stat
eR
ank
Pla
nt N
ame
Op
erat
or
Nam
e
Emis
sio
ns
(Mill
on
M
etri
c to
ns
of C
O2)
Tota
l Em
issi
on
s o
f To
p 5
Pla
nts
(M
MT
of C
O2)
Emis
sio
ns
for T
op
5 a
s a
Shar
e o
f Po
wer
-Sec
tor
Tota
l (20
11)
Emis
sio
ns
for
Pow
er-S
ecto
r as
a S
har
e o
f St
atew
ide
Tota
l (20
10)
Esti
mat
ed
Shar
e o
f St
atew
ide
Emis
sio
ns
Co
ntr
ibu
ted
by
Top
5±
AK
1Be
luga
Chu
gach
Ele
ctric
Ass
n. In
c.1.
27
2.8
75%
8%6%
2G
eorg
e M
Sul
livan
Gen
erat
ion
Plan
t 2
Anc
hora
ge M
unic
ipal
Lig
ht a
nd P
ower
0.61
3A
uror
a En
ergy
, LLC
Che
naA
uror
a En
ergy
, LLC
0.34
4N
orth
Pol
eG
olde
n Va
lley
Elec
. Ass
n. In
c.0.
30
5H
ealy
Gol
den
Valle
y El
ec. A
ssn.
Inc.
0.23
AL
1Ja
mes
H M
iller
Jr.
Ala
bam
a Po
wer
Co.
20.6
6
48.1
63%
58%
36%
2E.
C. G
asto
nA
laba
ma
Pow
er C
o.10
.29
3Ba
rry
Ala
bam
a Po
wer
Co.
7.33
4W
idow
s C
reek
*Te
nnes
see
Valle
y A
utho
rity
5.06
5C
olbe
rtTe
nnes
see
Valle
y A
utho
rity
4.75
AR
1In
dep
ende
nce
Ente
rgy
Ark
ansa
s In
c.11
.06
32.0
92%
49%
45%
2W
hite
Blu
ffEn
terg
y A
rkan
sas
Inc.
10.3
6
3Pl
um P
oint
Ene
rgy
Stat
ion
Plum
Poi
nt E
nerg
y A
ssoc
iate
s, L
LC4.
00
4Fl
int
Cre
ekSo
uthw
este
rn E
lect
ric P
ower
Co.
3.77
5U
nion
Pow
er P
artn
ers,
L.P
.U
nion
Pow
er P
artn
ers,
L.P
.2.
79
AZ
1N
avaj
oSa
lt Ri
ver
Proj
ect
15.9
2
43.0
81%
57%
46%
2Sp
ringe
rvill
eTu
cson
Ele
ctric
Pow
er C
o.11
.45
3C
holla
Ariz
ona
Publ
ic S
ervi
ce C
o.7.
45
4C
oron
ado
Salt
Rive
r Pr
ojec
t5.
66
5M
esq
uite
Gen
erat
ing
Stat
ion
Mes
qui
te P
ower
, LLC
2.50
CA
1M
ount
ainv
iew
Gen
erat
ing
Stat
ion
Sout
hern
Cal
iforn
ia E
diso
n C
o.1.
85
7.5
19%
12%
2%
2D
elta
Ene
rgy
Cen
ter
Del
ta E
nerg
y C
ente
r, LL
C1.
64
3H
ayne
sLo
s A
ngel
es D
epar
tmen
t of
Wat
er &
Pow
er1.
49
4C
osum
nes
Sacr
amen
to M
unic
ipal
Util
. Dis
t.1.
26
5El
k H
ills
Pow
er, L
LCEl
k H
ills
Pow
er, L
LC1.
23
*Ind
icat
es th
at th
is p
ower
pla
nt is
sch
edul
ed fo
r ret
irem
ent.11
3
± O
bta
ined
by
mul
tiply
ing
Emis
sion
s fo
r Top
5 a
s a
Shar
e of
Pow
er-S
ecto
r Tot
al (2
011)
by
Emis
sion
s fo
r Pow
er-S
ecto
r as
a Sh
are
of S
tate
wid
e To
tal (
2010
) U.S
. EIA
doe
s no
t hav
e st
ate-
by-s
tate
dat
a fo
r p
ower
-sec
tor e
mis
sion
s fo
r 201
1.

Appendices 33
Tab
le A
-3. T
he
Shar
e o
f Eac
h S
tate
’s E
lect
rici
ty-S
ecto
r C
arb
on
Dio
xid
e Po
llu
tio
n C
on
trib
ute
d b
y th
e To
p 5
Mo
st-P
oll
uti
ng
Po
wer
Pla
nts
Stat
eR
ank
Pla
nt N
ame
Op
erat
or
Nam
e
Emis
sio
ns
(Mill
on
M
etri
c to
ns
of C
O2)
Tota
l Em
issi
on
s o
f To
p 5
Pla
nts
(M
MT
of C
O2)
Emis
sio
ns
for T
op
5 a
s a
Shar
e o
f Po
wer
-Sec
tor
Tota
l (20
11)
Emis
sio
ns
for
Pow
er-S
ecto
r as
a S
har
e o
f St
atew
ide
Tota
l (20
10)
Esti
mat
ed
Shar
e o
f St
atew
ide
Emis
sio
ns
Co
ntr
ibu
ted
by
Top
5±
CO
1C
raig
Tri-S
tate
G &
T A
ssn.
, Inc
.8.
9626
.267
%41
%28
%
2C
oman
che
Publ
ic S
ervi
ce C
o. o
f Col
orad
o7.
21
3C
hero
kee*
Publ
ic S
ervi
ce C
o. o
f Col
orad
o4.
01
4Pa
wne
ePu
blic
Ser
vice
Co.
of C
olor
ado
3.05
5H
ayde
nPu
blic
Ser
vice
Co.
of C
olor
ado
2.98
CT
1La
ke R
oad
Gen
erat
ing
Plan
tLa
ke R
oad
Gen
erat
ing
Co.
, L.P
.2.
075.
975
%21
%16
%
2M
ilfor
d Po
wer
Pro
ject
Milf
ord
Pow
er C
o., L
LC1.
54
3Br
idge
por
t En
ergy
Pro
ject
Brid
gep
ort
Ener
gy, L
LC1.
08
4Kl
een
Ener
gy S
yste
ms
Proj
ect
Klee
n En
ergy
Sys
tem
s, L
LC0.
70
5Br
idge
por
t St
atio
nPS
EG P
ower
Con
nect
icut
, LLC
0.53
DC
1Be
nnin
gPo
tom
ac P
ower
Res
ourc
es0.
110.
210
0%6%
6%
2U
S G
SA H
eatin
g an
d Tr
ansm
issi
onU
S G
SA H
eatin
g an
d Tr
ansm
issi
on0.
05
3Bu
zzar
d Po
int
Poto
mac
Pow
er R
esou
rces
0.01
DE
1H
ay R
oad
Cal
pin
e M
id-A
tlant
ic G
ener
atio
n, L
LC1.
703.
999
%36
%36
%
2In
dian
Riv
er G
ener
atin
g St
atio
n*In
dian
Riv
er O
per
atio
ns In
c.1.
57
3Ed
ge M
oor*
Cal
pin
e M
id-A
tlant
ic G
ener
atio
n, L
LC0.
37
4D
elaw
are
City
Pla
ntD
elaw
are
City
Refi
ning
Com
pan
y, L
LC0.
18
5N
RG E
nerg
y C
ente
r D
over
NRG
Ene
rgy
Cen
ter
Dov
er, L
LC0.
11
FL1
Cry
stal
Riv
er*
Prog
ress
Ene
rgy
Flor
ida
Inc.
10.2
441
.737
%49
%18
%
2Bi
g Be
ndTa
mp
a El
ectr
ic C
o.9.
18
3W
est
Cou
nty
Ener
gy C
ente
rFl
orid
a Po
wer
& L
ight
Co.
7.89
4Se
min
ole
Sem
inol
e El
ectr
ic C
oop
erat
ive
Inc.
7.88
5St
. Joh
ns R
iver
Pow
er P
ark
JEA
6.55
GA
1Sc
here
rG
eorg
ia P
ower
Co.
21.3
252
.176
%46
%34
%
2Bo
wen
Geo
rgia
Pow
er C
o.14
.24
3W
ansl
eyG
eorg
ia P
ower
Co.
7.19
4H
arlle
e Br
anch
*G
eorg
ia P
ower
Co.
5.15
5Ya
tes*
Geo
rgia
Pow
er C
o.4.
16
Con
tined
from
pag
e 32
*Ind
icat
es th
at th
is p
ower
pla
nt is
sch
edul
ed fo
r ret
irem
ent.11
3
± O
bta
ined
by
mul
tiply
ing
Emis
sion
s fo
r Top
5 a
s a
Shar
e of
Pow
er-S
ecto
r Tot
al (2
011)
by
Emis
sion
s fo
r Pow
er-S
ecto
r as
a Sh
are
of S
tate
wid
e To
tal (
2010
) U.S
. EIA
doe
s no
t hav
e st
ate-
by-s
tate
dat
a fo
r p
ower
-sec
tor e
mis
sion
s fo
r 201
1.

34 America’s Dirtiest Power Plants
Tab
le A
-3. T
he
Shar
e o
f Eac
h S
tate
’s E
lect
rici
ty-S
ecto
r C
arb
on
Dio
xid
e Po
llu
tio
n C
on
trib
ute
d b
y th
e To
p 5
Mo
st-P
oll
uti
ng
Po
wer
Pla
nts
Stat
eR
ank
Pla
nt N
ame
Op
erat
or
Nam
e
Emis
sio
ns
(Mill
on
M
etri
c to
ns
of C
O2)
Tota
l Em
issi
on
s o
f To
p 5
Pla
nts
(M
MT
of C
O2)
Emis
sio
ns
for T
op
5 a
s a
Shar
e o
f Po
wer
-Sec
tor
Tota
l (20
11)
Emis
sio
ns
for
Pow
er-S
ecto
r as
a S
har
e o
f St
atew
ide
Tota
l (20
10)
Esti
mat
ed
Shar
e o
f St
atew
ide
Emis
sio
ns
Co
ntr
ibu
ted
by
Top
5±
HI
1Ka
heH
awai
ian
Elec
tric
Co.
Inc.
2.41
5.6
77%
40%
31%
2A
ES H
awai
iA
ES H
awai
i Inc
.1.
31
3W
aiau
Haw
aiia
n El
ectr
ic C
o. In
c.0.
87
4M
aala
eaM
aui E
lect
ric C
o. L
td.
0.55
5Ka
laeo
la C
ogen
Pla
ntKa
lael
oa P
artn
ers,
L.P
.0.
51
IA1
Wal
ter
Scot
t Jr.
Ene
rgy
Cen
ter*
Mid
Am
eric
an E
nerg
y C
o.11
.67
29.7
75%
46%
34%
2G
eorg
e N
eal N
orth
Mid
Am
eric
an E
nerg
y C
o.5.
76
3G
eorg
e N
eal S
outh
Mid
Am
eric
an E
nerg
y C
o.4.
32
4Lo
uisa
Mid
Am
eric
an E
nerg
y C
o.4.
30
5O
ttum
wa
Inte
rsta
te P
ower
and
Lig
ht C
o.3.
65
ID1
Rath
drum
Pow
er, L
LCRa
thdr
um O
per
atin
g Se
rvic
es C
o., I
nc.
0.31
0.4
91%
4%4%
2Ev
ande
r A
ndre
ws
Pow
er C
omp
lex
Idah
o Po
wer
Co.
0.05
3Be
nnet
t M
ount
ain
Idah
o Po
wer
Co.
0.03
4Ru
per
t C
ogen
Pro
ject
Ener
gy O
per
atio
ns G
roup
0.03
5C
lear
wat
er P
aper
IPP
Lew
isto
nC
lear
wat
er P
aper
Cor
por
atio
n0.
02
IL1
Bald
win
Ene
rgy
Com
ple
xD
yneg
y M
idw
est
Gen
erat
ion
Inc.
12.8
344
.046
%41
%19
%
2Po
wer
ton
Mid
wes
t G
ener
atio
ns E
ME,
LLC
9.80
3Jo
pp
a St
eam
Elec
tric
Ene
rgy
Inc.
7.76
4N
ewto
nA
mer
en E
nerg
y G
ener
atin
g C
o.7.
46
5Jo
liet
29M
idw
est
Gen
erat
ions
EM
E, L
LC6.
12
IN1
Gib
son
Duk
e En
ergy
Indi
ana
Inc.
16.9
558
.752
%52
%27
%
2Ro
ckp
ort
Indi
ana
Mic
higa
n Po
wer
Co.
15.4
4
3A
ES P
eter
sbur
gIn
dian
apol
is P
ower
& L
ight
Co.
10.0
5
4R.
M. S
chah
fer
Nor
ther
n In
dian
a Pu
b Se
rv C
o.8.
14
5C
lifty
Cre
ekIn
dian
a-Ke
ntuc
ky E
lect
ric C
orp
.8.
09
Con
tined
from
pag
e 33
*Ind
icat
es th
at th
is p
ower
pla
nt is
sch
edul
ed fo
r ret
irem
ent.11
3
± O
bta
ined
by
mul
tiply
ing
Emis
sion
s fo
r Top
5 a
s a
Shar
e of
Pow
er-S
ecto
r Tot
al (2
011)
by
Emis
sion
s fo
r Pow
er-S
ecto
r as
a Sh
are
of S
tate
wid
e To
tal (
2010
) U.S
. EIA
doe
s no
t hav
e st
ate-
by-s
tate
dat
a fo
r p
ower
-sec
tor e
mis
sion
s fo
r 201
1.
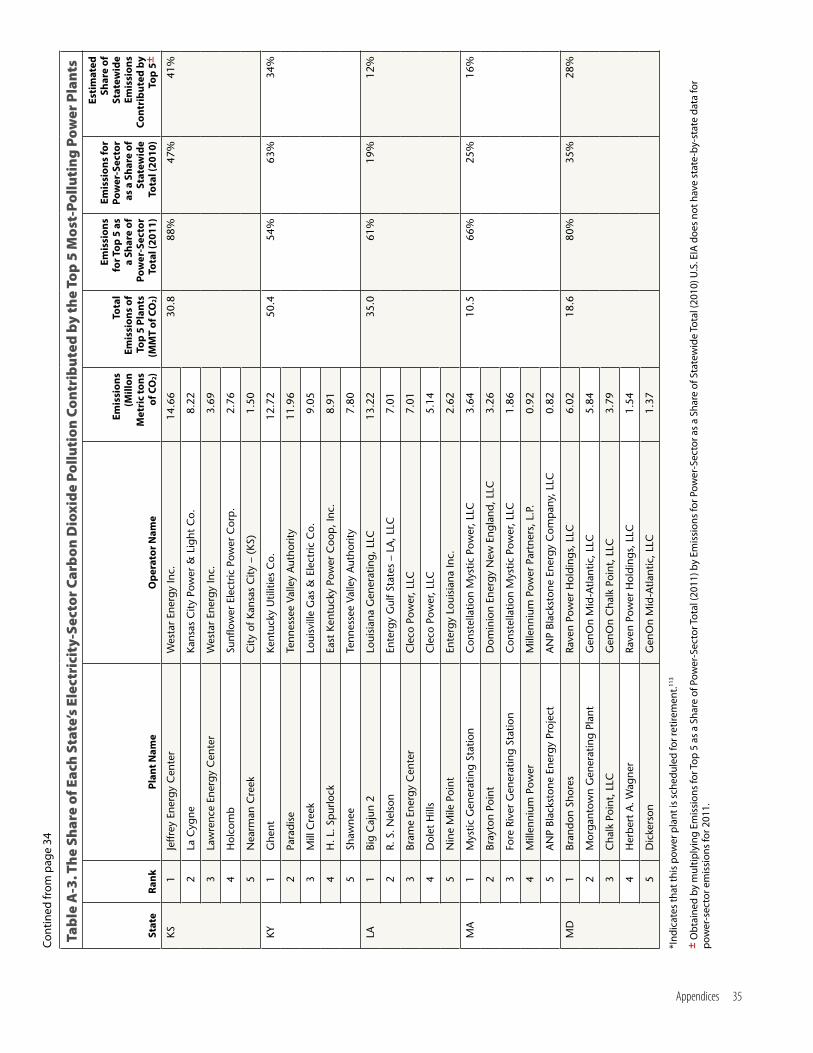
Appendices 35
Tab
le A
-3. T
he
Shar
e o
f Eac
h S
tate
’s E
lect
rici
ty-S
ecto
r C
arb
on
Dio
xid
e Po
llu
tio
n C
on
trib
ute
d b
y th
e To
p 5
Mo
st-P
oll
uti
ng
Po
wer
Pla
nts
Stat
eR
ank
Pla
nt N
ame
Op
erat
or
Nam
e
Emis
sio
ns
(Mill
on
M
etri
c to
ns
of C
O2)
Tota
l Em
issi
on
s o
f To
p 5
Pla
nts
(M
MT
of C
O2)
Emis
sio
ns
for T
op
5 a
s a
Shar
e o
f Po
wer
-Sec
tor
Tota
l (20
11)
Emis
sio
ns
for
Pow
er-S
ecto
r as
a S
har
e o
f St
atew
ide
Tota
l (20
10)
Esti
mat
ed
Shar
e o
f St
atew
ide
Emis
sio
ns
Co
ntr
ibu
ted
by
Top
5±
KS1
Jeffr
ey E
nerg
y C
ente
rW
esta
r En
ergy
Inc.
14.6
630
.888
%47
%41
%
2La
Cyg
neKa
nsas
City
Pow
er &
Lig
ht C
o.8.
22
3La
wre
nce
Ener
gy C
ente
rW
esta
r En
ergy
Inc.
3.69
4H
olco
mb
Sunfl
ower
Ele
ctric
Pow
er C
orp
.2.
76
5N
earm
an C
reek
City
of K
ansa
s C
ity –
(KS
)1.
50
KY1
Ghe
ntKe
ntuc
ky U
tiliti
es C
o.12
.72
50.4
54%
63%
34%
2Pa
radi
seTe
nnes
see
Valle
y A
utho
rity
11.9
6
3M
ill C
reek
Loui
svill
e G
as &
Ele
ctric
Co.
9.05
4H
. L. S
pur
lock
East
Ken
tuck
y Po
wer
Coo
p, I
nc.
8.91
5Sh
awne
eTe
nnes
see
Valle
y A
utho
rity
7.80
LA1
Big
Caj
un 2
Loui
sian
a G
ener
atin
g, L
LC13
.22
35.0
61%
19%
12%
2R.
S. N
elso
nEn
terg
y G
ulf S
tate
s –
LA, L
LC7.
01
3Br
ame
Ener
gy C
ente
rC
leco
Pow
er, L
LC7.
01
4D
olet
Hill
sC
leco
Pow
er, L
LC5.
14
5N
ine
Mile
Poi
ntEn
terg
y Lo
uisi
ana
Inc.
2.62
MA
1M
ystic
Gen
erat
ing
Stat
ion
Con
stel
latio
n M
ystic
Pow
er, L
LC3.
6410
.566
%25
%16
%
2Br
ayto
n Po
int
Dom
inio
n En
ergy
New
Eng
land
, LLC
3.26
3Fo
re R
iver
Gen
erat
ing
Stat
ion
Con
stel
latio
n M
ystic
Pow
er, L
LC1.
86
4M
illen
nium
Pow
erM
illen
nium
Pow
er P
artn
ers,
L.P
.0.
92
5A
NP
Blac
ksto
ne E
nerg
y Pr
ojec
tA
NP
Blac
ksto
ne E
nerg
y C
omp
any,
LLC
0.82
MD
1Br
ando
n Sh
ores
Rave
n Po
wer
Hol
ding
s, L
LC6.
0218
.680
%35
%28
%
2M
orga
ntow
n G
ener
atin
g Pl
ant
Gen
On
Mid
-Atla
ntic
, LLC
5.84
3C
halk
Poi
nt, L
LCG
enO
n C
halk
Poi
nt, L
LC3.
79
4H
erbe
rt A
. Wag
ner
Rave
n Po
wer
Hol
ding
s, L
LC1.
54
5D
icke
rson
Gen
On
Mid
-Atla
ntic
, LLC
1.37
Con
tined
from
pag
e 34
*Ind
icat
es th
at th
is p
ower
pla
nt is
sch
edul
ed fo
r ret
irem
ent.11
3
± O
bta
ined
by
mul
tiply
ing
Emis
sion
s fo
r Top
5 a
s a
Shar
e of
Pow
er-S
ecto
r Tot
al (2
011)
by
Emis
sion
s fo
r Pow
er-S
ecto
r as
a Sh
are
of S
tate
wid
e To
tal (
2010
) U.S
. EIA
doe
s no
t hav
e st
ate-
by-s
tate
dat
a fo
r p
ower
-sec
tor e
mis
sion
s fo
r 201
1.

36 America’s Dirtiest Power Plants
Tab
le A
-3. T
he
Shar
e o
f Eac
h S
tate
’s E
lect
rici
ty-S
ecto
r C
arb
on
Dio
xid
e Po
llu
tio
n C
on
trib
ute
d b
y th
e To
p 5
Mo
st-P
oll
uti
ng
Po
wer
Pla
nts
Stat
eR
ank
Pla
nt N
ame
Op
erat
or
Nam
e
Emis
sio
ns
(Mill
on
M
etri
c to
ns
of C
O2)
Tota
l Em
issi
on
s o
f To
p 5
Pla
nts
(M
MT
of C
O2)
Emis
sio
ns
for T
op
5 a
s a
Shar
e o
f Po
wer
-Sec
tor
Tota
l (20
11)
Emis
sio
ns
for
Pow
er-S
ecto
r as
a S
har
e o
f St
atew
ide
Tota
l (20
10)
Esti
mat
ed
Shar
e o
f St
atew
ide
Emis
sio
ns
Co
ntr
ibu
ted
by
Top
5±
ME
1W
estb
rook
Ene
rgy
Cen
ter
Pow
er P
lant
Wes
tbro
ok E
nerg
y C
ente
r1.
012.
882
%14
%11
%
2Ve
rso
Pap
erVe
rso
Buck
spor
t, L
LC0.
73
3M
aine
Inde
pen
denc
e St
atio
nC
asco
Bay
Ene
rgy
Co.
, LLC
0.69
4Ru
mfo
rd P
ower
Ass
ocia
tes
Rum
ford
Pow
er0.
17
5A
ndro
scog
gin
Ener
gy C
ente
rVe
rso
Pap
er A
ndro
scog
gin,
LLC
0.15
MI
1M
onro
eD
etro
it Ed
ison
Co.
16.3
942
.864
%42
%27
%
2J.
H. C
amp
bell
Con
sum
ers
Ener
gy C
o.8.
16
3Be
lle R
iver
Det
roit
Edis
on C
o.7.
91
4St
. Cla
irD
etro
it Ed
ison
Co.
6.54
5Tr
ento
n C
hann
elD
etro
it Ed
ison
Co.
3.76
MN
1Sh
erbu
rne
Cou
nty
Nor
ther
n St
ates
Pow
er C
o. –
Min
neso
ta13
.11
26.3
85%
31%
27%
2C
lay
Bosw
ell
Min
neso
ta P
ower
Inc.
7.45
3A
llen
S. K
ing
Nor
ther
n St
ates
Pow
er C
o. –
Min
neso
ta3.
18
4Bl
ack
Dog
*N
orth
ern
Stat
es P
ower
Co.
– M
inne
sota
1.39
5Ta
coni
te H
arbo
r En
ergy
Cen
ter
Min
neso
ta P
ower
Inc.
1.20
MO
1La
badi
eU
nion
Ele
ctric
Co.
– (
MO
)18
.50
50.1
62%
56%
35%
2Ia
tan
Kans
as C
ity P
ower
& L
ight
Co.
8.41
3Th
omas
Hill
Ass
ocia
ted
Elec
tric
Coo
p, I
nc.
8.29
4Ru
sh Is
land
Uni
on E
lect
ric C
o. –
(M
O)
7.85
5N
ew M
adrid
Ass
ocia
ted
Elec
tric
Coo
p, I
nc.
7.09
MS
1Vi
ctor
J. D
anie
l Jr.
Mis
siss
ipp
i Pow
er C
o.5.
2814
.161
%40
%25
%
2Re
d H
ills
Gen
erat
ing
Faci
lity
Cho
ctaw
Gen
erat
ing,
L.P
.2.
74
3Ja
ck W
atso
nM
issi
ssip
pi P
ower
Co.
2.73
4Ba
xter
Wils
onEn
terg
y M
issi
ssip
pi I
nc.
1.76
5R.
D. M
orro
wSo
uth
Mis
siss
ipp
i El P
wr.
Ass
n.1.
55
Con
tined
from
pag
e 35
*Ind
icat
es th
at th
is p
ower
pla
nt is
sch
edul
ed fo
r ret
irem
ent.11
3
± O
bta
ined
by
mul
tiply
ing
Emis
sion
s fo
r Top
5 a
s a
Shar
e of
Pow
er-S
ecto
r Tot
al (2
011)
by
Emis
sion
s fo
r Pow
er-S
ecto
r as
a Sh
are
of S
tate
wid
e To
tal (
2010
) U.S
. EIA
doe
s no
t hav
e st
ate-
by-s
tate
dat
a fo
r p
ower
-sec
tor e
mis
sion
s fo
r 201
1.

Appendices 37
Tab
le A
-3. T
he
Shar
e o
f Eac
h S
tate
’s E
lect
rici
ty-S
ecto
r C
arb
on
Dio
xid
e Po
llu
tio
n C
on
trib
ute
d b
y th
e To
p 5
Mo
st-P
oll
uti
ng
Po
wer
Pla
nts
Stat
eR
ank
Pla
nt N
ame
Op
erat
or
Nam
e
Emis
sio
ns
(Mill
on
M
etri
c to
ns
of C
O2)
Tota
l Em
issi
on
s o
f To
p 5
Pla
nts
(M
MT
of C
O2)
Emis
sio
ns
for T
op
5 a
s a
Shar
e o
f Po
wer
-Sec
tor
Tota
l (20
11)
Emis
sio
ns
for
Pow
er-S
ecto
r as
a S
har
e o
f St
atew
ide
Tota
l (20
10)
Esti
mat
ed
Shar
e o
f St
atew
ide
Emis
sio
ns
Co
ntr
ibu
ted
by
Top
5±
MT
1C
olst
ripPP
L M
onta
na, L
LC13
.55
16.1
96%
57%
55%
2J.
E. C
oret
te P
lant
PPL
Mon
tana
, LLC
0.90
3H
ardi
n G
ener
ator
Pro
ject
Rock
y M
ount
ain
Pow
er In
c.0.
77
4Ye
llow
ston
e En
ergy
, L.P
.Ye
llow
ston
e En
ergy
, L.P
.0.
50
5Le
wis
& C
lark
Mon
tana
-Dak
ota
Util
ities
Co.
0.37
NC
1Be
lew
s C
reek
Duk
e En
ergy
Car
olin
as, L
LC13
.76
43.0
71%
51%
36%
2Ro
xbor
oPr
ogre
ss E
nerg
y C
arol
inas
Inc.
11.6
0
3M
arsh
all
Duk
e En
ergy
Car
olin
as, L
LC10
.05
4G
. G. A
llen
Duk
e En
ergy
Car
olin
as, L
LC4.
00
5M
ayo
Prog
ress
Ene
rgy
Car
olin
as In
c.3.
56
ND
1C
oal C
reek
Gre
at R
iver
Ene
rgy
8.82
27.1
93%
56%
52%
2A
ntel
ope
Valle
yBa
sin
Elec
tric
Pow
er C
oop
5.79
3M
ilton
R. Y
oung
Min
nkot
a Po
wer
Coo
p, I
nc5.
56
4Le
land
Old
sBa
sin
Elec
tric
Pow
er C
oop
3.60
5C
oyot
eO
tter
Tai
l Pow
er C
o.3.
29
NE
1G
eral
d G
entle
man
Neb
rask
a Pu
blic
Pow
er D
istr
ict
9.29
24.7
93%
48%
45%
2N
ebra
ska
City
Om
aha
Publ
ic P
ower
Dis
tric
t8.
75
3N
orth
Om
aha
Om
aha
Publ
ic P
ower
Dis
tric
t3.
58
4Sh
eldo
nN
ebra
ska
Publ
ic P
ower
Dis
tric
t1.
58
5W
hela
n En
ergy
Cen
ter
City
of H
astin
g –
(NE)
1.53
NH
1M
errim
ack
Publ
ic S
ervi
ce C
o. o
f NH
2.00
4.9
97%
32%
31%
2G
rani
te R
idge
Gra
nite
Rid
ge E
nerg
y, L
LC1.
47
3EP
New
ingt
on E
nerg
y, L
LCEP
New
ingt
on E
nerg
y, L
LC1.
05
4Sc
hille
rPu
blic
Ser
vice
Co.
of N
H0.
30
5N
ewin
gton
Publ
ic S
ervi
ce C
o. o
f NH
0.11
Con
tined
from
pag
e 36
*Ind
icat
es th
at th
is p
ower
pla
nt is
sch
edul
ed fo
r ret
irem
ent.11
3
± O
bta
ined
by
mul
tiply
ing
Emis
sion
s fo
r Top
5 a
s a
Shar
e of
Pow
er-S
ecto
r Tot
al (2
011)
by
Emis
sion
s fo
r Pow
er-S
ecto
r as
a Sh
are
of S
tate
wid
e To
tal (
2010
) U.S
. EIA
doe
s no
t hav
e st
ate-
by-s
tate
dat
a fo
r p
ower
-sec
tor e
mis
sion
s fo
r 201
1.
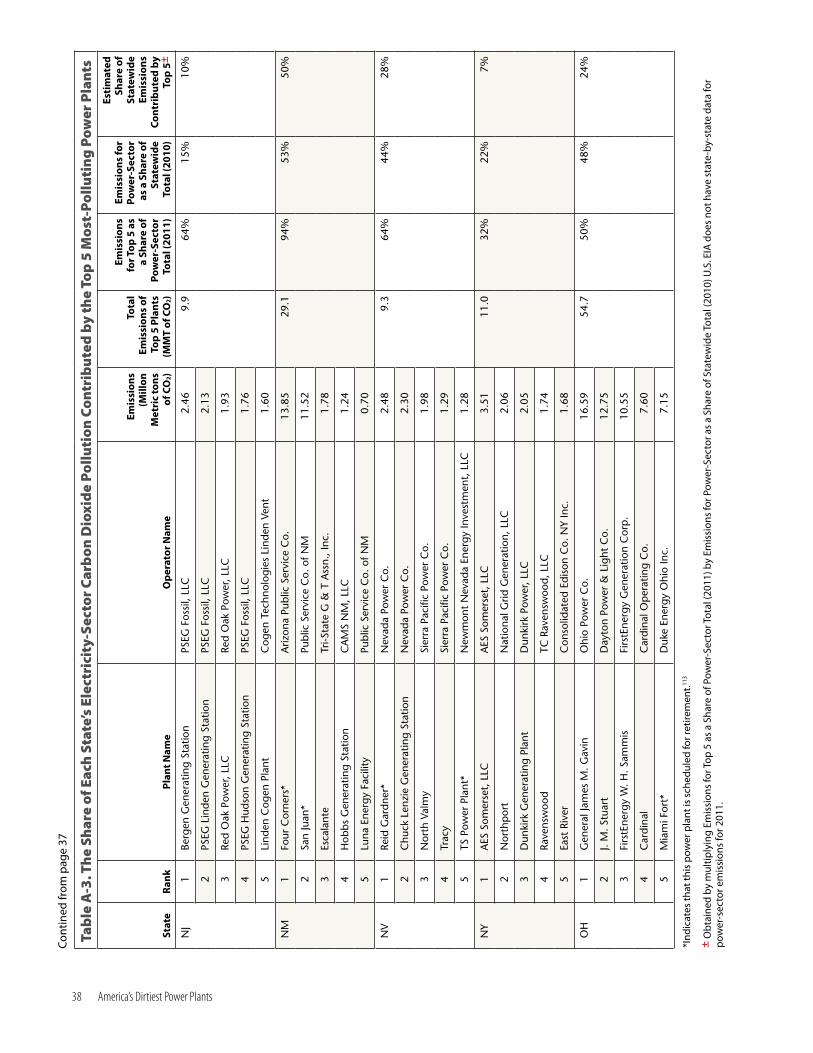
38 America’s Dirtiest Power Plants
Tab
le A
-3. T
he
Shar
e o
f Eac
h S
tate
’s E
lect
rici
ty-S
ecto
r C
arb
on
Dio
xid
e Po
llu
tio
n C
on
trib
ute
d b
y th
e To
p 5
Mo
st-P
oll
uti
ng
Po
wer
Pla
nts
Stat
eR
ank
Pla
nt N
ame
Op
erat
or
Nam
e
Emis
sio
ns
(Mill
on
M
etri
c to
ns
of C
O2)
Tota
l Em
issi
on
s o
f To
p 5
Pla
nts
(M
MT
of C
O2)
Emis
sio
ns
for T
op
5 a
s a
Shar
e o
f Po
wer
-Sec
tor
Tota
l (20
11)
Emis
sio
ns
for
Pow
er-S
ecto
r as
a S
har
e o
f St
atew
ide
Tota
l (20
10)
Esti
mat
ed
Shar
e o
f St
atew
ide
Emis
sio
ns
Co
ntr
ibu
ted
by
Top
5±
NJ
1Be
rgen
Gen
erat
ing
Stat
ion
PSEG
Fos
sil,
LLC
2.46
9.9
64%
15%
10%
2PS
EG L
inde
n G
ener
atin
g St
atio
nPS
EG F
ossi
l, LL
C2.
13
3Re
d O
ak P
ower
, LLC
Red
Oak
Pow
er, L
LC1.
93
4PS
EG H
udso
n G
ener
atin
g St
atio
nPS
EG F
ossi
l, LL
C1.
76
5Li
nden
Cog
en P
lant
Cog
en T
echn
olog
ies
Lind
en V
ent
1.60
NM
1Fo
ur C
orne
rs*
Ariz
ona
Publ
ic S
ervi
ce C
o.13
.85
29.1
94%
53%
50%
2Sa
n Ju
an*
Publ
ic S
ervi
ce C
o. o
f NM
11.5
2
3Es
cala
nte
Tri-S
tate
G &
T A
ssn.
, Inc
.1.
78
4H
obbs
Gen
erat
ing
Stat
ion
CA
MS
NM
, LLC
1.24
5Lu
na E
nerg
y Fa
cilit
yPu
blic
Ser
vice
Co.
of N
M0.
70
NV
1Re
id G
ardn
er*
Nev
ada
Pow
er C
o.2.
489.
364
%44
%28
%
2C
huck
Len
zie
Gen
erat
ing
Stat
ion
Nev
ada
Pow
er C
o.2.
30
3N
orth
Val
my
Sier
ra P
acifi
c Po
wer
Co.
1.98
4Tr
acy
Sier
ra P
acifi
c Po
wer
Co.
1.29
5TS
Pow
er P
lant
*N
ewm
ont
Nev
ada
Ener
gy In
vest
men
t, L
LC1.
28
NY
1A
ES S
omer
set,
LLC
AES
Som
erse
t, L
LC3.
5111
.032
%22
%7%
2N
orth
por
tN
atio
nal G
rid G
ener
atio
n, L
LC2.
06
3D
unki
rk G
ener
atin
g Pl
ant
Dun
kirk
Pow
er, L
LC2.
05
4Ra
vens
woo
dTC
Rav
ensw
ood,
LLC
1.74
5Ea
st R
iver
Con
solid
ated
Edi
son
Co.
NY
Inc.
1.68
OH
1G
ener
al Ja
mes
M. G
avin
Ohi
o Po
wer
Co.
16.5
954
.750
%48
%24
%
2J.
M. S
tuar
tD
ayto
n Po
wer
& L
ight
Co.
12.7
5
3Fi
rstE
nerg
y W
. H. S
amm
isFi
rstE
nerg
y G
ener
atio
n C
orp
.10
.55
4C
ardi
nal
Car
dina
l Op
erat
ing
Co.
7.60
5M
iam
i For
t*D
uke
Ener
gy O
hio
Inc.
7.15
Con
tined
from
pag
e 37
*Ind
icat
es th
at th
is p
ower
pla
nt is
sch
edul
ed fo
r ret
irem
ent.11
3
± O
bta
ined
by
mul
tiply
ing
Emis
sion
s fo
r Top
5 a
s a
Shar
e of
Pow
er-S
ecto
r Tot
al (2
011)
by
Emis
sion
s fo
r Pow
er-S
ecto
r as
a Sh
are
of S
tate
wid
e To
tal (
2010
) U.S
. EIA
doe
s no
t hav
e st
ate-
by-s
tate
dat
a fo
r p
ower
-sec
tor e
mis
sion
s fo
r 201
1.

Appendices 39
Tab
le A
-3. T
he
Shar
e o
f Eac
h S
tate
’s E
lect
rici
ty-S
ecto
r C
arb
on
Dio
xid
e Po
llu
tio
n C
on
trib
ute
d b
y th
e To
p 5
Mo
st-P
oll
uti
ng
Po
wer
Pla
nts
Stat
eR
ank
Pla
nt N
ame
Op
erat
or
Nam
e
Emis
sio
ns
(Mill
on
M
etri
c to
ns
of C
O2)
Tota
l Em
issi
on
s o
f To
p 5
Pla
nts
(M
MT
of C
O2)
Emis
sio
ns
for T
op
5 a
s a
Shar
e o
f Po
wer
-Sec
tor
Tota
l (20
11)
Emis
sio
ns
for
Pow
er-S
ecto
r as
a S
har
e o
f St
atew
ide
Tota
l (20
10)
Esti
mat
ed
Shar
e o
f St
atew
ide
Emis
sio
ns
Co
ntr
ibu
ted
by
Top
5±
OK
1M
usko
gee
Okl
ahom
a G
as &
Ele
ctric
Co.
9.20
35.0
69%
46%
32%
2N
orth
east
ern*
Publ
ic S
ervi
ce C
o. o
f Okl
ahom
a8.
60
3G
RDA
Gra
nd R
iver
Dam
Aut
horit
y7.
17
4So
oner
Okl
ahom
a G
as &
Ele
ctric
Co.
6.96
5H
ugo
Wes
tern
Far
mer
s El
ec C
oop
, Inc
.3.
06
OR
1Bo
ardm
an*
Port
land
Gen
eral
Ele
ctric
Co.
3.24
5.9
89%
24%
22%
2H
erm
isto
n G
ener
atin
g Pl
ant
Her
mis
ton
Gen
erat
ing
Co.
, L.P
.0.
92
3Kl
amat
h C
ogen
erat
ion
Plan
tPa
cific
Kla
mat
h En
ergy
Inc.
0.74
4Po
rt W
estw
ard
Port
land
Gen
eral
Ele
ctric
Co.
0.51
5H
erm
isto
n Po
wer
Par
tner
ship
Her
mis
ton
Pow
er P
artn
ersh
ip0.
45
PA1
Firs
tEne
rgy
Bruc
e M
ansfi
eld
Firs
tEne
rgy
Gen
erat
ion
Cor
p.
16.3
955
.748
%47
%22
%
2H
atfie
lds
Ferr
y Po
wer
Sta
tion*
Alle
ghen
y En
ergy
Sup
ply
Co.
, LLC
10.4
6
3Ke
ysto
neG
enO
n N
orth
east
Man
agem
ent
Com
pan
y10
.00
4C
onem
augh
Gen
On
Nor
thea
st M
anag
emen
t C
omp
any
9.88
5H
omer
City
Sta
tion
Mid
wes
t G
ener
atio
ns E
ME,
LLC
8.97
RI1
Ente
rgy
Rhod
e Is
land
Sta
te E
nerg
y, L
.P.
Ente
rgy
RISE
1.17
3.5
99%
28%
28%
2M
anch
este
r St
reet
Dom
inio
n En
ergy
New
Eng
land
, LLC
1.01
3Ti
vert
on P
ower
Pla
ntTi
vert
on P
ower
Inc.
0.61
4O
cean
Sta
te P
ower
IIO
cean
Sta
te P
ower
II0.
35
5O
cean
Sta
te P
ower
Oce
an S
tate
Pow
er C
o.0.
32
SC1
Cro
ssSo
uth
Car
olin
a Pu
blic
Ser
vice
Aut
horit
y12
.89
26.3
70%
49%
34%
2W
inya
hSo
uth
Car
olin
a Pu
blic
Ser
vice
Aut
horit
y5.
03
3W
ater
eeSo
uth
Car
olin
a El
ectr
ic &
Gas
Co.
3.
76
4W
illia
ms
Sout
h C
arol
ina
Gen
ertg
Co,
Inc.
2.46
5Ja
sper
Sout
h C
arol
ina
Elec
tric
& G
as C
o.2.
16
Con
tined
from
pag
e 38
*Ind
icat
es th
at th
is p
ower
pla
nt is
sch
edul
ed fo
r ret
irem
ent.11
3
± O
bta
ined
by
mul
tiply
ing
Emis
sion
s fo
r Top
5 a
s a
Shar
e of
Pow
er-S
ecto
r Tot
al (2
011)
by
Emis
sion
s fo
r Pow
er-S
ecto
r as
a Sh
are
of S
tate
wid
e To
tal (
2010
) U.S
. EIA
doe
s no
t hav
e st
ate-
by-s
tate
dat
a fo
r p
ower
-sec
tor e
mis
sion
s fo
r 201
1.

40 America’s Dirtiest Power Plants
Tab
le A
-3. T
he
Shar
e o
f Eac
h S
tate
’s E
lect
rici
ty-S
ecto
r C
arb
on
Dio
xid
e Po
llu
tio
n C
on
trib
ute
d b
y th
e To
p 5
Mo
st-P
oll
uti
ng
Po
wer
Pla
nts
Stat
eR
ank
Pla
nt N
ame
Op
erat
or
Nam
e
Emis
sio
ns
(Mill
on
M
etri
c to
ns
of C
O2)
Tota
l Em
issi
on
s o
f To
p 5
Pla
nts
(M
MT
of C
O2)
Emis
sio
ns
for T
op
5 a
s a
Shar
e o
f Po
wer
-Sec
tor
Tota
l (20
11)
Emis
sio
ns
for
Pow
er-S
ecto
r as
a S
har
e o
f St
atew
ide
Tota
l (20
10)
Esti
mat
ed
Shar
e o
f St
atew
ide
Emis
sio
ns
Co
ntr
ibu
ted
by
Top
5±
SD1
Big
Ston
eO
tter
Tai
l Pow
er C
o.2.
632.
910
0%23
%23
%
2Be
n Fr
ench
*Bl
ack
Hill
s Po
wer
Inc.
0.19
3G
roto
n G
ener
atin
g St
atio
nBa
sin
Elec
tric
Pow
er C
oop
0.04
4A
ngus
Ans
onN
orth
ern
Stat
es P
ower
Co.
– M
inne
sota
0.04
5La
nge
Gas
Tur
bine
sBl
ack
Hill
s Po
wer
Inc.
0.00
TN1
Cum
berla
ndTe
nnes
see
Valle
y A
utho
rity
12.3
634
.483
%40
%34
%
2G
alla
tinTe
nnes
see
Valle
y A
utho
rity
7.25
3Jo
hnso
nvill
e*Te
nnes
see
Valle
y A
utho
rity
5.49
4A
llen
Stea
m P
lant
Tenn
esse
e Va
lley
Aut
horit
y4.
73
5Ki
ngst
onTe
nnes
see
Valle
y A
utho
rity
4.59
TX1
Mar
tin L
ake
Lum
inan
t G
ener
atio
n C
omp
any,
LLC
18.7
674
.630
%34
%10
%
2W
. A. P
aris
hN
RG T
exas
Pow
er, L
LC17
.81
3M
ontic
ello
Lum
inan
t G
ener
atio
n C
omp
any,
LLC
13.6
9
4Li
mes
tone
NRG
Tex
as P
ower
, LLC
13.3
0
5W
elsh
*So
uthw
este
rn E
lect
ric P
ower
Co.
11.0
1
UT
1In
term
ount
ain
Pow
er P
roje
ct*
Los
Ang
eles
Dep
artm
ent
of W
ater
& P
ower
12.0
530
.690
%54
%49
%
2H
unte
rPa
cifiC
orp
8.43
3H
untin
gton
Paci
fiCor
p5.
54
4Bo
nanz
aD
eser
et G
ener
atio
n &
Tra
n C
oop
3.22
5C
arbo
n*Pa
cifiC
orp
1.38
VA1
Che
ster
field
Virg
inia
Ele
ctric
& P
ower
Co.
6.11
16.8
60%
31%
19%
2C
love
rVi
rgin
ia E
lect
ric &
Pow
er C
o.4.
92
3C
hesa
pea
ke*
Virg
inia
Ele
ctric
& P
ower
Co.
2.73
4Te
nask
a Vi
rgin
ia G
ener
atin
g St
atio
nTe
nask
a Vi
rgin
ia P
artn
ers,
L.P
.1.
73
5C
linch
Riv
er*
Ap
pal
achi
an P
ower
Co.
1.32
Con
tined
from
pag
e 39
*Ind
icat
es th
at th
is p
ower
pla
nt is
sch
edul
ed fo
r ret
irem
ent.11
3
± O
bta
ined
by
mul
tiply
ing
Emis
sion
s fo
r Top
5 a
s a
Shar
e of
Pow
er-S
ecto
r Tot
al (2
011)
by
Emis
sion
s fo
r Pow
er-S
ecto
r as
a Sh
are
of S
tate
wid
e To
tal (
2010
) U.S
. EIA
doe
s no
t hav
e st
ate-
by-s
tate
dat
a fo
r p
ower
-sec
tor e
mis
sion
s fo
r 201
1.

Appendices 41
Tab
le A
-3. T
he
Shar
e o
f Eac
h S
tate
’s E
lect
rici
ty-S
ecto
r C
arb
on
Dio
xid
e Po
llu
tio
n C
on
trib
ute
d b
y th
e To
p 5
Mo
st-P
oll
uti
ng
Po
wer
Pla
nts
Stat
eR
ank
Pla
nt N
ame
Op
erat
or
Nam
e
Emis
sio
ns
(Mill
on
M
etri
c to
ns
of C
O2)
Tota
l Em
issi
on
s o
f To
p 5
Pla
nts
(M
MT
of C
O2)
Emis
sio
ns
for T
op
5 a
s a
Shar
e o
f Po
wer
-Sec
tor
Tota
l (20
11)
Emis
sio
ns
for
Pow
er-S
ecto
r as
a S
har
e o
f St
atew
ide
Tota
l (20
10)
Esti
mat
ed
Shar
e o
f St
atew
ide
Emis
sio
ns
Co
ntr
ibu
ted
by
Top
5±
VT1
Mid
dleb
ury
Col
lege
Mid
dleb
ury
Col
lege
Bio
mas
s0.
010.
096
%0%
0%
2Be
rlin
5G
reen
Mou
ntai
n Po
wer
Cor
p.
0.01
3J.
C. M
cNei
lC
ity o
f Bur
lingt
on E
lect
ric (
VT)
0.00
4C
olch
este
r 16
Gre
en M
ount
ain
Pow
er C
orp
.0.
00
5Ru
tland
Cen
tral
Ver
mon
t Pu
b Se
rv. C
orp
.0.
00
WA
1Tr
ansa
lta C
entr
alia
Gen
erat
ion
Tran
sAlta
Cen
tral
ia G
en, L
LC5.
366.
788
%17
%15
%
2Ri
ver
Road
Gen
Pla
ntPU
D N
o 1
of C
lark
Cou
nty
(WA
)0.
39
3M
arch
Poi
nt C
ogen
erat
ion
Mar
ch P
oint
Cog
ener
atio
n C
o.0.
36
4M
int
Farm
Gen
erat
ing
Stat
ion
Puge
t So
und
Ener
gy In
c.0.
27
5C
heha
lis G
ener
atin
g Fa
cilit
yPa
cifiC
orp
0.27
WI
1C
olum
bia
Wis
cons
in P
ower
& L
ight
Co.
7.24
29.1
67%
43%
29%
2Pl
easa
nt P
rairi
eW
isco
nsin
Ele
ctric
Pow
er C
o.6.
65
3W
esto
nW
isco
nsin
Pub
lic S
ervi
ce C
orp
.5.
82
4So
uth
Oak
Cre
ekW
isco
nsin
Ele
ctric
Pow
er C
o.4.
96
5Ed
gew
ater
*W
isco
nsin
Pow
er &
Lig
ht C
o.4.
42
WV
1Jo
hn E
. Am
osA
pp
alac
hian
Pow
er C
o.13
.88
49.3
69%
75%
52%
2Fi
rstE
nerg
y H
arris
on P
ower
Sta
tion
Alle
ghen
y En
ergy
Sup
ply
Co.
, LLC
10.3
7
3M
ount
aine
erA
pp
alac
hian
Pow
er C
o.8.
50
4M
itche
llO
hio
Pow
er C
o.8.
37
5M
t. S
torm
Virg
inia
Ele
ctric
& P
ower
Co.
8.18
WY
1Jim
Brid
ger
Paci
fiCor
p12
.87
38.1
89%
66%
59%
2La
ram
ie R
iver
Sta
tion
Basi
n El
ectr
ic P
ower
Coo
p12
.21
3D
ave
John
ston
Paci
fiCor
p5.
50
4N
augh
ton
Paci
fiCor
p5.
34
5W
yoda
kPa
cifiC
orp
2.20
*Ind
icat
es th
at th
is p
ower
pla
nt is
sch
edul
ed fo
r ret
irem
ent.11
3
± O
bta
ined
by
mul
tiply
ing
Emis
sion
s fo
r Top
5 a
s a
Shar
e of
Pow
er-S
ecto
r Tot
al (2
011)
by
Emis
sion
s fo
r Pow
er-S
ecto
r as
a Sh
are
of S
tate
wid
e To
tal (
2010
) U.S
. EIA
doe
s no
t hav
e st
ate-
by-s
tate
dat
a fo
r p
ower
-sec
tor e
mis
sion
s fo
r 201
1.
Con
tined
from
pag
e 40
42 America’s Dirtiest Power Plants
Notes1. Intergovernmental Panel on Climate Change, “Sum-
mary for Policy Makers” in C.B. Field, et al. (eds.), Intergovernmental Panel on Climate Change, Special Report on Managing the Risks of Extreme Events and Disasters to Advance Climate Change Adaptation, 2011.
2. Tony Dutzik, Elizabeth Ridlington and Tom Van Heeke, Frontier Group, and Nathan Willcox, Environ-ment America Research & Policy Center, In the Path of the Storm: Global Warming, Extreme Weather and the Impacts of Weather-Related Disasters in the United States from 2007 to 2012, April 2013.
3. By July 2012, 64 percent of the nation was suffering through moderate to exceptional drought, accord-ing to the National Climatic Data Center, making the drought of 2012 the most widespread since at least 1956, based on the Palmer Drought Severity Index. See National Oceanic and Atmospheric Administra-tion, Summer 2012 Drought Update, downloaded from www.drought.gov/imageserver/NIDIS/homep-age/Summer_2012_Drought_Update_July_25.pdf, 21 March 2013. See also National Oceanic and Atmospheric Administration, National Climatic Data Center, State of the Climate: National Overview – July 2012, accessed at www.ncdc.noaa.gov/sotc/national/2012/7, 8 March 2013.
4. See note 2.
5. The White House, Office of the Press Secre-tary, Presidential Memorandum – Power Sector Carbon Pollution Standards, 25 June 2013; U.S. Environmental Protection Agency, Standards of Performance for Greenhouse Gas Emissions for New Stationary Sources: Electric Utility Gen-erating Units, 25 June 2013, available at www.regulations.gov/#!documentDetail;D=EPA-HQ-OAR-2011-0660-0001.
6. Leading pollutant: Intergovernmental Panel on Climate Change, Climate Change 2007: The Physical Science Basis, Contribution of Working Group I to the Fourth Assessment Report of the Intergovernmental Panel on Climate Change, 2007; National Research
Council, Advancing the Science of Climate Change, 2010. Power plants are the largest source of carbon dioxide in the U.S.: See U.S. Environmental Protection Agency, Inventory of U.S. Greenhouse Gas Emissions and Sinks: 1990-2011, 12 April 2013.
7. U.S. Environmental Protection Agency, Inventory of U.S. Greenhouse Gas Emissions and Sinks: 1990-2011, 12 April 2013.
8. U.S. Energy Information Administration reports that there are 5,962 power plants with unique plant identification numbers that report fuel consumption data monthly or annually on EIA Form 923. This figure includes some wind and solar power plants, as well as combined heat-and-power facilities. See U.S. Energy Information Administration, Form EIA-923 detailed data, final data for 2011 released 23 January 2013, available at www.eia.gov/electricity/data/eia923/.
9. U.S. Energy Information Administration, State-Level Energy-Related Carbon Dioxide Emissions, 2000-2010, released 13 May 2013.
10. U.S. sources of carbon dioxide emissions: See note 7. Worldwide carbon dioxide emissions: European Commission, Joint Research Center and PBL Nether-lands Environmental Assessment Agency, Emission Database for Global Atmospheric Research (EDGAR) (v. 4.2), 2011, available at edgar.jrc.ec.europa.eu/overview.php?v=CO2ts1990-2011&sort=des9. See methodology.
11. See note 10.
12. Emissions of U.S. power plants: See note 7; Emissions of passenger vehicles: We used the emissions from motor gasoline consumed in the transportation sec-tor – adjusted for the percentage of motor gasoline used by light-duty passenger vehicles–as a proxy for emissions from passenger vehicles in each state and in the U.S. as a whole. Calculated by multiplying the CO2
emissions from transportation-sector gasoline
consumption for each state (per U.S. Energy Informa-tion Administration, State CO2
Emissions, data for 2010, released 31 January 2013, available at www.

Notes 43
eia.gov/environment/emissions/state/state_emis-sions.cfm) by 95 percent, which is the percentage of transportation-sector motor gasoline that is consumed by light-duty passenger vehicles, per U.S. Energy Information Administration, “Transportation Sector Energy Use by Fuel Type Within a Mode, Refer-ence case” Annual Energy Outlook 2013, released 15 April 2013.
13. See note 10.
14. Ibid.
15. Ibid.
16. See note 9.
17. In the New England states of Connecticut, Maine, Massachusetts, New Hampshire, Rhode Island, and Vermont, 2011 residential electricity sales were 47,481,000 MWh (per U.S. Energy Information Administration, Electric Sales, Revenue, and Average Price–Table 2. Sales to Bundled and Unbundled Con-sumers by Sector, Census Division, and State, released 27 September 2012). In the NPCC New England EPA eGRID subregion, electricity sources emit 728.41 lbs of CO2/MWh, per U.S. Environmental Protection Agency, eGRID2012 Version 1.0, downloaded from www.epa.gov/cleanenergy/energy-resources/egrid/index.html on 28 August 2013. Residential electricity use in these states emitted 15.7 MMT of CO2 in 2011.
18. See note 12, emissions of passenger vehicles.
19. Venezuela’s energy-related emissions in 2011 were 178 million metric tons (MMT) of carbon dioxide. See note 10, European Commission.
20. See note 12, emissions of passenger vehicles.
21. See note 9.
22. See note 12, emissions of passenger vehicles.
23. Calculated using an annual eGRID CO2 emissions output rate of 1,216.18 lbs CO2/MWh for the U.S. as a whole (per U.S. Environmental Protection Agency, see note 17) and total U.S. residential electricity sales in 2011 (per U.S. Energy Information Administration, Electric Sales, Revenue, and Average Price—Table 2. Sales to Bundled and Unbundled Consumers by Sec-tor, Census Division, and State, released 27 Septem-ber 2012). Residential sales in the U.S. were 1,422 million MWh in 2011, which resulted in emissions of 785 MMT of carbon dioxide pollution.
24. See note 7.
25. See note 7 and methodology. Note: To the extent that natural gas has replaced coal as a preferred fuel for power providers since 2011, the contribution of coal plants to U.S. carbon dioxide pollution may be reduced.
26. U.S. Energy Information Administration, How Old Are U.S. Power Plants?, updated 5 March 2013, available at www.eia.gov/energy_in_brief/article/age_of_elec_gen.cfm.
27. Union of Concerned Scientists, Ripe for Retirement: The Case for Closing America’s Costliest Coal Plants, November 2012.
28. Ibid.
29. See note 7.
30. Ibid.
31. See methodology.
32. State data for carbon dioxide emissions, seen note 9; pollution from top 5 plants: see methodology.
33. We obtained these estimates by multiplying the percentage of total statewide carbon dioxide pollu-tion from each state’s power sector in 2010 by the share of each state’s power-sector emissions from the top 5 polluting plants in 2011. (State data for car-bon dioxide emissions, see U.S. Energy Information Administration, note 9; pollution from top 5 plants, see methodology.) The Energy Information Adminis-tration does not have state-by-state data for power-sector emissions from 2011.
34. See notes 1 and 2.
35. See note 2.
36. See, for example, Eric Roeckner, et al., “Historical and Future Anthropogenic Emission Pathways Derived from Coupled Climate-Carbon Cycle Simulations,” Climatic Change (online), DOI: 10.1007/s10584-010-9886-6, 21 July 2010. There is great uncertainty about the level of emission reductions required to pre-vent dangerous climate change, based both on the uncertain future pathway of emissions in developing countries as well as uncertainties regarding the sen-sitivity of the climate to global warming emissions. For example, a study published by Great Britain’s Royal Society estimates that developed countries may

44 America’s Dirtiest Power Plants
need to make more dramatic emission reductions to prevent a 2°C rise in global average temperatures, if it is even possible at all. See: Kevin Anderson and Alice Bows, “Beyond ‘Dangerous’ Climate Change: Emission Scenarios for a New World,” Philosophical Transac-tions of the Royal Society A, 369: 20-44, doi:10.1098/rsta.2010.0290, 2011.
37. See note 7.
38. Intergovernmental Panel on Climate Change, Cli-mate Change 2007: Synthesis Report: Contribution of Working Groups I, II and III to the Fourth Assessment Report of the Intergovernmental Panel on Climate Change, 2007.
39. Justin Gillis, “Climate Panel Cites Near Certainty on Warming,” The New York Times, 19 August 2013.
40. National Oceanic and Atmospheric Administration, NOAA: 2010 Tied for Warmest Year on Record, 12 January 2011.
41. World Meteorological Organization, 2010 in Top Three Warmest Years, 2001-2010 Warmest 10-Year Period (press release), 2 December 2010.
42. See note 40.
43. See note 6, Intergovernmental Panel on Climate Change.
44. Ibid.
45. See note 6, Intergovernmental Panel on Climate Change. Researchers at Florida State University calculate that for every 1° C increase in sea-surface temperatures, the frequency of severe hurricanes (category 4 and 5) increases by nearly one-third. James Elsner et al., “The Increasing Intensity of the Strongest Tropical Cyclones,” Nature 455, 92-95, 4 September 2008.
46. See note 6, Intergovernmental Panel on Climate Change.
47. A.P. Sokolov et al., Massachusetts Institute of Tech-nology, Joint Program on the Science and Policy of Global Change, “Probabilistic Forecast for 21st Century Climate Based on Uncertainties in Emis-sions (without Policy) and Climate Parameters,” Journal of Climate 22: (19): 5175-5204, in press (doi: 10.1175/2009JCLI2863.1), 2009; Vicky Pope, United Kingdom Met Office, Head of Climate Change Advice, “Met Office Warn of ‘Catastrophic’ Rise in Tempera-
ture,” The Times Online (London), 19 December 2008; Tony Dutzik et al., see note 2.
48. Susan Solomon et al., U.S. National Oceanic and Atmospheric Administration, “Irreversible Climate Change due to Carbon Emissions,” Proceedings of the National Academy of Sciences 106: 1704-1709, 10 February 2009.
49. The World Bank, Turn Down the Heat: Why a 4°C Warmer World Must be Avoided, A Report for the World Bank by the Potsdam Institute for Climate Im-pact Research and Climate Analytics, November 2012.
50. Ibid.
51. Ibid.
52. Ibid.
53. Ibid.
54. Ibid.
55. U.S. Environmental Protection Agency, Ozone and Your Health, September 1999.
56. Elizabeth Martin Perera and Todd Sanford, Union of Concerned Scientists, Climate Change and Your Health: Rising Temperatures, Worsening Ozone Pollu-tion, June 2011.
57. Natural Resources Defense Council, Climate and Your Health: Addressing the Most Serious Health Effects of Climate Change, downloaded from www.nrdc.org/health/files/climatehealthfacts.pdf on 26 August 2013.
58. Thomas R. Karl, Jerry M. Melillo and Thomas C. Pe-terson (eds.), U.S. Global Change Research Program, Global Climate Change Impacts in the United States, 2009.
59. Peter Altman et al., Natural Resources Defense Coun-cil, Killer Summer Heat: Projected Death Toll from Ris-ing Temperatures in America Due to Climate Change, May 2012.
60. Ibid.
61. See note 58.
62. Natural Resources Defense Council, Rising Tide of Ill-ness: How Global Warming Could Increase the Threat of Waterborne Diseases, July 2010.
63. See note 57.

Notes 45
64. Ibid.
65. Travis Madsen, Frontier Group, and Lauren Randall, Environment America Research & Policy Center, America’s Biggest Mercury Polluters: How Clean-ing Up the Dirtiest Power Plants Will Protect Public Health, November 2011.
66. Philippe Grandjean and Philip Landrigan, “Develop-mental Neurotoxicity of Industrial Chemicals,” The Lancet 368:2167-2178, 16 December 2006.
67. U.S. Environmental Protection Agency, Particulate Matter: Health, downloaded from www.epa.gov/pm/health.html on 26 August 2013.
68. U.S. Environmental Protection Agency, Sulfur Dioxide: Health, downloaded from www.epa.gov/air/sulfur-dioxide/health.html, 7 November 2012.
69. U.S. Environmental Protection Agency, Acid Rain, downloaded from www.epa.gov/acidrain/index.html, 7 November 2012.
70. Nathaniel Gronenwold, “IPCC Chief Raps G-8, Calls for Global Greenhouse Gas Emissions Cuts After 2015,” New York Times, 21 July 2009.
71. See note 36.
72. Sujata Gupta, Dennis A. Tirpak, et al., “Policies, Instru-ments and Co-operative Arrangements” in Climate Change 2007: Mitigation, Contribution of Working Group III to the Fourth Assessment Report of the Intergovernmental Panel on Climate Change, 2007.
73. See note 7.
74. U.S. emissions of carbon dioxide equivalent in 1990 and 2011, see note 7.
75. Tony Dutzik et al., Frontier Group, and Rob Sargent, Environment America Research & Policy Center, The Way Forward on Global Warming: Reducing Carbon Pollution Today and Restoring Momentum for Tomor-row by Promoting Clean Energy—Volume 1: Envision-ing a Clean Energy Path to Address Global Warming, Spring 2011.
76. The White House, President Obama’s Climate Action Plan (fact sheet), 25 June 2013, accessed at www.whitehouse.gov/the-press-office/2013/06/25/fact-sheet-president-obama-s-climate-action-plan, 24 July 2013.
77. Ibid.
78. The White House, Office of the Press Secretary, Presi-dential Memorandum – Power Sector Carbon Pollu-tion Standards, 25 June 2013.
79. U.S. Environmental Protection Agency, Standards of Performance for Greenhouse Gas Emissions for New Stationary Sources: Electric Utility Gen-erating Units, 25 June 2013, available at www.regulations.gov/#!documentDetail;D=EPA-HQ-OAR-2011-0660-0001.
80. Ibid.
81. Average excludes combined heat-and-power plants and plants with capacity less than 25 MW. See U.S. Environmental Protection Agency, notes 7 and 17, and methodology. See note 78.
82. See note 78.
83. International Center for Technology Assessment,
Statement of Joseph Mendelson, Legal Director,
Concerning Legal Petition on Global Warming, 20
November 1999, downloaded from 209.200.74.155/
press/release.cfm?news_id=13 on 24 July 2013.
84. Ibid.
85. US Department of Justice, Massachusetts v. Envi-ronmental Protection Agency, 549 U.S. 497 (2007), downloaded from www.justice.gov/enrd/3589.htm on 24 July 2013.
86. Ibid.
87. Ibid.
88. National Association of Clean Air Agencies, Back-ground and History of EPA Regulation of Greenhouse Gas (GHG) Emissions Under the Clean Air Act and National Association of Clean Air Agencies’ Comments on EPA GHG Regulatory and Policy Proposals, 19 July 2011.
89. World Resources Institute, What are Federal Agencies Doing to Reduce Emissions?, accessed at www.wri.org/tools/epapie/epapie-frame.html, 24 July 2013. Nicholas Bianco and Franz Litz, World Resources Institute, Reducing Greenhouse Gas Emissions in the United States Using Existing Federal Authorities and State Action, July 2010.
90. Ibid.

46 America’s Dirtiest Power Plants
91. Environmental Protection Agency, Proposed Carbon Pollution Standard for New Power Plants (fact sheet), downloaded from www.epa.gov/airquality/cps/pdfs/20120327factsheet.pdf on 1 August 2013.
92. See note 78.
93. U.S. Energy Information Administration, see note 8.
94. U.S. Energy Information Administration, Annual En-ergy Review 2011, released 27 September 2013.
95. U.S. Energy Information Administration, see note 8;
Environmental Protection Agency, Air Markets Pro-
gram Data query tool, downloaded from ampd.epa.
gov/ampd/ on 26 August 2013.
96. This fuel category includes anthracite culm, bitumi-
nous gob, fine coal, lignite waste and waste coal. We
used the value for Coal, Mixed Electrical Power Sector
from U.S. Environmental Protection Agency, Center
for Climate Leadership, Emission Factors for Green-
house Gas Inventories, November 2011.
97. Ibid.
98. Natural Resources Defense Council, Benchmarking Air
Emissions of the 100 Largest Electric Power Produc-
ers in the United States, May 2013, available at www.
nrdc.org/air/pollution/benchmarking/files/bench-
marking-2013.pdf
99. Includes diesel as well as No. 1, No. 2, and No. 4 fuel
oils.
100. We used the value for petroleum coke.
101. We used the value for residual fuel oils number 5 and
number 6.
102. We used the value for waste oil blended with residual
fuel oil, per U.S. Environmental Protection Agency,
Waste Oil Combustion, downloaded from www.
epa.gov/ttn/chief/ap42/ch01/final/c01s11.pdf on 8
August 2013.
103. We used a value representing the weighted national
average for natural gas consumption for electricity
generation.
104. We used a value representing the weighted national
average for blast furnace gas consumption for elec-
tricity generation.
105. We used the value for fuel gas, per U.S. Environmen-
tal Protection Agency, see note 96.
106. We used the value for purchased steam and hot
water, per U.S. Environmental Protection Agency, see
note 96.
107. We used the value for tires, per U.S. Environmental
Protection Agency, Center for Climate Leadership, see
note 96.
108. See note 9.
109. Emissions equivalent in number of passenger ve-
hicles calculated using the Environmental Protection
Agency’s Greenhouse Gas Equivalencies Calcula-
tor, updated April 2013, available at www.epa.gov/
cleanenergy/energy-resources/calculator.html.
110. Coal plant retirement list (spreadsheet) obtained
from Jeff Deyette, Senior Energy Analyst at Union of
Concerned Scientists, personal communication, 19
August 2013.
111. Differences between emissions data in Tables A-2 and
A-3 are due to rounding.
112. See note 109.
113. See note 110.


