Page 1
Amino acid digestibility and energy concentration in soybean
and rapeseed products fed to pigs
D. M. D. L. Navarro*, Y. Liu, T. Bruun, and H. H. SteinUniversity of Illinois, Urbana IL
Abstract 19168
Page 2
Outline• Background• Digestibility experiments– Materials and Methods– Results– Conclusions
• Overall conclusions
Page 4
Soybean Meal• Premier protein source
• Excellent AA profile – high in Lys and Trp
• Antinutritional factors→ Transient hypersensitivity response
Page 5
Enzyme-treated Soybean Meal• Fermentation process
• Reduction of antigenic proteins– β-conglycinin
• Increased CP and AA
Goebel and Stein, 2011
Page 7
00-Rapeseed• Low erucic and low glucosinolate varieties
• Desirable AA profile– Met and Cys
• Antinutritional factors– High fiber concentration
Page 8
Test Ingredients1. Enzyme-treated SBM (ESBM-1)2. ESBM-23. Enzyme-fortified extruded SBM (SBM-EX)4. Soy protein concentrate (SPC)5. Conventional SBM (SBM-CV)6. Conventional 00-rapeseed expellers (RSE)7. Fermented co-product mixture (FCM)
Page 9
Nutrient Composition, as-fedESBM-1 ESBM-2 SBM-EX SPC SBM-CV RSE FCM
DM, % 92.0 91.2 92.9 91.7 88.7 88.6 87.1
CP, % 56.8 52.1 53.3 62.1 47.8 30.1 32.0
AEE, % 1.8 0.7 1.8 1.0 1.2 10.2 4.3
NDF, % 9.2 9.5 12.7 19.7 7.8 24.5 22.9
GE, kcal/kg 4,555 4,380 4,454 4,499 4,140 4,533 4,154
Page 10
Exp. 1Amino Acid Digestibility
Page 11
Objective
• To determine the standardized ilealdigestibility of AA in soybean products and 00-rapeseed co-products fed to weanling pigs.
Page 12
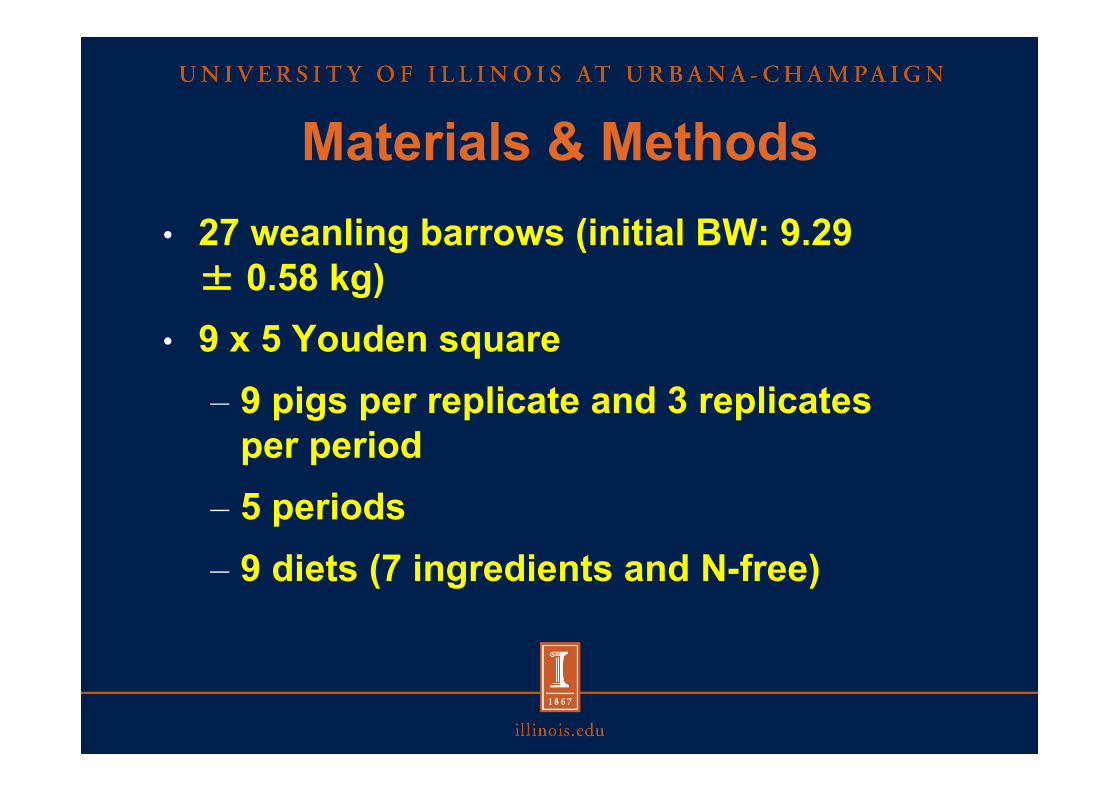
Materials & Methods• 27 weanling barrows (initial BW: 9.29 ± 0.58 kg)
• 9 x 5 Youden square– 9 pigs per replicate and 3 replicates
per period– 5 periods– 9 diets (7 ingredients and N-free)
Page 13
Diet CompositionESBM-1 ESBM-2 SBM-EX SPC SBM-CV RSE FCM N-free
ESBM-1 35.0 - - - - - - -ESBM-2 - 35.0 - - - - - -SBM-EX - - 35.0 - - - - -SPC - - - 30.0 - - - -SBM-CV - - - - 40.0 - - -RSE - - - - - 40.0 - -FCM - - - - - - 40.0 -Soybean oil 3.0 3.0 3.0 3.0 3.0 3.0 3.0 4.0Cornstarch 38.6 38.6 38.6 43.6 33.6 33.9 33.9 67.5Sucrose 20.0 20.0 20.0 20.0 20.0 20.0 20.0 20.0Others 3.4 3.4 3.4 3.4 3.4 3.1 3.1 8.5
Page 14
Materials & Methods• SID of AA was calculated• Statistical analysis– Proc Mixed of SAS– Fixed effect
• Diet
– Random effect• Pig and period
Page 16
SID of Lys, %
ab bc ab ab a c d
P < 0.01
Page 17
SID of Met, %
a abc abc bc ab c d
P < 0.01
Page 18
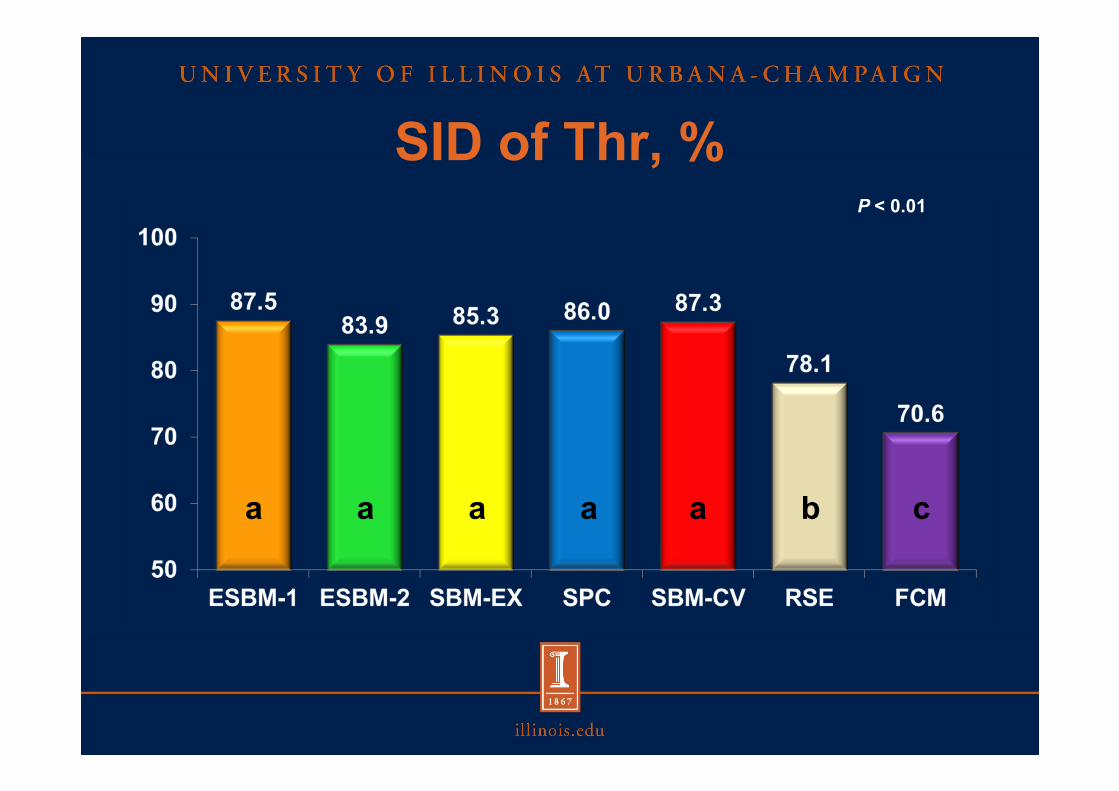
SID of Thr, %
a a a a a b c
P < 0.01
Page 19
SID of Trp, %
a ab ab ab ab b c
P < 0.01
Page 20
Conclusions• Processing of SBM results in increased CP
concentration and does not change AA digestibility.
• The SID of AA was different among processed soybean products.
• Fermentation of a co-product mixture results in decreased SID values compared with unfermented 00-rapeseed expellers and soybean products.
Page 21
Exp. 2Energy Concentration
Page 22
Objective• To determine the concentrations of
DE and ME in soybean products and 00-rapeseed co-products fed to growing pigs.
Page 23
Materials & Methods• 64 barrows (initial BW: 19.81 ± 0.90 kg)• RCBD– 8 treatments with 8 replicates per
treatment• Difference procedure
Page 24
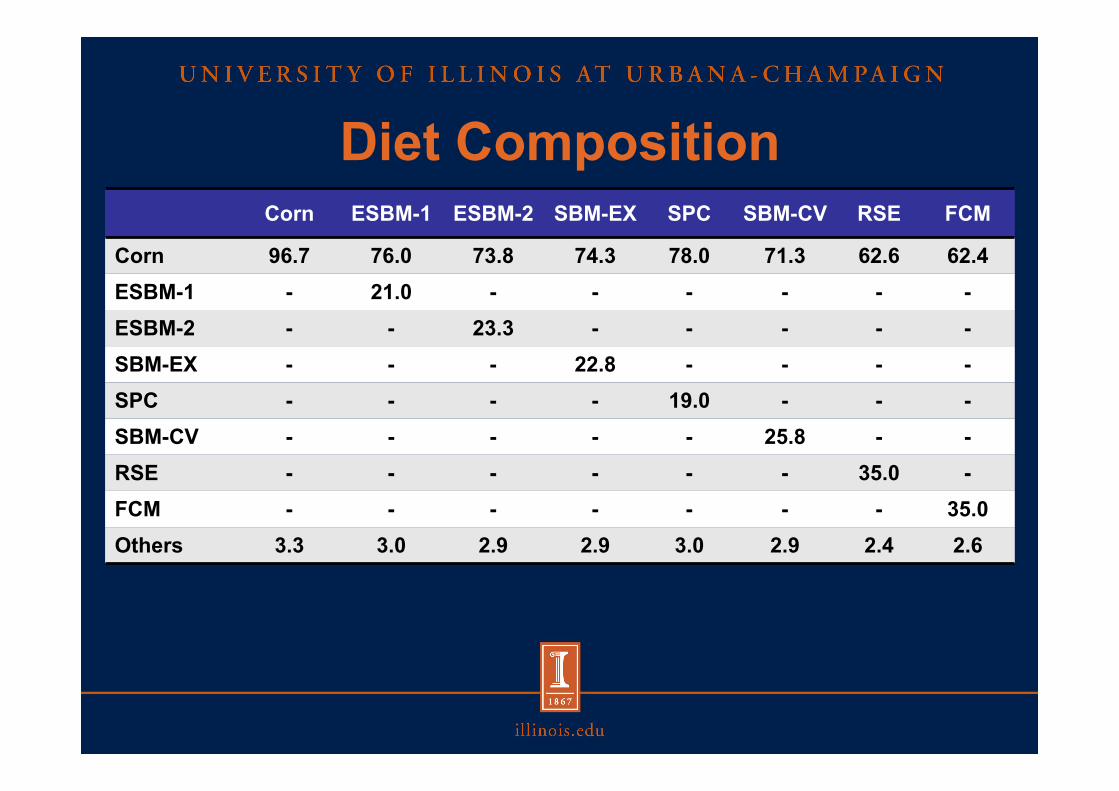
Diet CompositionCorn ESBM-1 ESBM-2 SBM-EX SPC SBM-CV RSE FCM
Corn 96.7 76.0 73.8 74.3 78.0 71.3 62.6 62.4ESBM-1 - 21.0 - - - - - -ESBM-2 - - 23.3 - - - - -SBM-EX - - - 22.8 - - - -SPC - - - - 19.0 - - -SBM-CV - - - - - 25.8 - -RSE - - - - - - 35.0 -FCM - - - - - - - 35.0Others 3.3 3.0 2.9 2.9 3.0 2.9 2.4 2.6
Page 26
ATTD of GE, %
88.2 86.9 85.1 87.2 87.292.4
72.6 71.7
0
20
40
60
80
100
Corn ESBM-1 ESBM-2 SBM-EX SPC SBM-CV RSE FCM
ab b b b b a c c
P < 0.01
Page 27
DE of ingredients, kcal/kg DM
3,8644,349 4,121
4,432 4,460 4,3033,793 3,610
0
1,000
2,000
3,000
4,000
5,000
Corn ESBM-1 ESBM-2 SBM-EX SPC SBM-CV RSE FCM
c a b a a ab cd d
P < 0.01
Page 28
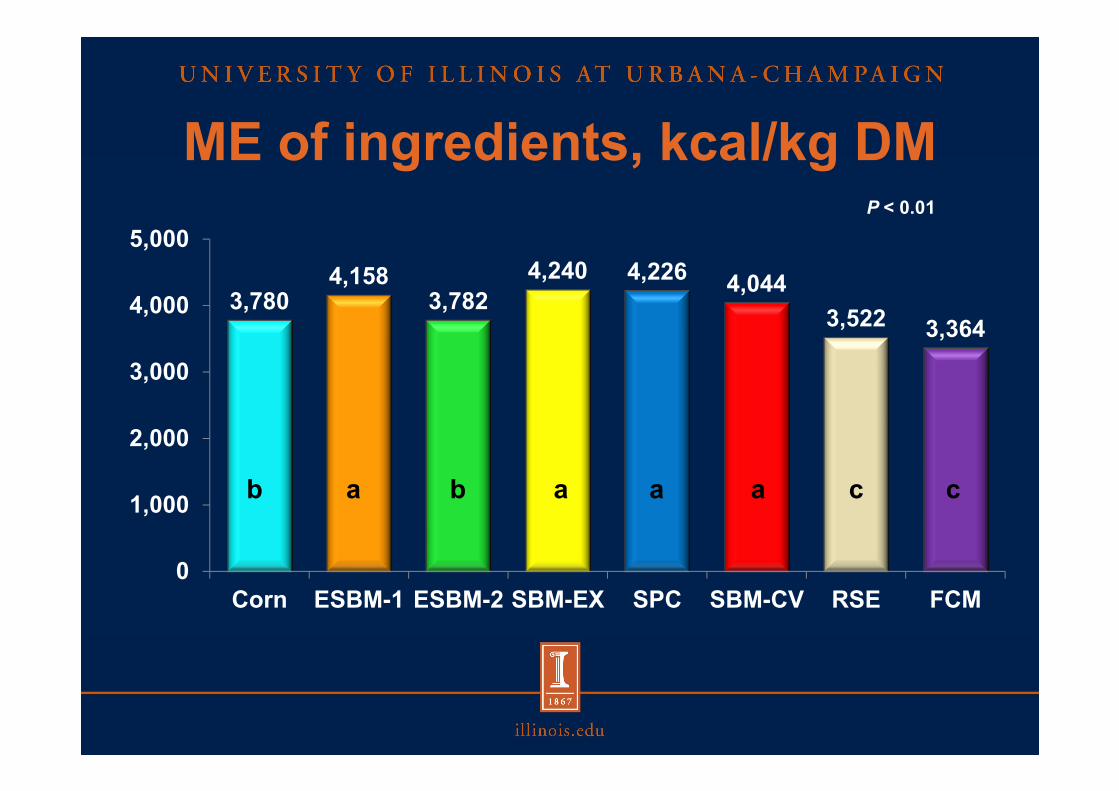
ME of ingredients, kcal/kg DM
3,7804,158
3,7824,240 4,226 4,044
3,522 3,364
0
1,000
2,000
3,000
4,000
5,000
Corn ESBM-1 ESBM-2 SBM-EX SPC SBM-CV RSE FCM
b a b a a a c c
P < 0.01
Page 29
Conclusions• DE and ME were different among
processed soybean products.
• DE and ME in the soybean products weregreater than in 00-rapeseed expellers and the fermented co-product mixture.
Page 30
Overall Conclusions• The process used to produce ESBM-2
was less efficient compared with ESBM-1.
• Fermentation of a co-product mixture results in decreased SID of AA, DE, and ME.
Page 32
http://nutrition.ansci.illinois.edu