21
AMYRIS, INC. First Quarter 2021 Earnings Conference Call May 6, 2021 – 6:00 am PT

AMYRIS, INC.
First Quarter 2021
Earnings Conference Call
May 6, 2021 – 6:00 am PT
© 2021 Amyris, Inc. All Rights Reserved.
Forward-Looking Statements
Totals in this presentation may not foot due to rounding.
| Page 2
This presentation and oral statements accompanying this presentation contain forward-looking statements, and any statements other than statements of
historical fact could be deemed to be forward-looking statements. These forward-looking statements include, among other things, statements regarding 2021
financial guidance and outlook, goals and strategic priorities; and Amyris’s expectations regarding its development pipeline, planned product launches new
markets and industries; and other future milestones such as the completion of its new Brazil plant, pending and future strategic transactions, planned
investments, expansion into other markets and industries, and the timing thereof. These statements are based on management’s current expectations and
actual results and future events may differ materially due to risks and uncertainties, including risks related to Amyris’s liquidity and ability to fund operating and
capital expenses, risks related to potential delays or failures in development, regulatory approval, production, launch and commercialization of products and
brands, risks related to Amyris's reliance on third parties, and other risks detailed from time to time in filings Amyris makes with the Securities and Exchange
Commission, including Annual Reports on Form 10-K, Quarterly Reports on Form 10-Q and Current Reports on Form 8-K. Amyris disclaims any obligation to
update information contained in these forward-looking statements, whether as a result of new information, future events, or otherwise.
NON-GAAP FINANCIAL INFORMATION
To supplement Amyris’s financial results and guidance presented in accordance with U.S. generally accepted accounting principles (GAAP), Amyris uses non-
GAAP financial measures that Amyris believes are helpful in understanding our financial results. These non-GAAP financial measures are among the factors
management uses in planning and forecasting future periods. These non-GAAP financial measures also facilitate management’s internal comparisons to
Amyris’s historical performance as well as comparisons to the operating results of other companies. Management believes these non-GAAP financial
measures, when considered together with financial information prepared in accordance with GAAP, can enhance investors’ and analysts’ abilities to
meaningfully compare our results from period to period, identify operating trends in our business, and track and model our financial performance. In addition,
management believes that these non-GAAP financial measures allow for greater transparency into the indicators used by management to understand and
evaluate Amyris’s business and make operating decisions. Non-GAAP financial information is not prepared under a comprehensive set of accounting rules, and
therefore, should only be read in conjunction with financial information reported under GAAP in order to understand Amyris’s operating performance. A
reconciliation of the non-GAAP financial measures in this presentation to the most directly comparable GAAP financial measure, is provided in the tables
attached to this presentation.
Q1 2021 Earnings Conference Call | May 6, 2021

| Page 3© 2021 Amyris, Inc. All Rights Reserved.
Agenda
Executive Overview1
2
3
4
Financial Review
Q&A
Operational Review
John MeloPresident and Chief Executive Officer
Han KieftenbeldChief Financial Officer
Eduardo AlvarezChief Operating Officer
Q1 2021 Earnings Conference Call | May 6, 2021

Record Growth and Strong Liquidity
Enhanced capital structure, solidified liquidity and financial flexibility
to accelerate growth
• Continued strong revenue growth from product portfolio
• Well-positioned development pipeline to deliver new ingredients
at scale
• Completed three strategic transactions evidencing value of our
technology. Expect $270m in future earnouts and milestone
payments
• Reduced debt from $297m at start of 2020 to $115m at end of
Q1 2021 of which $60m is convertible to equity (i.e. net $55m)
• Current cash balance $235m
© 2021 Amyris, Inc. All Rights Reserved. | Page 4
297
171115
12/31/19 12/31/20 03/31/21
Debt $m
030
235
12/31/19 12/31/2020 Current
Cash $m
Q1 2021 Earnings Conference Call | May 6, 2021
Revenue $m

Synthetic Biology is Capable of Remaking Most of the World’s ChemistryGlobal chemicals market was $4 trillion in 20191
| Page 5| Page 5© 2021 Amyris, Inc. All Rights Reserved.
Intermediary chemicals serve as building blocks
for most consumer products
Traditionally, molecules are either plant or animal-derived or
petrochemical-based
Consumers want companies to replace
their hydrocarbon-based products with ones that are more
environmentally friendly and sustainable
Synthetic Biology is capable of remaking most of the world’s
chemistry
It is better for the planet, better for people
and also becoming better for profits
At Amyris, we successfully develop,
scale and commercialize
We are a platform company that leads the sector with science that designs solutions with
the end in mind
We work with partners to identify the market opportunity, drive
adoption, and determine what attributes make a
real difference in formulation
1 Source: Statista (2021). 2019 revenue was $3.94 trillion.
Report: Total revenue of the global chemical industry from
2005 to 2019.
Q1 2021 Earnings Conference Call | May 6, 2021
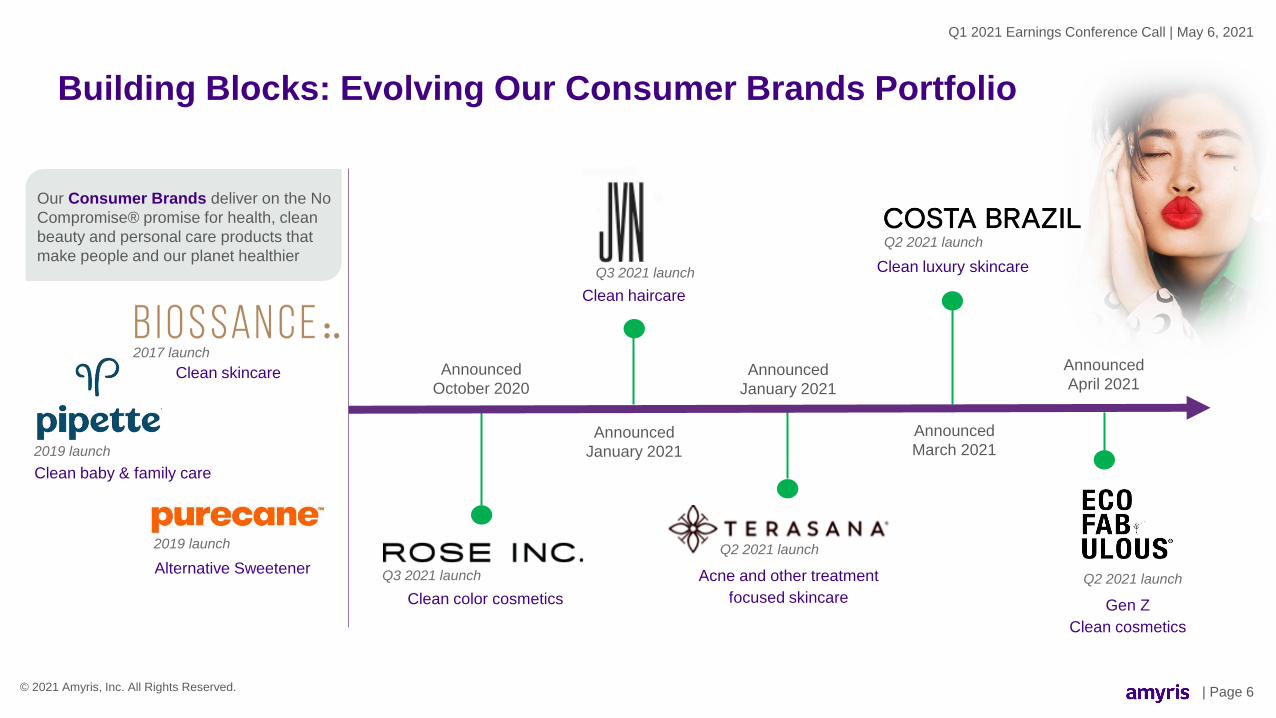
Building Blocks: Evolving Our Consumer Brands Portfolio
© 2021 Amyris, Inc. All Rights Reserved. | Page 6
Clean color cosmetics
2017 launch
2019 launch
Q3 2021 launch
Q3 2021 launch
Q2 2021 launch
Q2 2021 launch
Announced
January 2021
Announced
March 2021
Announced
January 2021
Announced
October 2020
Acne and other treatment
focused skincare
Our Consumer Brands deliver on the No
Compromise® promise for health, clean
beauty and personal care products that
make people and our planet healthierClean luxury skincare
Clean haircare
Clean skincare
Clean baby & family care
2019 launch
Alternative SweetenerQ2 2021 launch
Gen Z
Clean cosmetics
Announced
April 2021
Q1 2021 Earnings Conference Call | May 6, 2021
© 2021 Amyris, Inc. All Rights Reserved.
| Page 7
Q1 2021 Earnings Conference Call | May 6, 2021

Building Blocks: Evolving Our Ingredients Portfolio
© 2021 Amyris, Inc. All Rights Reserved. | Page 8
1st Strategic Transaction
Givaudan Farnesene
Up to $50m transaction value
($40m upfront cash
2nd Strategic TransactionFlavor & Fragrance
Up to $500m transaction value($150m upfront cash)
Completed
Q1 2021
Completed
Q4 2020
New Ingredients Plant
Barra Bonita, Brazil
2022
Expected
production
Completed
Q2 2021
Our Ingredients Pipeline delivers
unique natural, sustainably sourced,
platform molecules that disrupt markets
and enable the ESG agenda of industry
leaders
3rd Strategic Transaction
Reb M Sweetener
Up to $100m transaction value
($24m upfront cash)
Q1 2021 Earnings Conference Call | May 6, 2021
© 2021 Amyris, Inc. All Rights Reserved. | Page 9
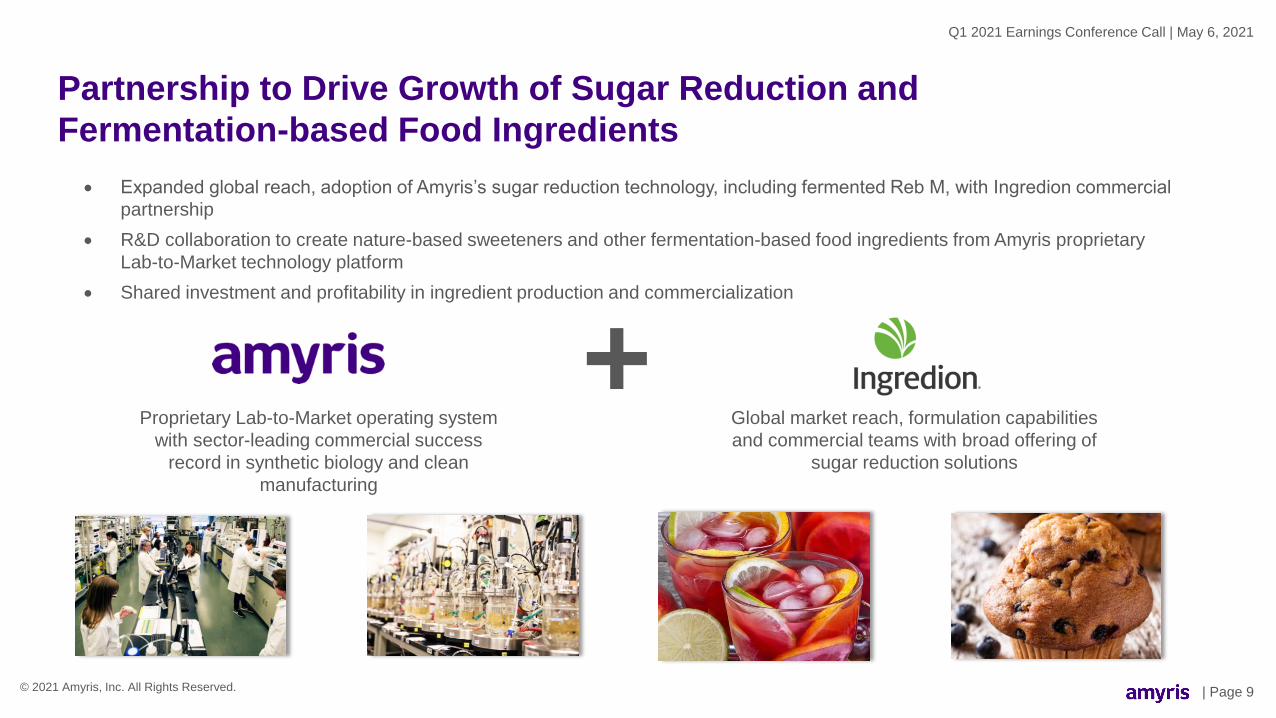
+Global market reach, formulation capabilities
and commercial teams with broad offering of
sugar reduction solutions
• Expanded global reach, adoption of Amyris’s sugar reduction technology, including fermented Reb M, with Ingredion commercial
partnership
• R&D collaboration to create nature-based sweeteners and other fermentation-based food ingredients from Amyris proprietary
Lab-to-Market technology platform
• Shared investment and profitability in ingredient production and commercialization
Proprietary Lab-to-Market operating system
with sector-leading commercial success
record in synthetic biology and clean
manufacturing
Partnership to Drive Growth of Sugar Reduction and
Fermentation-based Food Ingredients
Q1 2021 Earnings Conference Call | May 6, 2021
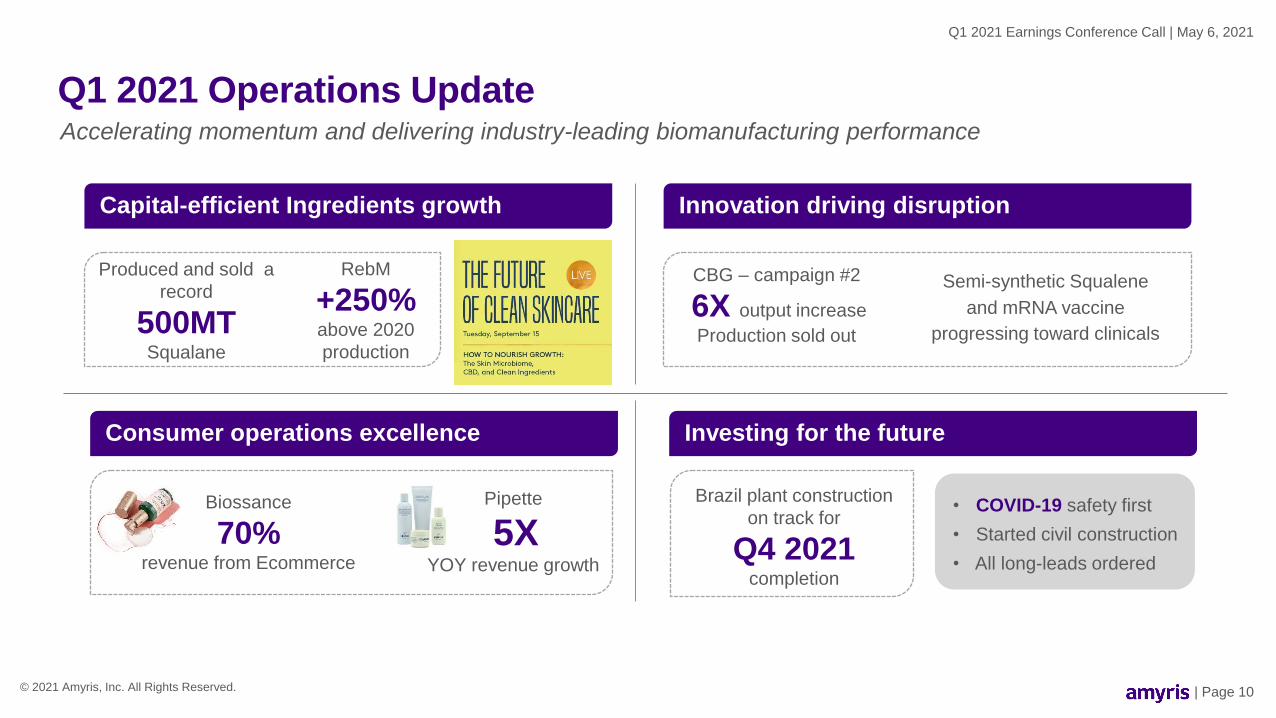
| Page 10© 2021 Amyris, Inc. All Rights Reserved.
RebM
+250%above 2020
production
Capital-efficient Ingredients growth Innovation driving disruption
Consumer operations excellence Investing for the future
Biossance
70%revenue from Ecommerce
Brazil plant construction
on track for
Q4 2021completion
• COVID-19 safety first
• Started civil construction
• All long-leads ordered
Pipette
5XYOY revenue growth
Q1 2021 Operations UpdateAccelerating momentum and delivering industry-leading biomanufacturing performance
Produced and sold a
record
500MTSqualane
CBG – campaign #2
6X output increase
Production sold out
Semi-synthetic Squalene
and mRNA vaccine
progressing toward clinicals
Q1 2021 Earnings Conference Call | May 6, 2021

| Page 11© 2021 Amyris, Inc. All Rights Reserved.
• Record Sales revenue of $177m, included $144m flavor and fragrance strategic transaction
• Product revenue of $28m was up 47% YoY, with Consumer revenue up 73% YoY and Ingredient
revenue +25% YoY
• Gross margin of 91% improved from 63% in PY and increased $142m YoY with $138m from
strategic and one-off items. Underlying Gross Margin at 52%, up $4m YoY, compared to 56% PY
due primarily to ingredient product mix
• Cash operating expense of $54m increased $9m or 21% YoY, mostly due to marketing
investments in consumer brands and new R&D programs. G&A decreased 3% YoY
• Adjusted EBITDA was $103m, a $130m YoY improvement due to strategic transaction, higher
underlying revenue, and improved product margin, partially offset by higher operating expense
• Debt at end of Q1 2021 of $115m compares to $209m at end of Q1 2020. Interest Expense of
$6m was down $9m or 61% from PY
$94mYoY REDUCTION IN DEBT
91%GROSS MARGIN
(NON-GAAP)
+507%TOTAL REVENUE
$103mADJUSTED EBITDA
Q1 2021 Financial HighlightsRecord revenue and significantly positive adjusted EBITDA
Q1 2021 Earnings Conference Call | May 6, 2021

Page 12
Sales Revenue
$m
Q1 2021
2021 2020 YoY%
Consumer 15.7 9.1 73%
Ingredients1 12.7 10.2 25%
Underlying Product1 28.4 19.3 47%
Collaboration2 4.9 5.0 -3%
Underlying Total3 33.3 24.3 37%
One-off 143.6 4.8 2882%
Reported Total 176.9 29.1 507%
1 Excl one-off (Vitamin E & DSM strategic transaction)2 Excl one-off (Vitamins in 2020)3 Excl one-off (Vitamins & DSM strategic Transaction)
Underlying Revenue $m
Collaboration vs Consumer & Ingredients
19
2631
35
28
5
4
3
5
5
0
0.05
0.1
0.15
0.2
0.25
$0
$5
$10
$15
$20
$25
$30
$35
$40
$45
Q120 Q220 Q320 Q420 Q121
Consumer & Ingredients ($m) excl one-offs
Collaboration & Grants ($m) excl one-offs
24
30
34
40
33
© 2021 Amyris, Inc. All Rights Reserved. | Page 12
Q1 2021 Sales Revenue By Category
Q1 2021 Earnings Conference Call | May 6, 2021

| Page 13© 2021 Amyris, Inc. All Rights Reserved.
Q1 2021 Key Financials
Underlying Total
Sales Revenue1 $mCash $mAdjusted EBITDA $m
1 Underlying total sales revenue as defined on previous page
Gross Margin $m
24
33
0
0.05
0.1
0.15
0.2
0.25
$0
$5,000
$10 ,000
$15 ,000
$20 ,000
$25 ,000
$30 ,000
$35 ,000
Q1 2020 Q1 2021
18
161
0
0.05
0.1
0.15
0.2
0.25
$0
$20 ,000
$40 ,000
$60 ,000
$80 ,000
$100,000
$120,000
$140,000
$160,000
$180,000
Q1 2020 Q1 2021
63% 91%
3
144
0
0.05
0.1
0.15
0.2
0.25
$0
$20 ,000
$40 ,000
$60 ,000
$80 ,000
$100,000
$120,000
$140,000
$160,000
Q1 2020 Q1 2021
(27)
103
0
0.05
0.1
0.15
0.2
0.25
($40,000)
($20,000)
$0
$20 ,000
$40 ,000
$60 ,000
$80 ,000
$100,000
$120,000
Q1 2020 Q1 2021
+37%
-$94m
+$142m+$130m
GM%
Sales Revenue
UP
Gross Margin
UP
Adjusted EBITDA
UP
Total Debt
DOWN
Q1 2021 Earnings Conference Call | May 6, 2021
Cash
UP
+$142m
209
115
0
0.05
0.1
0.15
0.2
0.25
$0
$50 ,000
$100,000
$150,000
$200,000
$250,000
Q1 2020 Q1 2021
Debt $m

2021 Full Year Outlook
• Underlying total revenue (Product, Collaboration & Grants) expected to be in the $250m range.
Reported total revenue expected to be around $400m inclusive of strategic transactions
• Continued growth combined with strategic transactions expected to result in positive full year
adjusted EBITDA
• Debt expected to be below $100m by year-end
Page 14Page 14© 2021 Amyris, Inc. All Rights Reserved. | Page 14
Q1 2021 Earnings Conference Call | May 6, 2021

Our proprietary Lab-to-Market
operating system has delivered
predictable commercialization,
significant cost reduction and fast
time-to-market
Our Ingredients Pipeline has
delivered unique, natural,
sustainably sourced, platform
molecules that disrupt markets and
enable the ESG agenda of industry
leaders
Our Consumer Brands have
delivered on the No Compromise®
promise for health, clean beauty
and personal care products that
make people and our planet
healthier
A Winning Business Model and Advantaged Portfolio
| Page 15© 2021 Amyris, Inc. All Rights Reserved.
*2021 launch dates are anticipated launch dates
*
*
Q1 2021 Earnings Conference Call | May 6, 2021

We Deliver on The Promise of Synthetic Biology
• Leading Synthetic Biology platform: fast, cost-effective and
sustainable approach using innovative and disruptive chemistry
to commercialize products
• Delivering industry-leading growth: in fast-growing and
attractive Health, Beauty and Wellness markets driven by
consumer preferences for clean, safe and sustainable
• Investing in the future: balancing continued growth and
optimization of portfolio with new science-driven opportunities to
make our planet healthier
• Long-term approach to shareholder value: establishing the
foundation for profitable growth, cash delivery and self-funding
| Page 16© 2021 Amyris, Inc. All Rights Reserved.
Q1 2021 Earnings Conference Call | May 6, 2021

Q&A

| Page 18© 2021 Amyris, Inc. All Rights Reserved.
Q1 2021 Earnings Conference Call | May 6, 2021
Q1 2021 Debt and Other Items
03/31/20 06/30/20 09/30/20 12/31/20 03/31/21
Common
outstanding163.9m 204.6m 239.2m 245.0m 273.3m
Fully diluted shares 252.1m 278.8m 336.0m 336.0m 332.8
Market capitalization $420m $874m $698m $1,514m $5,219m
Total capitalization $629m $1,051m $873m $1,684m $5,334m
297
209176 175 171
115
$0
$50
$100
$150
$200
$250
$300
$350
12/31/19 03/31/20 6/30/2020 9/30/2020 12/31/2020 03/31/21
Total Debt $m
Item $m 3/31/2021 3/31/2020 Comment
Debt 115 209 Debt has been reduced by 45%
Cash 144 3Driven by strategic transaction
income
Net Debt (29) 206Significant improvement in both debt
and cash
Item $m Q1 2021 Q1 2020 Comment
Net interest
expense6 15
Down 60% due to lower average
debt position versus prior year and
lower average interest rate
Effective tax rate -- --Not calculated due to negative
income
Capital
expenditures3 1 No issues to note
Page 19
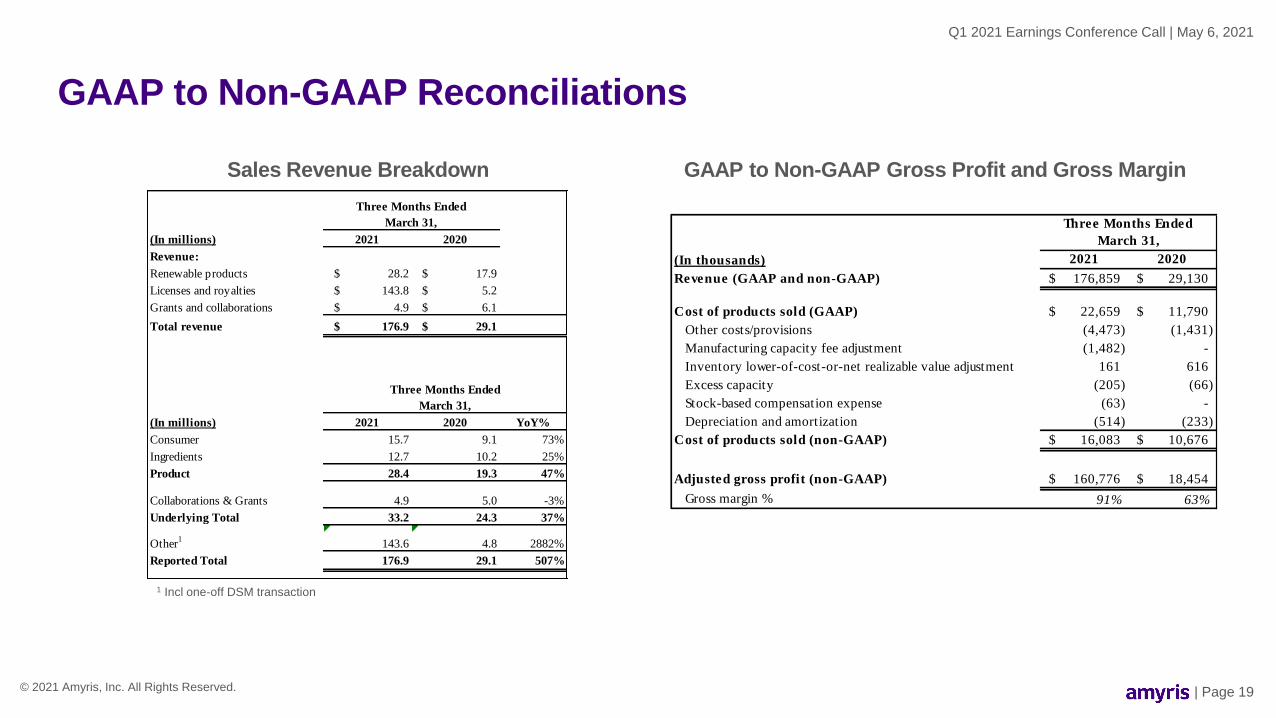
GAAP to Non-GAAP Reconciliations
Q1 2021 Earnings Conference Call | May 6, 2021
Sales Revenue Breakdown GAAP to Non-GAAP Gross Profit and Gross Margin
1 Incl one-off DSM transaction
(In millions) 2021 2020
Revenue:
Renewable products $ 28.2 $ 17.9
Licenses and royalties $ 143.8 $ 5.2
Grants and collaborations $ 4.9 $ 6.1
Total revenue $ 176.9 $ 29.1
(In millions) 2021 2020 YoY%
Consumer 15.7 9.1 73%
Ingredients 12.7 10.2 25%
Product 28.4 19.3 47%
Collaborations & Grants 4.9 5.0 -3%
Underlying Total 33.2 24.3 37%
Other1
143.6 4.8 2882%
Reported Total 176.9 29.1 507%
Three Months Ended
March 31,
Three Months Ended
March 31,
Three Months Ended
March 31,
(In thousands) 2021 2020
Revenue (GAAP and non-GAAP) 176,859$ 29,130$
Cost of products sold (GAAP) 22,659$ 11,790$
Other costs/provisions (4,473) (1,431)
Manufacturing capacity fee adjustment (1,482) -
Inventory lower-of-cost-or-net realizable value adjustment 161 616
Excess capacity (205) (66)
Stock-based compensation expense (63) -
Depreciation and amortization (514) (233)
Cost of products sold (non-GAAP) 16,083$ 10,676$
Adjusted gross profit (non-GAAP) 160,776$ 18,454$
Gross margin % 91% 63%
| Page 19© 2021 Amyris, Inc. All Rights Reserved.

Page 20
GAAP to Non-GAAP Net Income (Loss) and EPS
GAAP to Non-GAAP Reconciliations
GAAP to Non-GAAP Operating Expense
Three Months Ended
March 31,
(In thousands) 2021 2020
Research and development expense (GAAP) 23,332$ 17,126$
Stock-based compensation expense (1,062) (1,065)
Depreciation and amortization (1,321) (1,225)
R&D performance agreement termination (1,850) -
Research and development expense (non-GAAP) 19,099$ 14,836$
Sales, general and administrative expense (GAAP) 37,922$ 32,014$
Stock-based compensation expense (3,156) (2,439)
Depreciation and amortization (279) (261)
Sales, general and administrative expense (non-GAAP) 34,487$ 29,314$
Cash operating expense 53,586$ 44,150$
Q1 2021 Earnings Conference Call | May 6, 2021
| Page 20© 2021 Amyris, Inc. All Rights Reserved.
Three Months Ended March 31,
(In thousands, except per share data) 2021 2020
Net loss attributable to Amyris, Inc. common stockholders - Basic (GAAP) $ (289,152) $ (86,757)
Non-GAAP adjustments:
Stock-based compensation expense 4,281 3,504
(Gain) loss from change in fair value of derivative instruments 22,745 (3,282)
Loss from change in fair value of debt 326,785 16,503
Loss upon extinguishment of debt 27,313 27,319
Income attributable to noncontrolling interest 1,200 -
Loss allocated to participating securities (2,099) (1,087)
Inventory lower-of-cost-or-net realizable value adjustment (161) (616)
R&D Performance Agreement termination 1,850 -
Manufacturing capacity fee adjustment 1,482 -
Other (income) expense, net, and (gain) loss from investment in affiliate 286 411
Adjusted net income (loss) attributable to Amyris, Inc. common stockholders (non-GAAP) 94,530$ (44,005)$
Weighted-average shares outstanding
Weighted-average shares of common stock outstanding used in computing earnings (loss) per share attributable to
Amyris, Inc. common stockholders (non-GAAP) 267,733,555 155,065,635
Loss per share attributable to Amyris, Inc. common stockholders - Basic (GAAP) (1.08)$ (0.56)$
Non-GAAP adjustments:
Stock-based compensation expense 0.02 0.02
(Gain) loss from change in fair value of derivative instruments 0.08 (0.02)
Loss from change in fair value of debt 1.22 0.11
Loss upon extinguishment of debt 0.10 0.18
Income attributable to noncontrolling interest 0.00 -
Loss allocated to participating securities (0.01) (0.01)
Inventory lower-of-cost-or-net realizable value adjustment (0.00) (0.00)
R&D Performance Agreement termination 0.01 -
Manufacturing capacity fee adjustment 0.01 -
Other (income) expense, net, and (gain) loss from investment in affiliate 0.00 0.00
Adjusted earnings (loss) per share attributable to Amyris, Inc. common stockholders (non-GAAP)(1) 0.35$ (0.28)$
(1) Amounts may not sum due to rounding. - -
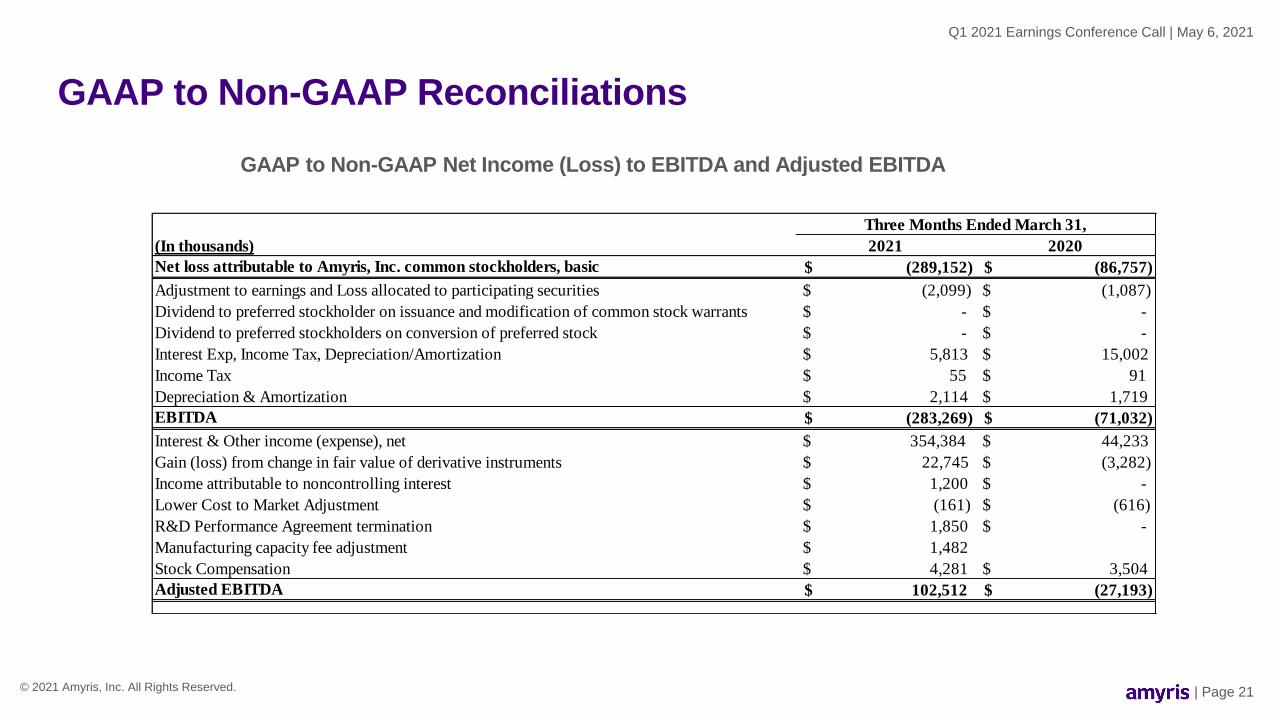
Three Months Ended March 31, Nine Months Ended September 30,
(In thousands) 2021 2020
Net loss attributable to Amyris, Inc. common stockholders, basic (289,152)$ (86,757)$
Adjustment to earnings and Loss allocated to participating securities $ (2,099) $ (1,087)
Dividend to preferred stockholder on issuance and modification of common stock warrants $ - $ -
Dividend to preferred stockholders on conversion of preferred stock $ - $ -
Interest Exp, Income Tax, Depreciation/Amortization $ 5,813 $ 15,002
Income Tax $ 55 $ 91
Depreciation & Amortization $ 2,114 $ 1,719
EBITDA (283,269)$ (71,032)$
Interest & Other income (expense), net $ 354,384 $ 44,233
Gain (loss) from change in fair value of derivative instruments $ 22,745 $ (3,282)
Income attributable to noncontrolling interest $ 1,200 $ -
Lower Cost to Market Adjustment $ (161) $ (616)
R&D Performance Agreement termination $ 1,850 $ -
Manufacturing capacity fee adjustment $ 1,482
Stock Compensation $ 4,281 $ 3,504
Adjusted EBITDA 102,512$ (27,193)$
Page 21
GAAP to Non-GAAP Net Income (Loss) to EBITDA and Adjusted EBITDA
GAAP to Non-GAAP Reconciliations
Q1 2021 Earnings Conference Call | May 6, 2021
| Page 21© 2021 Amyris, Inc. All Rights Reserved.


