Page 1
www.icm
rr.or
g
AN ANALYSIS OF DERIVATIVE AS AN FINANCIAL STRATEGY
FOR RISK MANAGEMENT BY THE INVESTORS IN INDIA
Dr ASHOK KUMAR RATH
Professor in Accounting and Finance, Regional college of Management, Bhubaneswar
ABSTRACT
Derivative Market is a high risk high return segment of an equity market. The past decade has
witnessed a massive growth in the use of financial derivatives by a wide range of corporate and
financial institutions. This growth has run in parallel with the increasing direct reliance of companies
on the capital market as the major source of long term funding. In this respect, derivatives have a vital
role to play in enhancing shareholder value by ensuring access to the cheapest source of funds.
OBJECTIVE OF THE STUDY
i. (i)To give an insight into derivatives and their application in Indian context.
ii. (ii)To gain an insight into derivative trading at a broking firm
iii. (iii)To identify, understand and analyze the strategies which help to minimize the Risk in the
Indian Equity Derivative Market in different market conditions.
iv. (iv)To implement strategies on investor‟s portfolio and measures the profit or loss as a result
of implementing the strategies.
Review of Literature
The trading of financial derivatives has received extensive attention, while at the same time it has led
to a debate over its impact on the underlying stock market from various facets by the academicians.
The researchers all over the world have done research on derivative trading and were able to find out
various facts about derivative and its trading. In this literature review efforts have been made to bring
into the picture the research done about various issues throughout the world by the researchers.
1-. Bajpai (2006) concludes that the capital market in India has gone through various stages of
liberalization, bringing about fundamental and structural changes in the market design and operation,
resulting in broader investment choices, drastic reduction in transaction costs, and efficiency,
transparency and safety as also increased integration with the global markets. The opening up of the
economy for investment and trade, the dismantling of administered interest and exchange rates
regimes and setting up of sound regulatory institutions have enabled time.
2-Mohan (2007) reviews India‟s approach to financial sector reforms that set in process since early
1990s. Allen, Chakrabarti, and De (2007) concludes that with recent growth rates among large
countries second only to China‟s, India has experienced nothing short of an economic transformation
since the liberalisation process began in the early 1990s.
3-Chhaochharia (2008) arrives at the conclusion that India has a more modern financial and banking
system than China that allocates capital in a more efficient manner. However, the study is skeptical
about who would emerge with the stronger capital market, as both the country is facing challenges
regarding their capital markets.
INTERCONTINENTAL JOURNAL OF FINANCE RESEARCH REVIEWISSN:2321-0354 - ONLINE ISSN:2347-1654 - PRINT - IMPACT FACTOR:1.552VOLUME 4, ISSUE 5, MAY 2016
www.icmrr.org 16 [email protected]
Page 2
www.icm
rr.or
g
4-Bose, Suchismita conducted research on (2009) found that Derivatives products provide certain
important economic benefits such as risk management or redistribution of risk away from risk-averse
investors towards those more willing and able to bear risk. Derivatives also help price discovery, i.e.
the process of determining the price level for any asset based on supply and demand. These functions
of derivatives help in efficient capital allocation in the economy. At the same time their misuse also
poses threat to the stability of the financial sector and the overall economy.
5-Sen Shankar Som and Ghosh Santanu Kumar (2010) studied the relationship between stock
market liquidity and volatility and risk. The paper also deals with time series data by applying
“Cochrane Orchutt two step procedures”. An effort has been made to establish a relation between
liquidity and volatility in their paper. It has been found that there is a statistically significant negative
relationship between risk and stock market liquidity. Finally it is concluded that there is no significant
relationship between liquidity and trading activity in terms of turnover.
6-Shenbagraman (2011) reviewed the role of some non-price variables such as open interests,
trading volume and other factors, in the stock option market for determining the price of underlying
shares in cash market. The study covered stock option contracts for four months from Nov. 2002 to
Feb. 2003 consisting 77 trading 49 days. The study concluded that net open interest of stock option is
one of the significant variables in determining future spot price of underlying share. The results
clearly indicated that open interest based predictors are statistically more significant than volume
based predictors in Indian context. All the existing studies found that the Equity return has a
significant and positive impact on the FII (Agarwal, 1997; Chakrabarti, 2001; and Trivedi & Nair,
2003).
7-Masih AM, Masih R, (2012), had studied “Global Stock Futures: A Diagstinoc Analysis of a
Selected Emerging and Developed Markets with Special Reference to India”, by using tools
correlation coefficients , granger‟s causality test, augmented Dicky Fuller test (ADF), Elliott,
Rothenberg and Stock point optimal test. The Authors, through this paper, have tried to find out what
kind of relationship exists between emerging and developed futures markets of selected countries.
8-Kumar, R. and Chandra, A. (2013), had studied that Individuals often invest in securities based
on approximate rule of thumb, not strictly in tune with market conditions. Their emotions drive their
trading behavior, which in turn drives asset (stock) prices. Investors fall prey to their own mistakes
and sometimes other‟s mistakes, referred to as herd behavior. Markets are efficient, increasingly
proving a theoretical concept as in practice they hardly move efficiently. The purely rational approach
is being subsumed by a broader approach based upon the trading sentiments of investors. The present
paper documents the role of emotional biases towards investment (or disinvestment) decisions of
individuals, which in turn force stock prices to move.
9-Srivastava, S., Yadav, S. S., Jain, P. K. (2014), had conducted a survey of brokers in the recently
introduced derivatives markets in India to examine the brokers‟ assessment of market activity and
their perception of benefits and costs of derivative 50 trading. The need for such a study was felt as
previous studies relating to the impact of derivatives securities on Indian Stock market do not cover
the perception of market participants who form an integral part of the functioning of derivatives
markets. The issues covered in the survey included: perception of brokers about the attractiveness of
different derivative securities for clients; profile of clients dealing in derivative securities; popularity
of a particular derivative security out of the total set; different purposes for which the clients are using
these securities in order of preference; issues concerning derivatives trading; reasons for non usage of
derivatives by some investors. The investors are using derivative securities for different purposes after
its penetration into the Indian Capital market.
INTERCONTINENTAL JOURNAL OF FINANCE RESEARCH REVIEWISSN:2321-0354 - ONLINE ISSN:2347-1654 - PRINT - IMPACT FACTOR:1.552VOLUME 4, ISSUE 5, MAY 2016
www.icmrr.org 17 [email protected]
Page 3
www.icm
rr.or
g
10-Naresh, G., (2015), studied the dynamic growth of the Derivatives market, particularly Futures &
Options and the perceived risks to the financial sector continue to stimulate debate on the proper
regulation of these instruments.
METHODOLOGY USED
The Methodology collecting information in order to verify a phenomenon. Both the research methods
were followed:
Sources of Data Collection
Primary Data: This was done through discussion with guide and other officials of credit department.
Secondary Data:
For the success of the present study data was collected mainly from secondary sources like annual
reports, news letter,magazines and journals of the company,
Analysis of DERIVATES A STRATEGY FOR RISK MANAGEMENT
The term “derivatives” is used to refer to financial instruments which derive their value from some
underlying assets. The underlying assets could be equities (shares), debt (bonds, T-bills, and notes),
currencies, and even indices of these various assets, such as the Nifty 50 Index. Derivatives can be
traded either on a regulated exchange, such as the NSE or off the exchanges, i.e., directly between the
different parties, which is called “over-the-counter” (OTC) trading. (In India only exchange traded
equity derivatives are permitted under the law.)
Average Daily Turnover in derivative segment(Rs.
cr.)
11410
1752
838810107
1922029543
52153.3
45310.6372392.07
2000-01
2001-02
2002-03
2003-04
2004-05
2005-06
2006-07
2007-08
2008-09
2009-10
Average Daily
Turnover (Rs. cr.)
The basic purpose of derivatives is to transfer the price risk (inherent in fluctuations of the asset
prices) from one party to another; they facilitate the allocation of risk to those who are willing to take
it. In so doing, derivatives help mitigate the risk arising from the future uncertainty of prices. For
example, on November 1, 2009 a rice farmer may wish to sell his harvest at a future date (say January
1, 2010) for a pre-determined fixed price to eliminate the risk of change in prices by that date. Such a
INTERCONTINENTAL JOURNAL OF FINANCE RESEARCH REVIEWISSN:2321-0354 - ONLINE ISSN:2347-1654 - PRINT - IMPACT FACTOR:1.552VOLUME 4, ISSUE 5, MAY 2016
www.icmrr.org 18 [email protected]
Page 4
www.icm
rr.or
g
transaction is an example of a derivatives contract. The price of this derivative is driven by the spot
price of rice which is the "underlying asset".
Types of derivatives
The main use of derivatives is to either remove risk or take on risk depending if one were a hedger or
a speculator. The main types of derivatives are
1. Future Contracts
2. Forward Contracts
3. Option Contracts and
4. Swaps
1-FORWARD CONTRACT
It is an agreement between two parties to buy or sell an asset (which can be of any kind) at a pre-
agreed future point in time. Therefore, the trade date and delivery date are separated. It is used to
control and hedge risk, for example currency exposure risk (e.g. forward contracts on USD or EUR)
or commodity prices (e.g. forward contrcts on oial).
2-FUTURE CONTRACT
In finance, a futures contract is a standardized contract, traded on a futures exchange, to buy or sell a
certain underlying instrument at a certain date in the future, at a specified price. The future date is
called the delivery date or final settlement date. The pre-set price is called the futures price. The price
of the underlying asset on the delivery date is called the settlement price.
A futures contract gives the holder the obligation to buy or sell, which differs from an options
contract, which gives the holder the right, but not the obligation. In other words, the owner of an
options contract may exercise the contract. Both parties of a "futures contract" must fulfill the contract
on the settlement date. The seller delivers the commodity to the buyer, or, if it is a cash-settled future,
then cash is transferred from the futures trader who sustained a loss to the one who made a profit.
(a) FUTURES PAYOFFS
Futures contracts have linear payoffs. In simple words, it means that the losses as well as profits for
the buyer and the seller of a futures contract are unlimited. These linear payoffs are fascinating as they
can be combined with options and the underlying to generate various complex payoffs.
(b) Payoff for buyer of futures: Long futures
The payoff for a person who buys a futures contract is similar to the payoff for a person who holds an
asset. He has a potentially unlimited upside as well as a potentially unlimited downside. Take the case
of a speculator who buys a twomonth Nifty index futures contract when the Nifty stands at 5220. The
underlying asset in this case is the Nifty portfolio. When the index moves up, the long futures position
starts making profits, and when the index moves down it starts making losses.
APPLICATION OF FUTURES
Hedging: Long security, sell futures
Futures can be used as an effective risk-management tool. Take the case of an investor who holds the
shares of a company and gets uncomfortable with market movements in the short run. He sees the
value of his security falling from Rs.450 to Rs.390. In the absence of stock futures, he would either
suffer the discomfort of a price fall or sell the security in anticipation of a market upheaval. With
security futures he can minimize his price risk. All he need do is enter into an offsetting stock futures
position, in this case, take on a short futures position. Assume that the spot price of the security he
holds is Rs.390. Two-month futures cost him Rs.402. For this he pays an initial margin. Now if the
INTERCONTINENTAL JOURNAL OF FINANCE RESEARCH REVIEWISSN:2321-0354 - ONLINE ISSN:2347-1654 - PRINT - IMPACT FACTOR:1.552VOLUME 4, ISSUE 5, MAY 2016
www.icmrr.org 19 [email protected]
Page 5
www.icm
rr.or
g
price of the security falls any further, he will suffer losses on the security he holds. However, the
losses he suffers on the security, will be offset by the profits he makes on his short futures position.
Take for instance that the price of his security falls to Rs.350. The fall in the price of the security will
result in a fall in the price of futures. Futures will now trade at a price lower than the price at which he
entered into a short futures position. Hence his short futures position will start making profits. The
loss of Rs.40 incurred on the security he holds, will be made up by the profits made on his short
futures position.
Index futures in particular can be very effectively used to get rid of the market risk of a portfolio.
Every portfolio contains a hidden index exposure or a market exposure. This statement is true for all
portfolios, whether a portfolio is composed of index securities or not. In the case of portfolios, most of
the portfolio risk is accounted for by index fluctuations (unlike individual securities, where only 30-
60% of the securities risk is accounted for by index fluctuations). Hence a position LONG
PORTFOLIO + SHORT NIFTY can often become one-tenth as risky as the LONG PORTFOLIO
position!
3-OPTION CONTRACTS
Options are financial instruments that convey the right, but not the obligation, to engage in a future
transaction on some underlying security. For example, buying a call option provides the right to buy a
specified amount of a security at a set strike price at some time on or before expiration, while buying
a put option provides the right to sell. Upon the option holder's choice to exercise the option, the party
that sold, or wrote, the option must fulfill the terms of the contract.
For example, Jewelry manufacturer Goldbuyer agrees to buy gold at Rs. 600 (the forward or delivery
date) from gold mining concern Goldseller. Suppose that Goldbuyer belives that there is some chance
for the spot price to fall below Rs.600, so that he losses on his forward position. To limit his loss,
Goldbuyer could purchase a call option for Rs. 5 (the option price or premium) at a strike or
exercise price of Rs. 600 with an expiration date three months from now. The call option gives
Goldbuyer the right (but not the obligation) to buy gold at the strike price on the expiration date.
Then, if the spot price indeed declines, he could choose not to exercise the option, and his loss would
be limited to the purchase price of Rs. 5. Alternatively, Goldbuyer may anticipate that the spot price is
very likely to decline, and attempt to profit from such an eventuality by buying a put option, giving
him the right to sell gold at the strike price on the expiration date.
Options turnover over years with growth percentage
0
1000000
2000000
3000000
4000000
5000000
6000000
7000000
8000000
9000000
0.00%
50.00%
100.00%
150.00%
200.00%
250.00%
300.00%
National turnover(Rs cr.) Growth
National turnover(Rs cr.) 28928 109377 270023 290779 518722 985701 1721247.43 3960728.65 8534029.38
Growth 0.00% 278.10% 146.87% 7.69% 78.39% 90.02% 74.62% 130.11% 115.47%
2001-02 2002-03 2003-04 2004-05 2005-06 2006-07 2007-08 2008-09 2009-10
INTERCONTINENTAL JOURNAL OF FINANCE RESEARCH REVIEWISSN:2321-0354 - ONLINE ISSN:2347-1654 - PRINT - IMPACT FACTOR:1.552VOLUME 4, ISSUE 5, MAY 2016
www.icmrr.org 20 [email protected]
Page 6
www.icm
rr.or
g
OPTION STRATEGIES
BUY CALL
Strategy View Investor thinks that the market will rise significantly in the short-term.
Strategy Implementation Call options are bought with a strike price of a. The more bullish the
investor is, the higher the strike price should be. By this strategy, the downside risk is avoided
BUY CALL (RELIANCE CAPITAL)
Price of Rel Cap on 1st June 2010 Rs 652.56.
The stock is expected to increase up to Rs 765 in
Short term.
So buy a call option of Rel cap with a strike price
Of Rs 720 of the maturity 24 June.
Premium paid for the option – Rs 37.50
Exercise the option on 21 June 2010 as on 21 june, the price of the scrip touched Rs 766.05
Payoff = 766.05-(720+37.50)
Rs 8.55(profit)
BUY PUT
Strategy View - Investor thinks that the market will fall significantly in the short-term. .
Strategy Implementation - Put option is bought with a strike price of E. The more bearish the
investor is, the lower the strike price should be.
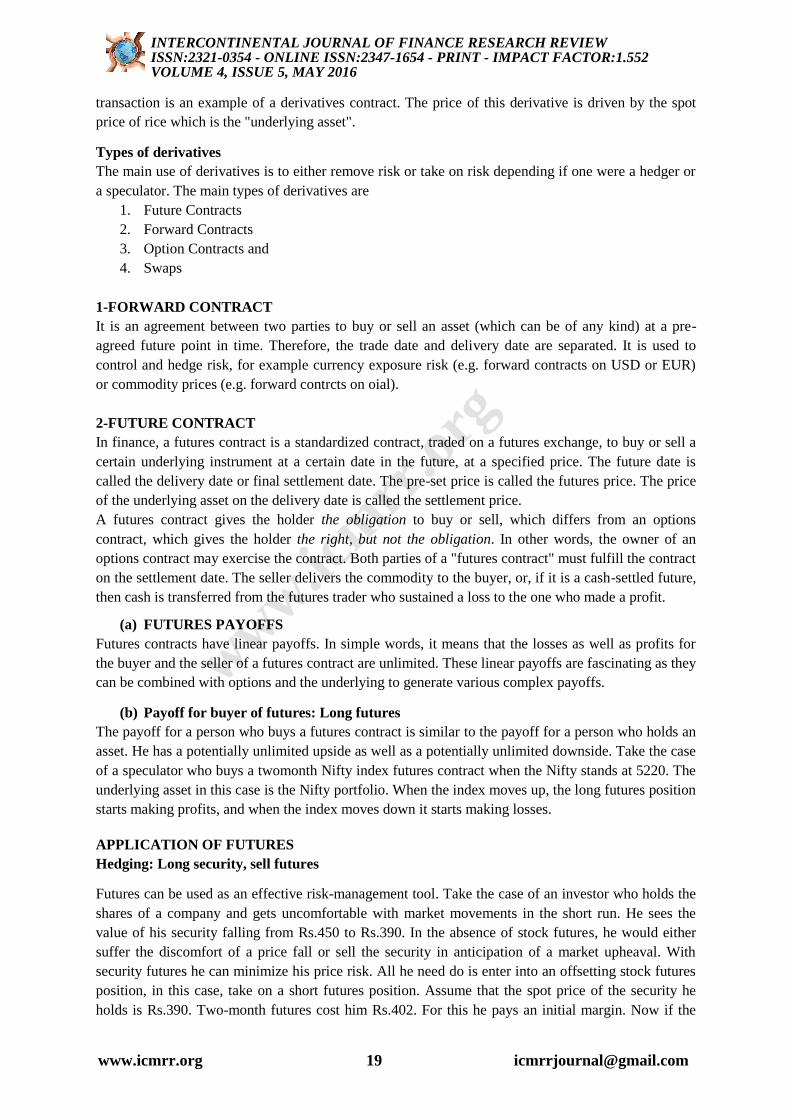
SELL CALL
Strategy View Investor is certain that the market will not rise and is unsure/ unconcerned whether it
will fall.
Strategy Implementation Call option is sold with a strike price of E. If the investor is very certain of
his view then at-the-money options should be sold, if less certain, then out-of-the-money ones should
be sold.
EXAMPLE
Option premium to be received – Rs10.00*100 = Rs1000
Amount to be received for selling shares = Rs150*100 = Rs15000
If market value of the underlyned share will be Rs140, then the buyer will not exercise the contract.
Hence Profit/Loss will be the premium received = 100*10 = 1000(profit)
Exercise Price 150
Size of the contract 100 shares
Price of the share on the date of contract 144
Price of option on the date of contract 10
INTERCONTINENTAL JOURNAL OF FINANCE RESEARCH REVIEWISSN:2321-0354 - ONLINE ISSN:2347-1654 - PRINT - IMPACT FACTOR:1.552VOLUME 4, ISSUE 5, MAY 2016
www.icmrr.org 21 [email protected]
Page 7
www.icm
rr.or
g
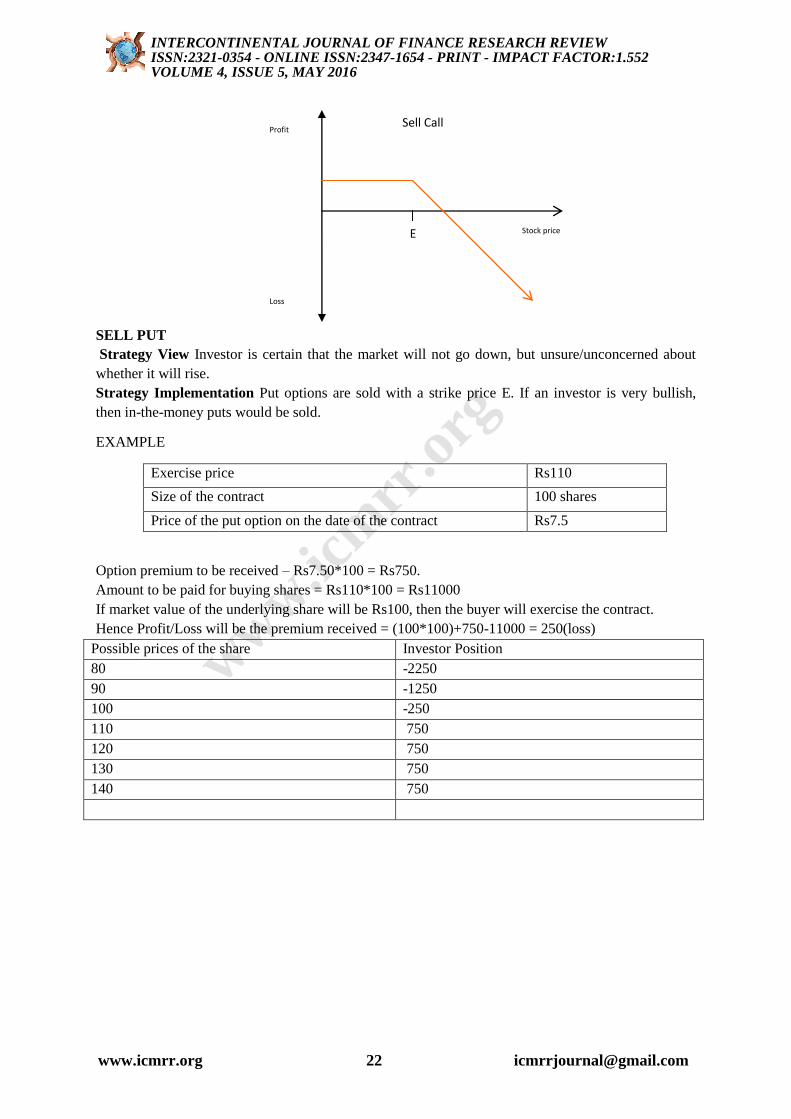
SELL PUT
Strategy View Investor is certain that the market will not go down, but unsure/unconcerned about
whether it will rise.
Strategy Implementation Put options are sold with a strike price E. If an investor is very bullish,
then in-the-money puts would be sold.
EXAMPLE
Exercise price Rs110
Size of the contract 100 shares
Price of the put option on the date of the contract Rs7.5
Option premium to be received – Rs7.50*100 = Rs750.
Amount to be paid for buying shares = Rs110*100 = Rs11000
If market value of the underlying share will be Rs100, then the buyer will exercise the contract.
Hence Profit/Loss will be the premium received = (100*100)+750-11000 = 250(loss)
Possible prices of the share Investor Position
80 -2250
90 -1250
100 -250
110 750
120 750
130 750
140 750
E Stock price
Profit
Loss
Sell Call
INTERCONTINENTAL JOURNAL OF FINANCE RESEARCH REVIEWISSN:2321-0354 - ONLINE ISSN:2347-1654 - PRINT - IMPACT FACTOR:1.552VOLUME 4, ISSUE 5, MAY 2016
www.icmrr.org 22 [email protected]
Page 8
www.icm
rr.or
g
BULL SPREAD (CALL)
Strategy View Investor thinks that the market will not fall. It is a Conservative strategy for one who
thinks that the market is more likely to rise than fall.
Strategy Implementation It involves having two calls on the same stock with same expiry date but
with different exercise prices. Call option is bought with a strike price below the stock price and
another call option sold with a strike price above the stock price.
Ex-1- BULL SPREAD (SIEMENS) WITH CALL
Price of Siemens on 1st June 2010 Rs 684.
The stock is expected to increase up to Rs 735 in Short term.
So buy a call option of 24 June with a strike price of Rs 680 – premium paid Rs 104.90
& sell a call option with same maturity date with a strike price of 700 – premium received Rs 29.00.
Initial outlay = 29 – 104.90 = -76.10
Exercise the option on 23 June 2010 as on 23 June, the price of the scrip touched Rs 738.
Payoff from bought call = 738 -680 = 58
Payoff from sold call = 700-738 = -38
Total payoff = 58 - (76.10+38) = Rs 56.10(loss)
Stock pricce Payoff from short put Total pay off Net profit=
Payoff + premium
S1>110 0(Not exercised) 0 Rs7.50
S1=102.50 102.50 - 110 - 7.50 -7.50+7.50=0
S1<102.50 X<102.50-110
E
Stock price
Profit
Loss
Sell Put
INTERCONTINENTAL JOURNAL OF FINANCE RESEARCH REVIEWISSN:2321-0354 - ONLINE ISSN:2347-1654 - PRINT - IMPACT FACTOR:1.552VOLUME 4, ISSUE 5, MAY 2016
www.icmrr.org 23 [email protected]
Page 9
www.icm
rr.or
g
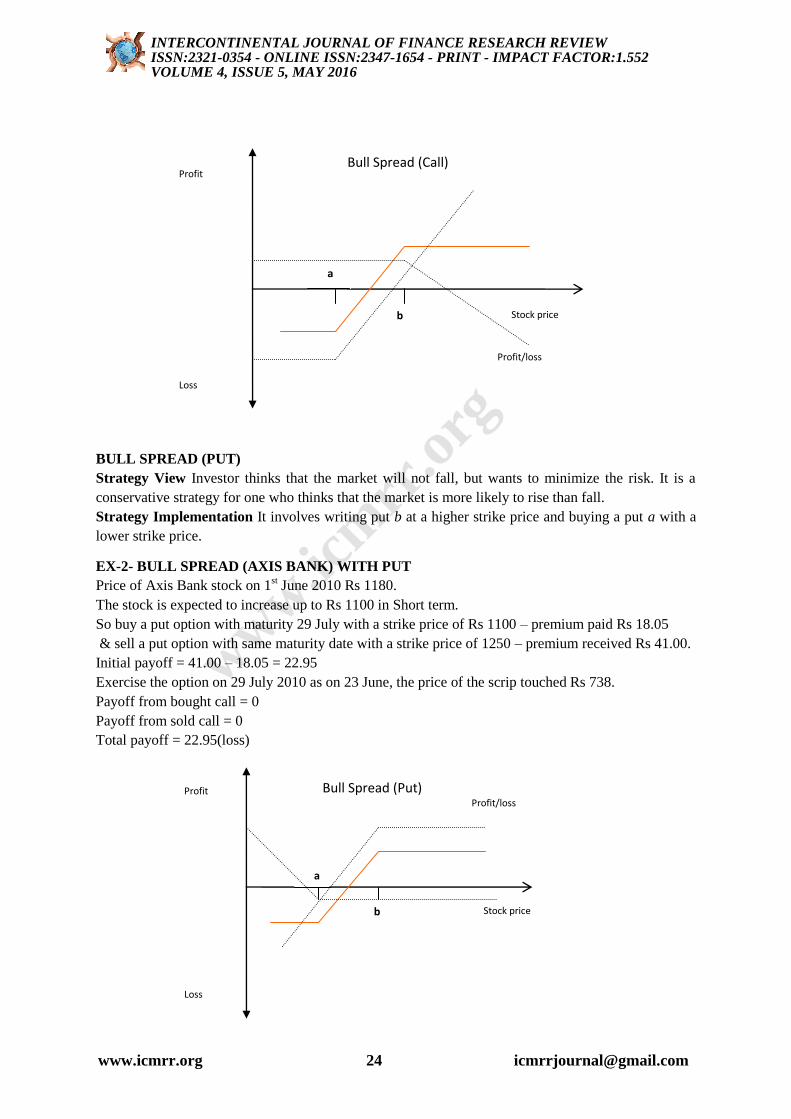
BULL SPREAD (PUT)
Strategy View Investor thinks that the market will not fall, but wants to minimize the risk. It is a
conservative strategy for one who thinks that the market is more likely to rise than fall.
Strategy Implementation It involves writing put b at a higher strike price and buying a put a with a
lower strike price.
EX-2- BULL SPREAD (AXIS BANK) WITH PUT
Price of Axis Bank stock on 1st June 2010 Rs 1180.
The stock is expected to increase up to Rs 1100 in Short term.
So buy a put option with maturity 29 July with a strike price of Rs 1100 – premium paid Rs 18.05
& sell a put option with same maturity date with a strike price of 1250 – premium received Rs 41.00.
Initial payoff = 41.00 – 18.05 = 22.95
Exercise the option on 29 July 2010 as on 23 June, the price of the scrip touched Rs 738.
Payoff from bought call = 0
Payoff from sold call = 0
Total payoff = 22.95(loss)
a
Stock price
Profit
Loss
Bull Spread (Call)
b
Profit/loss
a
Stock price
Profit
Loss
Bull Spread (Put)
b
Profit/loss
INTERCONTINENTAL JOURNAL OF FINANCE RESEARCH REVIEWISSN:2321-0354 - ONLINE ISSN:2347-1654 - PRINT - IMPACT FACTOR:1.552VOLUME 4, ISSUE 5, MAY 2016
www.icmrr.org 24 [email protected]
Page 10
www.icm
rr.or
g
BEAR SPREAD (CALL)
Strategy View Investor thinks that the market will not rise, but wants to minimize the risk. It is a
conservative strategy for one who thinks that the market is more likely to fall than rise.
Strategy Implementation Call option is sold with a lower strike price of „a’ and another call option
is bought with a higher strike of „b’
BEAR SPREAD (PUT)
Strategy View Investor thinks that the market will not rise, but wants to minimize the risk.
Conservative strategy for one who thinks that the market is more likely to fall than rise.
Strategy Implementation Put option is sold with a lower strike price of a and another put option is
bought with a strike of b
Ex-3-BEAR SPREAD (BPCL) WITH PUT
Price of BPCL stock on 1st June 2010 = Rs 583.
The stock is expected to be bearish in Short term.
1. Option 1 - Sell a put option with maturity of 24th June with an exercise price of Rs 580 –
premium received Rs 79.50.
2. Option 2 - Buy a put option with same maturity date with an exercise price price of Rs 600 –
premium paid Rs 95.60.
Initial payoff = 79.50 – 95.60 = (-16.10)
Exercise the option on 24th June 2010. Stock price on 24
th june = Rs 550.05
Payoff from put-1 = 550.05-580 = (-29.95)
Payoff from Put-2 = 600-550.05 = 49.95
Net payoff = 49.95- (16.10+29.95)
Rs 03.90(profit)
.BUY STRADDLE (LONG STRADDLE)
Strategy view Where the Investor expects a sharp movement in the share price, but unsure of
direction, it is an appropriate strategy.
Strategy implementation long straddle involves buying a Call & a Put at the same exercise price
and for the same tenure. A buyer of the Straddle buys both call & the put.
EXAMPLE-4
ASSUMPTION -- STRIKE = Rs 100
CALL PREMIUM = Rs 5
Put premium = Rs 4
Initial investment = Rs 9
INTERCONTINENTAL JOURNAL OF FINANCE RESEARCH REVIEWISSN:2321-0354 - ONLINE ISSN:2347-1654 - PRINT - IMPACT FACTOR:1.552VOLUME 4, ISSUE 5, MAY 2016
www.icmrr.org 25 [email protected]
Page 11
www.icm
rr.or
g a
Stock price
Profit
Loss
Buy Straddle
Profit/loss
IF END STOCK IS CALL PAYOFF PUT PAYOFF NET PAYOFF
95 0 5 -4
96 0 4 -5
97 0 3 -6
98 0 2 -7
99 0 1 -8
100 0 0 -9
101 1 0 -8
102 2 0 -7
103 3 0 -6
104 4 0 -5
105 5 0 -4
SHORT STRADDLE
Strategy view: Investor thinks that the market will be not be very volatile in the short-term. It is a
strategy for relatively stable stock. A short straddle works whenever the price remains within the
band.
Strategy implementation: A short straddle involves selling both the call and the put.
Ex-5-SHORT STRADDLE (JP ASSOCIATE)
Price of BPCL stock on 1st June 2010 = Rs 117.6.
The stock is a relatively less volatile one.
1. Option 1 - Sell a call option with maturity of 29th July with an exercise price of Rs 130 –
premium received Rs 06.00.
2. Option 2 - Sell a put option with same maturity date and exercise price – premium paid Rs
05.55.
Initial payoff = 06.00 + 05.55 = Rs 11.55
Exercise the option on 22nd
July 2010. Stock price on 22nd
July Rs 131.50
Payoff from option-1 = 130.00-131.50 = (-01.50)
Payoff from option-2 = 0 option will not be exercised.
INTERCONTINENTAL JOURNAL OF FINANCE RESEARCH REVIEWISSN:2321-0354 - ONLINE ISSN:2347-1654 - PRINT - IMPACT FACTOR:1.552VOLUME 4, ISSUE 5, MAY 2016
www.icmrr.org 26 [email protected]
Page 12
www.icm
rr.or
g
Net payoff = 11.55-01.50
Rs 10.05(profit)
BUY STRANGLE
Strategy view: Investor thinks that the market will be very volatile in the short-term.
Strategy implementation: This is identical to the straddle except that the call has an exercise price
above the stock price and the put has an exercise price below the stock price and the premium paid is
less.
Ex-6- BUY STRANGLE (TATA STEEL)
Price of Tata Steel stock on 1st June 2010 = Rs 493.17.
The stock shows a high volatility in the short term.
1. Option 1 - Buy a call option with maturity of 24th June with an exercise price of Rs 480.00 –
premium paid Rs 14.25.
2. Option 2 – Buy a put option with same maturity date and exercise price of Rs 500.00 –
premium paid Rs 01.05.
Initial outlay = -(14.25 + 01.05) = -15.30
Exercise the option on 24th June 2010. Stock price on 24
th June Rs 501.12
Payoff from option-1 = 501.12-480.00 = 21.12
Payoff from option-2 = 0 option will not be exercised.
Net payoff = 21.12-15.30
Rs 05.82(profit)
a
Stock price
Profit
Loss
Sell Straddle
Profit/loss
INTERCONTINENTAL JOURNAL OF FINANCE RESEARCH REVIEWISSN:2321-0354 - ONLINE ISSN:2347-1654 - PRINT - IMPACT FACTOR:1.552VOLUME 4, ISSUE 5, MAY 2016
www.icmrr.org 27 [email protected]
Page 13
www.icm
rr.or
g
SELL STRANGLE
Strategy view: The investor thinks that the market will not be volatile within a broadish band.
Strategy implementation: This is identical to the straddle except that the call has an exercise price
above the stock price and the put has an exercise price below the stock price and the premium paid is
less.
Ex-7-SELL STRANGLE (SUZLON)
Price of Suzlon stock in June 2010 = Rs 55.6.
The stock shows a relative stability in the short term.
1. Option 1 - Sell a call option with maturity of 24th June with an exercise price of Rs 60.00 –
premium received Rs 00.60.
2. Option 2- Sell a put option with same maturity date and exercise price of Rs 50.00 –
premium received Rs 00.05.
Initial payoff = 00.60+00.05 = 00.65
Exercise the option on 24th June 2010. Stock price on 24
th June Rs 57.65
Payoff from option-1 = 0 (option will not be exercised).
Payoff from option-2 = 0 (option will not be exercised).
Net payoff = 00.65(Profit)
a
Stock price
Profit
Loss
Buy Strangle
Profit/loss
From put option
b
Profit/loss
From call option
a
Profit
Loss
Sell Strangle
Profit/loss
From put option
b
Profit/loss
From call option
INTERCONTINENTAL JOURNAL OF FINANCE RESEARCH REVIEWISSN:2321-0354 - ONLINE ISSN:2347-1654 - PRINT - IMPACT FACTOR:1.552VOLUME 4, ISSUE 5, MAY 2016
www.icmrr.org 28 [email protected]
Page 14
www.icm
rr.or
g
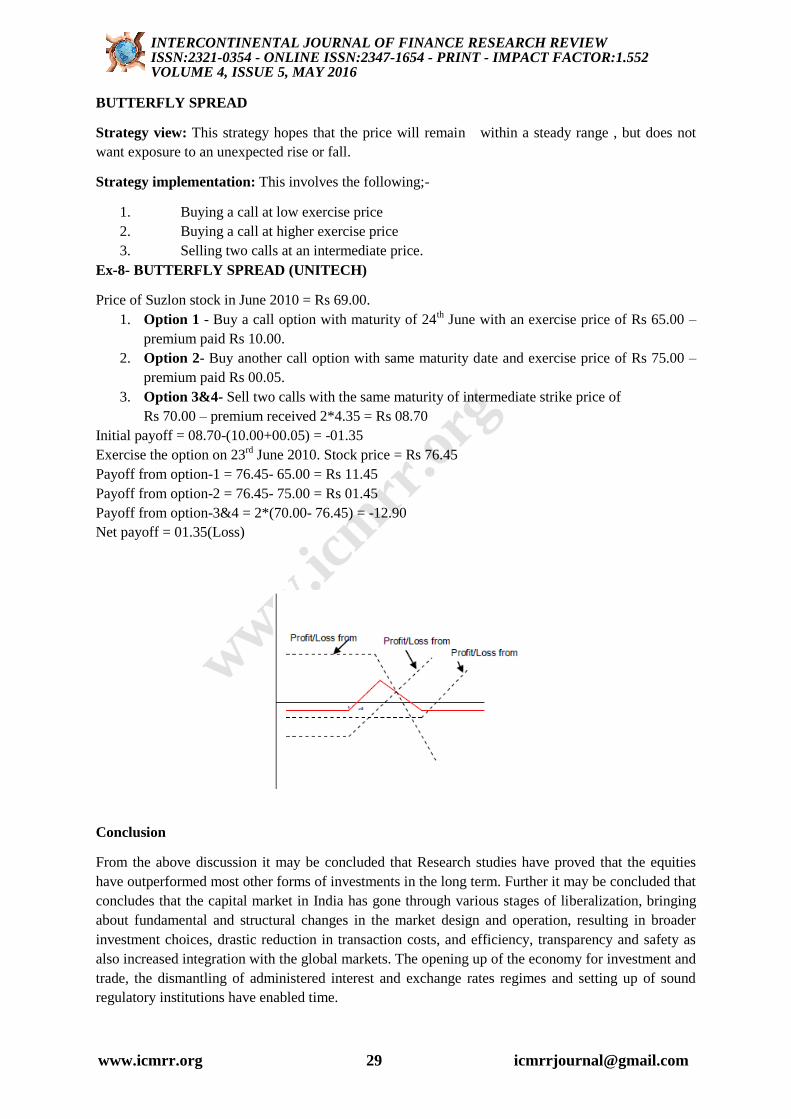
BUTTERFLY SPREAD
Strategy view: This strategy hopes that the price will remain within a steady range , but does not
want exposure to an unexpected rise or fall.
Strategy implementation: This involves the following;-
1. Buying a call at low exercise price
2. Buying a call at higher exercise price
3. Selling two calls at an intermediate price.
Ex-8- BUTTERFLY SPREAD (UNITECH)
Price of Suzlon stock in June 2010 = Rs 69.00.
1. Option 1 - Buy a call option with maturity of 24th June with an exercise price of Rs 65.00 –
premium paid Rs 10.00.
2. Option 2- Buy another call option with same maturity date and exercise price of Rs 75.00 –
premium paid Rs 00.05.
3. Option 3&4- Sell two calls with the same maturity of intermediate strike price of
Rs 70.00 – premium received 2*4.35 = Rs 08.70
Initial payoff = 08.70-(10.00+00.05) = -01.35
Exercise the option on 23rd
June 2010. Stock price = Rs 76.45
Payoff from option-1 = 76.45- 65.00 = Rs 11.45
Payoff from option-2 = 76.45- 75.00 = Rs 01.45
Payoff from option-3&4 = 2*(70.00- 76.45) = -12.90
Net payoff = 01.35(Loss)
Conclusion
From the above discussion it may be concluded that Research studies have proved that the equities
have outperformed most other forms of investments in the long term. Further it may be concluded that
concludes that the capital market in India has gone through various stages of liberalization, bringing
about fundamental and structural changes in the market design and operation, resulting in broader
investment choices, drastic reduction in transaction costs, and efficiency, transparency and safety as
also increased integration with the global markets. The opening up of the economy for investment and
trade, the dismantling of administered interest and exchange rates regimes and setting up of sound
regulatory institutions have enabled time.
INTERCONTINENTAL JOURNAL OF FINANCE RESEARCH REVIEWISSN:2321-0354 - ONLINE ISSN:2347-1654 - PRINT - IMPACT FACTOR:1.552VOLUME 4, ISSUE 5, MAY 2016
www.icmrr.org 29 [email protected]
Page 15
www.icm
rr.or
g
REFERENCES
1. Websites
www.fin.min.blog
www.tata steel.com
www.google.com
2. Books & Journals
The custom Act, 1962 (Universal law publisher)
Import documentation
International marketing
Financial management, I M Pandey.
Booklets of Orissa project
Research methodology, C.R. Kothari.
INTERCONTINENTAL JOURNAL OF FINANCE RESEARCH REVIEWISSN:2321-0354 - ONLINE ISSN:2347-1654 - PRINT - IMPACT FACTOR:1.552VOLUME 4, ISSUE 5, MAY 2016
www.icmrr.org 30 [email protected]