An Analysis of the Financial Literacy of Senior Students Across Fields of Study at the University of Mississippi by Robert Hollis Burrow A thesis submitted to the faculty of The University of Mississippi in partial fulfillment of the requirements of the Sally McDonnell Barksdale Honors College. Oxford May 2017 Approved by ____________________________________ Advisor: Professor Bonnie Van Ness ____________________________________ Reader: Professor Seong Byun ____________________________________ Reader: Professor Thomas Garrett
Transcript
An Analysis of the Financial Literacy of Senior Students Across Fields of Study at the University of Mississippi
by Robert Hollis Burrow
A thesis submitted to the faculty of The University of Mississippi in partial fulfillment of the requirements of the Sally McDonnell Barksdale Honors College.
Oxford May 2017
Approved by
____________________________________ Advisor: Professor Bonnie Van Ness
____________________________________
Reader: Professor Seong Byun
____________________________________ Reader: Professor Thomas Garrett
ii
Ó 2017 Robert Hollis Burrow
ALL RIGHTS RESERVED
iii
ACKNOWLEDGEMENTS
I would like to thank Dr. Bonnie Van Ness for her willing support, advice, and guidance throughout this process. Her kindness and sacrifice of time were crucial for the completion of this project. I would also like to thank Dr. Seong Byun and Dr. Thomas Garrett for agreeing to participate as my second and third readers and serve on the panel for my thesis defense. I am grateful for the numerous professors who took interest in my study and allowed me to use their class time to administer my surveys. I am also very thankful for the assistance of Serhat Yildiz in both educating and helping me run regressions using the Statistical Analysis System. I would be remiss if I did not also thank the Sally McDonnell Barksdale Honors College for all of the amazing opportunities I have been granted during my time at the University of Mississippi. My time here would not have been the same without those experiences and support. Lastly, I want to give thanks to God for blessing my life with enumerable friends and family members who have encouraged and loved me so well.
iv
ABSTRACT Robert Hollis Burrow: An Analysis of the Financial Literacy of Senior Students Across
Fields of Study at the University of Mississippi (Under the direction of Dr. Bonnie Van Ness)
This thesis examines the financial literacy of senior students at the University of
Mississippi, as well as which variables influence a student’s financial literacy level.
Financial literacy is crucial for both an individual’s current and long-term well-being and
financial health. Students in various major fields of study participated in a multiple-
choice survey, including demographic, socioeconomic, and financial literacy questions.
The student’s answers were analyzed using univariate analyses, an ordinary least squares
stepwise regression, and a logistic stepwise regression. The study found that the average
student score of 2.75 out of five financial literacy questions was comparable to the
national average of 2.9 out of five financial literacy questions. Six key variables were
found to influence financial literacy: gender, ethnicity, being enrolled in a business-
related field of study, father’s education level, parental income level, and actively
relationship”, and 34% selected “I don’t know” (Figure 21). In the national FINRA study,
28% of participants selected the correct answer, 33% selected an incorrect answer, and
37% selected “I don’t know” (FINRA, 2013).
11% 6%
54%
29%
Figure20InflationQuestionResults
More
Same
Less
Idon'tknow
29
The last two financial literacy questions on the survey were true or false
questions. The first was, “True or False: A 15-year mortgage typically requires higher
monthly payments than a 30-year mortgage but the total interest over the life of the loan
will be less.” FINRA categorizes this question as a mortgage question. Of the total
participants, 71% selected the correct answer of “True”, 9% selected “False”, and 20%
selected “I don’t know” (Figure 22). In the national FINRA study, 75% of participants
selected the correct answer, 9% selected an incorrect answer, and 15% selected “I don’t
know” (FINRA, 2013).
31%
26%
5% 4%
34%
Figure21BondPriceQuestionResults
Rise
Fall
Staythesame
Norelationship
Idon'tknow
71%
9%
20%
Figure22MortgageQuestionResults
True
False
Idon'tknow
30
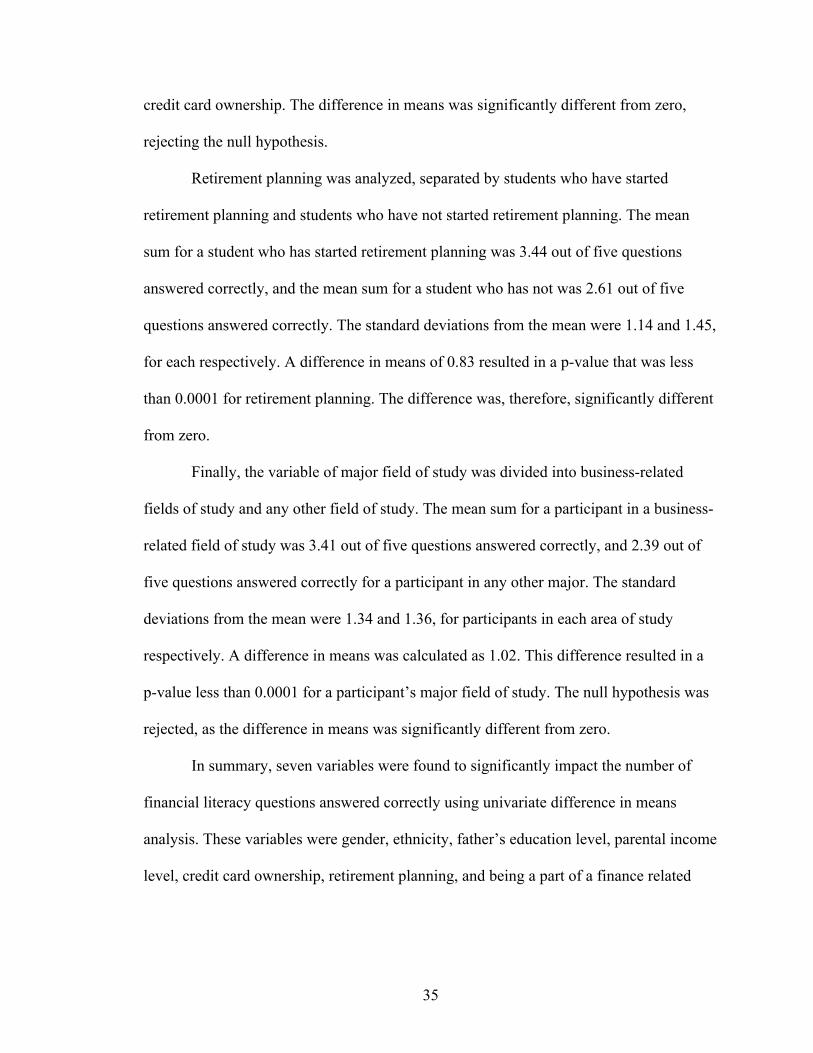
The final financial literacy question asked, “Buying a single company’s stock
usually provides a safer return than a stock mutual fund.” This question is categorized by
FINRA as a risk question. Of the total participants, 47% selected the correct answer of
“False”, 12% selected “True”, and 41% selected “I don’t know” (Figure 23). In the
national FINRA study, 48% of participants selected the correct answer, 9% selected an
incorrect answer, and 42% selected “I don’t know” (FINRA, 2013).
12%
47%
41%
Figure23RiskQuestionResults
True
False
Idon'tknow
31
Chapter 6: Univariate Analysis
The analysis of this study’s survey responses was conducted using the Statistical
Analysis System, or SAS, which is a software program originally developed at North
Carolina State University in 1976. The SAS software is used extensively by the finance
department faculty, given its ability to run multiple types of statistical analyses and
regressions. The responses to the survey were recorded on scantron forms and run
through a special type of scantron machine that read the raw data into an excel file. The
data was then sorted and some responses were converted into binary dummy variables for
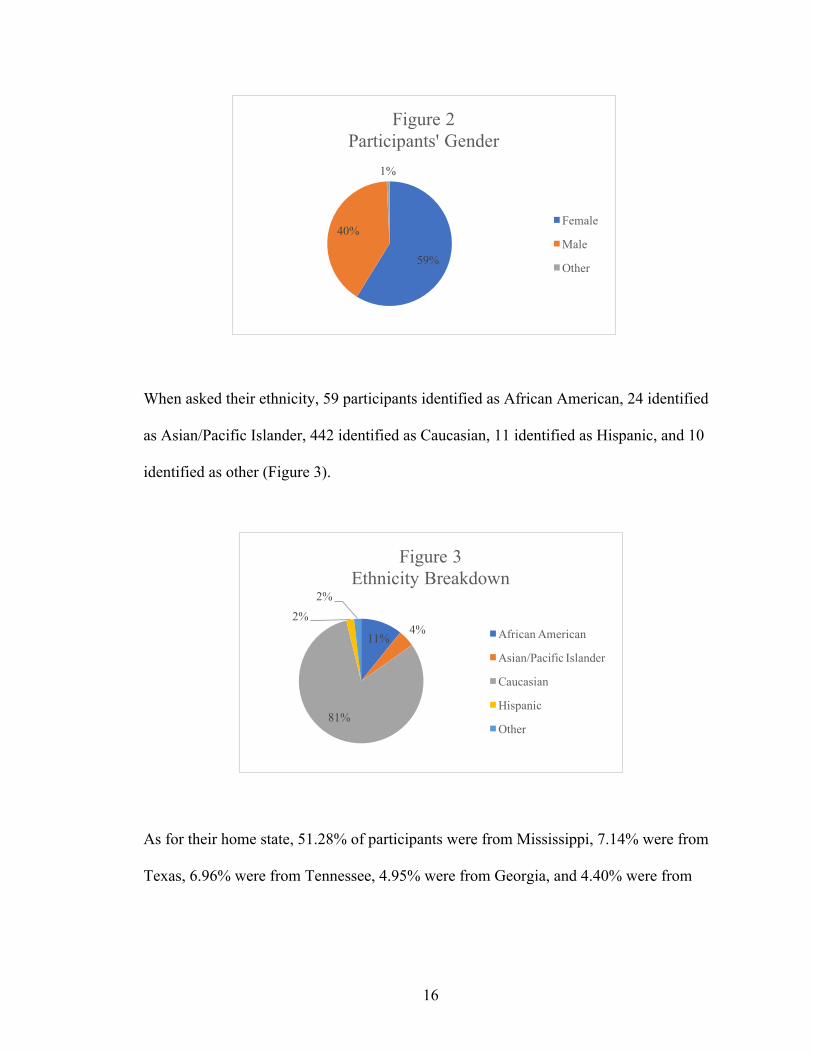
easier analysis in the regressions. The responses to the question “what is your ethnicity?”
were converted into a dummy variable of one if the respondent was Caucasian and zero if
the respondent was another ethnicity. Similarly, the answers to the question “what are
your post-graduation plans?” were converted into a dummy variable equal to one if the
respondent had a plan and zero if the respondent was taking a year off or did not yet
know. The dummy variable representing the highest degree completed by the
respondent’s father was assigned a one if the respondent’s father had a Bachelor’s Degree
or higher, and zero if the respondent’s father had an Associate Degree or lower.
Similarly, the dummy variable for the highest degree completed by the respondent’s
mother was equal to one if the respondent’s mother had a Bachelor’s Degree or higher,
and zero if the respondent’s mother had an Associate Degree or lower. Joint parental
income was converted into a dummy variable of one if the respondent’s parents had a
32
joint yearly income of greater than $90,000, and zero if the respondent’s parents had a
joint yearly income of $90,000 or less. And finally, responses regarding the respondent’s
major field of study were converted into a dummy variable of one if the respondent’s
major was in the School of Business or Accountancy and zero if the respondent’s major
was in any non-business related field. Serhat Yildiz, a Ph.D. candidate in finance at the
University of Mississippi, analyzed this data using the SAS program.
The first tests conducted were univariate analyses. A difference in means analysis
was used to focus on data from one specific demographic or socioeconomic variable at a
time. The total number of correct responses to the five FINRA financial literacy questions
was the variable compared between the two groups. Using univariate analysis, a mean
sum was calculated for each of the variables considered. The mean sum represents the
average score of correctly answered financial literacy questions. A standard deviation
from the mean was also calculated for each variable, representing the dispersion of data
from the reported mean. The difference between the means for each respective variable
was then calculated to determine if the variable influenced the number of correct
responses to the financial literacy questions. Additionally, each difference in means was
identified as either significantly different from zero or not significantly different from
zero, which is the null hypothesis. The test statistic used was a standard t-statistic, with
statistical significance determined by the p-value, denoted by “Pr > |t|.” The p-value
represents the probability of obtaining a test statistic as large as the one calculated if the
null hypothesis, in this case that the means are equal, is true. A variable with a p-value of
less than 0.1 is generally accepted as statistically significant.
33
The first variable considered was gender, which was divided into females and
males. Four respondents indicated their gender as “other” and were dropped from this
univariate analysis. The mean sum for females was 2.39 out of five questions answered
correctly, and the mean sum for males was 3.24 out of five questions answered correctly.
The standard deviations from the mean were 1.41 and 1.29, for females and males
respectively. The difference in mean number of correct answers was -0.85, resulting in a
p-value of less than 0.0001, which is significantly different from zero. A statistically
significant difference of -0.85 means the null hypothesis, that mean scores of the two
genders are equal, was rejected. The national average score is 2.6 correct answers for
females and 3.2 correct answers for males (FINRA, 2012). Although we are not
statistically testing the difference between University of Mississippi students and the
FINRA population, it can be inferred that, based on gender, University of Mississippi
senior students are scoring reasonably comparable to males and females nationally.
Ethnicity was divided using the dummy variable of one for Caucasian and zero
for African American, Hispanic, Asian, Pacific Islander, or any other ethnicity. The mean
sum for Caucasians was 2.84 out of five questions answered correctly, while the mean
sum for any other ethnicity was 2.34 out of five questions answered correctly. The
standard deviation from the mean was 1.43 for Caucasians and 1.39 for any other
ethnicity. The difference in means was calculated as 0.51, resulting in a p-value of 0.0011
for ethnicity. This means the difference is statistically different from zero, and the null
hypothesis is rejected. Nationally, Caucasians score an average of 3.0, African Americans
score an average of 2.4, Hispanics score an average of 2.6, and Asians score an average
of 3.2 (FINRA, 2012).
34
The education level of a participant’s father was separated by a Bachelor’s degree
or higher and an Associate degree or lower. The mean sum for a participant with a father
who had a four-year college education or more was 2.86 out of five correct answers, and
the mean sum for a participant with a father who earned an Associate degree or lower
was 2.53 out of five correct answers. The standard deviations from the mean were 1.43
and 1.43, respectively. This resulted in a difference in means of 0.33 and a p-value of
0.01 for a participant’s father’s education level. This difference in means is, therefore,
significantly different from zero.
Joint parental income was divided into yearly income greater than $90,000 and
yearly income of $90,000 or less. The mean sum for a participant with parental income
greater than $90,000 was 2.94 out of five questions answered correctly. A mean sum of
2.46 out of five questions answered correctly was calculated for those with less income.
The standard deviations were 1.45 and 1.37, for each type of parental income level
respectively. The resulting p-value was 0.0001, based on a difference in means of 0.48.
The null hypothesis was rejected, as the difference in means is significantly different
from zero.
Credit card ownership was the next variable considered. A dummy variable of one
was used for not having a credit card and zero for owning a credit card. The mean sum
for an individual not having a credit card was 2.62 out of five correct answers, and the
mean sum for an individual owning a credit card was 2.85 out of five correct answers.
The standard deviation was 1.48 for not having a credit card and 1.39 for owning a credit
card. A difference in means was calculated as -0.23, resulting in a p-value of 0.0567 for
35
credit card ownership. The difference in means was significantly different from zero,
rejecting the null hypothesis.
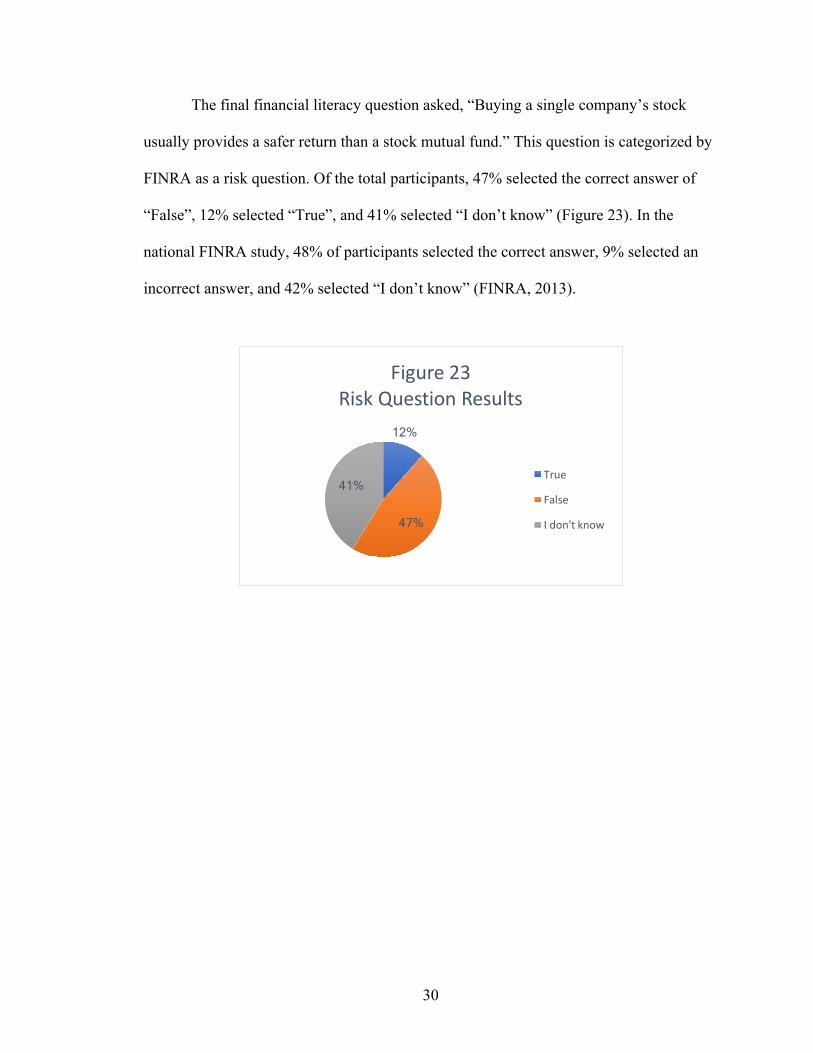
Retirement planning was analyzed, separated by students who have started
retirement planning and students who have not started retirement planning. The mean
sum for a student who has started retirement planning was 3.44 out of five questions
answered correctly, and the mean sum for a student who has not was 2.61 out of five
questions answered correctly. The standard deviations from the mean were 1.14 and 1.45,
for each respectively. A difference in means of 0.83 resulted in a p-value that was less
than 0.0001 for retirement planning. The difference was, therefore, significantly different
from zero.
Finally, the variable of major field of study was divided into business-related
fields of study and any other field of study. The mean sum for a participant in a business-
related field of study was 3.41 out of five questions answered correctly, and 2.39 out of
five questions answered correctly for a participant in any other major. The standard
deviations from the mean were 1.34 and 1.36, for participants in each area of study
respectively. A difference in means was calculated as 1.02. This difference resulted in a
p-value less than 0.0001 for a participant’s major field of study. The null hypothesis was
rejected, as the difference in means was significantly different from zero.
In summary, seven variables were found to significantly impact the number of
financial literacy questions answered correctly using univariate difference in means
analysis. These variables were gender, ethnicity, father’s education level, parental income
level, credit card ownership, retirement planning, and being a part of a finance related
36
major field of study. The data related to these univariate analyses can be found in Table 1
and Table 2 in the appendices.
37
Chapter 7: Ordinary Least Squares Stepwise Regression Analysis
The second type of statistical analysis was an ordinary least squares stepwise
regression. A typical multivariate ordinary least squares regression analyzes all the
possible independent variables for significant impact on the dependent variable. The
dependent variable, in this case, is the number of correct answers to the five financial
literacy questions. Running this model as a stepwise regression changes the procedure
slightly from a normal OLS model. In a stepwise regression, there is a selection of
independent variables by an automatic process. Step by step, each independent variable is
considered for inclusion in the model based on pre-specified criteria. In this study, the
selection criterion was a significance level of 0.3 for each independent variable to enter
the model. For the selected independent variables to remain in the model, they had to
maintain a 0.35 significance level. After the independent variables were selected, the
regression was conducted. Coefficients were estimated for each independent variable,
representing the average increase or decrease in the number of questions answered
correctly for the variable being considered, holding all others constant. A change in the
independent variable of one, using dummy variables, will result in an average change in
the dependent variable equal to the coefficient. The p-value was used to judge the
statistical significance of each variable in the model, with a value of .1 or less indicating
the effect of the variable was significantly different from zero. The following information
pertains to only the variables that were statistically significant in the regression model.
38
The first independent variable to be added to the stepwise OLS model was being
in a business-related major. A dummy variable of one was used for participants in a
business-related major, and zero otherwise. The regression coefficient was 0.8104,
meaning that someone who is enrolled in a business field of study averages 0.8104
correct answers higher than those that are not. The variable was shown to be significant
by a p-value of less than 0.0001. These results mean that, in the presence of all the other
independent variables, enrollment in a business major matters towards the number of
financial literacy questions answered correctly.
Gender was segregated into dummy variables, with female being a one and male
being a zero. The four participants identifying as other gender were dropped. The
coefficient for gender was -0.7463, indicating that females average approximately three
fourths of a question less than males. This coefficient had a p-value of less than 0.0001.
Gender matters towards the total score of the financial literacy survey, in the presence of
all the variables.
Interestingly, the next most significant factor in this regression was whether a
person had already started to plan for retirement. If a participant had started retirement
planning, he or she was assigned a dummy variable of one. The coefficient indicated that
those who had started planning scored an average of 0.5018 correct answers higher than
those that had not. The p-value was 0.0009, meaning that retirement planning matters in
correctly answering the financial literacy survey.
A dummy variable of one was assigned to participants with joint parental income
of greater than $90,000, and zero to those with less. Based on the coefficient, seniors
whose parents earn more than $90,000 annually averaged 0.2689 correct answers higher.
39
The statistical significance was verified by a p-value of 0.0266, indicating parental
income level matters.
The next variable was the education level of a participant’s father, with a dummy
variable of one for student’s whose father achieved a Bachelor’s degree or higher. The
regression coefficient was 0.2878, so participants with a more highly educated father
answered more questions correctly. The variable was found to be significant based on the
p-value of 0.032.
Caucasians were assigned a dummy variable of one and all other ethnicities were
assigned a zero to analyze the influence of ethnicity within the model. A coefficient of
0.2609 showed that, on average, Caucasians were able to answer 0.2609 more questions
correctly compared to other ethnicities taking the survey. A p-value of 0.0834 indicated
statistical significance.
The last two variables shown to be significant within the OLS model are reported
as marginally significant in this regression. Owning three or more credit cards and being
employed while enrolled in college had p-values of 0.096 and 0.0981, respectively.
Surprisingly, the coefficient for owning three or more credit cards was 0.4851, meaning
that participants who currently own at least three credit cards averaged about one half
more correct answers than those who have less than three credit cards. One might think
that a person who signed up for that many credit cards while in college might be
financially uneducated or irresponsible, yet the results show that those in this study
actually performed better. The coefficient for someone who has held either a full or part-
time job while attending the University of Mississippi was 0.1853, meaning that working
while attending college positively influences the score on this financial literacy quiz.
40
In summary, eight independent variables were found to significantly impact the
number of financial literacy questions answered correctly using an ordinary least squares
stepwise regression. These variables were being enrolled in a business-related major,
gender, retirement planning, parental income level, father’s education level, ethnicity,
owning three or more credit cards, and having a full or part-time job. All of the relevant
information for this regression can be found in Table 3 in the appendices.
41
Chapter 8: Logistic Stepwise Regression Analysis
The third type of statistical test utilized was a logistic stepwise regression.
Because the dependent variable in the ordinary least squares regression was bounded and
discrete (rather than continuous), this logistic stepwise regression was conducted to
ensure that the variables that significantly influenced the financial literacy score in the
OLS model hold when the dependent variable is not assumed to be continuous and
normally distributed. This type of regression works differently than the previous test by
having a different dependent variable. In the case of a logistic regression, the dependent
variable must be a binomial response with only two possible outcomes. For this study, the
binomial response was based upon a participant answering more than three financial
literacy questions correctly. All of the independent variables are then analyzed in the
regression to determine if they influence the likelihood of a person answering more than
three finance questions correctly. This effect is reported by an estimated coefficient. A
positive coefficient means that a respondent is more likely to answer more than three
question correctly, while a negative coefficient means that the individual is less likely.
And again, because it is a stepwise regression, each variable must meet the selections
criteria. The criteria were a 0.3 significance level to enter the model and maintaining a
0.35 significance to remain in the model. Another difference to note is that, rather than a
p-value, a logistic regression uses a chi-square value to determine significance. But just
42
like the p-value, a chi-square value of less than .1 denotes statistical significance and is
therefore interpreted in a similar manner.
Five independent variables were found to be significant and positively affect the
likelihood of more than three correct answers on the financial literacy quiz, meaning all
five of the variables had positive coefficients. The factors were being enrolled in a
business-related major, having an annual joint parental income of greater than $90,000,
being a Caucasian, having started retirement planning, and having a father who attained a
Bachelor’s degree or higher. These results mean that being a part of any of these
categories increases the person’s likelihood of being able to answer more than three of
the FINRA questions correctly, and therefore being financially literate. All five variables
were found to be statistically significant with chi-square values well below 0.05.
Only one independent variable was found to be statistically significant in
negatively impacting the likelihood of answering more than three questions correctly. A
participant being a female was found to have a negative estimated coefficient, meaning
females were less likely to correctly answer over three questions. The gender variable
was found to be significant by a chi-square value of less than 0.0001.
In summary, five significant variables reported positive estimated coefficients and
one variable reported a negative coefficient. Majoring in a business field of study, having
a parental income over $90,000, being Caucasian, planning for retirement, or having a
father who completed at least a four-year college degree all increased the likelihood of
financial literacy as defined by the dependent variable. Being a female decreased the
likelihood of financial literacy. All of the relevant information pertaining to the logistic
stepwise regression can be found in Table 4 in the appendices.
43
Conclusion
Millennials are entering the workforce at a time of great fear in regard to the
potential loss of government-backed social security. And the burden of financial security
has become even greater for Millennials as the trend of defined contribution plans
continues and the number of potential financial investment options increases rapidly. And
as technological advances in healthcare extend the longevity of life for the average
American citizen, this longevity also increases the amount of retirement savings needed
for a comfortable life. Financial literacy is therefore very important for the Millennial
generation to achieve.
This study was conducted in an attempt to analyze the financial literacy levels of
near college graduates from the University of Mississippi to see how they compared with
national averages taken from the FINRA financial literacy quiz. Nationally, Americans
scored an average of 2.9 out of five questions correctly. However, the national average
for people aged 18 to 34 years old, the Millennials, was 2.3 out of five questions correct
(FINRA, 2013). Meanwhile, the average number of correctly answered questions from
this thesis study was found to be 2.75 out of five. At first glance, these numbers seem to
show that senior students at the University of Mississippi are scoring higher on average
than their Millennial cohorts. But FINRA also reported that Americans with some college
education scored an average of three correct answers, and those with a complete college
education or more averaged 3.5 out of five questions correct (FINRA, 2013). This data
44
implies that students nearing the completion of their degrees should be closer to a range
of 3.0 to 3.5, as they are now practically “college educated.”
In addition, analyses and regressions were conducted using collected demographic
and socioeconomic information to analyze each factor’s impact on the total number of
questions answered correctly and financial literacy. The first series of tests were
univariate analyses, looking at the statistical impact of each single independent variable
on the dependent variable of questions correctly answered. Seven variables were found to
significantly impact financial literacy, six of which improved the average and one which
lowered it. The six improving variables were being Caucasian compared to other
ethnicities, having a father with a Bachelor’s degree or higher, having a joint parental
income of greater than $90,000, owning a credit card, planning for retirement, and being
enrolled in a business-related major. The variable that negatively influenced the average
was being female.
An ordinary least square stepwise regression was then run to analyze the factors’
influence on the number of questions answered correctly, while in the presence of all the
other independent variables. Eight variables were reported as having statistical
significance, seven of which improved the average number of correct answers. Those
seven variables were being enrolled in a business-related major, planning for retirement,
having a parental income level over $90,000, having a father who earned a Bachelor’s
degree or higher, being Caucasian, owning three or more credit cards, and having a full or
part-time job while in school. Being a female was the one variable that lowered the
average.
45
Finally, a logistic stepwise regression was conducted to see which variables were
significant in affecting financial literacy, defined in this study as answering more than
three questions correctly. Six variables were found to be statistically significant, with five
showing a positive impact towards financial literacy and one impacting it negatively.
Majoring in a business field of study, having a parental income over $90,000, being
Caucasian, planning for retirement, or having a father who completed at least a four-year
college degree all increased the likelihood of being financially literate. Being a female
decreased the likelihood of financial literacy.
In general, I found six key variables in determining financial literacy: gender,
ethnicity, being enrolled in a business-related field of study, father’s education level,
parental income level, and actively planning for retirement. Only a couple of these
variables, chosen major field of study and active retirement planning, can be effectively
influenced by the University of Mississippi. While I am not advocating for all students at
the University of Mississippi to major in a business-related field, enrolling in a personal
finance class would likely have a positive influence on university students’ scores. The
topics related to the financial literacy questions, including retirement planning, are
covered in a personal finance course. Since it is unlikely that the University of
Mississippi would be willing to require all students to take a personal finance class,
encouraging enrollment as well as disseminating the results of this study might push
some students to work toward gaining more knowledge in the area of finance.
The University of Mississippi could also increase financial education
opportunities for students who are included in the demographic and socioeconomic
groups which this study indicates tend to perform worse on the financial literacy
46
questions. The Panhellenic Council could host a financial literacy event or workshop,
with qualified speakers addressing every member of a sorority on campus about financial
literacy topics. The University could provide financial education resources to campus
organizations catering to minorities, such as the Black Student Union, as well as
providing periodic volunteer instruction from finance professionals and teachers. Signs
and posters could be hung in campus housing with helpful personal finance tips and facts
to promote increased financial learning. The Office of Financial Aid could require any
student receiving financial support from the University to complete a short course on
money management, to help bridge the gap between the financial literacy rates of lower
income and higher income students. And these are just a few recommendations amongst
the numerous possibilities I am sure the University of Mississippi administration could
imagine. It is my hope that this study will bring awareness to the current issues of
financial literacy, and encourage future efforts to increase the level of financial
knowledge.
47
APPENDICES
Financial Literacy Survey: *Do not include your name, student ID number or any other identifying information
1. How old are you?
a. At least 18, if not please return the survey to the administrator b. 19 c. 20 d. 21 e. 22 or older
2. What is your gender? a. Male b. Female c. Other
3. What is your ethnicity? a. African American b. Hispanic or Latino c. Caucasian d. Asian/ Pacific Islander e. Other
4. Do you have a full-time or part-time job while attending school? a. Yes b. No
5. Are you graduating by August 2017? a. Yes b. No
6. What are your post-graduation plans? a. I have a job already lined up b. I am applying for jobs currently c. I am attending some type of graduate or professional school d. Taking a year off e. I don’t know yet
7. What is the highest degree completed by your father? a. High School/GED b. Associate Degree c. Bachelor’s Degree d. Masters Degree, MD, JD, Doctorate e. I don’t know
8. What is the highest degree completed by your mother? a. High School/GED b. Associates Degree c. Bachelors Degree d. Master’s Degree, MD, JD or Doctorate e. I don’t know
48
9. Which of the following best describes your parents earnings: a. $0-40,000 b. $40,001-$90,000 c. $90,001-$150,000 d. Above $150,000 e. I don’t know
10. Please rate your relationship with your bank: a. Poor b. Neutral c. Above Average d. Excellent e. I don’t have a bank
11. Have you ever overdraft on your bank account? a. Yes b. No
12. Do you have a budget? a. Yes b. No
13. Do you own a credit card? a. No b. Yes, I own 1 c. Yes, I own 2 d. Yes, I own 3 or more
14. Do you have student loans? a. Yes b. No
15. Have you begun financially planning for retirement? a. Yes b. No
16. Suppose you have $100 in a savings account earning 2 percent interest a year. After five years, how much would you have?
a. More than $102 b. Less than $102 c. Exactly $102 d. I don’t know
17. Imagine that the interest rate on your savings account is 1 percent a year and inflation is 2 percent a year. After one year, would the money in the account buy more than it does today, exactly the same or less than today?
a. More b. Same c. Less d. I don’t know
49
18. If interest rates rise, what will typically happen to bond prices? Rise, fall, stay the same, or is there no relationship?
a. Rise b. Fall c. Stay the same d. No relationship e. I don’t know
19. True or False: A 15-year mortgage typically requires higher monthly payments than a 30-year mortgage but the total interest over the life of the loan will be less.
a. True b. False c. I don’t know
20. Buying a single company’s stock usually provides a safer return than a stock mutual fund
a. True b. False c. I don’t know
Please turn to the back of the scantron, 21. In the first two columns for your LAST NAME, please bubble in your postal
abbreviation of your home state (two letter abbreviation). 22. In the IDENTIFICATION NO section, please bubble in your major field of study. A0 – Finance A1 – Accounting A2 – Management A3– Marketing A4 – Management Information Systems (MIS) A5 – Integrated Marketing Communications A6 – Journalism A7 – Public Policy and Leadership A8 – Croft Institute or International Studies A9 – Chemistry B0 – Biology B1 – Psychology
B2 – Engineering B3 – English B4– Education B5 – History B6 – Religious Studies B7 – Math B8 – Social Work B9 – Hospitality Management C0 – Exercise Science C1 – Foreign Language C2 – Economics C3 – Other
50
Table 1: Summary Statistics of Independent Variables
N Mean of Correct Answers to Five Financial Literacy Questions
*Four individuals identified their genders as “other” and are dropped from the gender variable. **Mean of correct answers to five financial literacy questions for each variable group.
52
Table 3: Ordinary Least Squares Stepwise Regression
Analysis of Variance:
Source Sum of Squares Mean Square F Value Pr > F Model 276.64 21.28 13.41 <.0001 Error 844.48 1.59 Corrected Total 1121.12 R-Square 0.2468 Adj. R-Sq. 0.2283 Parameter Estimates:
• Dependent variable: answering more than three financial literacy questions correctly
54
BIBLIOGRAPHY
American Financial Services Association Education Foundation. 2017. “State-by-State Assessment with Regard to Financial Literacy and Personal Finance Education Actions.” n.p. Web. Ebeling, Ashlea. 2016. “Is Everybody Stressed About Retirement?” Forbes. n.p. Web. Elam, Carol; Stratton, Terry; Gibson, Denise. 2006. “Welcoming a New Generation to College: The Millennial Students.” Journal of College Admission. n195, p20-25. Web. Financial Industry Regulatory Authority. 2013. “Financial Capability in the United States: Report of Findings from the 2012 National Financial Capability Study.” p1-40. Web. Financial Literacy and Education Commission. 2016. “Promoting Financial Success in the United States: National Strategy for Financial Literacy.” p1-47. Web. Goldman Sachs. 2016. “Millennials Infographic.” n.p., Web. Hawkins, Ken. 2008. “These Financial Products Are Too Complex for the Average Joe.” n.p. Web. Jump$tart Coalition. 2017. “About the Jump$tart Coalition for Personal Financial Literacy.” n.p. Web. Kantrowitz, Mark. 2016. “Why the Student Loan Crisis is Even Worse Than People Think.” TIME. n.p. Web. Mitchell, Josh. 2016. “More Than 40% of Student Borrowers Aren’t Making Payments.” Wall Street Journal. n.p. Web. National Center for Education Statistics. 2016. “Undergraduate Enrollment.” n.p. Web. New York Times. 2013. “Social Security, Present and Future.” n.p., Web. Odland, Steve. 2012. “College Costs Out of Control.” Forbes. n.p. Web. Organization for Economic Co-operation and Development. 2006. “The Importance of Financial Education.” n.p. Web. Pew Research Center. 2015. “Comparing Millennials to Other Generations.” n.p., Web. President’s Advisory Council on Financial Literacy. 2008. “2008 Annual Report to the President.” p1-71. Web.
55
Steverman, Ben. 2016. “The 401(k) Is Wreaking Havoc on Retirement.” Bloomberg. n.p. Web. TIME. 2012. “Op-Ed: Improving Financial Literacy Is Essential to Our Nation's Economic Health.” n.p. Web. University of Mississippi. 2016. “Diversity Matters.” p1-96. Web. US Census Bureau. 2015. “Millennials Outnumber Baby Boomers and Are Far More Diverse, Census Bureau Reports.” n.p. Web. Wang, Penelope. 2017. “You May Live Longer Than You Think. Here’s How to Afford It.” TIME. n.p. Web. Zucchi, Kristina. 2017. “Why Financial Literacy is So Important.” n.p. Web.