- f' ) ) An Analysis of Turbidity and Phytoplankton in Selected Stream Basins of the Lake Macatawa Watershed Adriana C. Crain Ronald A. Haveman Kimberly L. Lake Jeanine M. Roberts Departments of Biology, Chemistry, and Geological and Environmental Sciences Hope College, Holland, Michigan 49423 Abstract. To explore how stream turbidity is affected by weather, land use, and soil type, we examined the turbidities of twelve streams with varying basin land uses and soil types in the Lake Macatawa Watershed, Ottawa and Allegan Counties, Michigan. Streams were sampled during different weather conditions during the months- of October and November, 1997. Correlations were made between turbidity and the three factors of focus. We found that turbidity was higher during wet-weather events, in agricultural areas, and in loamy soils. The land use and soil type at the sample location was more influential on stream turbidity levels than the basin land uses and soil types. Phytoplankton from two selected stream sites were examined. Based on the relative amounts of blue-green algae present, we found that the streams were not experiencing eutrophication during the sampling period. INTRODUCTION Turbidity, a measurement of the clarity of water, is an important factor of water quality. The suspended solids in a water body are measured as turbidity in Nephelometric Turbidity Units (NTU). Increased levels of turbidity add silt to stream bed habitats, thus making them unsuitable for bottom-dwelling organisms. Reduced light penetration through the water is caused by high turbidity levels limiting the growth of aquatic plants. Several types of pollutants adhere to suspended solids; therefore, an increase in turbidity can increase levels of pollution (Waterwatch Victoria Manual 1997).
Transcript
- f'
)
)
An Analysis of Turbidity and Phytoplankton in Selected Stream Basins of the Lake Macatawa Watershed
Adriana C. Crain Ronald A. Haveman
Kimberly L. Lake Jeanine M. Roberts
Departments of Biology, Chemistry, and Geological and Environmental Sciences Hope College, Holland, Michigan 49423
Abstract. To explore how stream turbidity is affected by weather, land use, and soil type, we examined the turbidities of twelve streams with varying basin land uses and soil types in the Lake Macatawa Watershed, Ottawa and Allegan Counties, Michigan. Streams were sampled during different weather conditions during the months- of October and November, 1997. Correlations were made between turbidity and the three factors of focus. We found that turbidity was higher during wet-weather events, in agricultural areas, and in loamy soils. The land use and soil type at the sample location was more influential on stream turbidity levels than the basin land uses and soil types. Phytoplankton from two selected stream sites were examined. Based on the relative amounts of blue-green algae present, we found that the streams were not experiencing eutrophication during the sampling period.
INTRODUCTION
Turbidity, a measurement of the clarity of water, is an important factor of water
quality. The suspended solids in a water body are measured as turbidity in
Nephelometric Turbidity Units (NTU). Increased levels of turbidity add silt to stream
bed habitats, thus making them unsuitable for bottom-dwelling organisms. Reduced light
penetration through the water is caused by high turbidity levels limiting the growth of
aquatic plants. Several types of pollutants adhere to suspended solids; therefore, an
increase in turbidity can increase levels of pollution (Waterwatch Victoria Manual 1997).
If water is more than 1 NTU, pathogenic organisms can survive the disinfection process
of water treatment and can contaminate drinking water. There is also a recommendation
of less than 5 NTU for primary contact in water for recreational purposes (Michigan
Public Health Statutes 1996).
Turbidity levels can be affected by both natural and anthropogenic activities and
land features. This study focuses on weather conditions, land use practices, and soil types
of the area. Precipitation can greatly increase the amounts of suspended solids in a
stream or body of water (Blaker et. al 1990). Agricultural areas can cause added runoff of
sediment because of large amounts of exposed soil created from fanning practices,
whereas urban areas cause increases in water runoff due to extensive cement coverage
(Collins et. al 1996). Because natural areas are dominated by vegetation, soils are held in
place by root structures and are less likely to be carried away by runoff (Waterwatch
Victoria Manual 1997). Aquatic life is also impacted by anthropogenic activities
Phytoplankton can serve as indicators of water quality. Chemical conditions play
a major part in determining the amount of plankton. The species composition is often
used not only to classify the water as polluted or not, but also to suggest the quantities of
various nutrients, such as nitrogen and phosphorous. Studies have shown that elevated
populations of blue-green algae is an indicator of an increase in nutrients (prescott 1970).
The natural or artificial addition of nutrients and its effects are known as eutrophication.
This process is caused by runoff from precipitation, agricultural drainage, and
urban/residential development. As levels of phytoplankton increase, less light can filter
through the water, preventing photosynthetic activity and thus altering the trophic levels
and foodweb of aquatic ecosystems (International Symposium of Eutrophication 1969).
• 1
) METHODS
Twelve stream-sampling sites in the watershed that corresponded to the sampling
sites of the Macatawa Area Coordinating Council (MACC) study were selected
(Appendix A). The sites were chosen in order to represent the land uses and soil types
fowld throughout the Lake Macatawa watershed. The streams were sampled two times
during dry weather conditions. These conditions were defined as a time in which there
was no major amount of precipitation for at least seventy-two hours prior to the sampling
time. The dry weather dates on which sampling occurred were October 23, 1997 and
November 22, 1997. The streams were also sampled three times during wet weather
conditions, times in which a significant amount of precipitation fell within twenty-four
hours of the sampling time. The wet weather sampling dates were October 27 and 29,
1997, and November 2, 1997. For each sampling date, all samples were collected within
the same hour. One liter of water was taken from at least one half meter away from the
stream bank and ten to twenty centimeters below the water surface. Samples were
collected and stored in Nalgene bottles.
The water samples were transported to the lab and immediately analyzed for
turbidity with a calibrated turbidity meter. The precision of the machine was determined
by running samples of different turbidities multiple times. To determine the turbidity of
the stream at a sampling site, three separate samples of water from that site were analyzed
with the turbidity meter. The average of these three readings was calculated and used as
the uncorrected turbidity for that site. The actual turbidity was determined using a
calibration curve of known turbidities for the machine which was prepared from standard
silicon dioxide solutions. This process was repeated for each site and each sample date.
) The basin of each stream that was sampled during this study was determined
using 7.S minute series topographic maps of the area. Basin boundaries were determined
by following the topographic highs upstream from the sample site which encompassed all
upstream tributaries. The basin boundaries were traced onto paper, along with the stream,
its tributaries, and the township section lines.
The land use of each basin was divided into agriculture, natural, or
urban/residential using aerial photographs of the area taken III 1994.. An area was
considered to be agriculture if it was used for farming practices. A natural area was one
considered to be forested and undeveloped. An area was characterized as
urban/residential if it had close-proximity housing or commercial developments. The
section lines and tributaries were used as reference points in transposing the areas of
different land uses from the aerial photographs onto the basin drawings (Appendix B).
The area of each basin as well as the areas of each type of land use within each basin
were determined with the use of a digitized analyzer (Appendix C). From this, the
percent of each land use in each basin was calculated.
The soil types within each of the twelve basins were determined with the use of
soil surveys of Ottawa and Allegan Counties, and a surficial geology map of Allegan
County (Pregitzer 1972, Knapp 1987, Gephart and Larson 1982). There were three main
soil types within the Lake Macatawa watershed: sandy, loamy, and organic. The sandy
soils in Ottawa County consisted of the Rubicon-Blown-out land-Deer Park, Rubicon
Grandby, Crosewell-Au Gres, and Grandby-Au Gres-Saugatuck associations. Oakville
and Morocco-Newton-Oakville associations made up the sandy soils in Allegan County.
The loamy soils in Ottawa County consisted of the following soil associations: Blount-
Morley-Kibbey and Kawkawlin and Nester-Kawkawlin-Sims. The Capac-Rimer
Pipestone association made up the loamy soils in Allegan County. The organic-rich soils
consisted of the Sloan-Adrian-Houghton association in Ottawa County.
Using roads on the soil survey map as references, each soil type was traced onto
the basin boundary drawings (Appendix D). The area of each soil type within each basin
was determined with a digitized analyzer (Appendix E). From this data, the percent of
each soil type in each basin was calculated.
The immediate land use and soil type of each sampling site was determined. This
was done by examining the basin land use drawings. The land use within tfie first half
mile upstream from the site, and including the site, was characterized as the immediate
land use ofthat site.
Sites 4 and 16 were selected for the determination of phytoplankton composition
and abundance. These sites were sampled on November 8 and 9, 1997. A two gallon
bucket was used to filter sixteen gallons of stream water through a No. 20 phytoplankton
net. The filtered organisms were collected in a 30 ml collection vial, taken back to the
lab, and preserved with 30 ml of3% phosphate buffered formalin, creating a 1:1 sample
preservative solution. At a later date, the samples were centrifuged for ten minutes. The
supernate was drawn off in order to concentrate the organisms to approximately 5 ml.
The organisms were resuspended to obtain an even distribution. Five slides were
prepared from the concentrated solutions from each date and site. The organisms were
covered with plastic cover slips. At a magnification of 450x, two transects per slide were
randomly chosen, and the organisms within each transect were classified and counted.
The three classifications of focus were three main phyla: green algae, blue-green algae,
and diatoms/yellow-green algae.
RESULTS AND DISCUSSION
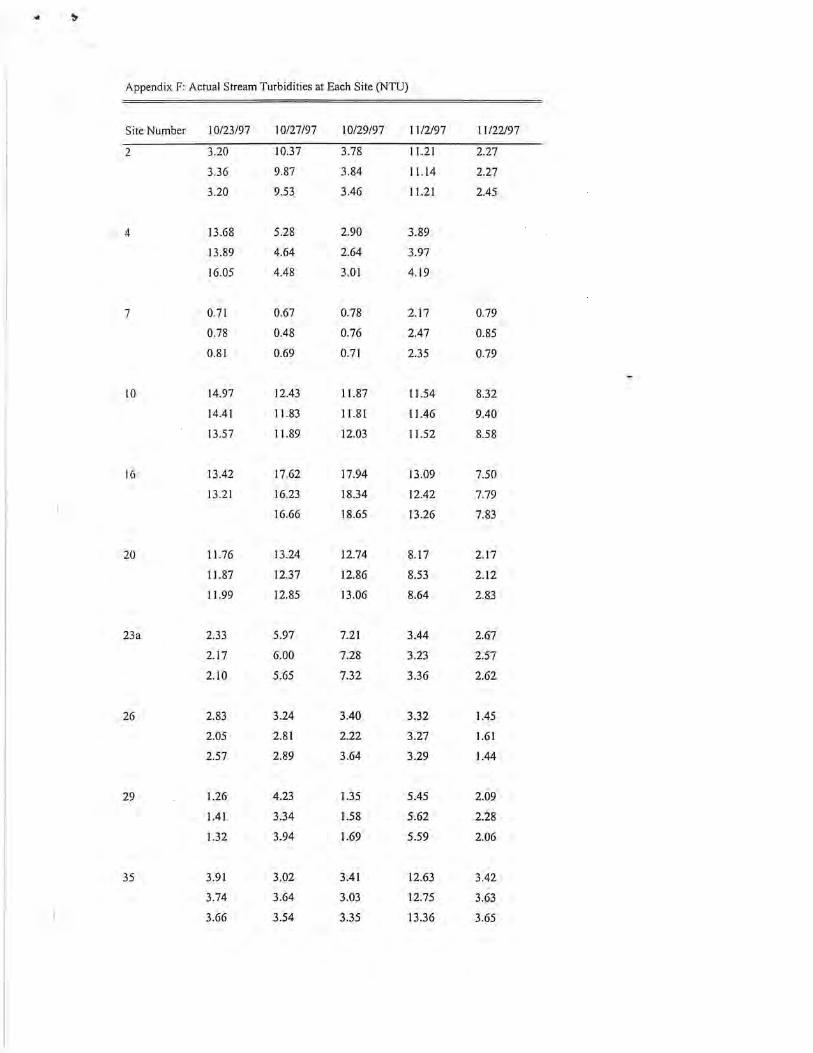
The average turbidities of the wet-weather and dry-weather sampling dates for
each of the twelve sites were determined (figure 1). These averages were calculated from
the turbidities of each site for each sample date (Appendix F). An all-sites average of wet-
weather turbidity and dry-weather turbidity were calculated from the average wet and dry
turbidities of the individual sites. This difference was found to be significant (F-ratio =
Figure 6. The percent loamy soil within each stream basin compared to turbidity.
The results of this analysis revealed a weak trend between turbidity and basin soil type.
The higher the percent of loamy soil in a basin, the higher the stream turbidity was.
There were a few exceptions to this trend. Some basins that were predominantly loam
had relatively low stream turbidities. Two ofthe sites that were exceptions to this trend
were also exceptions to the trend relating basin agricultural uses to turbidity in that they
both had lower turbidities than were predicted by the trends. These exceptions were sites
4 and 7 (figures 3 and 6).
The immediate soil type of each sample site was determined (table 2).
TABLE 2. IMMEDIATE SOIL TYPE CLASSIFICA nONS FOR EACH SITE:"
Site Number Immediate Soil Type 2 Sand 4 Sand 7 Sand 10 Loam 16 Loam 20 Loam 23a Sand 26 Sand 29 Sand 35 Sand 39 Loam 42 Loam
Sandy and loamy soils were both represented in the immediate soil types of the sampling
sites.
The stream turbidities of the sites which had the same immediate soil type were
averaged in order to compare the effects of immediate soil type on turbidity (figure 7).
The average wet- and dry-weather turbidities for each site were used in this calculation.
When compared, the difference in turbidity between the two soil types was statistically
significant (F-ratio = 29.32, df= 1, P < 0.05).
15.00 :;-I-~ 10.00 Z. :a :c 5.00 ... :J I-
0.00 +----Sand Loam
Immediate Soil Type
Figure 7. A comparison of turbidity to immediate soil type.
The average stream turbidity for sites with immediate loamy soil was 10.92 NTU. The
average stream turbidity for sites with immediate sandy soil was 3.82 NTU. From the . -
results of this analysis and the results of the basin soil type/turbidity trend (figure 6), it
was determined that turbidity is increased in loamy soil areas compared to sandy soil
areas.
The numbers of green algae, blue-green algae, and diatoms/yellow-green algae in
eleven liters of the collected stream samples from sites 4 and 16 were counted (figure 8) .
.... .... ... Ql C. 2000 (I)
(ij 1500 :J
'0
:~ ~ 1000 "'C:t:: ..5...J - 500 0 ... Ql 0 .c E :J z
4 16
Site Number
mDiatoms and YellowGreen
o Blue-Green
• Green
Figure 8. Abundance of each phytoplankton type at sites 4 and 16.
In the site 4 samples, 50 green algae, 49 blue-green algae, and 438 diatoms and yellow-
green algae were found. In the site 16 samples, 124 green algae, 104 blue-green algae,
and 1,313 diatoms and yellow-green algae were found. Approximately three times as
many organisms were found in the site 16 samples than in the site 4 samples.
The relative amounts of each type of phytoplankton were determined (figure 9).
~
::!e 0 - 100 CIl 0 c: 75 ClI
"C c: :l 50 .0 ~ CIl 25 .~ iti 0 Qi c:: 4
Site Number
16
lEI Diatoms and Yellow-Green
o Blue-Green
. Green
Figure 9. Relative abundance of phytoplankton at sites 4 and 16.
The site 4 samples consisted of 9% green algae, 9% blue-green algae, and 82% diatoms
and yellow-green algae. The site 16 samples consisted of 8% green algae, 7% blue-green
algae, and 85% diatoms and yellow-green algae. These relative amounts were nearly
equivalent between the two sample sites. The low amounts of blue-green algae is not
indicative of eutrophication (International Symposium of Eutrophication 1967).
CONCLUSIONS
Turbidity is affected by weather conditions, land use, and soil types found in a
stream basin. Turbidity is higher during wet-weather events than during dry-weather
events. Turbidity is higher in areas with agricultural land use practices than in natural or
urban areas. Turbidity is also higher in areas composed of loamy soils than in areas
composed of sandy soils. The immediate land use and immediate soil type of a stream
affect the turbidity more strongly than basin land use and basin soil type.
· ..
)
ACKNOWLEDGMENTS
We thank Drs. Edward Hansen, K. Greg Murray, Graham Peaslee, and Jon
Peterson of the Environmental Science Program of Hope College, the Macatawa Area
Coordinating Council and the Allegan and Ottawa County Township Offices for their
assistance, Dr. Cronkite of Hope College, and the Hope College Departments of Biology,
Chemistry, and Geological and Environmental Sciences.
REFERENCES CITED
Blaker, I. A.; Digemes, I.; Seip, H. M. 1990. Precipitation and streamwater chemistry at an alpine catchment in central Norway. Cambridge University Press.
Collins, R. and Jenkins, A. 1996. The impact of agricultural land use on stream chemistry in the Middle Hills of the Himalayas, Nepal. Journal of Hydrology 185: 71-86.
Gephart,G.D. and Larson, G. 1982. Surficial Geology of Allegan County. Michigan State University.
International Symposium on Eutrophication. 1969. Eutrophication: causes, consequences, correctives; proceedings of a symposium. Washington, National Academy of Sciences.
Knapp, B.D. 1987. Soil Survey of Allegan County, Michigan. U.S.D.A.: Soil Conservation Service in cooperation with Michigan Agricultural Experiment Station.
Michigan Public Health Statutes. 1996. Sanitation Safe Drinking Water Act. MSA Sec. 14.427 (llc) and MCL Sec. 325.101lc.
Pregitzer, K. E. 1972. Soil Survey of Ottawa County, Michigan. U.S.D.A.: Soil Conservation Service in cooperation with Michigan Agricultural Experiment Station.
Prescott, G. W. 1970. How to know the freshwater algae. W. C. Brown Co. Dubuque, Iowa.
Waterwatch Victoria Manual. 1997. "Turbidity (Suspended Solids)." [Online] Available http://www.vic.waterwatch.org.auimanualisec4d.htm. Document received: 9/6/97.