Page 1
The Henderson Repository is a free resource of the HonorSociety of Nursing, Sigma Theta Tau International. It isdedicated to the dissemination of nursing research, research-related, and evidence-based nursing materials. Take credit for allyour work, not just books and journal articles. To learn more,visit www.nursingrepository.org
Item type Presentation
Format Text-based Document
Title An Approach to Data Management and Evaluation forEvidence-Based Practice Projects
Authors Sylvia, Martha; Terhaar, Mary
Downloaded 22-May-2018 10:48:49
Link to item http://hdl.handle.net/10755/243289
Page 2
An Approach to Data
Management and Evaluation for
Evidence-Based Practice
Projects
Martha Sylvia, PhD, MBA, RN
Mary Terhaar, DNSc, RN
1
STTI 23rd International Nursing Research Congress, Brisbane Australia, August 2012
Page 3
Objectives
Within the context of the Doctorate of
Nursing Practice:
To describe effective approaches for
managing and analyzing data for evidence-
based projects
To improve the quality of clinical data
management for evidence-based projects.
2
Page 4
“The focus for (DNP) faculty and students should be on the translation of evidence to improve
the quality of care and patient outcomes” (AACN, 2006)
Demonstrating “improvement” implies an understanding of:
How to define improvement
How to measure improvement
How to analyze data for improvement
How to demonstrate improvement
3
Page 5
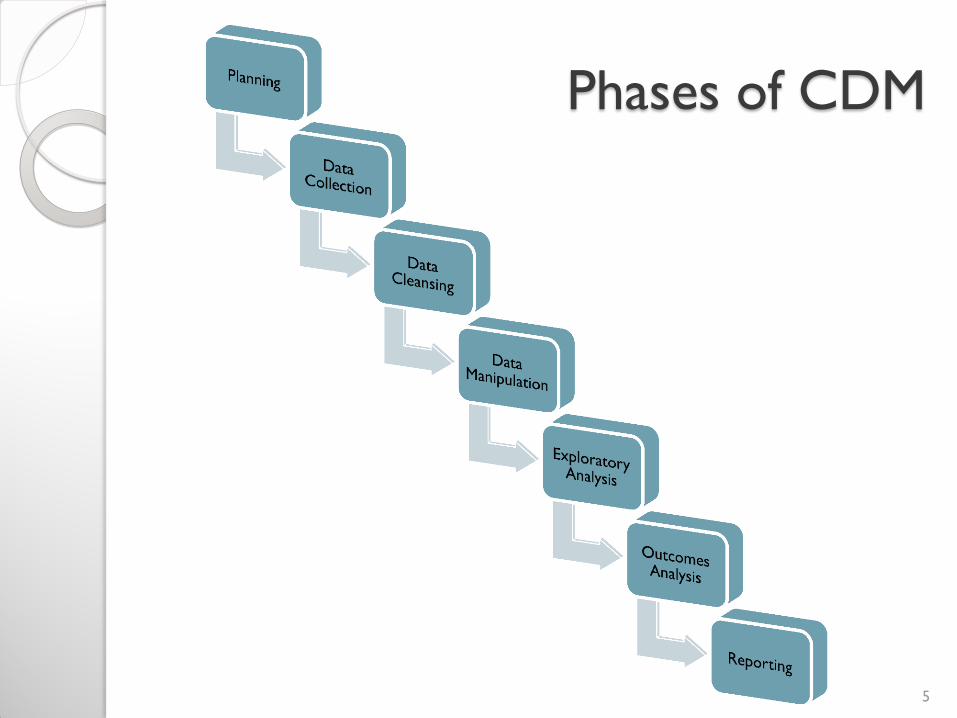
Clinical Data Management (CDM)
Our Definition:
“ The process of planning, designing, collecting, cleansing, manipulating,
analyzing, and reporting data generated in the assessment,
development, delivery, and evaluation of health-related interventions,
products, and services.”
4
Page 7
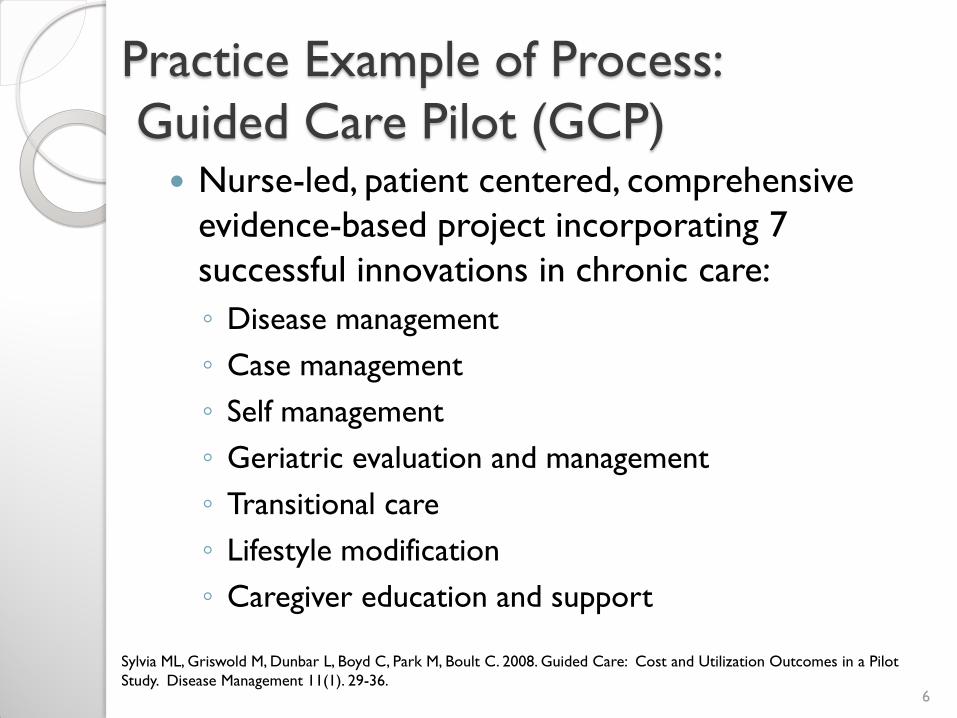
Practice Example of Process:
Guided Care Pilot (GCP) Nurse-led, patient centered, comprehensive
evidence-based project incorporating 7
successful innovations in chronic care:
◦ Disease management
◦ Case management
◦ Self management
◦ Geriatric evaluation and management
◦ Transitional care
◦ Lifestyle modification
◦ Caregiver education and support
6
Sylvia ML, Griswold M, Dunbar L, Boyd C, Park M, Boult C. 2008. Guided Care: Cost and Utilization Outcomes in a Pilot
Study. Disease Management 11(1). 29-36.
Page 8
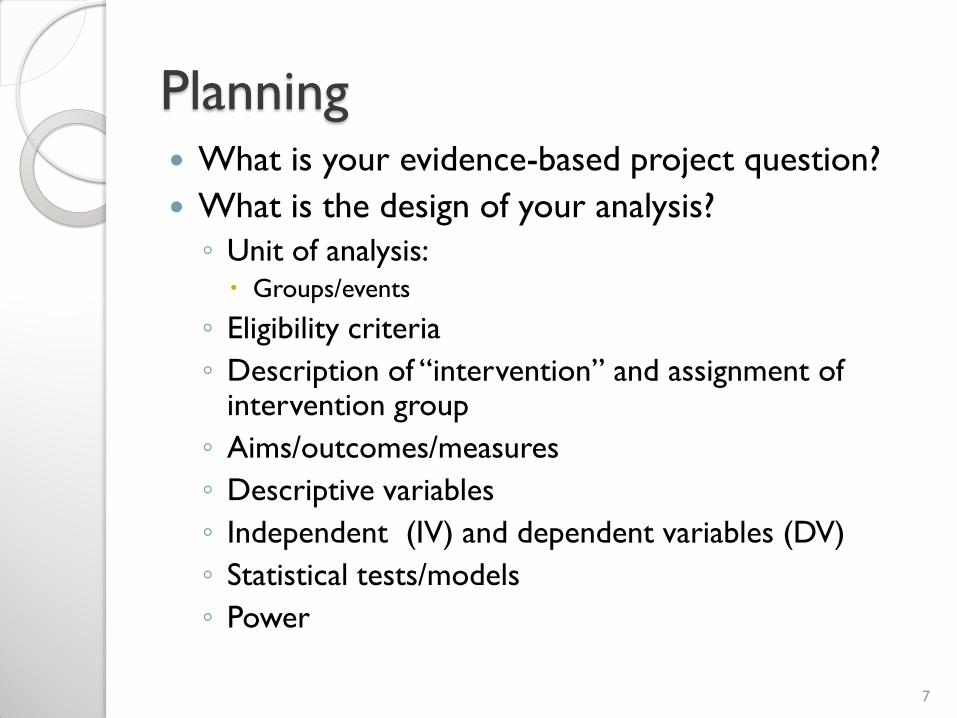
Planning What is your evidence-based project question?
What is the design of your analysis?
◦ Unit of analysis: Groups/events
◦ Eligibility criteria
◦ Description of “intervention” and assignment of intervention group
◦ Aims/outcomes/measures
◦ Descriptive variables
◦ Independent (IV) and dependent variables (DV)
◦ Statistical tests/models
◦ Power
7
Page 9
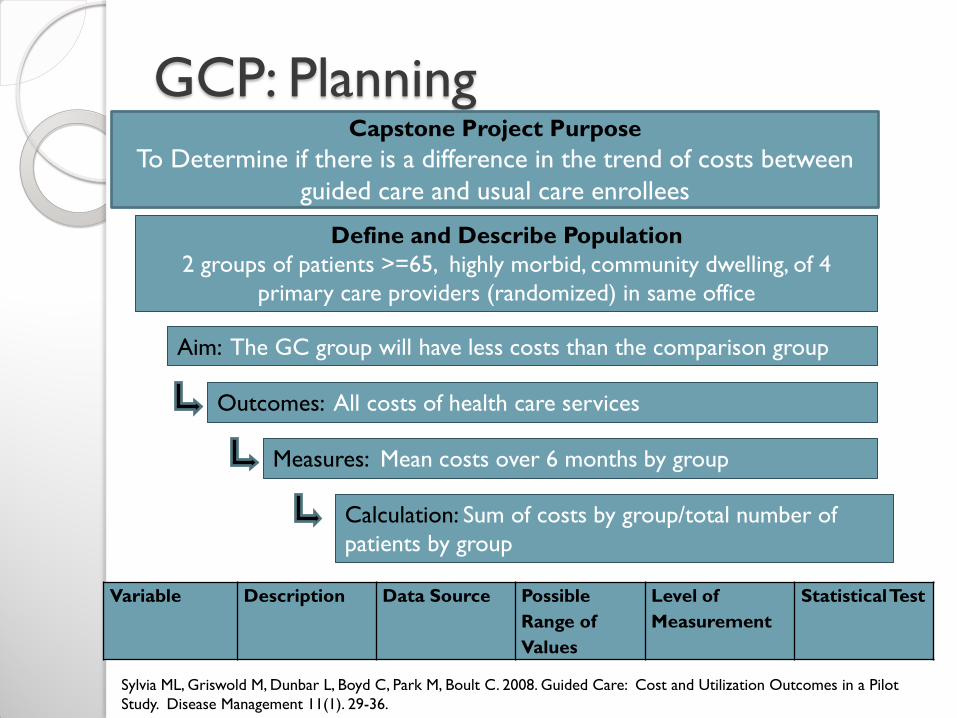
GCP: Planning
8
Aim: The GC group will have less costs than the comparison group
Outcomes: All costs of health care services
Measures: Mean costs over 6 months by group
Calculation: Sum of costs by group/total number of
patients by group
Capstone Project Purpose
To Determine if there is a difference in the trend of costs between
guided care and usual care enrollees
Define and Describe Population
2 groups of patients >=65, highly morbid, community dwelling, of 4
primary care providers (randomized) in same office
Variable Description Data Source Possible
Range of
Values
Level of
Measurement
Statistical Test
Sylvia ML, Griswold M, Dunbar L, Boyd C, Park M, Boult C. 2008. Guided Care: Cost and Utilization Outcomes in a Pilot
Study. Disease Management 11(1). 29-36.
Page 10
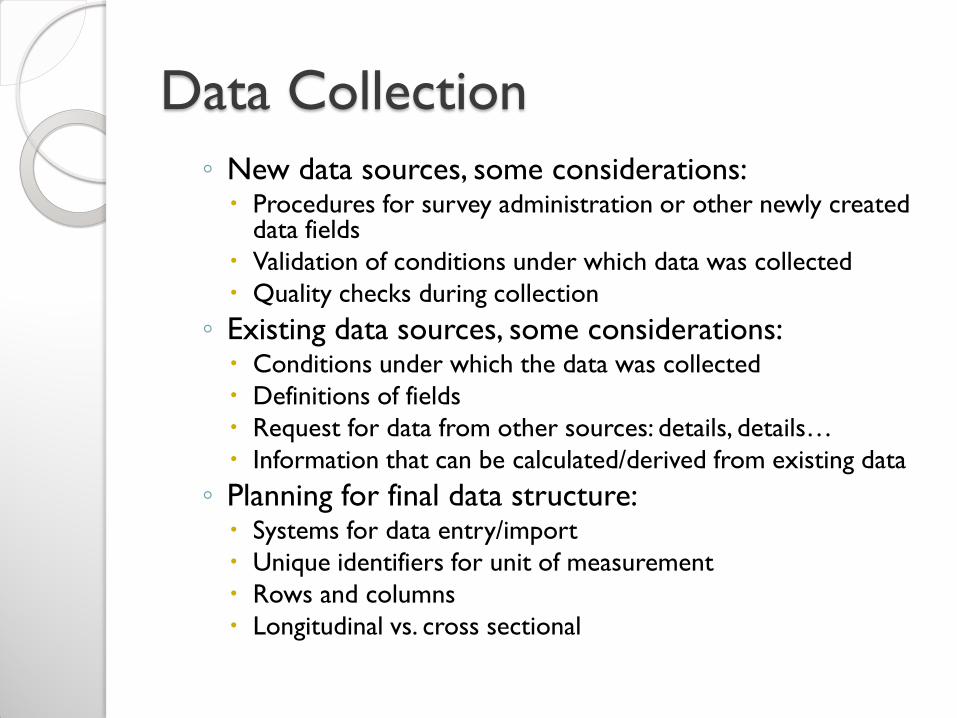
Data Collection
◦ New data sources, some considerations: Procedures for survey administration or other newly created
data fields
Validation of conditions under which data was collected
Quality checks during collection
◦ Existing data sources, some considerations: Conditions under which the data was collected
Definitions of fields
Request for data from other sources: details, details…
Information that can be calculated/derived from existing data
◦ Planning for final data structure: Systems for data entry/import
Unique identifiers for unit of measurement
Rows and columns
Longitudinal vs. cross sectional
Page 11
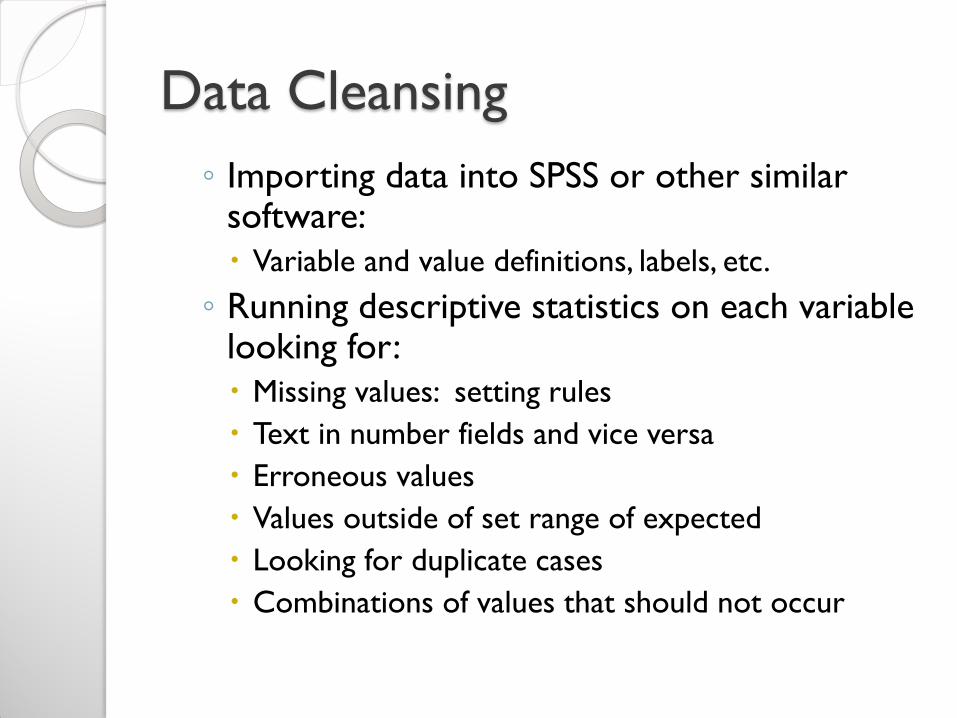
Data Cleansing
◦ Importing data into SPSS or other similar software:
Variable and value definitions, labels, etc.
◦ Running descriptive statistics on each variable looking for:
Missing values: setting rules
Text in number fields and vice versa
Erroneous values
Values outside of set range of expected
Looking for duplicate cases
Combinations of values that should not occur
Page 12
Data Manipulation
◦ Creating final analysis data set
Merging/aggregating files
File restructuring
Transposing, cases to variables and vice versa
Transforming values
Calculating new values using functions
Recoding values
Banding values
Manipulating character values
Date and time values
Creating a data dictionary
Page 13
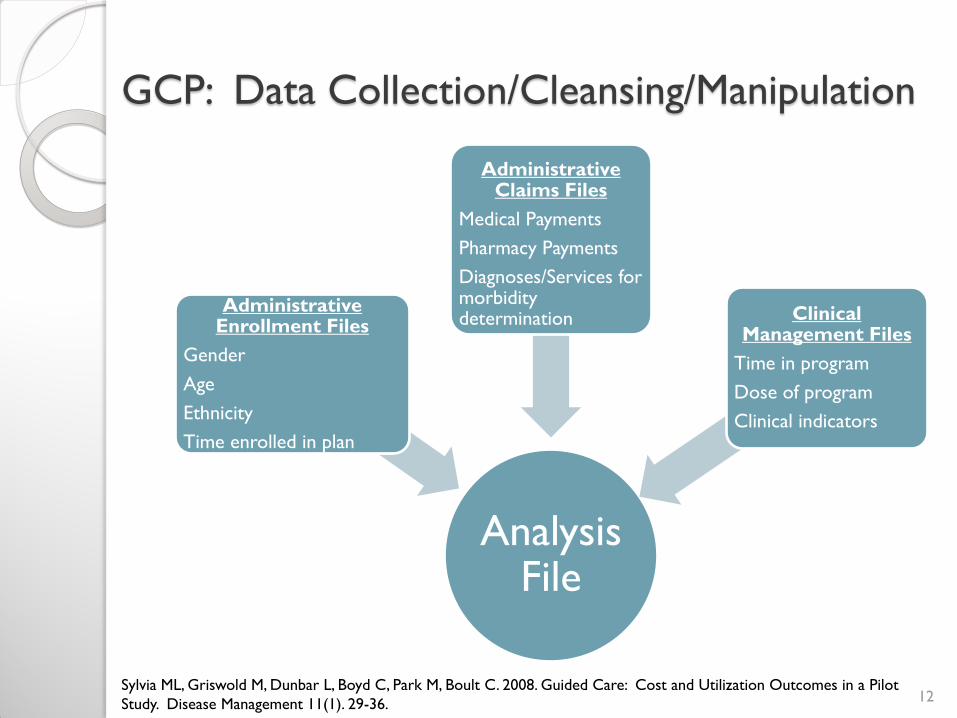
GCP: Data Collection/Cleansing/Manipulation
Analysis File
Administrative Enrollment Files
Gender
Age
Ethnicity
Time enrolled in plan
Administrative Claims Files
Medical Payments
Pharmacy Payments
Diagnoses/Services for morbidity determination
Clinical Management Files
Time in program
Dose of program
Clinical indicators
12 Sylvia ML, Griswold M, Dunbar L, Boyd C, Park M, Boult C. 2008. Guided Care: Cost and Utilization Outcomes in a Pilot
Study. Disease Management 11(1). 29-36.
Page 14
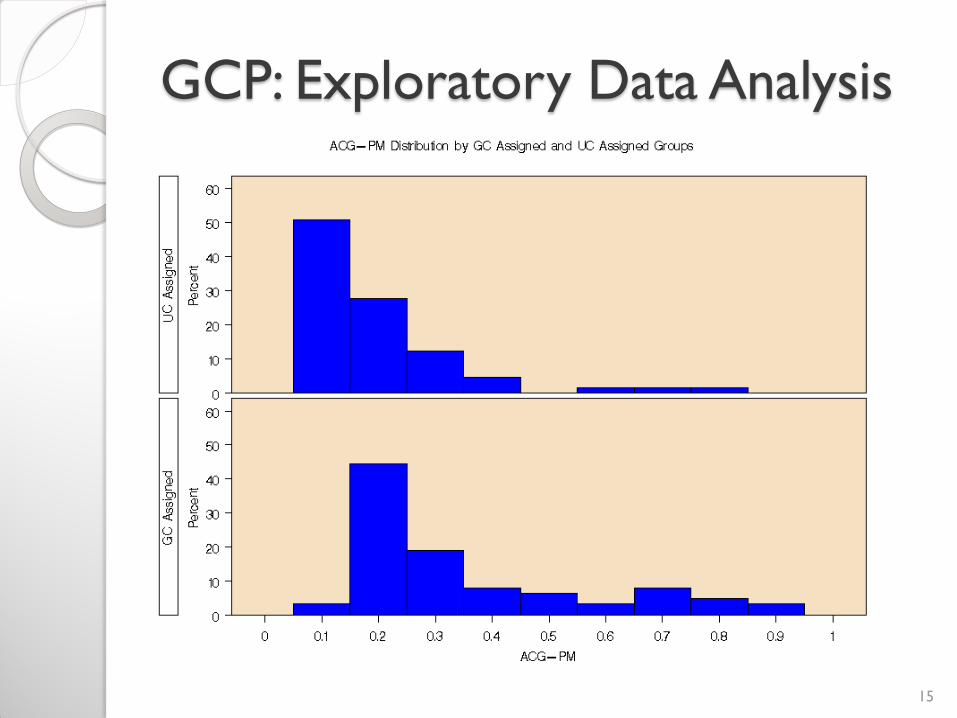
Exploratory Data Analysis
Explore and describe distribution of
independent and dependent variables
Describe groups/events
Explore differences in “other factors”
between groups/events
Determine confounding of relationship
between independent and dependent
variables
Page 15
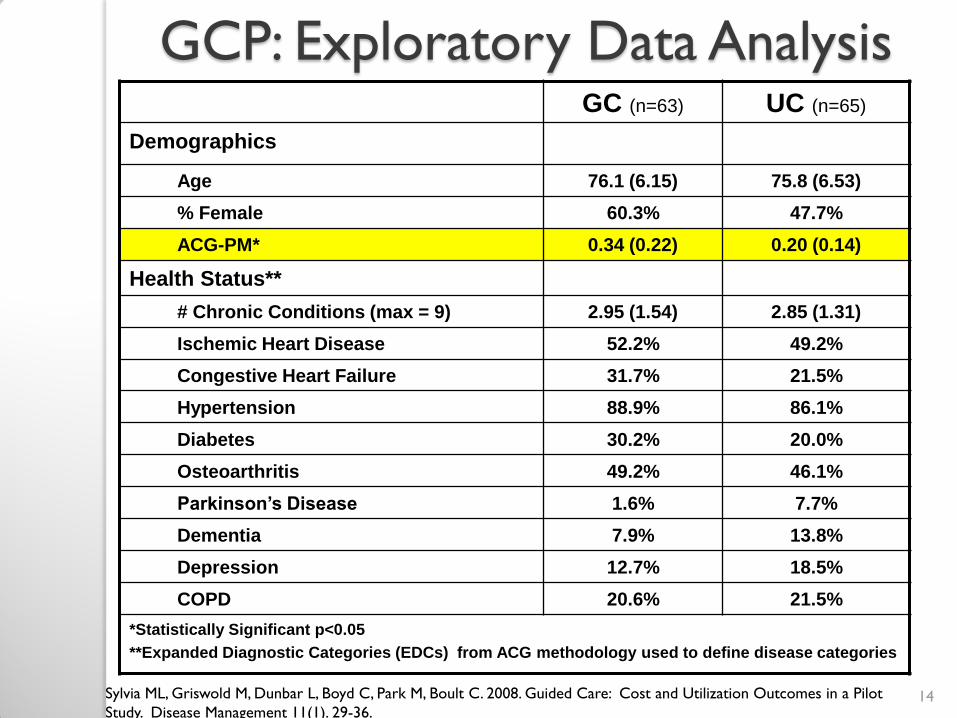
14
GC (n=63) UC (n=65)
Demographics
Age 76.1 (6.15) 75.8 (6.53)
% Female 60.3% 47.7%
ACG-PM* 0.34 (0.22) 0.20 (0.14)
Health Status**
# Chronic Conditions (max = 9) 2.95 (1.54) 2.85 (1.31)
Ischemic Heart Disease 52.2% 49.2%
Congestive Heart Failure 31.7% 21.5%
Hypertension 88.9% 86.1%
Diabetes 30.2% 20.0%
Osteoarthritis 49.2% 46.1%
Parkinson’s Disease 1.6% 7.7%
Dementia 7.9% 13.8%
Depression 12.7% 18.5%
COPD 20.6% 21.5%
*Statistically Significant p<0.05
**Expanded Diagnostic Categories (EDCs) from ACG methodology used to define disease categories
GCP: Exploratory Data Analysis
Sylvia ML, Griswold M, Dunbar L, Boyd C, Park M, Boult C. 2008. Guided Care: Cost and Utilization Outcomes in a Pilot
Study. Disease Management 11(1). 29-36.
Page 16
GCP: Exploratory Data Analysis
15
Page 17
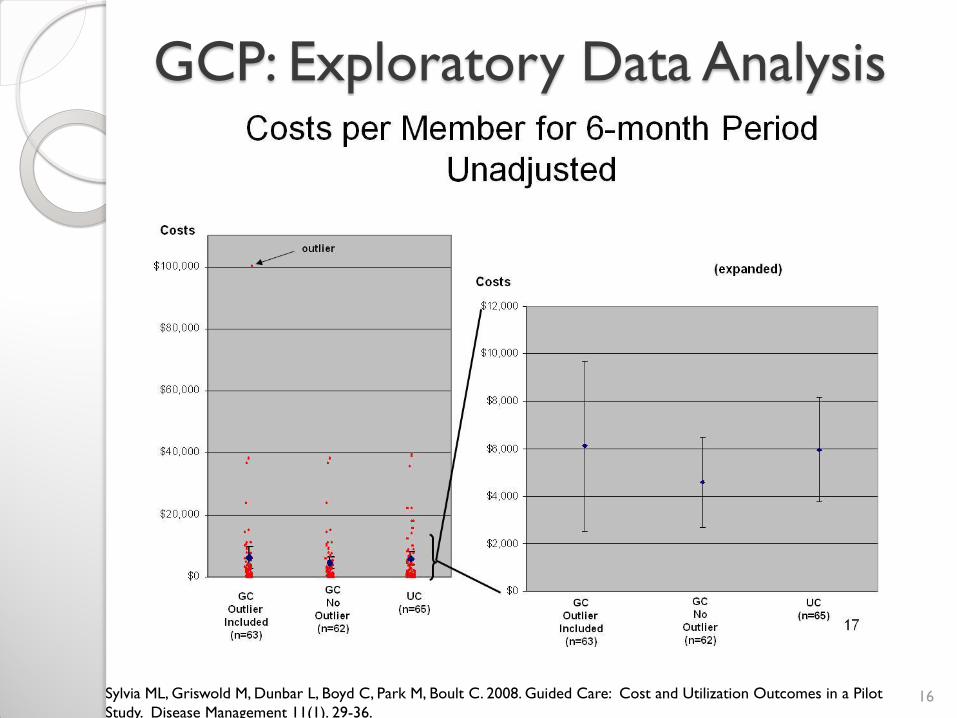
GCP: Exploratory Data Analysis
16 Sylvia ML, Griswold M, Dunbar L, Boyd C, Park M, Boult C. 2008. Guided Care: Cost and Utilization Outcomes in a Pilot
Study. Disease Management 11(1). 29-36.
Page 18
GCP: Exploratory Data Analysis
17 Sylvia ML, Griswold M, Dunbar L, Boyd C, Park M, Boult C. 2008. Guided Care: Cost and Utilization Outcomes in a Pilot
Study. Disease Management 11(1). 29-36.
Page 19
Outcomes Data Analysis
Final determination of statistical
tests/models
Statistical testing of outcomes measures
Statistical testing of outcomes measures
adjusting for confounding
Page 20
Reporting and Presentation
Relevance and importance to
stakeholders
◦ Common methods used to display certain
representations of data
Tables, graph types, flow charts, etc.
◦ Summarizing:
Tables, graphs, diagrams
Written and oral presentation of findings
Page 21
GCP Outcomes Data Analysis and
Reporting
20
GC vs UC: Costs at ACG-PM Cut Points
Adjusted for Age, Gender
$0
$2,000
$4,000
$6,000
$8,000
$10,000
$12,000
$14,000
$16,000
$18,000
$20,000
0.00 0.10 0.20 0.30 0.40 0.50 0.60 0.70
ACG-PM score
Insu
ran
ce E
xp
en
dit
ure
s
Usual Care (n=65)
Guided Care (n=62)
Sylvia ML, Griswold M, Dunbar L, Boyd C, Park M, Boult C. 2008. Guided Care: Cost and Utilization Outcomes in a Pilot
Study. Disease Management 11(1). 29-36.
Page 22
Summary
Scholarly DNP projects using evidence-
based practice frameworks require strong
data management skills for management
and evaluation
This clinical data management process
provides a methodical and rigorous
approach to meet this challenge
21
Page 24
Contact Information Martha Sylvia, PhD, MBA, RN
Assistant Professor
Johns Hopkins University School of Nursing
525 N. Wolfe St. Room 456
Baltimore, MD 21205-2110
443-287-8529
[email protected]
23