39
An Assessment of the Commercial Availability of Carbon Dioxide Capture and Storage Technologies as of June 2009 JJ Dooley CL Davidson RT Dahowski June 2009 1
An Assessment of the Commercial Availability of Carbon Dioxide Capture and Storage Technologies as of June 2009 JJ Dooley CL Davidson RT Dahowski June 2009
1


DISCLAIMER
This report was prepared as an account of work sponsored by an agency of the United States Government. Neither the United States Government nor any agency thereof, nor Battelle Memorial Institute, nor any of their employees, makes any warranty, express or implied, or assumes any legal liability or responsibility for the accuracy, completeness, or usefulness of any information, apparatus, product, or process disclosed, or represents that its use would not infringe privately owned rights. Reference herein to any specific commercial product, process, or service by trade name, trademark, manufacturer, or otherwise does not necessarily constitute or imply its endorsement, recommendation, or favoring by the United States Government or any agency thereof, or Battelle Memorial Institute. The views and opinions of authors expressed herein do not necessarily state or reflect those of the United States Government or any agency thereof.
PACIFIC NORTHWEST NATIONAL LABORATORY operated by BATTELLE
for the UNITED STATES DEPARTMENT OF ENERGY
under Contract DE-AC05-76RL01830
Printed in the United States of America
Available to DOE and DOE contractors from the Office of Scientific and Technical Information,
P.O. Box 62, Oak Ridge, TN 37831-0062; ph: (865) 576-8401 fax: (865) 576-5728
email: [email protected]
Available to the public from the National Technical Information Service, U.S. Department of Commerce, 5285 Port Royal Rd., Springfield, VA 22161
ph: (800) 553-6847 fax: (703) 605-6900
email: [email protected] online ordering: http://www.ntis.gov/ordering.htm
1

Abstract: Currently, there is considerable confusion within parts of the carbon dioxide capture and storage (CCS) technical and regulatory communities regarding the maturity and commercial readiness of the technologies needed to capture, transport, inject, monitor and verify the efficacy of carbon dioxide (CO2) storage in deep, geologic formations. The purpose of this technical report is to address this confusion by discussing the state of CCS technological readiness in terms of existing commercial deployments of CO2 capture systems, CO2 transportation pipelines, CO2 injection systems and measurement, monitoring and verification (MMV) systems for CO2 injected into deep geologic structures. To date, CO2 has been captured from both natural gas and coal fired commercial power generating facilities, gasification facilities and other industrial processes. Transportation via pipelines and injection of CO2 into the deep subsurface are well established commercial practices with more than 35 years of industrial experience. There are also a wide variety of MMV technologies that have been employed to understand the fate of CO2 injected into the deep subsurface. The four existing end-to-end commercial CCS projects – Sleipner, Snøhvit, In Salah and Weyburn – are using a broad range of these technologies, and prove that, at a high level, geologic CO2 storage technologies are mature and capable of deploying at commercial scales. Whether wide scale deployment of CCS is currently or will soon be a cost-effective means of reducing greenhouse gas emissions is largely a function of climate policies which have yet to be enacted and the public’s willingness to incur costs to avoid dangerous anthropogenic interference with the Earth’s climate. There are significant benefits to be had by continuing to improve through research, development, and demonstration suite of existing CCS technologies. Nonetheless, it is clear that most of the core technologies required to address capture, transport, injection, monitoring, management and verification for most large CO2 source types and in most CO2 storage formation types, exist. Key Words: carbon dioxide capture and storage; technological readiness; climate change; CO2 pipelines; measurement, monitoring and verification.
2

Table of Contents
1.0 Summary ..................................................................................................................................... 1
2.0 Introduction: The Role of CCS in Addressing Climate Change ................................................. 4
3.0 Overview of Four Operational Commercial CCS Facilities ....................................................... 5
3.1 Sleipner West Field (250km off the Norwegian coast in the North Sea) ........................... 5 3.2 Great Plains Synfuels Plant (Beulah, North Dakota) and the Weyburn Enhanced Oil
Recovery Project (Weyburn, Saskatchewan, Canada) ....................................................... 6 3.3 In Salah Natural Gas Production Facility (Central Saharan Region, Algeria) ................... 7 3.4 Snøhvit LNG Project (located in the Barents Sea 150 km off the northern coast of
Norway) .............................................................................................................................. 7
4.0 CO2 Capture, Compression, Dehydration, and Handling Technologies ..................................... 8
4.1 Post Combustion CO2 Capture from Pulverized Coal-fired Electric Power Plants ........... 8 4.2 CO2 Capture from Coal Gasification .................................................................................. 9 4.3 CO2 Capture from Oxygen-fired Coal Combustion ........................................................... 9 4.4 Post-Combustion CO2 Capture from Natural Gas-fired Facilities ................................... 10 4.5 CO2 Capture from Natural Gas Reforming ...................................................................... 10 4.6 CO2 Capture from Natural Gas Production ...................................................................... 11
5.0 CO2 Transportation Technologies ............................................................................................ 14
6.0 CO2 Injection Technologies ...................................................................................................... 15
3

4
7.0 CO2 Measurement, Monitoring and Verification Technologies ............................................... 17
7.1 CO2SINK – ....................................................................................................................... 20 7.2 In Salah – .......................................................................................................................... 20 7.3 Nagaoka – ......................................................................................................................... 20 7.4 Sleipner – ......................................................................................................................... 21 7.5 Snøhvit – .......................................................................................................................... 21 7.6 Weyburn – ........................................................................................................................ 21 7.7 Frio – ................................................................................................................................ 21
Appendix A: References ............................................................................................................................. 24 Appendix B: Online Resources Tracking CCS Demonstration Projects and Planned Commercial CCS Facilities ...................................................................................................................................................... 29 Appendix C: Overview of Principal CO2 Capture System Configurations that Could Be Applied to Large Commercial Power Plants ........................................................................................................................... 30 Appendix D: Brief Summary of Commercially Available Absorption-based CO2 Capture Systems ........ 31 Appendix E: CO2 Purity Specifications for Various Classes of Use .......................................................... 33
1.0 Summary
Carbon dioxide capture and storage (CCS) technologies are commercially available today. Specifically, there exists the following deployment experience with CCS component systems:
• CO2 capture systems that have been mated to coal and natural gas fired electricity plants, coal gasification facilities and various industrial facilities. Some of these CO2 capture systems have been in operation since the late 1970s.
• There are currently more than 3,900 miles of dedicated CO2 pipelines in the United States and
there is more than 35 years of commercial experience associated with transporting large volumes of CO2 via dedicated pipelines. Some of the earliest CO2 pipelines were constructed in the early 1970s and are still in operation today. Available data suggests that these CO2 pipelines have safety records that are on par with or better than the closest industrial analogue which would be large interstate natural gas pipelines.
• More than 35 years of injecting anthropogenic CO2 into the deep subsurface for the purpose of
CO2-driven enhanced oil recovery. There are over 6,000 deep CO2 injection wells currently in operation across parts of 10 states of the U.S. Since 1972, more than 8,800 CO2 injector wells have been used in Texas alone.
• There is a wide variety of measurement, monitoring and verification (MMV) technologies which
have been employed to understand the fate of CO2 injected into the deep subsurface at large commercial CO2 storage facilities.
• There are currently four complete, end-to-end commercial CCS facilities on the planet. Each of
these facilities captures anthropogenic CO2 from a process stream/flue gas that would otherwise be vented to the atmosphere. The captured CO2 is dehydrated, compressed and otherwise prepared for transport via pipeline and/or for injection into nearby suitable deep geologic CO2 storage formations. Each facility injects between 0.7 MtCO2 and 2 MtCO2 into these deep geologic formations annually and then applies a suite of MMV technologies to monitor and verify the fate of the injected CO2. These four sites represent 25 years of cumulative experiential knowledge on safely and effectively storing anthropogenic CO2 in appropriate deep geologic formations.
It is also important to acknowledge that key component technologies of complete CCS systems have been deployed at scales large enough to meaningfully inform discussions about CCS deployment on large commercial fossil-fired power plants, which are almost certainly going to represent the largest market for CCS technologies in a greenhouse gas constrained world. To illustrate this point, the following bullets compare the current state of key CCS component technologies to the scale of deployment needed for a hypothetical 500 MW coal power plant that employed CCS to reduce its CO2 emissions to the atmosphere.
• The largest CO2 capture system commercially delivered to date that would be applicable to electric power production facilities can capture 450 tCO2/day in a single unit. If there were no technological progress beyond this point, the application of this unit to a nominal 500MW coal power plant would require approximately 20 parallel capture units. This would represent a
1

significant capital expenditure and would require significant land at the power plant. However, there is no reason to assume that there will not be technological progress in this regard. Mitsubishi Heavy Industries has stated that they are ready to deliver CO2 capture units that are as large as 3000tCO2/day which would reduce the number of parallel CO2 capture trains required for this hypothetical 500MW coal plant to only three units.
• There are operational CO2 pipelines in the U.S. that routinely transport 10-20 MtCO2 / year
through a single pipeline. A large 500 MW coal fired power plant that was capturing its CO2 would generate approximately 3 MtCO2/year. Thus mankind’s ability to transport large volumes of CO2 over long distances via pipeline at a scale that would be germane to CCS deployment with large power generation facilities has been demonstrated. Not only do these large pipelines exist but the pumps, compressors, valves, automated safety and shut off devices exist that allow for their safe operation are also common technologies available off the shelf today.
• Over the past 35 years approximately 150 MtCO2 has been injected into the Canyon Reef formation at the 90mi2 SACROC unit in Texas for the purpose of stimulating additional oil recovery. This volume of CO2 is roughly equivalent to what a 500 MW coal power plant would produce over a 40 year period. Assuming that the CO2 from this hypothetical 500 MW power plant was injected into a deep saline formation, the foot-print of the injection field would likely be smaller than the 90mi2 of the SACROC unit, and perhaps significantly so. It is important to note that the CO2 injected at SACROC was not monitored in terms of whether the CO2 was being permanently isolated from the atmosphere and most of the CO2 injected into the Canyon Reef was purposefully withdrawn so that it could be reused to stimulate oil production in other areas. Notwithstanding these two important caveats, one can conclude that the knowledge to inject CO2 into the deep subsurface over many decades and over a large area exists.
• For ten years, approximately 1 MtCO2/year as been injected into the Utsira deep saline formation
below the Sleipner CCS facility. The Sleipner project has utilized a MMV program focused on time-lapse seismic surveys, and drawing on core analysis, wireline logging, geochemical monitoring, pressure / temperature / injection rate monitoring, as well as microseismic and gravitational techniques. The data derived from this MMV program is evaluated by national regulators who use these data to determine the environmental efficacy of CCS in terms of climate protection and to determine whether the storage activities are successful in isolating the CO2 from the atmosphere and to hence avoid Norway’s existing carbon tax. Again, if one compares this to activity to a nominal 500MW coal power plant that would generate approximately 3 MtCO2/year the scale of the activity might be multiples of this size not orders of magnitude more complex.
The vast majority of the 8,100 large stationary CO2 point sources (e.g., fossil fired power plants, refineries, cement kilns, chemical plants) that could conceivably adopt CCS technologies as a means of reducing their CO2 emissions have not adopted CCS systems. Moreover, the vast majority of the new power plants and other large industrial CO2 point sources that are now being built or that are in various stages of planning in the United States and throughout the rest of world are also not planning on adopting CCS systems. This reveals an important point: the deployment of CCS technologies is almost exclusively motivated by the need to significantly reduce greenhouse gas emissions and therefore, their large-scale adoption depends upon explicit efforts to control such emissions. The fact that complete, end-to-end commercial CCS systems exist and that the needed system components of a CCS system are commercially available does not undercut the rationale for a vigorous ongoing research, development and demonstration program focused on improving CCS technologies and demonstrating them in various combinations of technological, geographical, and geologic applications and settings.
2

3
The fact that CCS technologies are commercially available today is also not sufficient to suggest that they provide cost effective means for significantly reducing CO2 emissions to the atmosphere absent a climate policy that would create a significant disincentive on the free venting of CO2 to the atmosphere thereby creating a market for the services CCS technologies provide. It is also critical to acknowledge that in addition to a sufficiently stringent climate policy, the deployment of CCS as a part of society’s response to climate change will need a more clearly defined regulatory framework. Progress is being made on creating and implementing an appropriate regulatory framework covering each aspect of CCS deployment and that ensures appropriate protection for human and environmental health, property and mineral rights, and settlement of liability concerns related to the long-term storage of CO2 as well as other key regulatory issues. However, this again does little to diminish the commercial availability of the technologies, only increase the uncertainty and potential risks for those seeking to deploy them.

2.0 Introduction: The Role of CCS in Addressing Climate Change
Addressing climate change is a large-scale, global challenge to reduce and avoid the release of enormous quantities of greenhouse gases over the course of this century while global populations, economies, and standards of living are expected to continue to grow. There is an extensive body of technical literature that conclusively demonstrates the value of developing an enhanced and diversified portfolio of energy technologies in meeting this challenge (Edmonds, et. al., 2008, IPCC, 2008). “Addressing climate change” will require continued advancements in energy efficiency, nuclear power, renewable energy, and other energy technologies to not only reduce carbon dioxide (CO2) emissions but to also help to improve economic efficiency, competitiveness, and local environmental quality. Carbon dioxide capture and storage (CCS) technologies have the potential to be central elements of this needed advanced energy technology portfolio. CCS technologies are capable of deploying widely across the globe in many different economic sectors and are capable of delivering deep, cost effective and sustained emissions reductions. Research by this and other research groups has shown that CCS systems are capable of reducing the costs of climate stabilization by trillions of dollars because these technologies allow for the continued use of fossil fuels and enable the deployment of other key mitigation technologies such as large-scale, low-emissions hydrogen production (IPCC, 2005, Dooley, et. al., 2006, McFarland et. al. 2003). The costs of CCS systems should be competitive with – and in some cases significantly less costly than – other potential large-scale CO2 emissions reduction and abatement technologies (Edmonds, et. al., 2008). Globally, there are currently more than 8,100 large CO2 point sources (accounting for more than 60% of all anthropogenic CO2 emissions) that could conceivably adopt CCS technologies as a means for delivering deep and sustained CO2 emissions reductions. These 8,100 large CO2 point sources are predominantly fossil-fuel-fired electric power plants, but there are also hundreds of steel mills, cement kilns, chemical plants, and oil and gas production and refining facilities (Dooley, et. al., 2006). A very small number of these facilities are already capturing and selling CO2, suggesting that in certain niche applications it is already profitable to deploy some CCS component technologies. However, the vast majority of these existing facilities have not adopted CCS systems. Moreover, the vast majority of the new power plants and other large industrial CO2 point sources that are now being built in the United States or anywhere else in the world or that are in various stages of planning are also not planning on adopting CCS systems. This reveals an important point: the deployment of CCS technologies is almost exclusively motivated by the need to significantly reduce greenhouse gas emissions and therefore, their large-scale adoption depends upon explicit efforts to control such emissions. The limited, early large scale commercial adoption of complete, end-to-end CCS systems which has taken place to date has occurred outside the electric power sector. However, if there were an explicit climate policy in place that called for substantial and sustained emissions reductions, the fossil-fired electric power plants would almost certainly represent the largest market for CCS systems. CCS systems will be most economic when deployed with large baseload power plants (Dooley et. al., 2006 Kamel and Dolf, 2009, MIT 2007 and IPCC 2005). One explicit goal of this paper is to examine -- in a disaggregated manner -- the status of CCS technologies and their component systems to shed light on the degree to which current systems are of a scale that is relevant to future CCS deployment with large fossil fired power plants and other large anthropogenic CO2 point sources. There is widespread agreement on the potential value of CCS technologies in a greenhouse gas constrained world (e.g., Dooley et. al., 2006, IPCC 2005, Bennaceur and Gielen, 2009, MIT 2007).
4

However, there is considerable confusion as to whether CCS technologies exist today or whether these are technologies that have yet to be invented and therefore will not be ready for use for many years, perhaps decades, to come. The purpose of this short paper is to identify and describe commercially deployed CO2 capture systems, CO2 transportation pipelines, CO2 injection systems and measurement, monitoring and verification (MMV) systems for CO2 injected into deep geologic structures. That is, this paper seeks to help establish the current commercial availability of CCS technologies. This paper will not attempt to speak to the rapidly changing status of currently operational or planned CCS facilities. Readers interested in learning more about these facilities and demonstration projects which are working to advance the current state of the art can consult the on-line resources listed in Appendix B. There is no reason for confusion as to whether CCS technologies exist. CO2 is currently being captured from both natural gas and coal fired commercial power generating facilities, gasification facilities and other industrial processes. Transportation via pipelines and injection of CO2 into the deep subsurface are well established commercial practices with more than 35 years of industrial experience. There are a wide variety of MMV technologies which have been employed to understand the fate of CO2 injected into the deep subsurface. Whether wide scale deployment of CCS is currently or will soon be a cost-effective means of reducing greenhouse gas emissions is largely a function of climate policies which have yet to be enacted and the public’s willingness to incur costs to avoid dangerous anthropogenic interference with the Earth’s climate. Before examining the commercial deployment of individual system components of CCS in more detail, this paper will begin with a brief overview of the four currently operational large commercial complete end-to-end CCS facilities.
3.0 Overview of Four Operational Commercial CCS Facilities
As of early summer 2009, there are four complete, end-to-end commercial carbon dioxide capture and storage facilities on the planet (See Figure 1). Each of these facilities captures anthropogenic CO2 from process streams/flue gases that would otherwise be vented to the atmosphere. The captured CO2 is dehydrated, compressed and otherwise prepared for transport via pipeline and injection into nearby suitable deep geologic CO2 storage formations. Each facility injects CO2 into these deep geologic formations and then employs a suite of MMV technologies to monitor the injected CO2. These four facilities represent 25 years of cumulative knowledge on safely and effectively storing anthropogenic CO2 in appropriate deep geologic formations.
3.1 Sleipner West Field (250km off the Norwegian coast in the North Sea)
The Sleipner project represents the world’s first commercial CCS facility. The Sleipner natural gas field has a high – approximately 9% – concentration of CO2 which must be removed prior to shipping the natural gas on-shore and selling it to various markets. Approximately 1 MtCO2/year is removed from the produced natural gas via an amine-based CO2 separation unit. The captured CO2 is injected via a single injection into the Utsira deep saline formation 800-1000 meters below the seabed (IPCC 2005 and IEA GHG, 2009). CO2 capture and storage has been ongoing at Sleipner since 1996 and to date more that 10 MtCO2 has been safely stored at this site (Statoil Press Release, 2008). The Sleipner project has utilized
5

an MMV program focused on time-lapse seismic surveys, and drawing on core analysis, wireline logging, geochemical monitoring, pressure / temperature / injection rate monitoring, as well as microseismic and gravitational techniques (Chadwick, et al. 2006, Chadwick, et al. 2007).
• CO2 storage began in 2000•2 MtCO2/year being injected via approximately 85 injection wells over a 40 km2 area•Projected 30 MtCO2 lifetime storage
Weyburn
• CO2 storage began in 2004• Three 1.5 km horizontal CO2injector wells are used to inject 1.2 MtCO2/year• Projected 17 MtCO2 lifetime storage
In Salah
Snøhvit• CO2 storage began April 2008• 0.7 MtCO2/year injected into DSF• 23 MtCO2 injected over 30 years• 150 km of the Norwegian coast
•Started injection in 1996 •More than 10 MtCO2 have been injected via 1 injection well with a plume approximately 5 km2 with •Projected 20 MtCO2 lifetime storage•150 km of the Norwegian coast
Sleipner
• CO2 storage began in 2000•2 MtCO2/year being injected via approximately 85 injection wells over a 40 km2 area•Projected 30 MtCO2 lifetime storage
WeyburnWeyburn
• CO2 storage began in 2004• Three 1.5 km horizontal CO2injector wells are used to inject 1.2 MtCO2/year• Projected 17 MtCO2 lifetime storage
In SalahIn Salah
SnøhvitSnøhvit• CO2 storage began April 2008• 0.7 MtCO2/year injected into DSF• 23 MtCO2 injected over 30 years• 150 km of the Norwegian coast
•Started injection in 1996 •More than 10 MtCO2 have been injected via 1 injection well with a plume approximately 5 km2 with •Projected 20 MtCO2 lifetime storage•150 km of the Norwegian coast
SleipnerSleipner
Figure 1: Overview of Four Large Commercial CCS Facilities
3.2 Great Plains Synfuels Plant (Beulah, North Dakota) and the Weyburn Enhanced Oil Recovery Project (Weyburn, Saskatchewan, Canada)
This is the only large scale commercial CCS project in North America and the only one of the four large complete end-to-end CCS facilities that captures CO2 from a coal energy production facility. CO2 is captured at a coal gasification plant in North Dakota and shipped to Saskatchewan via a dedicated 320 km pipeline. CO2 is captured from this synfuels plant with a Rectisol capture unit. More than 3 MtCO2/year is captured at this plant with approximately 2 MtCO2 / year being sent to Weyburn with the remainder vented to the atmosphere (IPCC, 2005). In 2000, equipment needed to recover, compress, and transport via pipeline a portion of this coal gasification plant’s CO2 was installed so that the CO2 could be pipelined to an enhanced oil recovery project known as the Weyburn Unit in southeast Saskatchewan, Canada. The Weyburn oil field lies at a depth of approximately 1500 meters and is less than 50 meters thick. The Weyburn EOR project injects both water and CO2 to enhance oil production via 197 vertical and 15 horizontal injector wells (Wilson and Monea, 2004) The Weyburn project uses a broad range of MMV technologies including time-lapse seismic, core analysis, wireline logging, geochemical sampling and analysis, electrical resistance tomography, crosswell seismic, microseismic monitoring, and sampling of the soil, shallow subsurface and atmosphere to ensure retention of injected CO2 (White 2007).
6
3.3 In Salah Natural Gas Production Facility (Central Saharan Region, Algeria)
CO2 concentrations in this natural gas field range from 1-10% which is far in excess of allowable concentrations for exporting natural gas to markets in Europe. Approximately 1.2 MtCO2/year is removed from the natural gas using and MEA-based CO2 capture unit. The CO2 is injected into a deep saline geologic formation 1800 meters below the surface via three CO2 injector wells with long horizontal legs running up to a 1.5 km to increase the efficiency of CO2 injection in this tight formation (IPCC, 2005). CO2 capture and storage began in April 2004. (IEA GHG, 2009). The In Salah project uses seismic, core, wireline logging, geochemical sampling / analysis, pressure / temperature / injection rate monitoring, electrical resistance tomography, passive / microseismic monitoring, gravitational surveys, tiltmeters, differential InSAR, soil / shallow subsurface and atmospheric monitoring techniques as well as tracer-based monitoring (Wright, et al. 2005, Ebrom, et al. 2007, Onuma & Ohkawa 2009).
3.4 Snøhvit LNG Project (located in the Barents Sea 150 km off the northern coast of Norway)
The Snøhvit facility is Europe’s first commercial liquefied natural gas production facility. The fields that are producing the natural gas also contain a significant quantity of CO2 (5-8% CO2 by volume) which must be separated before the natural gas can be liquefied prior to transport. Approximately 0.7 MtCO2/ year is captured from this facility using an amine-based capture system and is injected into a nearby deep saline formation that lies 2,600 meters below the seafloor. (IEA GHG, 2009, Statoil, 2009, Benson, 2009). The Snøhvit project, also operated by Statoil, has also employed a monitoring and verification program that focuses heavily on time-lapse seismic surveys and pressure monitoring, along with time-lapse gravimetric surveys (Late, 2008). Sleipner and its sister project Snøhvit are unique among these four commercial CCS projects in that data derived from their MMV programs are submitted to national regulators who use these data to determine the environmental efficacy of CCS in terms of climate protection. Norwegian regulators rely on these data as evidence that the CO2 is staying in the target injection formations, to determine whether the storage projects are successfully trapping CO2 away from the atmosphere and therefore whether the projects qualify as a mean to avoid the national carbon tax on CO2 emissions. The Weyburn and InSalah projects utilize their MMV data to demonstrate to relevant regulators that CO2 is remaining in the injection formation and is therefore not negatively impacting underground sources of drinking water or other natural resources. However, because there is no climate policy in place in Algeria or Canada there is no explicit dialogue with a regulator about the efficacy of CO2 storage in terms of mitigating greenhouse gas emissions. If climate policies are put in place in Algeria and Canada, the types of MMV data collected would most likely form the core if not the totality of data presented to regulators to establish the climate benefits of CO2 storage at these two sites. While each of these four commercial CCS facilities captures, injects, and monitors between 0.7 and 2 MtCO2/year into suitable deep geologic formations, a typical large fossil fired power plant would generate perhaps 2-4 times as much CO2/year and perhaps an order of magnitude more cumulative CO2 stored over a typical 40-50 year lifetime. And therefore, there is truth to the often heard assertion that CCS has never been demonstrated at the scale of a large commercial power plant. On the other hand, these four facilities demonstrate that many of the underlying technologies such as pipelines that can handle up to 2 MtCO2 / year (along with all of the seals, pumps, automated flow and safety controls for such a pipeline) do currently exist and would only need to be scaled up modestly to handle the mass of CO2 from a large commercial power plant. These four facilities also demonstrate that MMV technologies
7

can be deployed in a range of different settings and conditions to understand the movement and behavior of CO2 that has been injected into the deep subsurface.
4.0 CO2 Capture, Compression, Dehydration, and Handling Technologies
CO2 has been captured from operational coal power plants since the late 1970s and from natural gas power plants since the early 1990s. The primary task of these facilities is producing electricity or steam for industrial processes, and CO2 capture is a secondary task. As such, these facilities tend to capture CO2 from a small fraction of the total flue gas stream as these CO2 capture units are sized to meet niche commercial markets for CO2 (such as carbonated beverage production and food processing). As noted above, CO2 is also being captured at the Dakota Gasification Facility which gasifies coal to produce synthetic natural gas as well as a number of chemical feedstocks. While similar to IGCC power plants in a number of key respects, it is important to note that this facility does not generate electricity. Industrial coal gasification systems must separate CO2 from the syngas stream as an inherent part of their process unlike an electricity generating IGCC, a point which will be explained in more detail below. However, it is important to note that Dakota Gasification Facility’s capture of CO2 is not precisely the same as CO2 capture from a coal-fired IGCC power plant. Anthropogenic CO2 is also “captured” from natural gas processing plants and from ammonia plants, which produce a high purity CO2 stream that requires little effort to capture beyond diverting and compressing it. Similar to the situation for the Dakota Gasification Facility, the capture of CO2 at these facilities is an inherent part of the process of producing the end product (e.g., natural gas). The technologies used to separate CO2 at these facilities are well established. CO2 capture from natural gas processing plants is at the heart of three of the four large commercial end-to-end CCS facilities currently in operation worldwide. The volumes of CO2 captured from these facilities are significantly larger than what is currently captured from power plants, due in large part to the low costs of capture. It is also important to note that there is more than 35 years of experience related to many of the underlying system components that are often overlooked but are vital aspects of a functioning CO2 capture system. Systems to compress, dehydrate and move gaseous and supercritical CO2 including materials and seals, fittings, meters, etc. are all commercially available and well established technologies. Appendices C and D provide more detail on the three basic CO2 capture system configurations and terms like “food grade CO2” and “amine” that are used throughout the remainder of this section.
4.1 Post Combustion CO2 Capture from Pulverized Coal-fired Electric Power Plants
CO2 is currently being captured from three coal fired electric power plants in the U.S. Each of these are conventional coal power plants. A small fraction of the power plant’s overall CO2 is captured to serve niche markets for CO2. The vast majority of the CO2 produced at these power plants through the combustion of coal to generate electricity is vented to the atmosphere.
8

• Warrior Run Power Plant (Cumberland, Maryland). This 180 MW pulverized coal power plant
captures a small slip stream of the facility’s flue gases to produce approximately 330 tCO2/day of food grade CO2 (Holt, 2008). The CO2 is captured using an ABB Lummus unit that uses monoethanolamine (MEA) as its solvent. This plant has been in operation since 2000. (IEA GHG, 2009)
• Shady Point Power Plant (Panama, Oklahoma). The 320MWe Shady Point power plant is a
circulating fluidised bed coal-fired power plant. A small slip stream of the facility’s emissions are treated to produce approximately 200 tCO2/d of food grade CO2 via an ABB Lummus scrubber system that uses MEA as its solvent. The extracted CO2 is used for food processing, freezing, beverage production and chilling purposes. (IEA GHG, 2009).
• Searles Valley Minerals Soda Ash Plant (Trona, California). Approximately 800tCO2/d of CO2 is
captured from the flue gas of a coal power plant (steam and electricity are generated at this plant) using ABB Lummus MEA capture unit (Herzog, 1999). This facility has been in operation since 1978 thus making it the world’s longest operating CO2 capture facility. The captured CO2 is used for the carbonation of brine in the process of producing soda ash. (IEA GHG, 2009, SourceWatch, 2009).
4.2 CO2 Capture from Coal Gasification As noted above, the capture of CO2 from a coal gasification plant like the Dakota Gasification Facility which makes synthetic natural gas and various chemicals is similar yet markedly different than what would need to occur within a coal fired integrated gasification combined cycle (IGCC) electricity plant. For a gasification plant like the Dakota facility, the vast majority of the CO2 is removed by plant’s gas treatment units upstream of the methanation units in an already concentrated and pressurized form. This CO2 stream is in a form that requires little extra processing other than some additional compression for pipeline transport. While similar acid gas removal processes would be used in an IGCC power plant wishing to capture CO2 prior to combustion of the syngas stream, this process is not necessary for the production of electricity in an IGCC plant. Therefore, the key difference between a coal gasification facility and an IGCC power plant is that the CO2 must be separated in syngas production while it is a choice (that also brings additional costs and design considerations into play) for the IGCC plant. However, the technologies employed for CO2 separation in each case would be very similar.
• Great Plains Synfuels Plant (Beulah, North Dakota). This facility is the only large coal gasification plant in the United States that synthesizes natural gas from coal. CO2 is captured from this synfuels plant with a Rectisol capture unit. In 2000, equipment needed to recover, compress, and transport via a 205 mile pipeline a portion of this coal gasification plant’s CO2 was installed so that the CO2 could be pipelined to an enhanced oil recovery project known as the Weyburn Unit in southeast Saskatchewan, Canada. More than 3 MtCO2/year is separated at this plant with approximately 2 MtCO2 / year being sent to Weyburn with the remainder vented to the atmosphere (IPCC, 2005, Perry and Eliason, 2004).
4.3 CO2 Capture from Oxygen-fired Coal Combustion The combustion of coal using purified oxygen as opposed to combustion in air which contains a significant fraction of nitrogen and many other non-reactive constituent gases is seen as one promising
9

technology for increasing the concentration of CO2 in the flue gas stream and thereby simplifying and hopefully reducing the cost of CO2 capture from coal power plants. Currently, there is one rather small “oxy-fired” coal power plant in operation.
• Schwarze Pumpe Pilot Plant (Spremberg in Brandenburg, Germany). Vattenfall has been operating a 30 MW pilot scale, oxygen fired coal power plant since the middle of 2008. Approximately 220tCO2/day can be captured from this pilot plant via compression and liquefaction of the resulting high purity CO2 exhaust stream as opposed to a chemical absorption process like MEA. The captured CO2 is stored in a liquefied state on-site in two 180m3 tanks which are used to temporarily store the CO2 before it is sent to various markets via tanker trucks. (Strömberg, 2009)
4.4 Post-Combustion CO2 Capture from Natural Gas-fired Facilities While the CO2 concentration in the flue gas of conventional coal-fired power plants is approximately 15% and oxy-fired technology aims at significantly higher concentrations, the combustion of natural gas results in very low CO2 concentrations (approx. 3%-5%). Capturing CO2 from such dilute streams can present unique challenges.
• Sumitomo Chemicals Plant (Chiba Prefecture, Japan). This natural gas fired power plant
generates electricity and approximately 150-165 tCO2/day of food-grade CO2. A Fluor Econamine CO2 scrubber system is used to remove CO2 from flue gases. The plant has been operational since 1994. (IEA GHG, 2009).
• Prosint Methanol Production Plant (Rio de Janeiro, Brazil). Approximately 90 tCO2/day of food-grade CO2 is captured from the flue gases of a natural gas-fired boiler using a Fluor Econamine MEA CO2 capture unit. This facility has been in operation since 1997. The captured CO2 is used to carbonate beverages (IEA GHG, 2009).
4.5 CO2 Capture from Natural Gas Reforming Natural gas is commonly used as a feedstock in the production of hydrogen, ammonia, urea, and related products, via steam reforming processes. Approximately 85% of ammonia is made by steam reforming natural gas, a process that is well suited to separating out large commercial quantities of high purity CO2 (IPCC, 2005).
• Indian Farmers Fertilizer Company (Aonla and Phulpur, India). CO2 is recovered from steam reformer flue gases via a CO2 capture unit that uses Mitsubishi Heavy Industry’s (MHI) proprietary KS-1 amine. The plant captures approximately 900 tCO2 /day utilizing two 450 tonCO2/day capture trains) for use in manufacturing (MHI, 2009).
• Petronas Fertilizer (Kedah Darul Aman, Malaysia). Approximately 160 tCO2/day is captured
from a steam reformer flue gases. The recovered CO2 is used for urea production. The Petronas flue gas CO2 recovery plant started up in October 1999 and has been operated continuously since. (MHI, 2009).
10

• Ruwais Fertilizer Industries (Abu Dhabi, United Arab Emirates). At this facility 400 tCO2/day is captured from steam reformer flue gases using a capture unit based on MHI’s KS-1 solvent. CO2 capture began at this facility in 2008 (MHI, 2009).
Luzhou Natural Gas Chemicals (Luzhou City, China). CO2 is removed from the exhaust gases of a natural gas reformer unit using Fluor's Econamine MEA CO2 removal process. The facility captures approximately 160 tCO2/d of CO2 which is used for manufacturing urea. (IEA GHG, 2009)
4.6 CO2 Capture from Natural Gas Production Natural gas fields around the world contain various levels of CO2 that is intermixed with the methane and other light hydrocarbons which are being produced from these fields. Natural gas pipeline specifications vary around the world, though natural gas markets and pipeline operators generally limit CO2 concentrations to no more than 2% by volume. This is done to prevent pipeline corrosion, to avoid using energy to compress the CO2 for transport and to increase the heating value of the gas (IPCC, 2005). For the vast majority of these facilities, current commercial practice is to vent this pure CO2 into the atmosphere
• Snøhvit LNG Project (located in the Barents Sea 150 km off the northern coast of Norway). The Snøhvit facility is Europe’s first commercial liquefied natural gas production facility. The fields that are producing the natural gas also contain a significant quantity of CO2 (5-8%), which must be separated before the natural gas can be liquefied prior to transport (Carbon Capture Journal 2008). Approximately 0.7 MtCO2/ year is captured from this facility and is injected into a nearby deep saline formation. (IEA GHG, 2009 and Statoil, 2009)
• In Salah Natural Gas Production Facility (Algeria). CO2 concentrations in this natural gas field
range from 1-10% which is far in excess of allowable concentrations for exporting natural gas to markets in Europe. Approximately 1.2 MtCO2 / year is removed from the natural gas using and MEA-based CO2 capture unit and is injected into a nearby deep geologic formation. CO2 capture and storage began in 2004. (IEA GHG, 2009).
• Sleipner West Field (150km off the Norwegian coast in the North Sea). The Sleipner natural gas
field has high – approximately 9% -- concentration of CO2 which must be removed prior to shipping the CO2 on shore and selling it to various markets. Approximately 1 MtCO2/year is removed from the produced natural gas via an amine-based CO2 separation unit. The captured CO2 is stored in a nearby deep saline formation (IEA GHG, 2009). CO2 capture and storage has been ongoing at Sleipner since 1996 and to date more that 10 MtCO2 has been stored at this site (Statoil Press Release, 2008).
• Shute Creek Natural Gas Processing Plant (La Barge, Wyoming). Produced gas streams from fields in this area contain approximately 65% CO2 and only 22% natural gas. The plant has been separating, compressing, and selling approximately 4 MtCO2/yr to various enhanced oil recovery projects in the region and venting another 3.5 MtCO2/yr. Selexol process is used to remove CO2 and H2S from natural gas (Kubek, 2009). ExxonMobil is currently planning to increase the capture of CO2 by another 100 MMCFD (1.9 MtCO2/yr) and is testing a new controlled freeze zone capture technology that may make additional capture more affordable (Environmental Leader, 2008).
11
12
• Val Verde Natural Gas Plants (Terrell and Pecos Counties, Texas). The Terrell, Grey Ranch,
Mitchell, and Puckett plants, process natural gas and transport their collected CO2 to oil fields in west Texas via the Petro Source Canyon Reef Carriers CO2 pipeline (the oldest large CO2 transport pipeline in the U.S., constructed in 1972). Current estimates suggest that 75 MMCFD of CO2 are delivered to the SACROC and other oil fields (Moritis, 2008) while total pipeline capacity is estimated at 275 MMCFD (Bradley 2005).
• DTE Turtle Lake Gas Processing Plant (Otsego County, Michigan). One of several gas
processing plants in northern Michigan’s Antrim Shale fields. Gas produced from Antrim Shales contain between 5-30% CO2 which is removed by an amine based separation process. The resulting high purity (99%) CO2 stream is used periodically for EOR flooding of Niagaran Reef oil fields (transported via existing 8 mile pipeline) and also for the ongoing demonstration of CO2 storage in the Silurian-age Bass Island dolomite deep saline formation by the Midwest Regional Carbon Sequestration Partnership. A total of 60,000 tons is scheduled to be injected (at rates of 250-600 tons/d) by the end of this demonstration project, at a depth of 3,500 feet (Battelle 2007 and Global Energy Network Institute, 2009). Excess CO2 is vented to the atmosphere.
Table 1 summarizes the individual CO2 capture facilities discussed above. The volume of CO2 captured from each facility is shown in three different sets of units as these are common units for discussing the scale of these operations in different engineering and technical communities. The first three rows in Table 1 also show the volume of CO2 that could be captured from hypothetical 500 MW natural gas and coal fired power plants. These hypothetical reference plants are included here to provide a basis of comparison from today’s CO2 capture deployments to the scale that might be needed for future facilities. As can be seen, many of the existing CO2 capture facilities – and in particular those capture facilities that are mated to fossil fired electricity generating plants – is considerably smaller than the volumes of CO2 that would have to be processed from these reference 500 MW facilities. However, the observation that CO2 capture facilities mated to existing power plants is small compared to a large power plant’s total CO2 emissions should be seen as being driven by the niche market circumstances that existed which led to the investment in these CO2 capture systems. That is, these facilities were built to serve a specific commercial market for CO2; at the time they were built there was no incentive to build a CO2 capture unit larger than what was required to serve that market and in fact there would have been strong disincentives that would have prevented the construction of a larger than needed CO2 capture unit. Because these CO2 capture units were sized to serve specific market demands for CO2, it would be incorrect to assume that the size of these units represents some inherent technical or economic threshold for CO2 capture units. The last two columns in Table 1 are intended to speak to this point. The data in these last two columns represent a back of the envelope calculation of how many CO2 capture trains would be needed to handle this volume of CO2 based upon a 450 tCO2/day system (the largest advanced CO2 capture system commercially installed to date) and a 3000 tCO2/day system (which represents the largest advanced CO2 capture system that Mitsubishi Heavy Industries says they can deliver today for commercial applications (Hirata, et. al., 2008 and Ijima et. al., 2009)). Assuming that the largest currently installed CO2 capture system that is applicable to electric power production was deployed on a nominal 500 MW coal-fired power plant, it would require approximately 20 parallel 450 tCO2/day capture units. This would represent a significant capital expenditure and significant land at the power plant. However, there is no reason to assume that there will not be technological progress in this regard and considering the application of the 3000 tCO2/day capture technology that is reported to be available would reduce the number of parallel CO2 capture trains required for this hypothetical 500MW coal plant to only three units. With additional experience and development, it is not unreasonable to believe that the number of required trains may be further decreased.

Table 1: Summarizing Existing Anthropogenic CO2 Capture Facilities
CO2 Source Type Use MMCFD tCO2/d MtCO2/yr
Number of
450 tCO2/d
Capture Trains
Number of
3000 tCO2/d
Capture Trains
500 MW NGCC Power Plant Reference Power Plant 67 3,550 1.3 8 2 500 MW Pulverized Coal Power Plant Reference Power Plant 154 8,160 3.0 19 3 500 MW IGCC Power Plant Reference Power Plant 145 7,680 2.8 18 3 IMC Global Soda Ash Plant (USA) Coal-fired power plant Soda ash production 15 800 0.3 2 1 Warrior Run Power Plant (USA) Coal-fired power plant Food/beverage 6 330 0.1 1 1 Schwarze Pumpe Pilot Plant (Germany) Coal-fired oxyfuel combustion Various 4 202 0.1 1 1 Shady Point Power Plant (USA) Coal-fired power plant Food/beverage 4 200 0.1 1 1 Great Plains Synfuels Plant (USA) Coal gasification EOR 104 5,480 2.0 13 2 Sumitomo Chemicals Plant (Japan) Natural Gas-fired power plant Various 4 200 0.1 1 1 Prosint Methanol Production Plant (Brazil) Methanol Beverage/food 2 90 0.0 1 1 Enid Fertilizer Plant (USA) Fertilizer Urea, EOR 35 1,850 0.7 5 1 Indian Farmers Fertilizer Company (India) Fertilizer Manufacturing 17 900 0.3 2 1 Ruwais Fertilizer Industries (India) Fertilizer 8 400 0.1 1 1 Luzhou Natural Gas Chemicals (China) Fertilizer Urea 3 160 0.1 1 1 Petronas Fertilizer (Malaysia) Fertilizer Urea 3 160 0.1 1 1 Shute Creek Natural Gas Processing Plant (USA) Natural gas processing EOR 300 15,870 5.8 36 6 Val Verde Natural Gas Plants (USA) Natural gas processing EOR 75 3,970 1.4 9 2 In Salah Natural Gas Production Facility (Algeria) Natural gas processing Geologic storage 62 3,290 1.2 8 2 Sleipner West Field (North Sea, Norway) Natural gas processing Geologic storage 52 2,740 1.0 7 1 Snohvit LNG Project (Barents Sea, Norway) Natural gas processing Geologic storage 36 1,920 0.7 5 1 DTE Turtle Lake Gas Processing Plant (USA) Natural gas processing EOR/Geologic storage 11 600 0.2 2 1
13

5.0 CO2 Transportation Technologies
The technologies needed to safely move CO2 by pipeline are well established. CO2 transport via pipeline has been practiced in the U.S. since the early 1970s and should be seen as an established technology. The U.S. has by far the largest existing dedicated CO2 pipeline infrastructure in the world. There are currently more than 3900 miles of dedicated CO2 pipelines in the United States—of varying lengths and diameters—built primarily to serve CO2-driven enhanced oil recovery (EOR) projects. Figure 2 shows the existing CO2 pipeline infrastructure in the US and Saskatchewan, Canada.
Figure 2: Existing CO2 Pipelines in the U.S.
Many of the largest CO2 pipelines in terms of length and capacity take CO2 from natural CO2 domes and transport the CO2 to aging oil fields for enhanced oil recovery. Table 2 lists selected major CO2 pipelines in North America. As Table 2 illustrates the volumes of CO2 that can be moved though these pipelines are very large and are certainly on the order of (if not larger than) the volume of CO2 that would need to be transported from a large yet-to-be-built power plant that might employ CCS to reduce its greenhouse gas emissions. Large-scale transport of CO2 via pipeline is not a technology that needs to be created nor are new laws or regulatory policies prerequisites for any potential expansion of the nation’s CO2 pipeline infrastructure. Gale and Davison (2007) and Forbes et. al. (2008) report that CO2 pipelines in the US have a safety record which is better than that of comparable natural gas lines and the IPCC (2005) cites a number of studies showing that pipeline safety has improved in many parts of the world with the development and dissemination of operational best practices and improved remotely controlled safety valves and sensors.
14

Table 2. Selected Major Operational CO2 Pipelines in North America (IPCC, 2005)
Pipeline Name (year completed) Length Estimated Design
Capacity Bravo (1984) 217 7 MtCO2/year Canyon Reef Carriers (1972) 140 miles 5.2 MtCO2/year Cortez Pipeline (1984) 502 miles 24 MtCO2/year Sheep Mountain (1984) 410 miles 9.5 MtCO2/year LaBarge (2003) 285 miles 8 MtCO2/year Val Verde (1998) 81 miles 2.5 MtCO2/year Weyburn (2000) 205 miles 2 MtCO2/year
These existing CO2 pipelines are regulated under an established body of regulations under the authority of the U.S. Department of Transportation’s Office of Pipeline Safety as applicable state-specific regulations. Operational pipelines are monitored continuously by pressure and flow management systems to detect and respond to leakage instantaneously, and are periodically evaluated internally by automated inspection devices and externally by visual inspection (on foot or by aircraft). Long-distance pipelines are divided into smaller segments with each segment instrumented to measure pressure and flow, and capable of isolating individual segments for maintenance, repair, or to minimize loss of CO2 in the event of a pipeline breach (IPCC 2005).
6.0 CO2 Injection Technologies
The technologies needed to safely inject CO2 into these deep geologic formations largely exist today and are drawn from technologies, techniques and industrial best practices that are routinely used in the oil and natural gas production industries. CO2 injection should be seen as established technology. The injection of anthropogenic CO2 into the deep subsurface dates to at least 1972 when CO2-driven enhanced oil recovery began at the Scurry Area Canyon Reef Operators Committee (SACROC) unit in west Texas (Ambrose et. al., 2008). Over the past 35 years, approximately 150 MtCO2 has been injected into the Canyon Reef formation for the purpose of stimulating additional oil recovery. 75 MtCO2 were intentional produced from these fields for reinjection into other parts of the SACROC or in other oil fields employing CO2-driven EOR. Thus, an estimated 55 MtCO2 has become trapped in these deep geologic formations from the injection of CO2 (Smyth et. al. 2006). Meyer (2007) reports that 440 injection wells have been completed in the SACROC unit itself which covers approximately 90mi2. In their 2008 Enhanced Oil Recovery Survey, the Oil and Gas Journal (2008) indicates that there are 100 CO2-driven enhanced oil recovery projects operational in the Untied States. The CO2 flooding across these 100 projects encompasses nearly 420,000 acres and utilizes more than 6200 injection wells (as well as more than 9100 production wells). Meyer (2007) estimates that since the start of the SACROC project in 1972 more than 8,800 CO2 injector wells have been completed in Texas alone.
15

A Real World 205 mile CO2 pipeline. The CO2 pipeline from the Dakota Gasification Company’s (DGC) Great Plains Synfuels Plant runs for 205 miles from North Dakota to Saskatchewan. This pipeline transports 2 MtCO2/year for use in enhanced oil recovery operations at the Weyburn oil field. • Rights of way were negotiated with various land owners to acquire the needed continuous
corridor for the pipeline. All parties eventually agreed to allow the pipeline to cross their land. There was no need to resort to condemnation proceedings.
• The pipeline diameter runs from 12 to 14 inches. The pipe is made from carbon steel as there was no need to use exotic alloys given the very low water content entrained in the CO2 coming from the DGC Great Plains Synfuels Plant. The thickness of the pipeline’s walls is increased significantly at water crossings, road and railroad crossings. The maximum operating pressure is 2700 psig over the first half of the pipeline and 2964 psig over the remainder of the pipeline. A booster pump operates at Tioga, ND which is approximately half way along the pipeline.
• The pipeline is buried at a minimum depth of 4 feet. At road crossings, a minimum depth of 5 feet is used and at railroad crossings the pipeline is buried to a depth of 10 feet.
• In total there are 12 remotely controlled main line valves, which are designed to allow for individual sections of the pipeline to be isolated in case of damage to the pipeline. These remotely controlled main line valves are no more than 20 miles apart along the pipeline.
• The pipeline crosses three waterways along its path; the Little Missouri River as well as Lake Sakakawea both of which are in North Dakota and Jewel Creek in Canada. The crossing at Lake Sakakawea is three miles long. At the two more significant water crossings, the Little Missouri River and Lake Sakakawea, there are remotely controlled main line valves on both shores for both of these water crossings.
• The pipeline undergoes periodic inspections and tests to ensure its continued integrity and safety including: aerial and foot patrols of the right of way 26 times per year, maintenance and inspection of all valves twice per year, internal inspection of the pipeline using electronic tools at least once every 5 years, and testing of all emergency systems including over pressurizing safety devices once per.
Sources: Perry and Eliason, 2004 and Dakota Gasification Company 2009.
16
The injection of CO2 into the deep subsurface is not a new practice and has been regulated for decades under the Safe Drinking Water Act. The draft Class VI Underground Injection Control rule clearly states “CO2 is currently injected in the U.S. under two well classifications: Class II and Class V experimental technology wells” (Federal Register, 2008). There is a small but growing body of literature that indicates that past CO2 injection has managed in a safe and effective manner. These research studies are built upon an examination of the historical record of CO2 injection and highly analogous deep subsurface injection techniques. Here we briefly mention three of these studies.
• In a study of well blowouts in California oil fields undergoing thermal enhanced oil recovery during the period 1991-2005, Jordan and Benson (2008) demonstrate that well blowouts were rare and the rate of blowouts declined significantly over this 15 year period. The authors attribute this to “increased experience, improved technology, and/or changes in the safety culture in the oil and gas industry.” They go on to note, “Any of these explanations suggests that blowout risks can also be minimized in CO2 storage fields.”
• Preliminary analysis of research still underway looking at the effects of more than 35 years of CO2 injection at the SACROC field by Smyth (2009) suggests that no leakage of injected CO2 into shallower underground sources of drinking water has occurred notwithstanding the large volumes of CO2 that have been injected at this site. There has also been significant improvement in well construction and operations over the last three decades.
• Carey et. al., (2007) report that while cement cores retrieved from 30 year old CO2 injector wells
in the SACROC formation clearly show that the injected CO2 reacted with the cement that the cement appears to have “retained its capacity to prevent significant flow of CO2” which is the primary purpose of this cement casing around the CO2 injection well.
7.0 CO2 Measurement, Monitoring and Verification Technologies
Because CCS technologies will only deploy in the presence of a societal mandate to avoid CO2 emissions to the atmosphere, and since these policies are likely to carry with them either incentives for long-term storage or penalties for venting, it is necessary to create a framework that provides for the safe, secure, long-term storage of CO2 in the subsurface, and certifies that a given ton of CO2 stored qualifies for monetization as a credit, offset or avoided emission. This is the motivation for a robust program to measure, monitor and verify the quantity of CO2 stored. Measurement, monitoring and verification (MMV) technologies for CO2 injected into the deep subsurface represent a large set of potential technological options for monitoring CO2 injection and other critical in situ behaviors that help determine the fate of the stored CO2 and the ultimate efficacy of CO2 storage as a means of isolating CO2 from the atmosphere and underground sources of drinking water. Wellhead monitoring of the volume and rate of CO2 injected into the formation provides the first critical data stream used in the MMV toolkit. This step quantifies the amount of CO2 injected in the subsurface, while other methods are used to verify this storage volume, and/or look for evidence that the injectate is migrating out of the storage formation. As shown in Figure 3 below, some technologies are best used for detecting the presence of CO2 at the surface and in the shallow subsurface – including atmospheric and soil monitoring methods that involve sampling and analysis to detect CO2 in the air, soil and water table – while other
17

technologies are only used to examine the very deep subsurface, all the way down to the storage formation itself, or even deeper. There are also sampling-based techniques for monitoring the very deep subsurface, including formation fluid chemistry monitoring, and monitoring of overlying water-bearing formations to determine if CO2 from the target formation has migrated away from the intended zone. They also can include technologies such as seismic imaging, a technology that uses energy imparted into the earth’s crust, collects information on how that energy is reflected and refracted through the layers of rock, and uses that information to create an image of the CO2 plume at depth like those shown in Figure 4 (IPCC 2005).
Wireline, Coring and Mechanical Integrity
Cross-well or 3D Seismic
Depth (ft bgs)
0
1,000
2,000
3,000
4,000
Storage Formation
Injection TestWell
Depth (ft bgs)
0
1,000
2,000
3,000
4,000
Storage Formation
Depth (ft bgs)
0
1,000
2,000
3,000
4,000
Storage Formation
Injection TestWell
System Monitoring
3650
3700
3750
3800
3850
3900
3950
0 20 40 60 80 100
Time (Days)
Pres
sure
(PSI
)
0
20
40
60
80
100
120
140
Tem
pera
ture
(*F)
Deep Monitoring Well
Not Shown: • Wellhead Monitoring • Acoustic Emissions
Borehole Tiltmeters
Brine Chemistry and
Fl id S liNa
Ca K
90
10
90
80
20
80
70
30
70
60
40
60
50
50
Surface Flux and Soil Gas Probes
Multi-level Monitoring
50
40
60
40
30
70
30
20
80
20
10
90
10
1460
1480
1500
1520
1540
1560
1580
1600
1620
0 10 20 30 40 50 60 70
Days
Pres
sure
(PS
I)
Pressure1Pressure2Pressure3Pressure4
60
65
70
75
80
85
90
95
0 10 20 30 40 50 60 70
Days
Tem
pera
ture
(F)
Temp1Temp2Temp3Temp4
Figure 3. Examples of MMV techniques applicable at various depths. (Graphic credit: Midwest
Regional Carbon Sequestration Partnership)
18

Figure 4. Seismic images from the Sleipner injection project (IPCC 2005).
Likewise, while some methods such as these require that a baseline survey be conducted prior to injection but are also useful for long-term monitoring once CO2 injection has begun, some technologies are better suited to pre-injection site characterization activities – such as geophysical tests of the formation that can only be run before the well is cased, or aerial magnetic surveys that are flown over the projected maximum CO2 plume footprint to find any undocumented wells that may need to be remediated prior to injection (Figure 5, USGS 2005) It is also important to note the interdependence of baseline and continuing data acquisition in validating and updating models used to simulate future reservoir behavior under expected conditions. By updating the models with new data, they become more robust over time, increasing certainty in the results for a given geochemical code – and therefore all subsequent projects that use that model – as well as for the specific field and project. A large, varied suite of tools for monitoring injected CO2 already exists, having been developed for other industries interested in exploring the deep subsurface. A large number of these technologies are mature, and are used commercially in the oil and gas fields (Spangler 2008). For example, seismic imaging of the subsurface – particularly two- and three-dimensional surveys – is routinely used all over the world by the oil and gas industry to identify new resources and manage hydrocarbon production. However, the application of these technologies to CCS, though expected to be very similar and in some cases already tested, may require knowledge gaps to be filled. For example, in order to resolve the movement of a body of injected CO2, seismic surveys are taken at various time intervals in order to see the progress of the CO2 plume. This kind of survey was less routine a decade ago when the Sleipner project began injection CO2 into the subsea Utsira formation, but Sleipner and other CCS projects have used it successfully, and the knowledge gained in these applications has increased the confidence in these “4D” seismic methods.
19

Figure 5. Example of data acquired during an aerial magnetic survey showing the locations of wells,
differentiated from the surrounding ground by their magnetic signatures (USGS 2005).
Table 3 summarizes the major components of the MMV suite discussed within the CCS technical community, including the phase(s) where each technology is applicable and whether it was used for one of the major CCS projects listed. Note that this discussion is based on a preliminary literature review, and should not be considered comprehensive.
7.1 CO2SINK – The CO2SINK injection project at Ketzin, Germany was designed to utilize surface seismic, core analysis, wireline logging, geochemical monitoring of formation fluids in and above the storage zone, injection rate / in situ pressure and temperature monitoring, electrical resistance tomography, crosswell seismic, and surface / shallow subsurface monitoring techniques (Giese, et al. 2009).
7.2 In Salah – BP’s Algerian In Salah project uses seismic, core, wireline logging, geochemical sampling / analysis, pressure / temperature / injection rate monitoring, electrical resistance tomography, passive / microseismic monitoring, gravitational surveys, tiltmeters, differential InSAR, soil / shallow subsurface and atmospheric monitoring techniques as well as tracer-based monitoring (Wright, et al. 2005, Ebrom, et al. 2007, Onuma & Ohkawa 2009).
7.3 Nagaoka – The Japanese Nagaoka project has employed core analysis, wireline logging, geochemical sampling and analysis, injection operations monitoring (wellhead and in situ), crosswell seismic and microseismic detection to monitor CO2 injection operations (Yoshimura 2007).
20

7.4 Sleipner – The Sleipner project, under which Statoil injects CO2 into the Utsira formation, deep beneath the North Sea, has utilized a program focused on timelapse seismic surveys, and drawing on core analysis, wireline logging, geochemical monitoring, pressure / temperature / injection rate monitoring, as well as microseismic and gravitational techniques (Chadwick, et al. 2006, Chadwick, et al. 2007).
7.5 Snøhvit – The Snøhvit project, also operated by Statoil, has also employed a monitoring and verification program that focuses heavily on timelapse seismic surveys and pressure monitoring, along with timelapse gravimetric surveys (Late 2008).
7.6 Weyburn – The Weyburn project, which takes CO2 from the Dakota Synfuels plant in the United States and injects it into the Weyburn-Midale EOR field in Saskatchewan, Canada, uses a broad range of MMV technologies including timelapse seismic, core analysis, wireline logging, geochemical sampling and analysis, electrical resistance tomography, crosswell seismic, microseismic monitoring, and sampling of the soil, shallow subsurface and atmosphere to ensure retention of injected CO2 (White 2007).
7.7 Frio – The GEOSEQ’s Frio project, a pilot injection project into the Frio formation in Texas, utilized seismic surveys for site characterization as well as monitoring plume movement. Core and wireline logging were used in characterization, in addition to monitoring techniques that included pressure / injection rate monitoring, electromagnetic surveys, crosswell seismic, geochemical sampling of the deep subsurface, and sampling of the atmosphere, surface and shallow surface for CO2 and tracers (Hovorka & Knox 2003, Hovorka 2005). In some instances, as is the case for the In Salah and Weyburn projects for example, the geology of the storage formation is analogous to the oil and gas formations where many of these technologies were pioneered and perfected. However, in other cases where non-standard storage formations (e.g., basalt formations, coal seams, shales, and others) may be used as the primary storage reservoir, it is likely that the gaps between existing technologies and their reliable use in these novel formation types will be greater than when they are used on sandstones and carbonates like the ones where oil and gas are typically found. Thus, while the various MMV component technologies may be commercially mature, they may not necessarily be able to deploy everywhere and always, and the same technologies may prove to be technologically immature or unusable in these novel formation types. Similarly, technologies that have been used in the oil and gas industry for decades and have been constantly improved upon to increase their effectiveness for finding and producing hydrocarbon resources are not capable of imaging a very small volume of oil, nor would they be capable of imaging a very small volume of CO2. Indeed, the biggest gun in the MMV arsenal, 3D seismic surveys, typically expect resolutions in the meters to tens of meters when imaging the edge of the CO2 plume. For the range of CO2 densities present at depth at the Sleipner project, this corresponds to hundreds or thousands of tons of CO2. While being able to define the boundary of a CO2 plume that is 5000 feet deep and be accurate to within 10-20 feet and verify millions of tons of CO2 injected to within a matter of a few hundred tons is a technological marvel, if CO2 regulations require that MMV methods be capable of verifying that 100% of the CO2 is present and accounted for, there is no suite of technologies that currently exists that will meet this requirement. In no way does this suggest that regulations will be expected to forgive some quantity of
21

leakage, but the resolution of the monitoring tools is such that knowing where literally all of the CO2 is at any time is not possible, nor is it likely to be any time in the next 10-20 year timeframe expected to be crucial for CCS deployment and climate change mitigation in general. As discussed earlier, some tools are best suited for surface or near-subsurface monitoring tasks, while others are ideal for the very deep subsurface; similarly, some tools have very high lateral resolutions, others very high vertical resolutions, and still others achieve a well balanced combination of the two. Certain tools complement each other well and are often used in conjunction with each other (e.g., surface seismic with vertical seismic profile), and other tools can be combined to address the unique needs – reservoir geometry, formation fluids, matrix rock, etc. – of the individual storage site. However, while the individual resolutions of each tool in the MMV suite employed by a given project may vary by technology and site, it is the cumulative set of data produced by the combination of MMV tools, iterative reservoir modeling and careful injection rate monitoring that provides the needed level of detail to detect and address issues before they threaten from multiple tools corroborating and improving modeling results and verifying the initial flowmeter measurements of CO2 introduced into the storage formation that resolves enough detail to say with a very high degree of certainty that the CO2 is effectively stored, and that groundwater and surface resources and environmental health are being protected. Lastly, it is important to note that there are often multiple technologies that can be used to obtain values for the same parameter. One technology may be better for a certain situation, while another would be preferable elsewhere. This suggests that, instead of a single standardized MMV suite for all sites, operators and their wellfield support contractors should choose that suite of technologies, based on site-specific needs, that satisfy the data requirements necessary to verify the volume and location of injected CO2 at the levels of resolution and certainly required by the entity responsible for certifying the emissions credit or offset. If verification requirements are crafted to be appropriate to the resolution of the tools used to quantify the volume and location of injected CO2, and if project operators are allowed to use a flexible approach to selecting the MMV technologies employed, for a large majority of the potential CO2 storage projects likely to deploy in the next 10-20 years, the existing technologies available for MMV are likely to be sufficient. As CCS deploys and demand for storage in non-standard settings grows, the need for effective novel MMV applications is likely to push the research and industrial communities up the learning curve as well.
22

Table 3. Key MMV technologies, their applicability by phase, and application at selected major CCS projects around the world.
Technology Description Cha
ract
eriz
atio
n
Inje
ctio
n
Pos
t-Clo
sure
CO
2SIN
K
In S
alah
Nag
aoka
Sle
ipne
r
Sno
hvit
Wey
burn
Frio
Surface-based seismic (2D / 3D / 4D) Surface-based sources used to impart energy into thesubsurface. Surface-based receivers collect energy waves that have been reflected and refracted through the deep subsurface, and these travel time data are processed and analyzed to resolve structures at depth. 2D seismic produces a single "slice" image of the subsurface, while 3D produces a three-dimensional image. So-called "4D" timelapse seismic data are acquired at multiple discrete periods in time to resolve changes in the subsurface over time.
X X X X X X X X X
Lithology logging / core Initially performed for site characterization and project / operational design, these tests are crucial to understanding the fine-scale characeristics of the formation at depth. In particular, core samples can be analyzed in the laboratory for critical storage formation and caprock parameters, including information on the ability of the rock to transmit fluids and its ability to withstand injection pressures.
X X X X X X
Wireline logging Performed by introducing a set of tools into the well to measure geophysical and electrical properties of the storage formation, caprock and other zones of interest. Initial logging is often done in an uncased well, although some logs (e.g., cement bond log) are routinely performed through casing. These logs are used for initial characterization and project design, and many are useful for ongoing monitoring as well. Note that logging of the injection well requires that injection cease in order to introduce the logging tool string.
X X X X X X X X X
Geochemical sampling & analysis Collection of fluid samples from the storage zone, as well as overlying and possibly underlying aquifers via monitoring wells to screen for changes in chemistry that could suggest movement of formation fluids from the storage zone
X X X X X X X X X
Pressure & injection rate monitoring Standard field management tools used to monitor formation and well integrity B
X
X X X X X X X X XElectromagnetic surveys Introduce EM energy into the subsurface and measure the response. Can be used as
an accessory to seismic surveys.X X X X
Electrical resistance tomography Inexpensive but lower resolution that seismic, ERT uses an electrode in the subsurface (the wellbore may be used as the electrode) to measure resistitivity. Data can be acquired often and via remote, making this a good option for filling in between higher-resolution but more expensive discrete seismic surveys.
X X X X X X
Crosswell seismic Uses sources and receivers placed in the wells, which allows for greater resolution in the subsurface, but only between the wells.
X X X X X X X
Microseismic / passive seismic Uses permanent geophones in monitoring wells and/or on the surface to monitor for very, very small geomechanical changes in the storage formation as the CO2 moves.
X X X X X X X
Gravitational surveys Measures changes to the gravitational field in order to resolve changes in formaiton fluid density as CO2 displaces brine in the formation over time.
B X X X X
Magnetic surveys Excellent aerial technique for identifying existing (cased) wellbores. Less mature as a CO2 monitoring technique.
X
Tiltmeters Resolves small changes in elevation of the ground surface resulting from CO2 injection at depth using tiltmeters on the ground.
B X X
InSAR / DInSAR Uses satellite-based radar to measure changes in the elevation of the ground surface resulting from CO2 injection at depth.
B X X X
Soil gas / vadose zone / shallow aquifer mMonitoring wells in the shallow subsurface are used to collect samples to check for changes in CO2 concentrations, as well as changes in isotope ratios, concentrations of tracers, and other markers that might indicate CO2 leakage.
B X X X X X X
Tracers Impurities that are highly detectable at low concentrations and not naturally present in the subsurface or the CO2 stream are introduced into the injectate prior to injection. Detectors used at the surface and in internediate water-bearing zones can look for these trace gases to determine if CO2 is leaking from the storage interval.
X X X X
Atmospheric monitoring Monitoring of the wellhead and other areas above the plume. This can include eddy covariance, LIDAR and other forms of CO2 detection.
B X X X X X
B: Baseline needed for future phases.
23

Appendix A: References
Ambrose WA, C Breton, MH Holtz, V Núñez-López, SD Hovorka and IJ Duncan. “CO2 source-sink matching in the lower 48 United States, with examples from the Texas Gulf Coast and Permian Basin.” Environmental Geology27 June 2008 DOI 10.1007/s00254-008-1430-x Battelle, 2007. MRCSP- Michigan Basin Geologic CO2 Sequestration Field Test. Carbon Sequestration Meeting Open House, July 18, 2007 Bennaceur, Kamel, Gielen Dolf. “Energy Technology Modeling of Major Carbon Abatement Options.” Energy Procedia, Volume 1, Issue 1, GHGT9 Procedia, February 2009, Pages 4297-4306, ISSN 1876-6102, DOI: 10.1016/j.egypro.2009.02.242. Benson, S. 2009. “Carbon Dioxide Capture and Sequestration in Deep Geological Formations.” Presented at Natural Resources Defense Council and Environmental Defense Carbon Capture & Sequestration Public Workshops, New York City, NY on March 5, 2009. Washington, D.C. March 6, 2009. PNNL-SA-64828. Bleizeffer, Dustin. 2008. Oil price drives CO2 venting issue. Star-Tribune, May 18, 2008. Eliane Blomen, Chris Hendriks, Filip Neele, Capture technologies: Improvements and promising developments, Energy Procedia, Volume 1, Issue 1, Greenhouse Gas Control Technologies 9, Proceedings of the 9th International Conference on Greenhouse Gas Control Technologies (GHGT-9), 16-20 November 2008, Washington DC, USA, February 2009, Pages 1505-1512, ISSN 1876-6102, DOI: 10.1016/j.egypro.2009.01.197. Bradley, T. 2005. Kinder Morgan CO2 presentation. 2005_Analyst_Conf_02_CO2.pdf). Carey, J. William, Marcus Wigand, Steve J. Chipera, Giday WoldeGabriel, Rajesh Pawar, Peter C. Lichtner, Scott C. Wehner, Michael A. Raines, George D. Guthrie Jr., Analysis and performance of oil well cement with 30 years of CO2 exposure from the SACROC Unit, West Texas, USA, International Journal of Greenhouse Gas Control, Volume 1, Issue 1, 8th International Conference on Greenhouse Gas Control Technologies - GHGT-8, April 2007, Pages 75-85, ISSN 1750-5836, DOI: 10.1016/S1750-5836(06)00004-1. Chadwick A, R Arts, O Eiken, P Williamson, G Williams. 2006. “Geophysical Monitoring of the CO2 Plume at Sleipner, North Sea.” In Advances in the Geological Storage of Carbon Dioxide, S Lombardi, et al., eds., pp 303-314. Chadwick A, R Arts, C Berstone, F May, S Thibeau, P Zweigel. 2007. Best Practice for the Storage of CO2 in Saline Aquifers: Observations from the SACS and CSTORE projects. Carbon Capture Journal. 2008. “StatoilHydro begins CO2 injection at Snøhvit.” April 25, 2008. http://www.carboncapturejournal.com/displaynews.php?NewsID=202&PHPSESSID=232 Dakota Gasification Company. 2009. “CO2 Pipeline” webpage. http://www.dakotagas.com/Gas_Pipeline/CO2_Pipeline/index.html
24

Dooley JJ, RT Dahowski, and CL Davidson. 2009 "Comparing Existing Pipeline Networks with the Potential Scale of Future U.S. CO2 Pipeline Networks." Energy Procedia Volume 1, Issue 1, February 2009, Pages 1595-1602. GHGT9 Procedia doi:10.1016/j.egypro.2009.01.209 Dooley JJ, CL Davidson, RT Dahowski, MA Wise, N Gupta, SH Kim, EL Malone, "Carbon Dioxide Capture and Geologic Storage: A Key Component of a Global Energy Technology Strategy to Address Climate Change." Joint Global Change Research Institute, Battelle Pacific Northwest Division. May 2006. PNWD-3602. College Park, MD. Ebrom D, D Buddery, G Watts, B Taylor. 2007. “Monitoring Activities at In Salah.” In Proceedings of the Eighth International Conference on Greenhouse Gas Control Technologies, Trondheim, Norway. Edmonds, J.A., M.A. Wise, J.J. Dooley, S.H. Kim, S.J. Smith, P.J. Runci, L.E. Clarke, E.L. Malone, and G.M. Stokes. 2007. Global Energy Technology Strategy Addressing Climate Change: Phase 2 Findings from an International Public-Private Sponsored Research Program. Joint Global Change Research Institute, College Park, MD. Environmental Leader. 2008. “Exxon Bets $100M On Test To Clean CO2 From Natural Gas.” May 6, 2008. http://www.environmentalleader.com/2008/05/06/exxon-bets-100m-on-test-to-clean-co2-from-natural-gas/ Federal Register. 2008. 40 CFR Parts 144 and 146 Federal Requirements Under the Underground Injection Control (UIC) Program for Carbon Dioxide (CO2) Geologic Sequestration (GS) Wells; Proposed Rule, Friday, July 25, 2008 Federal Register/Vol. 73, No. 144 pp. 43492-43541. Figueroa, J.D., Fout, T., Plasynski, S., McIlvried, H., Srivastava, R.D. “Advances in CO2 capture technology-The U.S. Department of Energy's Carbon Sequestration Program (2008) International Journal of Greenhouse Gas Control, 2 (1), pp. 9-20. Giese R, J Henninges, S Lüth, D Morozova, C Schmidt-Hattenberger, H Würdemann, M Zimmer, C Cosma, C Juhlin, and CO2SINK Group. 2009. “Monitoring at the CO2SINK Site: A Concept Integrating Geophysics, Geochemistry and Microbiology.” GHGT9. Energy Procedia. Global Energy Network Institute. 2009. “DOE Partner Begins Injecting 50,000 Tons of Carbon Dioxide in Michigan Basin.” Mar 2, 2009 http://www.geni.org/globalenergy/library/technical-articles/carbon-capture/doe/doe-partner-begins-injecting-50000-tons-of-carbon-dioxide-in-michigan/index.shtml Hargrove, B. 2006, “Status of CO2 EOR”, Presented at 12th Annual CO2 Conference, The Woodlands, TX, December 5, 2006. Available electronically at http://www.spe-pb.org/attachments/articles/89/2-6-Hargrove-Trinity%20CO2-PBStatusCO2.pdf Herzog, H. 1999. “An Introduction to CO2 Separation and Capture Technologies.” MIT Energy Laboratory Working Paper. August, 1999 Hirata T., Shinya Kishimoto, Masaki Iijima, Tsuyoshi Ohishi, Kazuo Higaki and Ronald Mitchell. 2008. “Current Status of MHI’s CO2 Recovery Technology and Optimization of CO2 Recovery Plant with a PC Fired Power Plant.” Presentation made at 9TH International Conference on Greenhouse Gas Control Technology. November – 17, 2008, Washington DC
25

Neville Holt. 2008. “CO2 Capture from Fossil Energy Power Plants – Status, Risks and Economics” Presented at the NARUC Staff Subcommittee on Accounting and Finance Meeting. New Orleans, LA. March 31, 2008 Hovorka SD, PR Knox. 2003. “Frio Brine Sequestration Pilot in the Texas Gulf Coast.” GHGT5. Hovorka SD. 2005. “Update on the Frio Pilot Brine Injection Experiment – Six Months After Injection.” Available online at http://www.beg.utexas.edu/environqlty/co2seq/fieldexperiment.htm. International Energy Agency (IEA). “CO2 Capture and Storage -- A Key Carbon Abatement Option. “ 266 pages, ISBN 978-92-64-041400. Paris. IEA GHG 2009. R, D & D Projects Database. International Energy Agency’s Greenhouse Gas Control Programme. www.co2captureandstorage.info Site Accessed May 2009. Masaki Iijima, Ronald Mitchell and Steven Holton. 2009. “Mitsubishi Heavy Industries Approach to Commercialization of Post Combustion CO2 Capture Technology for Coal Fired Power Plants.” EIGHTH Annual Conference on Carbon Capture & Sequestration. May 4 – 7, 2009. Pittsburgh, Pennsylvania IPCC, 2007: Climate Change 2007: Mitigation. Contribution of Working Group III to the Fourth Assessment Report of the Intergovernmental Panel on Climate Change [B. Metz, O.R. Davidson, P.R. Bosch, R. Dave, L.A. Meyer (eds)], Cambridge University Press, Cambridge, United Kingdom IPCC, 2005 - Bert Metz, Ogunlade Davidson, Heleen de Coninck, Manuela Loos and Leo Meyer (Eds.) Cambridge University Press, UK. pp 431. Kubek, Dan. 2009. “Large CO2 Sources & Capture Systems.” Workshop on Future Large CO2 Compression Systems. Sponsored by EPRI / DOE / NIST. Gaithersburg, MD. March 30, 2009. http://www.nist.gov/eeel/high_megawatt/upload/2_3-Kubek-Approved.pdf Late, Mona. 2008. Statoil CO2 Storage Projects. Available online at http://myaker.net/_upl/nr_6_-_co2_storage_projects_-_aker_cc_opening_risavika1.pdf Hari Prasad Mangalapally, Ralf Notz, Sebastian Hoch, Norbert Asprion, Georg Sieder, Hugo Garcia, Hans Hasse, Pilot plant experimental studies of post combustion CO2 capture by reactive absorption with MEA and new solvents, Energy Procedia, Volume 1, Issue 1, Greenhouse Gas Control Technologies 9, Proceedings of the 9th International Conference on Greenhouse Gas Control Technologies (GHGT-9), 16-20 November 2008, Washington DC, USA, February 2009, Pages 963-970, ISSN 1876-6102, DOI: 10.1016/j.egypro.2009.01.128. MIT (Massachusetts Institute of Technology), The Future of Coal in a Carbon Constrained World, http://mit.edu/coal, (2007). McFarland, J.R., Herzog, H.J., Reilly, J.M. 2003: Economic modeling of the global adoption of carbon capture and sequestration technologies, In: J. Gale and Y. Kaya (eds.), Greenhouse Gas Control Technologies: Proceedings of the Sixth International Conference on Greenhouse Gas Control Technologies, Kyoto, Japan, Elsevier Science, Oxford, UK. Meyer, J.P. 2007. Summary of Carbon Dioxide Enhanced Oil Recovery (CO2 EOR) Injection Well Technology. Prepared for the American Petroleum Institute. http://www.api.org/aboutoilgas/sectors/explore/upload/07APICO2EORReportFinal.pdf.
26

Moritis, Guntis. 2008. SPECIAL REPORT: More US EOR projects start but EOR production continues decline. Oil and Gas Journal. Volume 106 Issue 15. Apr 21, 2008. Oil and Gas Journal. 2008. “Enhanced Oil Recovery Survey - 2008.” Oil and Gas Journal - Volume 106 : Issue 15. April 21, 2008. Onuma T and S Ohkawa. 2009. “Detection of surface deformation related with CO2 injection by DInSAR at In Salah, Algeria.” GHGT9. Energy Procedia. Myria Perry and Daren Eliason. 2004 “CO2 Recovery and Sequestration at Dakota Gasification Company Paper presented at Western Fuels Symposium and Gasification Technology Conference. Billings, Montana. October 12-14. 2004. Preston D. Jordan and Sally M. Benson. 2009. “Well blowout rates and consequences in California Oil and Gas District 4 from 1991 to 2005: implications for geological storage of carbon dioxide.” Environmental Geology. Volume 57, Number 5. pages 1103–1123 DOI 10.1007/s00254-008-1403-0. Bruce M. Sass. “Purity Specifications for Commodity Uses of Carbon Dioxide in the United States.” Battelle. October 25, 2002. Smyth, R. C., Holtz, M. H., and Guillot, S. N., 2006, Assessing impacts to groundwater from CO2-flooding of SACROC and Claytonville oil fields in West Texas, in Proceedings of the 2006 UIC Conference of the Groundwater Protection Council, Abstract 15. GCCC Digital Publication Series #06-04. Spangler, Lee. Congressional Testimony to the United States Senate Committee on Energy and Natural Resources; Honorable Jeff Bingaman, Chairman. March 26, 2008. Bismarck, ND. Available electronically at http://energy.senate.gov/public/_files/SpanglerTestimony032608.doc Statoil. 2009. Snohvit Environment and Technology. http://www.snohvit.com/STATOILCOM/snohvit/svg02699.nsf?OpenDatabase&lang=en Webpage accessed May 2009. Statoil Press Release. 2009. “Storing 10 million tonnes of CO2” http://www.statoilhydro.com/en/NewsAndMedia/News/2008/Pages/C02Capture10000.aspx Lars Strömberg, Göran Lindgren, Jürgen Jacoby, Rainer Giering, Marie Anheden, Uwe Burchhardt, Hubertus Altmann, Frank Kluger and Georg-Nikolaus Stamatelopoulos. “Update on Vattenfall’s 30 MWth Oxyfuel Pilot Plant in Schwarze Pumpe.” Energy Procedia: GHGT9 Procedia Volume 1, Issue 1, February 2009, Pages 581-589. SourceWatch. 2009. “Argus Cogeneration Plant.” Webpage last modified April 18, 2009. http://www.sourcewatch.org/index.php?title=Argus_Cogeneration_Plant U.S. Department of Transportation, Pipeline and Hazardous Materials Safety Administration, Office of Pipeline Safety. 2007. “Natural Gas Transmission Pipeline Annual Mileage Database.” http://ops.dot.gov/stats/stats.htm. Last updated. 07/30/2007.
27

United States Geological Survey. 2005. Using Magnetic Surveys for Locating Abandoned Wells: USGS Fact Sheet 163-95. Available electronically at http://pubs.usgs.gov/fs/fs-0163-95/FS163-95.html. Vattenfall Press Release. 2008. http://www.vattenfall.com/www/co2_en/co2_en/879177tbd/879211pilot/index.jsp Vattenfall Press Release. 2009. “New technology for CO2 compression to be installed in Schwarze Pumpe” 2009-04-01. http://www.vattenfall.com/www/co2_en/co2_en/399862newsx/404068press/index.jsp?pmid=77737 White, Don. 2007. “MMV Programs in the Final Phase of the IEAGHG Weyburn-Midale CO2-EOR Monitoring and Storage Project.” Presented at the Fourth Meeting of the International Energy Agency Greenhouse Gas Programme Monitoring Network. Available online at http://www.co2captureandstorage.info/docs/monitoring/4thMtg/Day%202/white_iea_wsIV_edmonton07.pdf Wilson M, and Monea M (Editors) 2004. “IEA GHG Weyburn CO2 Monitoring and Storage Project Summary Report 2000–2004. 7th International Conference on Greenhouse Gas Control Technologies: 5–9 September 2004, Vancouver, Canada. 2004. Wright I, M Keddam, P Ingsoy. 2005. Carbon Dioxide Storage Assurance Project: Report on Year 1. NETL Annual Conference on CO2 Sequestration. Yoshimura, Tsukasa. 2007. “Nagaoka, Japan Monitoring/Verification Program Design, Deployment and Case History.” Presented at the Fourth Meeting of the International Energy Agency Greenhouse Gas Programme Monitoring Network. Available online at http://www.co2captureandstorage.info/docs/monitoring/4thMtg/Day%202/T.Yoshimura2.pdf
28

Appendix B: Online Resources Tracking CCS Demonstration Projects and Planned Commercial CCS Facilities
• IEA Greenhouse Gas R&D Programme: CO2 Capture and Storage Info. An extensive searchable database of CCS research projects around the world.
http://www.co2captureandstorage.info/search.php
• National Energy Technology Laboratory: Regional Carbon Sequestration Partnerships. List general information on the Regional Carbon Sequestration Partnership program sponsored by the U.S. Department of Energy and contains links to more detailed information about specific research activities being carried out by these public-private CCS research partnerships.
http://www.netl.doe.gov/technologies/carbon_seq/partnerships/partnerships.html
• Scottish Centre for Carbon Storage. “Where is CO2 Storage Taking Place?” An interactive map of operational and planned CCS facilities.
http://www.geos.ed.ac.uk/sccs/storage/storageSitesFree.html
• The Australian Cooperative Research Centre for Greenhouse Gas Technologies (CO2CRC) has two interactive maps of ongoing and proposed CO2 storage demonstration projects around the world.
http://www.co2crc.com.au/demo/worldprojects.html and http://www.co2crc.com.au/demo/worldprojects_pro.html
29

Appendix C: Overview of Principal CO2 Capture System Configurations that Could Be Applied to Large Commercial Power Plants
(IPCC 2005)
30

Appendix D: Brief Summary of Commercially Available Absorption-based CO2 Capture Systems While there are many different advanced CO2 capture technologies under development with some in the field testing stage (see Figueroa, et. al., 2008 for an overview of developments in CO2 capture), the following are short descriptions of the CO2 capture technologies in use at the commercial facilities described in the body of this paper. The table on the next page provides further elaboration on the CO2 capture systems in use today (International Energy Agency, 2008). Post Combustion CO2 Capture Technologies Monoethanolamine (MEA) and a number of related amines are the most commonly employed CO2 capture systems today. MEA was developed over 70 years ago as a robust (i.e., relatively low cost and capable of being deployed in a variety of different circumstances) solvent for removing gases, such as CO2 and H2S, from produced natural gas before introducing the natural gas into pipelines to send to market. The basic MEA process has been modified over time to better tune it to the new task of CO2 capture from combustion flue gas streams. One particular innovation in this regard was the incorporation of incorporate inhibitors to resist solvent degradation and corrosion in the steel components of the CO2 capture unit (Herzog, 1999).
• The Kerr-McGee/ABB Lummus Crest Process is employed to recover CO2 from coke and coal-fired boilers. This process uses a 15-20% by weight aqueous MEA solution. The largest capacity experienced for this process is 800 tCO2 d system utilizing two parallel trains (IPCC, 2005).
• The Fluor Daniel ECONAMINE Process is another MEA-based CO2 capture process. The
Econamine process uses a 30% by weight aqueous solution of MEA in conjunction with inhibitors that are designed to prevent corrosion in the carbon steel components of the CO2 capture system. The Econamine process was specifically tailored for CO2 capture from oxygen rich gas streams. It has been used in many plants worldwide recovering up to 320 tCO2/d in a single train. (IPCC, 2005).
• The Kansai Electric Power Co., Mitsubishi Heavy Industries, Ltd., KEPCO/MHI KS-1 Process
utilizes a proprietary sterically-hindered amines. The KS-1 amine was specifically designed for CO2 extraction from natural gas combustion. Other amines are more widely applicable to other process streams and other sectors of the economy. Over a decade’s worth of commercial experience using the KS-1 process, data have been collected that show that this process experiences relatively low amine losses and low degradation of the solvent over time without the need to use inhibitors (Yagi, et. al., 2008). The energy required to regenerate the KS-1 solvent can be 20% less than a similar MEA based system (Mangalapally, et. al., 2009). It has been used in many plants worldwide recovering up to 450 tCO2/d in a single train (Ijiima, et. al., 2009).
Pre-Combustion CO2 Capture Technologies For pre-combustion CO2 capture systems, the CO2 is typically removed by a physical solvent process. The two most commonly used systems are based around Selexol (a glycol-based solvent marketed by Union Carbide) and Rectisol (a refrigerated methanol-based physical capture system marketed by Lurgi and Linde) (IPCC, 2005 and Blomen, et. al., 2009). Physical solvents are typically used for pre-combustion separation of acid gases including CO2 and H2S from synthesis gas streams such as those found synfuel plants as well as IGCC power plants with CO2 capture. The Dakota Gasification Great
31
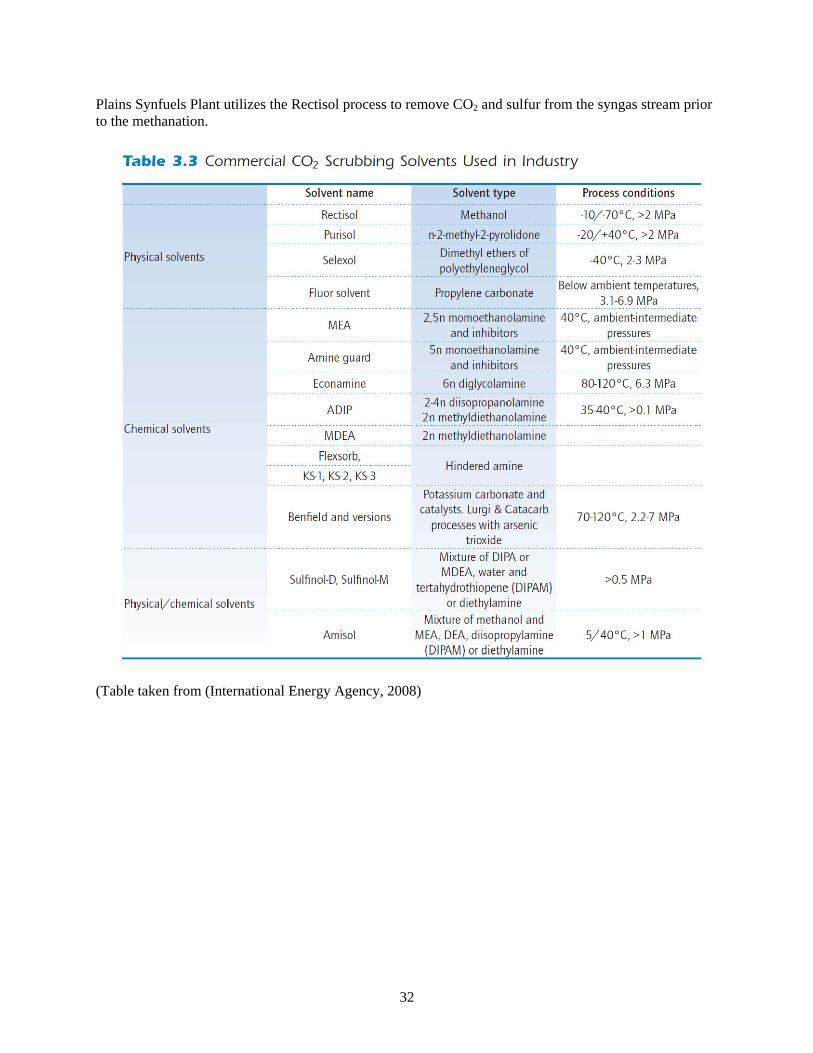
Plains Synfuels Plant utilizes the Rectisol process to remove CO2 and sulfur from the syngas stream prior to the methanation.
(Table taken from (International Energy Agency, 2008)
32

33
Appendix E: CO2 Purity Specifications for Various Classes of Use
(Sass, 2005) Notes: Table units are in ppm (v/v) unless otherwise noted. A blank indicates no maximum limiting characteristic.


