1 AgriProbe | December 2011 Research and news magazine of the Western Cape Department of Agriculture Nuus en navorsingstydskrif van die Wes-Kaapse Departement van Landbou UPhando neemagazine zeendaba zeSebe IezoboLimo IeNtshona Koloni VOL 8 NO.4 | DECEMBER 2011 AN EASY WAY TO MONITOR REPRODUCTION MANAGEMENT IN DAIRY HERDS The ADDED BENEFITS of BIOGAS production on an animal farm BUFFALOES CONTINUE THEIR MOMENTUM IN GRABBING MEDIA ATTENTION
Transcript
1AgriProbe | December 2011
Research and news magazine of the Western Cape Department of AgricultureNuus en navorsingstydskrif van die Wes-Kaapse Departement van Landbou
AN EASy WAy tO MONItOR REPRODUCtION MANAgEMENt IN DAIRy hERDS
the ADDED BENEFItS of BIOgAS production on an animal farm
BUFFALOES CONtINUE thEIR MOMENtUM IN gRABBINg
MEDIA AttENtION
2 AgriProbe | December 2011 3AgriProbe | December 2011
SPECIAL FEAtURES
SPESIALE ARtIKELS
The Red Meat Commodity Work Group approach towards future farmer support in The Eden District - HJF Grobler
Rural layer baseline compilation in the Eden District - Ian Terblanche
Aquaculture: the emerging commodity - Ferdie Endemann
An easy way to monitor reproduction management in dairy herds - Dr Carel Muller
MSD (Intervet) bied dieregesondheid kursus aan op Elsenburg - Dr Tertius Brand
The Added Benefits of BIOGAS production on an animal farm - Johan Roux
Truffles - What they are and what they mean to South Africans - Lizette Nowers
Shifting Targets: Taking a bead on export markets - Dr Dirk Troskie
Buffaloes continue their momemtum in grabbing Media attention - Riaan Nowers
The Western Cape to share in the Development of Renewable Energy - Dr Fernel Abrahams
Crop agriculture, pollination and the honeybee - Carol Poole
SASAT Awards - Resia Swart
Western Cape Agriculture signs ground-breaking deal with Landowners - Heather Dalton
Western Cape Government attended The Fifth Yantai International Wine Festival, 23 - 26 September 2011, Shandong Province, China - Bongiswa Matoti
ELSENBURg JOURNAL
ELSENBURg JOERNAAL
Short term effects of soil tillage and crop sequence on the production potential of wheat on shale derived soils of the Western Cape - Johan Labuschagne, Dr Mark Hardy, Willie Langenhoven and Heinrich van Zyl
Water & Agriculture: Critical Interface for Rural Development - Tania Gill
Die invloed van behuisingstipe en vloerbedekking op die groei en oorlewing van volstruiskuikens tot op een maand - Anel Engelbrecht, Stefan Engelbrecht, Dr Carel Muller en Dr Schalk Cloete
If you need any of the articles in this magazine in any other of the official languages of the Western Cape, we would be happy to arrange a translation for you. Please contact the editor on Tel: 021 808 5008.
Indien u enige van die artikels in hierdie tydskrif in een van die ander amptelike tale van die Wes-Kaap benodig, kan u ons gerus kontak om die vertaling daarvan te reël. Kontak die redakteur by Tel: 021 808 5008.
Message from gerrit van Rensburg, Minister of Agriculture and Rural Development
“In the light of ever increasing electricity costs, farmers need
to investigate alternative measures to offset their production
cost”, Gerrit van Rensburg, Western Cape Minister of
Agriculture and Rural Development said at the recent Agri
Western Cape Congress held in Goudini.
Van Rensburg referred to the Western Cape’s relationship
with Upper Austria in the Regional Leaders Summit. “Upper
Austria is 20 years ahead of us regarding the generation of
electricity on farms, using farm produced materials” he said.
This technology utilises biogas from products such as wood
chips or manure to generate electricity.
Upper Austria currently has 75 biogas plants, of which 45 are
run by farmers. It generates 34% of the regions electricity
usage, and their aim is to increase this to 100% by 2030, Van
Rensburg told delegates.
“We need a mind shift in the Western Cape from trying to save
as much electricity usage as possible to one of finding ways
to generate as much electricity as possible on our farms”,
Van Rensburg said. The Western Cape Department is in
the process of constructing a biogas plant on its Outeniqua
research farm, where electricity will be generated using cow
manure from its dairy. This plant will come into operation
in 2012.
Van Rensburg said the Western Cape Department of
Agriculture is prepared to sponsor a leading expert in the
field of biogas electricity generation from Upper Austria to
visit and assist local farmers with the implementation of
this technology.
Carl Opperman, CEO of Agri Western Cape, reacted positively
to this announcement. “We need to investigate all the different
options available in order to reduce producer input cost, with
electricity being a major one”.
Opperman also said this technology could have positive
spinoffs such as the creation of additional employment
opportunities, and generating income from selling surplus
electricity into the national grid. We could do this, whilst at
the same time reducing our products’ carbon footprint. “With
greener products there is the potential of additional market
access for our export produce”, Opperman said.
Welcome to our last edition for 2011! The agricultural sector
received an immense amount of publicity this year – ranging
from the Green Paper on Land Reform to surely the highlight of
2011, COP 17!
COP 17 not only placed renewed attention on our vulnerable
earth and its resources, but also urged US to “get our house
in order”. US referring to the world, its people, but more so, its
agriculture.
For this reason we are focussing contributions in this edition
on renewable energy (“The Western Cape to share in the
development of renewable energy”), biogas production (“The
added benefits of biogas production on an animal farm”) and
water as a critical resource (“Water and agriculture – critical
interface for rural development”). An interesting article also
focuses on “Crop agriculture, pollination and the honeybee” –
those little creatures that we take for granted without realising
their pivotal role in our fruit and other agricultural industries.
But it is not only about renewable energy and other mitigating
and adaptation issues – it is about climate-smart agriculture as
an African and South African priority. Ensuring food security in a
changing climate is one of the major challenges facing the globe
in the 21st century and for Africa to achieve its development
goals, climate change adaptation is a priority. The world,
including Africa as the greenest continent, stands to benefit
from climate-smart agriculture because of the vulnerability of
rural populations to climate change and their dependence on
agriculture for livelihoods. The Minister of Agriculture, Forestry
and Fisheries, Tina Joemat-Pettersson, has placed the concept
of climate-smart agriculture in the spotlight whilst hosting the
“African Ministers in Agriculture Conference (with the theme
“Climate-Smart Agriculture Africa: A Call to Action”) on Climate-
Smart Agriculture” in September as a curtain raiser for the
17th Conference of the Parties (COP 17) of the United Nations
Framework Convention on Climate Change (UNFCCC).
In 2012, Climate-Smart Agriculture will be our slogan – taking
agriculture in the Western Cape forward in a climate-smart and
resource-wise way! Join us in this effort!
We wish you a happy festive season and a prosperous 2012!
CONtENtINhOUD
4 AgriProbe | December 2011 5AgriProbe | December 2011
Introduction
The Commodity Approach in agricultural project support in the Western Cape and the revitalisation of extension aims to ensure improved project success with progressing farmers. Against this backdrop a coordinated/programmed approach to red meat project development and support is followed in the Eden district. The process is coordinated by an established multi-disciplinary Red Meat Work Group consisting of members from the public and private sector as well as the red meat commodity organisations.
This article will point out the broad components involved in programme development with a schematic outline of the development process/timeline.
Components involved in Programme Development and Support
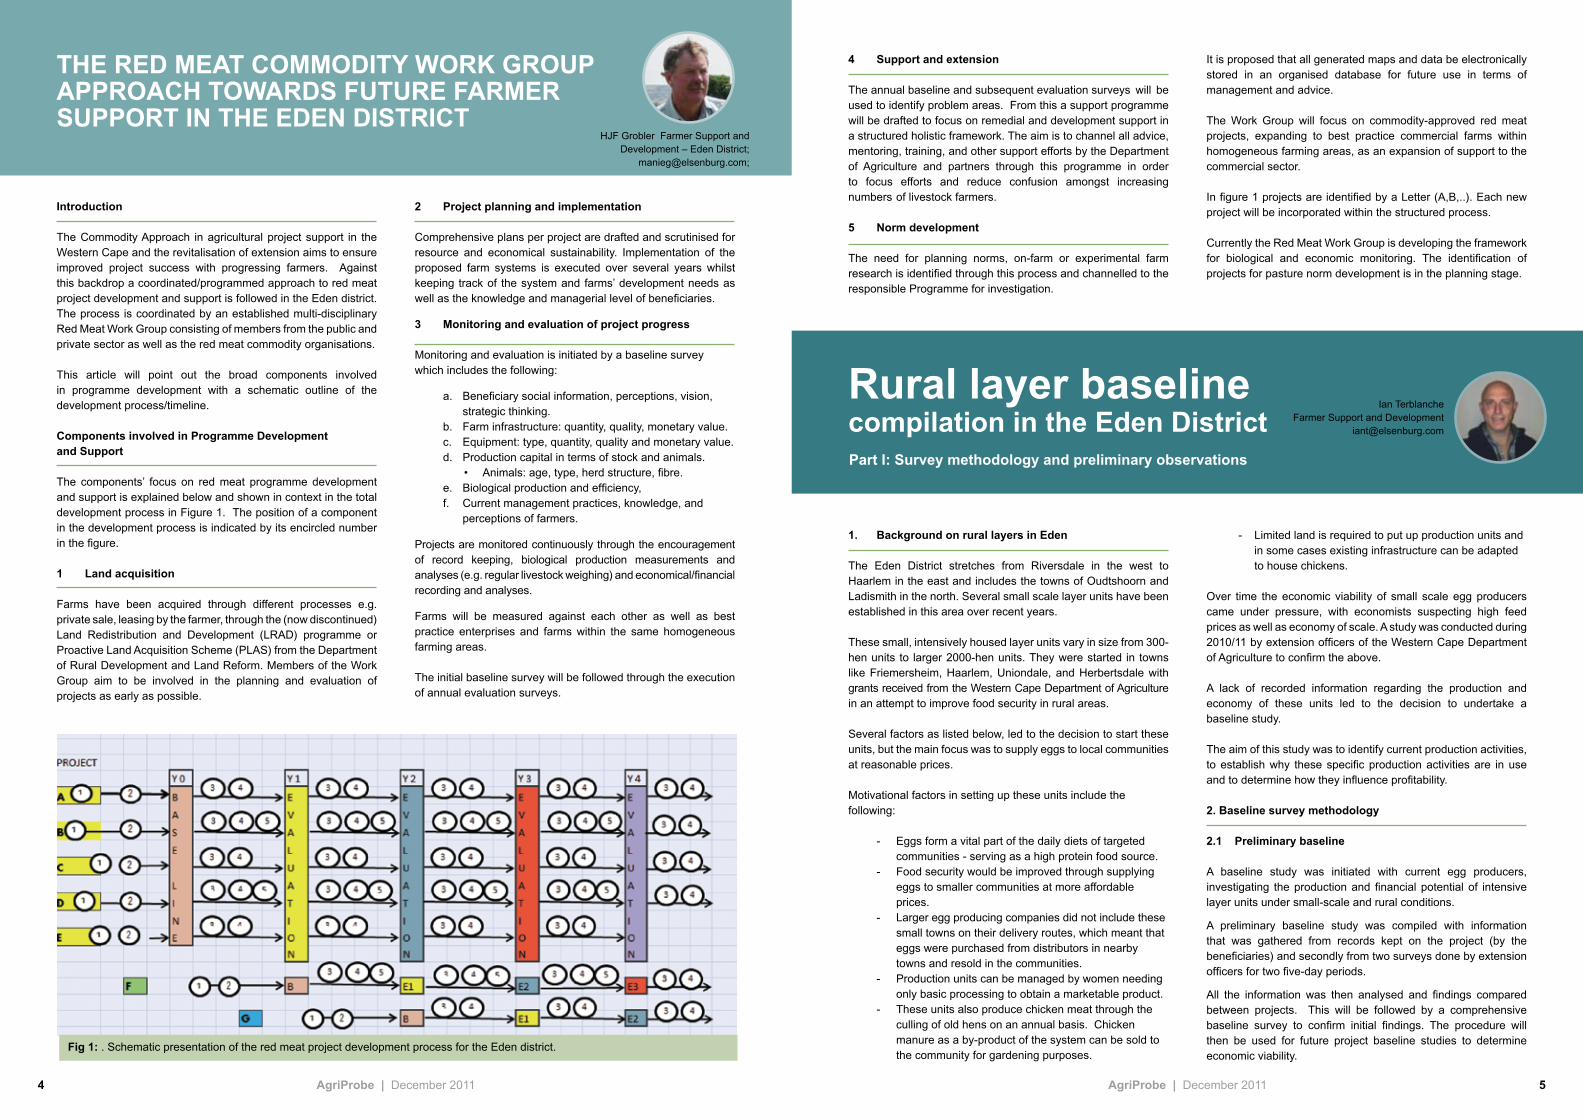
The components’ focus on red meat programme development and support is explained below and shown in context in the total development process in Figure 1. The position of a component in the development process is indicated by its encircled number in the figure.
1 Land acquisition
Farms have been acquired through different processes e.g. private sale, leasing by the farmer, through the (now discontinued) Land Redistribution and Development (LRAD) programme or Proactive Land Acquisition Scheme (PLAS) from the Department of Rural Development and Land Reform. Members of the Work Group aim to be involved in the planning and evaluation of projects as early as possible.
1. Background on rural layers in Eden
The Eden District stretches from Riversdale in the west to Haarlem in the east and includes the towns of Oudtshoorn and Ladismith in the north. Several small scale layer units have been established in this area over recent years.
These small, intensively housed layer units vary in size from 300-hen units to larger 2000-hen units. They were started in towns like Friemersheim, Haarlem, Uniondale, and Herbertsdale with grants received from the Western Cape Department of Agriculture in an attempt to improve food security in rural areas.
Several factors as listed below, led to the decision to start these units, but the main focus was to supply eggs to local communities at reasonable prices. Motivational factors in setting up these units include the following:
- Eggs form a vital part of the daily diets of targeted communities - serving as a high protein food source. - Food security would be improved through supplying eggs to smaller communities at more affordable prices. - Larger egg producing companies did not include these small towns on their delivery routes, which meant that eggs were purchased from distributors in nearby towns and resold in the communities. - Production units can be managed by women needing only basic processing to obtain a marketable product. - These units also produce chicken meat through the culling of old hens on an annual basis. Chicken manure as a by-product of the system can be sold to the community for gardening purposes.
4 Support and extension
The annual baseline and subsequent evaluation surveys will be used to identify problem areas. From this a support programme will be drafted to focus on remedial and development support in a structured holistic framework. The aim is to channel all advice, mentoring, training, and other support efforts by the Department of Agriculture and partners through this programme in order to focus efforts and reduce confusion amongst increasing numbers of livestock farmers.
5 Norm development
The need for planning norms, on-farm or experimental farm research is identified through this process and channelled to the responsible Programme for investigation.
2 Project planning and implementation
Comprehensive plans per project are drafted and scrutinised for resource and economical sustainability. Implementation of the proposed farm systems is executed over several years whilst keeping track of the system and farms’ development needs as well as the knowledge and managerial level of beneficiaries. 3 Monitoring and evaluation of project progress
Monitoring and evaluation is initiated by a baseline survey which includes the following:
a. Beneficiary social information, perceptions, vision, strategic thinking. b. Farm infrastructure: quantity, quality, monetary value. c. Equipment: type, quantity, quality and monetary value. d. Production capital in terms of stock and animals. • Animals: age, type, herd structure, fibre. e. Biological production and efficiency, f. Current management practices, knowledge, and perceptions of farmers.
Projects are monitored continuously through the encouragement of record keeping, biological production measurements and analyses (e.g. regular livestock weighing) and economical/financial recording and analyses.
Farms will be measured against each other as well as best practice enterprises and farms within the same homogeneous farming areas.
The initial baseline survey will be followed through the execution of annual evaluation surveys.
- Limited land is required to put up production units and in some cases existing infrastructure can be adapted to house chickens.
Over time the economic viability of small scale egg producers came under pressure, with economists suspecting high feed prices as well as economy of scale. A study was conducted during 2010/11 by extension officers of the Western Cape Department of Agriculture to confirm the above.
A lack of recorded information regarding the production and economy of these units led to the decision to undertake a baseline study.
The aim of this study was to identify current production activities, to establish why these specific production activities are in use and to determine how they influence profitability.
2. Baseline survey methodology
2.1 Preliminary baseline
A baseline study was initiated with current egg producers, investigating the production and financial potential of intensive layer units under small-scale and rural conditions.
A preliminary baseline study was compiled with information that was gathered from records kept on the project (by the beneficiaries) and secondly from two surveys done by extension officers for two five-day periods.
All the information was then analysed and findings compared between projects. This will be followed by a comprehensive baseline survey to confirm initial findings. The procedure will then be used for future project baseline studies to determine economic viability.
It is proposed that all generated maps and data be electronically stored in an organised database for future use in terms of management and advice.
The Work Group will focus on commodity-approved red meat projects, expanding to best practice commercial farms within homogeneous farming areas, as an expansion of support to the commercial sector.
In figure 1 projects are identified by a Letter (A,B,..). Each new project will be incorporated within the structured process.
Currently the Red Meat Work Group is developing the framework for biological and economic monitoring. The identification of projects for pasture norm development is in the planning stage.
thE RED MEAt COMMODIty WORK gROUP APPROACh tOWARDS FUtURE FARMER SUPPORt IN thE EDEN DIStRICt
HJF Grobler Farmer Support and Development – Eden District;
Part I: Survey methodology and preliminary observations
6 AgriProbe | December 2011 7AgriProbe | December 2011
The preliminary survey incorporated two five-day recordings on site within the 12-month layer production cycle. Production practices as well as deviations from standard operating procedures were investigated. Shortcomings in production practices that could influence profitability were identified. The first survey was done in November 2010. One official was committed per unit. All production activities were observed and recorded from the first feeding until egg collection and at the second feeding at the end of the day. This procedure was repeated for five consecutive days. The workers continued with their day-to-day activities and recordings were done based on the current way of execution.
the following activities were recorded:
- Minimum and maximum temperatures in the units;
- Feeding volumes per hen per day;
- Egg production per age group;
- Egg weight per age group;
- Daily activities in the house;
- Interaction between hens at different stocking densities;
- Competition between birds when there is limited feed available, and
- Position of the hen in an intensive unit (top or bottom cage).
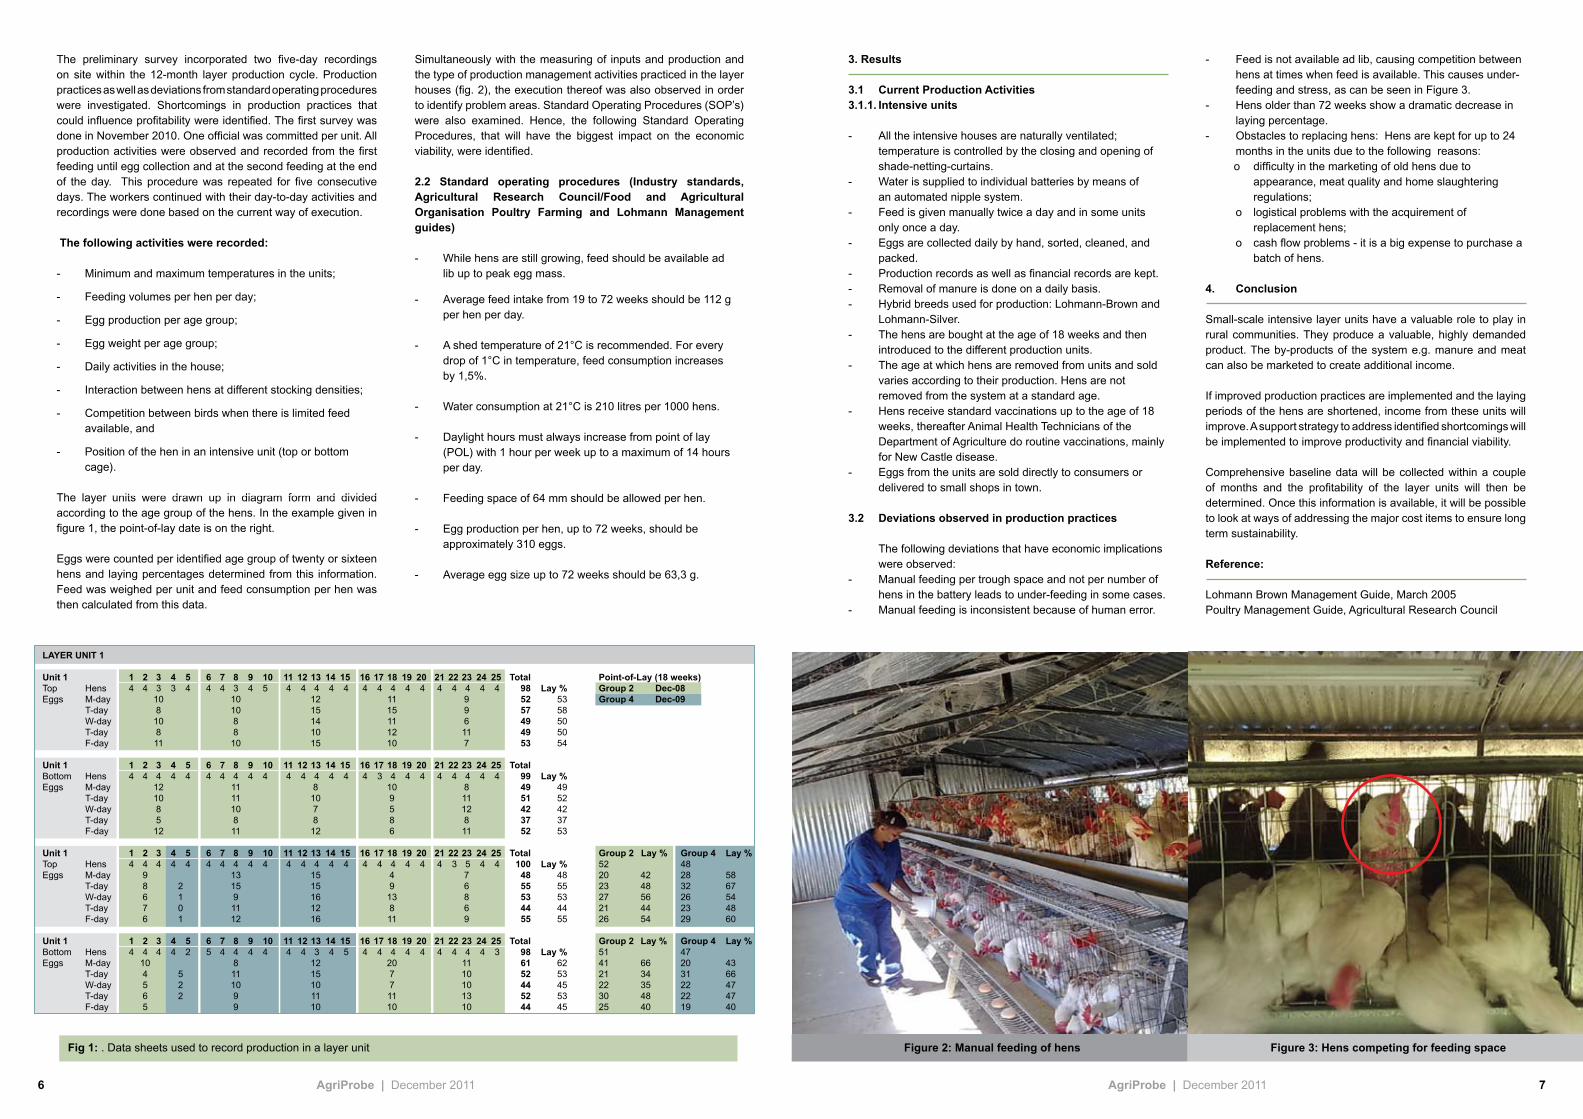
The layer units were drawn up in diagram form and divided according to the age group of the hens. In the example given in figure 1, the point-of-lay date is on the right.
Eggs were counted per identified age group of twenty or sixteen hens and laying percentages determined from this information. Feed was weighed per unit and feed consumption per hen was then calculated from this data.
3. Results
3.1 Current Production Activities3.1.1. Intensive units
- All the intensive houses are naturally ventilated; temperature is controlled by the closing and opening of shade-netting-curtains.- Water is supplied to individual batteries by means of an automated nipple system.- Feed is given manually twice a day and in some units only once a day.- Eggs are collected daily by hand, sorted, cleaned, and packed.- Production records as well as financial records are kept.- Removal of manure is done on a daily basis.- Hybrid breeds used for production: Lohmann-Brown and Lohmann-Silver.- The hens are bought at the age of 18 weeks and then introduced to the different production units.- The age at which hens are removed from units and sold varies according to their production. Hens are not removed from the system at a standard age.- Hens receive standard vaccinations up to the age of 18 weeks, thereafter Animal Health Technicians of the Department of Agriculture do routine vaccinations, mainly for New Castle disease.- Eggs from the units are sold directly to consumers or delivered to small shops in town.
3.2 Deviations observed in production practices The following deviations that have economic implications were observed:- Manual feeding per trough space and not per number of hens in the battery leads to under-feeding in some cases. - Manual feeding is inconsistent because of human error.
- Feed is not available ad lib, causing competition between hens at times when feed is available. This causes under- feeding and stress, as can be seen in Figure 3. - Hens older than 72 weeks show a dramatic decrease in laying percentage.- Obstacles to replacing hens: Hens are kept for up to 24 months in the units due to the following reasons: o difficulty in the marketing of old hens due to appearance, meat quality and home slaughtering regulations; o logistical problems with the acquirement of replacement hens; o cash flow problems - it is a big expense to purchase a batch of hens.
4. Conclusion
Small-scale intensive layer units have a valuable role to play in rural communities. They produce a valuable, highly demanded product. The by-products of the system e.g. manure and meat can also be marketed to create additional income.
If improved production practices are implemented and the laying periods of the hens are shortened, income from these units will improve. A support strategy to address identified shortcomings will be implemented to improve productivity and financial viability.
Comprehensive baseline data will be collected within a couple of months and the profitability of the layer units will then be determined. Once this information is available, it will be possible to look at ways of addressing the major cost items to ensure long term sustainability.
Reference:
Lohmann Brown Management Guide, March 2005Poultry Management Guide, Agricultural Research Council
Fig 1: . Data sheets used to record production in a layer unit
Figure 2: Manual feeding of hens Figure 3: hens competing for feeding space
Simultaneously with the measuring of inputs and production and the type of production management activities practiced in the layer houses (fig. 2), the execution thereof was also observed in order to identify problem areas. Standard Operating Procedures (SOP’s) were also examined. Hence, the following Standard Operating Procedures, that will have the biggest impact on the economic viability, were identified.
2.2 Standard operating procedures (Industry standards, Agricultural Research Council/Food and Agricultural Organisation Poultry Farming and Lohmann Management guides)
- While hens are still growing, feed should be available ad lib up to peak egg mass.
- Average feed intake from 19 to 72 weeks should be 112 g per hen per day.
- A shed temperature of 21°C is recommended. For every drop of 1°C in temperature, feed consumption increases by 1,5%.
- Water consumption at 21°C is 210 litres per 1000 hens.
- Daylight hours must always increase from point of lay (POL) with 1 hour per week up to a maximum of 14 hours per day.
- Feeding space of 64 mm should be allowed per hen.
- Egg production per hen, up to 72 weeks, should be approximately 310 eggs.
- Average egg size up to 72 weeks should be 63,3 g.
8 AgriProbe | December 2011 9AgriProbe | December 2011
Mussels are only cultivated in Saldanha, with the balance of the consumable product being imported. The current mussel production output of 500 to 600 ton annually, would have to double in order to serve the local market. Local mussel farmers would, however, have to compete with cheaper imports from the East, New Zealand and South America.
It is possible that in five or six years’ time abalone production would have increased to double its current output. Expansion of existing farms would initiate new projects, to be managed by people with vast industrial experience.
It appears as if oyster sales have stabilised in the local market. Some producers are developing new foreign markets.
In the local market there is still space for growth for the trout industry, depending on the international market tendencies for salmon and trout. Trout importation is not a viable option. The possibility of marine fin fish production in cage systems and in land-based recirculation systems is being investigated in the Western Cape, Eastern Cape, KwaZulu Natal and Mozambique.
The aquaculture industry experiences positive growth and there are ample opportunities for new farming projects. The most important factor to keep in mind, is the potential market.
The importance of aquaculture as a source of fish and other aquatic foods increases dramatically. In 2010 global aquaculture production reached a new level, to the extent that the aquacultural farming industry produced more fish, shellfish and aquatic plants than the traditional fishing industry.
Over a number of years the production of aquacultural species increased and marine fishing remained constant or, in some cases, even experienced a decrease. The consistent level of production in certain sectors of the fishing industry is attributed to the fact that it is managed through the application of the principle of maximum sustainability, i.e. the specific source is utilized optimally. In cases where the production levels decrease, it means that the practice is not sustainable. In a South African context, the abalone industry is an example of a source that is not utilized sustainably.
On a continental and global scale South Africa’s aquacultural production is relatively small. In 2008 the total aquacultural industry in South Africa measured 3 654 ton in production volume and had a total value of R327 million. Cultivated abalone (934 ton), oysters (289 ton), mussels (500 ton) and trout (943 ton) comprise the largest percentage of production.
The Western Cape leads the production in tonnage with 61% and 83% in value. Most of the farms for the abovementioned species are situated in the Western Cape.
The fertility of dairy cows is decreasing worldwide. This is mainly attributed to the continued selection for higher milk yields. Other factors that may influence this problem are larger herds which means that high-producing cows get less attention while fewer labourers are familiar with the normal reproductive cycle of dairy cows. Additional problems may be caused by poor heat observation and insemination techniques. In spite of this, many producers have very successful reproduction management programmes for their dairy herds. These producers pay particular attention to critical management indicators to prevent a decline in the reproduction management of their dairy herds as a turnaround takes a considerable time.
Many managers use calving interval (CI) as a reproduction management indicator. However, this figure could be misleading as it refers to only those cows that have calved down again. For instance, a CI of 420 days implies that only 87% of the cows in the herd have calved down within a 12-month period.
Reproduction management of a herd should be monitored on an ongoing basis so that declining trends in fertility can be observed early on. Though fertility in dairy cows is difficult to define, there are three possible indicators, namely (1) to show heat soon after calving, and (2) to become pregnant with a minimum number of inseminations and (3) to remain pregnant until the next calving.
Characteristics described by the first indicator of the definition are the interval (number of days) between the calving date and
first insemination date as well as whether first insemination was within 80 days. This is presented as a percentage.
The second indicator is the number of inseminations per conception. This shows the insemination efficiency of the inseminators. The inseminator efficiency is 50% when two inseminations per conception are required. This figure should be estimated for each inseminator. Poor performers should be retrained or replaced, while good performers should be rewarded.
The third indicator refers to the interval (number of days) between the calving date and conception date (also referred to as “days open”). From this, two additional fertility traits are obtained, i.e. whether cows became pregnant within 100 or 200 days after the last calving date. These two traits are presented as percentages.
By estimating these figures on a regular basis, for example following monthly pregnancy checks, graphs could be prepared to monitor the progress for each trait. These management indicators should be compared against available norms. In the current economic climate, producers should act according to a goal orientated plan. It is no use waiting until the milk yield of the herd is at a very low level due to many cows in the herd being in a late stage of the lactation or when only a few heifers have been born.
AN EASy WAy tO MONItOR REPRODUCtION MANAgEMENt IN DAIRy hERDS
‘n Baie suksesvolle kortkursus in dieregesondheid en gesondheidsbestuur is op 12 September 2011 op Elsenburg aangebied. Die kursus is deur dr Faffa Malan en dr Tommy Strydom (MSD, Malelaan Navorsingsplaas) aangebied. Onderwerpe vir die dag het uitwendige parasiete, inwendige parasiete asook entprogramme en hantering van entstowwe ingesluit. Die kursus is bygewoon deur Elsenburg studente, dosente, navorsers, tegnici, adviseurs asook diereproduksie plaaswerkers van die navorsing en FSD afdelings van Elsenburg, asook die Universiteit van Stellenbosch. Die dag is deur MSD geborg wat deur mnr Willem Kleyn verteenwoordig was. Die reël van die dag was die inisiatief van die Elsenburg Diereproduksie Instituut. Praktiese reëlings is deur mnr Bennie Aucamp gedoen. Dr Faffa Malan demonstreer ‘n na-doodse ondersoek aan
kursusgangers.
10 AgriProbe | December 2011 11AgriProbe | December 2011
Most pathogens are significantly reduced during the anaerobic digestion process. Fecal coliform bacteria in digestate solids equal about 1% of that in raw manure, virtually eliminating this major source of water pollution. Pathogens that cause some of the common food production diseases are practically eliminated by anaerobic digestion. Fly eggs are also killed during anaerobic digestion.
Raw animal manure contains volatile organic compounds that produce unpleasant odours. The bacteria in an anaerobic digester break down many of these odour-causing compounds, thereby eliminating almost all unpleasant odours.
Conventional liquid and slurry manure management systems emit large amounts of methane, which is regarded as a serious greenhouse gas. An anaerobic digestion system recovers this methane and puts it to good use. Biogas consists of 50-70% methane and 30-50% carbon dioxide.
Finally, energy from biogas can off-set energy that would otherwise have been derived from fossil fuels, thereby contributing to environmental protection.
Conclusion
Manure produces low biogas yields relative to feedstock from crops. Cattle and pig slurry yields approximately 20 m3 of biogas per ton, while grass and maize silage provides approximately 200 m3 per ton and maize and wheat grain approximately 600 m3 per ton. For this reason manure is often mixed and co-digested with other types of feedstock. Where manure is the only feedstock, fertiliser production and waste management benefits can do much to increase the desirability of anaerobic digestion projects.
In view of the comparative values of these benefits, it may be more appropriate to talk about anaerobic digestion rather than about biogas production in isolation. Anybody considering biogas production will be well advised to also consider fertiliser production and the value of waste management, and should investigate ways of optimising all three benefits. Such a holistic approach has a better chance of economic viability than concentrating on biogas alone.
References
AgSTAR Program. 2002. Managing Manure with Biogas Recovery Systems. United States Environmental Protection Agency (EPA).
Frame D., Madison F., Jarrel W. 2001. Anaerobic Digesters and Methane Production. University of Wisconsin.
Lukehurst C.T., Frost P., Al Seadi T. 2010. Utilisation of digestate from biogas plants as biofertiliser. The International Energy Agency (IEA) Task 37.
Minnesota Project. 2010. Anaerobic Digesters – Farm Opportunities and Pathways. The Office of Energy Security, Minnesota Department of Commerce.
Redman G. 2010. A Detailed Economic Assessment of Anaerobic Digestion Technology and its Suitability to UK Farming and Waste Systems. The Anderson Centre and the NNFCC, Leicestershire.
There is currently a lot of interest in biogas production at farm level, with the emphasis on the benefits that farmers can accrue through the use of biogas for heating and electricity generation. However, the indirect benefits of biogas projects are often neglected in cost-benefit analyses, with improved waste management and fertiliser production as key examples.
Biogas is produced through anaerobic digestion, whereby feedstock such as animal manure or other non-woody biomass is fed into an anaerobic digester. Bacteria reduce the feedstock to digestate and biogas. Biogas can be used to produce heat and generate electricity, while digestate can be applied as organic fertiliser. By converting raw animal manure into two beneficial products, effective waste management is encouraged.
Digestate As Fertiliser
Animals excrete high proportions of the plant nutrients in their diet, with 55-95% of nitrogen (N) and high proportions of phosphorus (P) and potassium (K) excreted through faeces and urine. The fertiliser value of digestate is determined by the nutrients present in the feedstock. While anaerobic digestion does not change the nutrient quantities, it does alter the organic compounds in which the nutrients are present, thus enhancing their availability to crops. For example, the large amount of organic nitrogen in the feedstock is converted to ammonium, making the nitrogen rapidly available to crops in a manner similar to commercial fertilisers. Few studies have tested the effect of anaerobic digestion on the survival rate of pathogens that affect plants. However, existing studies indicate that many disease-spreading spores can be reduced through anaerobic digestion. Studies on the destruction of weed seeds indicate that anaerobic digestion can reduce the viability of weed seeds, and also of some crop seeds.
Note that apart from highly desirable nutrients, manure can also contain small amounts of heavy metals that are introduced through the diet of the animals. Examples include Lead, Mercury, Chromium and Cadmium. These heavy metals are undesirable in fertiliser and since they are not affected by the anaerobic digestion process their presence call for careful monitoring.
Waste Management
Managing animal waste in a way that protects the environment and controls odours is one of the biggest challenges that livestock producers face. Anaerobic digestion can provide a more effective solution than conventional manure management systems.
the ADDED BENEFItS of BIOgAS production on an animal farm
Although the major aim of this project is to quantify the long-term effects of tillage practice and crop rotation on soil physical and chemical properties, as well as soil biological activity towards gaining a better understanding of soil parameters that will promote sustainability in crop production systems, this article focuses on short term effects of tillage practice and crop sequence on wheat growth and production.
Materials and Methods
The trial was conducted on two sites, Langgewens near Moorreesburg (33° 16’ 55.98’’S, 18°42’ 37.97’’ E) and Tygerhoek (34° 8’ 53.16’’S, 19° 54’ 10.08’’ E) near Riviersonderend. Each trial was laid out as a complete randomised block design with four replicates. The three crop rotation systems, allocated to main plots, were: wheat monoculture (WWWW), wheat-medic/clover-wheat-medic/clover (WMcWMc) and wheat-canola-wheat-lupin (WCWL). Sub-plots were allocated to tillage treatments 1) zero-till – soil left undisturbed and planted with a star-wheel planter causing minimum soil disturbance, 2) no-till – soil left undisturbed until planting and then planted with a tined no-till planter that results in a maximum of 20% soil disturbance to a depth of 100 mm to 150 mm in the planting row, 3) minimum till – soil scarified to a depth of 100 mm to 150 mm in late March/ early April and then planted with the no-till planter as described in 2 above and 4) conventional tillage – soil scarified to a depth of 100 mm to 150 mm in late March/ early April, then ploughed to a depth of 150 mm to 200 mm just before planting and planted with the no-till planter as described in 2 above. The wheat cultivar SST 027 was planted in all years. Crops were managed (seeding rate, fertilizer application rate, pest control measures) as prescribed by the protocols developed by the Langgewens and Tygerhoek Technical Committees. Crop growth and development, yield and quality parameters were recorded annually.
Data analysis methodology
Analysis of variance was performed using the SAS (Statistical Analysis System) version 8.2 (SAS, 1999). The Shapiro-Wilk test was performed to test for non-normality of data analysed (Shapiro & Wilk, 1965). Least significant difference (LSD) was calculated at the 5% confidence level to compare treatment means using Student’s t-test (Ott, 1998).
Results and Discussions
Grain yieldWheat grain yield (kg.ha-1) at Langgewens was influenced (P=0.05) by crop sequence and tillage practice (Table 1). Wheat grain yields at the Langgewens Research Farm for 2007 varied between 4040 and 5678 kg.ha-1(Table 1). Similar yields were recorded for 2008 (3756 – 5654 kg.ha-1), whilst lower yields were recorded in 2009 (1234 – 3109 kg.ha-1) and 2010 (725 – 3495 kg.ha-1). During the 2009 and 2010 seasons, lower (P=0.05) grain yields were recorded for the wheat monoculture (WWWW) compared to the McWMcW (wheat after medic), LWCW (wheat after canola) and CWLW (wheat after lupin) crop sequences. The no-till treatment resulted in the
Abstract
Renewed interest in soil factors influencing crop productivity led to the initiation of a long-term soil tillage/crop rotation trial. The long-term aim of this project is to quantify the effects of tillage practice and crop rotation on soil physical and chemical properties, and soil biological activity towards gaining a better understanding of soil parameters that will promote sustainability in crop production systems on the shale derived soils of the Western Cape.
Two localities, Langgewens (near Moorreesburg) and Tygerhoek (near Riviersonderend) were chosen to represent typical production areas of the Middle Swartland and Rûens sub regions. Three crop rotations, wheat monoculture (WWWW), wheat-medic/clover-wheat-medic/clover (WMcWMc) and wheat-canola-wheat-lupin (WCWL) were allocated to main plots and replicated four times. Each main plot was subdivided into four sub-plots allocated to four tillage treatments. The tillage treatments tested were: 1) zero-till - soil left undisturbed (planter places seed with minimal soil disturbance), 2) no-till – soil left undisturbed until planting and then planted with a tined, no-till planter causing maximum of 20% soil disturbance, 3) minimum till – soil scarified (100-150 mm deep) late March/early April and then planted with a no-till planter and 4) conventional tillage – soil scarified late March/early April, then ploughed (150 mm deep) and planted with a no-till planter. All plant residues were left on the soil surface. Crop residues were not burned, baled or grazed.
The zero-till treatments tended to record lower wheat yields compared to the other tillage treatments tested. At Tygerhoek, the zero-till treatment resulted in significantly lower (P=0.05) wheat grain yields during the 2007 (4335.3 kg.ha-1) and 2009 (2409.2 kg.ha-1) production seasons compared to the no-till treatment (4695.1 and 2976.7 kg.ha-1 respectively). At Langgewens, the no-till treatment resulted in significantly higher (P=0.05) wheat yields compared to the zero-till treatments for all seasons covered by the study (2007 to 2010). The lower yields recorded in the zero-till treatments at Langgewens could be the result of poor germination and establishment (birds fed on germinating seedlings) of zero-tilled treatments as well as high populations of ryegrass found in the zero-till treatments. Monoculture wheat (WWWW) resulted in significantly lower (P=0.05) grain yields compared to grain yields within the WCWL and WMcWMc crop rotation treatments.
Short-term data showed no definite trends in the effect of tillage and crop rotation treatment on grain protein content, hectolitre mass or falling numbers. In the long term more definite grain quality trends may be observed.
Keywords: wheat grain quality, wheat grain yield, protein content
Introduction
The short-term effects of various tillage practices on the shale derived soils of the Western Cape are poorly understood. Reduced and minimum tillage practices are promoted as they are said to improve soil stability, increase infiltration rates and minimise the potential for soil loss. The maintenance of crop residues and stubble, besides increasing infiltration rates and decreasing runoff, improve
highest (P=0.05) grain yield for all tillage treatments in 2009 and 2010 (except for the minimum till treatment in 2010). Grain yields for the no-till treatment did not differ from (P>0.05), or were greater than, the yields recorded in the other treatments in 2007 and 2008 (Table 1). Difficulties with establishment of the zero-till treatment and with weed-control (herbicide resistant ryegrass) were reasons for the lower (P=0.05) yield recorded for the zero-till treatments at Langgewens.
Grain yields at Tygerhoek were similar to those recorded at Langgewens (Table 2). At the Tygerhoek Research Farm grain yields for 2007 varied between 3906 and 4894 kg.ha-1(Table 2). These figures do not include the WWWW (wheat monoculture) treatment, as it was decided to spray the WWWW treatments with a non-selective herbicide to prevent the production of viable ryegrass seed in that tillage treatment. Grain production for 2008 was between 2303 and 3478 kg.ha-1. As a result of high ryegrass populations in 2008, it was decided to spray the zero-till treatments with a non-selective herbicide to prevent viable ryegrass seed production. During 2009 grain yields varied between 1436 and 3393 kg.ha-1. Grain production was relatively low during 2010 at values between 359 and 2896 kg.ha-1. Tillage treatments did not affect mean grain yield during the 2010 production season. Grain yields for the no-till treatment did not differ (P>0.05) from, or were greater (P=0.05) than, yields recorded in the other tillage treatments in 2007, 2008 and 2009 (Table 2). The wheat monoculture (WWWW) resulted in lower (P=0.05) mean grain yields than all other crop sequences during the 2009 and 2010 production seasons.
Grain protein contentGrain protein content is an important quality parameter. To qualify for B1 (best grade for bread wheat) a minimum protein content of 12% is required (ARC, 2011). Mean protein content (%) of wheat at Langgewens was influenced (P=0.05) by crop sequence during the 2008 and 2009 production seasons (Table3). During 2008 the McWMcW and LWCW (wheat after canola) crop sequences recorded higher (P=0.05) protein content than the wheat after lupin (CWLW) crop sequence. The positive effect of medics on protein content of wheat is clear with the McWMcW crop sequence resulting in the highest grain protein content in 2009 and in no significantly lower (P=0.05) protein content of grain when compared to any other crop sequence tested. Except for 2008, no differences were recorded for mean grain protein content as a result of tillage practice. No definite trend in the effect of tillage on protein content was recorded for 2008.
tillage treatment
Zero-tillNo-tillMin till
Conv tillMean
CVZero-tillNo-tillMin till
Conv tillMean
CVZero-tillNo-tillMin till
Conv tillMean
CVZero-tillNo-tillMin till
Conv tillMean
CV
Cropping system
ndndndndnd
nd2303 a2608 a2788 a
2565.8 b18.792367 a1826 ab1436 b1738 b
1841.5 b19.44359 b951 a912 a1307 a
1010.5 c17.44
3998 b4619 a4366 ab3906 b
4222.2 a7.77nd
2523 a2948 a3065 a
2845.0 ab13.452362 b3393 a3079 a3170 a
3000.9 a7.77
2613 a2665 a2711 a2632 a
2655.1 a17.51
4389 a4894 a4757 a4780 a4704.9
7.56nd
2900 a3038 a2990 a
2975.8 ab12.76
2774 ab3332 a2663 b2971 ab2934.9 a
12.782095 b2813 a2857 a2896 a
2703.1 a10.23
4619 a4573 a4849 a4802 a
4710.4 a6.47nd
2974 a3458 a3478 a
3302.9 a12.1
2135 b3355 a3192 a3215 a
2974.5 a13.92
2173 a2608 a2304 a2340 a
2356.0 b17.68
4335.3 b4695.1 a4656.9 a
4496.1 ab
2674.7 b3012.5 a3080.0 a
2409.2 c2976.7 a
2592.4 bc2773.4 ab
2148.9 a2259.2 a2281.2 a2293.6 a
year
2007
2008
2009
2010
table 2: grain yield (kg.ha-1) of wheat as influenced by crop sequence and tillage practice at Tygerhoek 2007 – 2010.
Means in the same column and year followed by the same letter are not significantly different (P=0.05)
WWWW McWMcW LWCW CWLW Mean
tillage treatment
Zero-tillNo-tillMin till
Conv tillMean
CVZero-tillNo-tillMin till
Conv tillMean
CVZero-tillNo-tillMin till
Conv tillMean
CVZero-tillNo-tillMin till
Conv tillMean
CV
Cropping system
nd*ndndndnd
3931 a**4010 a4006 a4845 a
4198.1 a18.391234 b2389 a2042 a1999 a
1915.8 b23.51725 c
2769 a2451 ab2160 b
2026.2 b15.75
4089 c5352 a5315 a4413 b
4792.1 a4.23
4401 b5270 a4744 ab4226 b
4660.3 a11.41
2084 b3109 a2653 a2636 a
2620.3 a12.382263 c3378 a3416 a2668 ab2931.1 a
17.15
4682 b5537 a5601 a5219 a
5342.3 a4.2
3884 b4955 ab5103 ab5654 a
4898.8 a16.261983 c3065 a2749 b2828 ab2656.1 a
7.231354 b3071 a3126 a2915 a
2700.8 a10.26
4040 c5437 ab5678 a4776 b4983 a9.02
3756 b5346 a3790 b5109 a
4500.3 a16.82
1684 b2870 a2790 a2852 a
2549.1 a11.3
2597 b3495 a
2914 ab2671 b
2919.1 a12.67
year
2007
2008
2009
2010
table 1: grain yield (kg.ha-1) of wheat as influenced by crop sequence and tillage practice at Langgewens 2007 – 2010.
*nd - no data available crop sprayed to control ryegrass** Means in the same column and year followed by the same letter are not significantly different (P=0.05)
WWWW McWMcW LWCW CWLW Mean4187.9 c5441.9 a5531.4 a4802.8 b
3993.1 c4895.3 ab4410.6 bc4958.4 a
1746.3 c2858.1 a2558.6 b2578.4 b
1760.0 c3178.3 a2976.8 a2603.2 b
14 AgriProbe | December 2011 15AgriProbe | December 2011
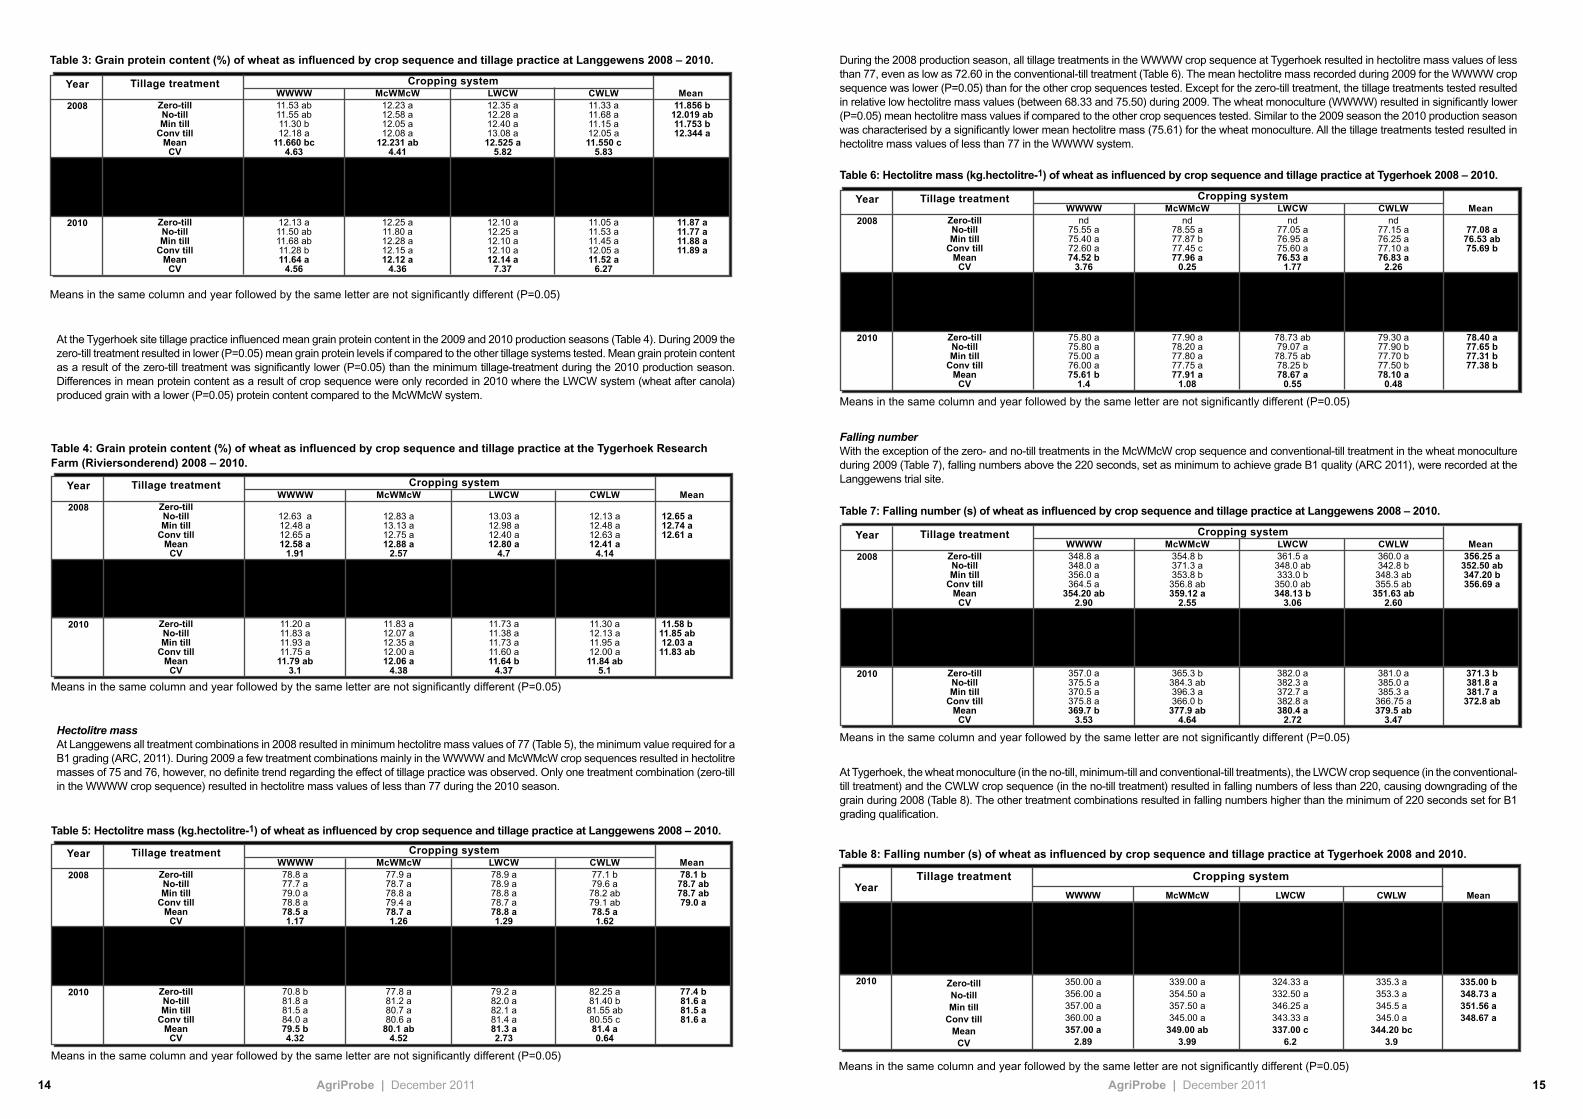
During the 2008 production season, all tillage treatments in the WWWW crop sequence at Tygerhoek resulted in hectolitre mass values of less than 77, even as low as 72.60 in the conventional-till treatment (Table 6). The mean hectolitre mass recorded during 2009 for the WWWW crop sequence was lower (P=0.05) than for the other crop sequences tested. Except for the zero-till treatment, the tillage treatments tested resulted in relative low hectolitre mass values (between 68.33 and 75.50) during 2009. The wheat monoculture (WWWW) resulted in significantly lower (P=0.05) mean hectolitre mass values if compared to the other crop sequences tested. Similar to the 2009 season the 2010 production season was characterised by a significantly lower mean hectolitre mass (75.61) for the wheat monoculture. All the tillage treatments tested resulted in hectolitre mass values of less than 77 in the WWWW system.
Falling numberWith the exception of the zero- and no-till treatments in the McWMcW crop sequence and conventional-till treatment in the wheat monoculture during 2009 (Table 7), falling numbers above the 220 seconds, set as minimum to achieve grade B1 quality (ARC 2011), were recorded at the Langgewens trial site.
At Tygerhoek, the wheat monoculture (in the no-till, minimum-till and conventional-till treatments), the LWCW crop sequence (in the conventional-till treatment) and the CWLW crop sequence (in the no-till treatment) resulted in falling numbers of less than 220, causing downgrading of the grain during 2008 (Table 8). The other treatment combinations resulted in falling numbers higher than the minimum of 220 seconds set for B1 grading qualification.
tillage treatment
Zero-tillNo-tillMin till
Conv tillMean
CVZero-tillNo-tillMin till
Conv tillMean
CVZero-tillNo-tillMin till
Conv tillMean
CV
Cropping system
12.63 a12.48 a12.65 a12.58 a
1.9111.50 b11.60 ab12.25 a11.85 ab11.80 a
4.2711.20 a11.83 a11.93 a11.75 a
11.79 ab3.1
12.83 a13.13 a12.75 a12.88 a
2.5711.30 a11.18 a11.53 a11.60 a11.40 a
2.5811.83 a12.07 a12.35 a12.00 a12.06 a
4.38
13.03 a12.98 a12.40 a12.80 a
4.710.78 a11.38 a11.60 a11.68 a12.36 a
5.6911.73 a11.38 a11.73 a11.60 a11.64 b
4.37
12.13 a12.48 a12.63 a12.41 a
4.1410.35 b11.65 a11.35 a11.38 a11.18 a
5.1411.30 a12.13 a11.95 a12.00 a
11.84 ab5.1
12.65 a12.74 a12.61 a
10.98 b11.45 a11.68 a11.63 a
11.58 b11.85 ab12.03 a
11.83 ab
year
2008
2009
2010
Table 4: Grain protein content (%) of wheat as influenced by crop sequence and tillage practice at the Tygerhoek Research Farm (Riviersonderend) 2008 – 2010.
Means in the same column and year followed by the same letter are not significantly different (P=0.05)
WWWW McWMcW LWCW CWLW Mean
tillage treatment
Zero-tillNo-tillMin till
Conv tillMean
CVZero-tillNo-tillMin till
Conv tillMean
CVZero-tillNo-tillMin till
Conv tillMean
CV
Cropping system
78.8 a77.7 a79.0 a78.8 a78.5 a1.17
76.00 ab76.65 a76.20 ab75.35 b76.1 bc
0.9870.8 b81.8 a81.5 a84.0 a79.5 b4.32
77.9 a78.7 a78.8 a79.4 a78.7 a1.26
75.9 a75.3 a75.5 a75.8 a75.6 c1.22
77.8 a81.2 a80.7 a80.6 a
80.1 ab4.52
78.9 a78.9 a78.8 a78.7 a78.8 a1.29
76.9 a76.7 a76.7 a77.1 a76.8 a0.57
79.2 a82.0 a82.1 a81.4 a81.3 a2.73
77.1 b79.6 a
78.2 ab79.1 ab78.5 a1.62
76.3 b76.6 ab76.9 a
76.7 ab76.6 ab
0.4982.25 a81.40 b
81.55 ab80.55 c81.4 a0.64
78.1 b78.7 ab78.7 ab79.0 a
76.3 a76.3 a76.3 a76.2 a
77.4 b81.6 a81.5 a81.6 a
year
2008
2009
2010
table 5: hectolitre mass (kg.hectolitre-1) of wheat as influenced by crop sequence and tillage practice at Langgewens 2008 – 2010.
Means in the same column and year followed by the same letter are not significantly different (P=0.05)
WWWW McWMcW LWCW CWLW Mean
tillage treatment
Zero-tillNo-tillMin till
Conv tillMean
CVZero-tillNo-tillMin till
Conv tillMean
CVZero-tillNo-tillMin till
Conv tillMean
CV
Cropping system
nd75.55 a75.40 a72.60 a74.52 b
3.7677.47 a70.75 b68.33 c69.60 bc71.34 b
1.1775.80 a75.80 a75.00 a76.00 a75.61 b
1.4
nd78.55 a77.87 b77.45 c77.96 a
0.2578.85 a75.50 b75.40 b74.85 b76.15 a
0.6477.90 a78.20 a77.80 a77.75 a77.91 a
1.08
nd77.05 a76.95 a75.60 a76.53 a
1.7779.90 a75.10 b75.50 b75.25 b76.44 a
0.7878.73 ab79.07 a78.75 ab78.25 b78.67 a
0.55
nd77.15 a76.25 a77.10 a76.83 a
2.2679.33 a74.95 a75.20 b75.20 b75.96 a
0.9879.30 a77.90 b77.70 b77.50 b78.10 a
0.48
77.08 a76.53 ab75.69 b
78.96 a74.08 b73.96 b73.73 b
78.40 a77.65 b77.31 b77.38 b
year
2008
2009
2010
table 6: hectolitre mass (kg.hectolitre-1) of wheat as influenced by crop sequence and tillage practice at Tygerhoek 2008 – 2010.
Means in the same column and year followed by the same letter are not significantly different (P=0.05)
WWWW McWMcW LWCW CWLW Mean
tillage treatment
Zero-tillNo-tillMin till
Conv tillMean
CVZero-tillNo-tillMin till
Conv tillMean
CVZero-tillNo-tillMin till
Conv tillMean
CV
Cropping system
348.8 a348.0 a356.0 a364.5 a
354.20 ab2.90
247.5 a238.3 ab245.5 a217.8 b
237.25 ab5.52
357.0 a375.5 a370.5 a375.8 a369.7 b
3.53
354.8 b371.3 a353.8 b356.8 ab359.12 a
2.55215.8 ab184.8 b240.5 a221.8 ab215.69 b
12.78365.3 b384.3 ab396.3 a366.0 b
377.9 ab4.64
361.5 a348.0 ab333.0 b350.0 ab348.13 b
3.06237.5 a272.3 a260.0 a256.5 a256.56 a
9.74382.0 a382.3 a372.7 a382.8 a380.4 a
2.72
360.0 a342.8 b
348.3 ab355.5 ab
351.63 ab2.60
276.0 a260.5 a260.5 a267.0 a
266.00 a5.99
381.0 a385.0 a385.3 a
366.75 a379.5 ab
3.47
356.25 a352.50 ab347.20 b356.69 a
244.19 a238.94 a251.63 a240.75 a
371.3 b381.8 a381.7 a
372.8 ab
year
2008
2009
2010
Table 7: Falling number (s) of wheat as influenced by crop sequence and tillage practice at Langgewens 2008 – 2010.
Means in the same column and year followed by the same letter are not significantly different (P=0.05)
WWWW McWMcW LWCW CWLW Mean
tillage treatment
Zero-tillNo-tillMin till
Conv tillMean
CVZero-tillNo-tillMin till
Conv tillMean
CVZero-tillNo-tillMin till
Conv tillMean
CV
Cropping system
11.53 ab11.55 ab11.30 b12.18 a
11.660 bc4.63
10.28 ab10.35 ab10.08 b10.58 a10.32 b
3.2912.13 a11.50 ab11.68 ab11.28 b11.64 a
4.56
12.23 a12.58 a12.05 a12.08 a
12.231 ab4.41
11.58 a11.65 a11.35 a11.28 a11.46 a
5.2512.25 a11.80 a12.28 a12.15 a12.12 a
4.36
12.35 a12.28 a12.40 a13.08 a
12.525 a5.82
10.58 a10.68 a10.48 a10.58 a10.58 b
3.9712.10 a12.25 a12.10 a12.10 a12.14 a
7.37
11.33 a11.68 a11.15 a12.05 a11.550 c
5.8310.25 a9.90 a
10.43 a10.05 a10.16 b
3.8511.05 a11.53 a11.45 a12.05 a11.52 a
6.27
11.856 b12.019 ab11.753 b12.344 a
10.669 a10.644 a10.581 a10.619 a
11.87 a11.77 a11.88 a11.89 a
year
2008
2009
2010
Table 3: Grain protein content (%) of wheat as influenced by crop sequence and tillage practice at Langgewens 2008 – 2010.
Means in the same column and year followed by the same letter are not significantly different (P=0.05)
WWWW McWMcW LWCW CWLW Mean
Table 8: Falling number (s) of wheat as influenced by crop sequence and tillage practice at Tygerhoek 2008 and 2010.
tillage treatment
Zero-tillNo-tillMin till
Conv tillMean
CV
Zero-tillNo-tillMin till
Conv tillMean
CV
Cropping system
WWWWnd
194.00 a164.75 a147.25 a168.67 b
29.57
350.00 a356.00 a357.00 a360.00 a357.00 a
2.89
McWMcWnd
281.25 a274.67 a238.50 a263.91 a
11.17
339.00 a354.50 a357.50 a345.00 a
349.00 ab3.99
LWCWnd
268.75 a234.50 ab213.75 b239.00 a
9.54
324.33 a332.50 a346.25 a343.33 a337.00 c
6.2
CWLWnd
229.75 a205.00 a243.50 a
226.08 ab11.19
335.3 a353.3 a345.5 a345.0 a
344.20 bc3.9
Mean
243.44 a216.07 b210.75 b
335.00 b348.73 a351.56 a348.67 a
Means in the same column and year followed by the same letter are not significantly different (P=0.05)
year
2008
2010
At the Tygerhoek site tillage practice influenced mean grain protein content in the 2009 and 2010 production seasons (Table 4). During 2009 the zero-till treatment resulted in lower (P=0.05) mean grain protein levels if compared to the other tillage systems tested. Mean grain protein content as a result of the zero-till treatment was significantly lower (P=0.05) than the minimum tillage-treatment during the 2010 production season. Differences in mean protein content as a result of crop sequence were only recorded in 2010 where the LWCW system (wheat after canola) produced grain with a lower (P=0.05) protein content compared to the McWMcW system.
Hectolitre massAt Langgewens all treatment combinations in 2008 resulted in minimum hectolitre mass values of 77 (Table 5), the minimum value required for a B1 grading (ARC, 2011). During 2009 a few treatment combinations mainly in the WWWW and McWMcW crop sequences resulted in hectolitre masses of 75 and 76, however, no definite trend regarding the effect of tillage practice was observed. Only one treatment combination (zero-till in the WWWW crop sequence) resulted in hectolitre mass values of less than 77 during the 2010 season.
16 AgriProbe | December 2011 17AgriProbe | December 2011
South Africa is a water scarce country with limited supply side management options remaining. The scarcity of water is set to increase in the future due to demographic pressures, socio-economic pressures and climate change (Blignaut & van Heerden, 2009). To address this challenge we need to critically examine water demand management, water use efficiency, water allocations and alternatives to increasing the supply of water. Such alternatives may include water transfers, water recycling, desalination, rainwater harvesting and unconventional water.
In terms of the agriculture and water interface, the ultimate aim is to maintain food security in the face of increasing urban populations and heightened economic growth. To achieve this aim it is critical that the interface between agriculture, water and sustainable development be better understood. Water scarcity has severe implications for food security and the structure of agriculture and constrains the potential for agricultural development. International experience indicates that supplying water for urban development is frequently prioritised over supplying water for agriculture (de Fraiture, Wilchens, Rockstrom, Kemp-Benedict, Eriyagama, Gordon, Hanjra, Hoogeveen, Huber-Lee & Karlberg, 2007: 103). In South Africa, agriculture, as the largest user of water, is faced with competition from urban water users. This may encourage water allocations away from the agricultural sector through markets or reallocations. The implications for rural development of allocating water away from the agriculture sector needs to be critically examined. 2. the Interface between Agriculture, Water & Climate Change
In May 2011, the 1st African Agriculture and Water Dialogue was held in Johannesburg. The aim of the African Water Dialogue was to create a platform where agriculture, the
private sector, government and climate change experts from across Africa could come together to share knowledge and solutions. The shared experience and expertise could assist in addressing Africa’s challenges in terms of the interface between agriculture, water and sustainable development. Though Ministers from Africa failed to attend the dialogue, expert knowledge and experience from within Africa was shared. The dialogue served to highlight the critical importance of the interface between water, agriculture and climate change. It is within this interface, and its implications for food security and rural development, that the research challenges of the future will be.
At this dialogue, Prof Robin Barnard highlighted shortcomings of the current understanding of the potential impacts on agriculture of climate change (Barnard, 2011). There is a lack of geographic balance in data and literature on observed changes, with marked scarcity in developing countries. There is also a scarcity of information about what is happening at the grassroots level. What we do know, based on the 2007 Inter Governmental Panel on Climate Change (IPCC) report, is that it is estimated that by 2020 250 million people will be exposed to water stress and that in some African countries rain-fed agriculture may be reduced by up to 50% (Barnard, 2011).
South Africa will also be exposed to water stress, while remaining bulk water supply augmentation schemes are becoming prohibitively costly in both environmental and economic terms. In the face of this challenge we need to explore alternative sources of water, which may include the re-use of water, desalination, improved storage and rainwater harvesting. The dialogue also offered an opportunity for Prof Rautenbach to present research done by Pretoria University’s Meteorological institute on fog water harvesting. Fog water harvesting can be regarded as an unconventional source of water, but it may be an important one – especially in its ability to supplement drinking water (Rautenbach, 2011). The research suggests that fog
water can be a valuable and affordable alternative source of water in regions of high altitude. In such regions fog water harvesting can provide sufficient quantities of water to enhance the welfare of rural communities. If sufficient water can be harvested, fog water can be used for safe drinking water and homestead gardening; however, fog water harvesting’s main contribution to rural livelihoods would be in terms of providing supplementary drinking water (Rautenbach, 2011).
We also need changes in water, land and crop management, while overcoming financial, human and physical barriers. Ultimately improved efficiency is required. We need an iterative risk management process that promotes climate resilience. In terms of conservation agriculture, we need crop rotation, minimum soil disturbance, permanent organic soil cover, retention of crop residue and water management. Keeping soil cover is of critical importance.
It was highlighted at the dialogue that climate change impacts are expressed primarily in its impact on hydrological cycles. Therefore, this is where serious attention and commitment should be. Water resource management encompasses the entire rainfall to root continuum – capture, storage, management practices, drainage and applying the right quantity of water to roots at the right time. Managing all these aspects correctly is critical for productivity and efficiency, and doing so successfully will be an important part of adapting to climate change. In terms of agricultural water use efficiency, David Love from the Agricultural Research Council (ARC) argued at the dialogue that we need more crops per drop, more meat per drop, more money per drop and better livelihoods per drop (Love, 2011). To achieve this, more coordination is needed between agricultural planning, water planning and land management, while government needs to realise the critical importance of maintaining food security. The improvement of the efficiency of agricultural water use will require both investment in agriculture and improved understanding of the status quo of water use efficiency within agriculture, accompanied by the recognition that agriculture is a strategic water user in terms of food security and rural livelihoods (Love, 2011).
3. Water Resource Management for Sustainable Development
Within the revised National Water Resources Strategy, emphasis will be placed on addressing the lack of awareness of the value of water, while putting in place appropriate water conservation and water demand management practices. The aim will be to place water at centre stage of integrated development planning, which will require the assurance of adequate water supply to support sustainable development.
In pursuit of these aims, water pricing is regarded as an important component of water demand management, while water reallocations between rural and urban water users is never far from any water resource management agenda. Lack of understanding of water use in agriculture is a key constraint to sustainable water resource management. Both effective water pricing and water reallocations requires accurate information on water use, water requirements, the differences in preferences between users, financial constraints within agriculture and the full extent of opportunity costs. This information is simply unavailable, and thus decisions made on sustainable water resource management are precarious at best.
3.1 the Potential Economic Impact of Increased Water User Charges and Reallocation of Irrigation Water
Water pricing is an attractive policy tool due to its apparent ease of implementation, but international experience with this policy tool has been mixed (Dinar, Rosegrant & Meinzen-Dick, 1997; Molle & Berkoff, 2007; Montginoul, 2007). The main reason for the difficulties associated with pricing as a demand management tool is that the demand for water may be inelastic. This means that the demand for water may not decline as the water price is increased due to, for example, minimum water requirements of crops. There is thus a danger that increasing water user charges may decrease agricultural production, while providing limited water savings.
In this context, a study was conducted by Tania Gill & Cecilia Punt (2010) that attempts to trace the impact of increasing the irrigation water user charge to save water and the impact thereof on the economy. This policy option is compared to the alternative of reallocating water to the domestic and industrial sector. A brief outline of the study and results will be provided in this section.
3.1.1 Model, Data and scenarios
The study is macroeconomic in nature and makes use of Computable General Equilibrium (CGE) modelling. More specifically, a CGE model and Social Accounting Matrix (SAM) developed by Hassan, Thurlow, Roe, Diao, Chumi and Tsur (2008) is used. CGE models are a useful tool for the macroeconomic analysis of fiscal shocks (such as an increase in the water user charge). Results are useful in as far as they show the potential direction of change and unforeseen impacts. The disadvantage of the model used is that it assumes that farmers cannot become more efficient with their resources and so maintain production levels even if less water is available. The only adaptation practices farmers can engage in is changing cropping patterns and/or changing the scope of irrigated agriculture. Therefore, there has to be a production impact.
Two sets of scenarios are investigated. In the first set of scenarios a 50% increase in the water user charge from a base of 2c/m³ is introduced under different assumptions. The first scenario assumes that all irrigation water has to be used, while the second scenario allows for irrigation water to remain unused. In the second set of scenarios a 10% restriction on irrigation water and the reallocation of this water to the domestic and industrial sector are run as separate scenarios in order to separate affects.
3.1.2 Results
For all scenarios the overall impact on national welfare, agricultural production, employment and household welfare is negative, and the rural poor are more heavily affected than the urban poor. If all irrigation water has to be used there is a general trend of water moving from low value to high value crops. If irrigation water can remain unused water moves to high value crops in addition to a decline in the scope of irrigated agriculture. The amount of unused water that could possibly be ‘saved’ (128.8 million m³ of unused water in the Western Cape) may be of note; but, it is not clear to what extent this water can remain unused or whether it would be feasible to reallocate the water.
Of particular concern is the overall decline in production of field crops, which is driven by a decline in the production of irrigated field crops. Less field crops are produced and a higher proportion of field crop production is on dryland. This is accompanied by an increase in the prices of field crops
Acknowledgement
The authors acknowledge the Winter Cereal Trust and Protein Research Foundation for additional financial assistance.
References
ARC-Small Grain Institute, 2011. Handleiding Produksie van kleingrane in die winter reënvalgebied. ARC-Small Grain Institute, Bethlehem. BRADY, N.C. & Weil, R.R., 1999. The nature and properties of soils. 12th Ed. Simon & Schuster A Viacon ompany, UpperSaddle River, New Jersey, 07458.
OTT, R.L., 1998. An Introduction to statistical methods and data analysis. Belmont, California: Duxbury Press.
SAS., 1999. SAS/STAT User’s Guide, Version 8, 1st printing, Volume 2. SAS Institute Inc, SAS Campus Drive, Cary, North Carolina 27513.
SHAPIRO, S.S. & WILK, M.B., 1965. An analysis of variance test for normality, Biometrika 52, 591-611.
SNEDECOR, G.W. & COCHRAN, W.G., 1967. Statistical Methods. Sixth Ed. The Iowa State University Press, Ames, Iowa, U.S.A.
Conclusions
The low wheat grain yields in the WWWW systems at both Langgewens and Tygerhoek highlight the risk involved in practising monoculture wheat cropping. The tendency of lower grain yields under the zero-till system could be the result of 1) bird damage as the seeds are easily lifted by birds and 2) ineffective control of grass weeds as the use of herbicides during the planting process is not possible with the zero-till (star wheel) planter.
These short-term data do not show dramatic differences in wheat yield and quality due to tillage practice or crop sequence, indicating that the use of no-till does not negatively influence either yield or quality of grain relative to minimum or conventional tillage practices.
In some years and certain crop sequences, however, no-till results in significantly improved yields and quality of wheat relative to minimum or conventional tillage practices. In the long term more definite grain yield and quality trends may be observed and should be interpreted together with data showing the effects of treatments on soil physical and chemical properties, as well as soil biological activity.
WAtER & AgRICULtURE: CRItICAL INtERFACE FOR RURAL DEVELOPMENt
18 AgriProbe | December 2011 19AgriProbe | December 2011
and increased field crop imports. Taken together, there is an adverse impact on rural livelihoods, food security and the risk profile of agriculture. A further concern about the tendency to produce more dryland field crops is the danger that dryland agriculture may become less resilient in the face of climate change.
In the case of irrigation water restrictions and reallocation, the nature of the impact is similar to that of scenario 2, but the impact is more severe. The negative impact on household welfare and employment is mitigated if irrigation water is reallocated; the water allocated to the domestic and industrial sectors improves their ability to absorb labour. However, the overall impact on national welfare, agricultural production, employment and household welfare is still negative. Agriculture is an important employer of unskilled labour, and jobs shed in this sector may not be readily absorbed elsewhere.
3.1.3 Implications for Rural Development
The results in section 3.1.2 are similar to those of Van Zyl & Vink (1997) in their study on the effects of water policies on the farm sector in the Western Cape in which scenarios were investigated dealing with agricultural water restrictions and increased water user charges. The ultimate message that emerges from this is that agriculture is a strategic water user in terms of national and rural development. The South African government wants to see a 10% reduction in water use in agriculture, while simultaneously seeing an increase in agricultural employment and without increasing food prices beyond the average level of inflation. The model results demonstrate that this may be unlikely if water pricing and reallocations are employed as tools to achieve this in the event that water is used efficiently in agriculture. One of the key points to take from this study is therefore the critical need for more accurate information on agriculture’s water use efficiency and on agriculture’s ability to absorb increasing costs. Until the nature of water use and agricultural financial constraints are better understood, these policy options should be approached with caution.
The constraint that reducing water available to agriculture may pose to employment creation in agriculture deserves particular attention. South Africa’s New Growth Path places a strong emphasis on job creation, and agriculture may have an important role to play in this regard. Particular emphasis has been placed on achieving rural development through job creation (Department of Rural Development and Land Reform, 2010). Agriculture has traditionally been seen as a sector that has the ability to absorb unskilled labour and therefore the potential for job creation in agriculture should be thoroughly investigated.
Natural resource use and employment was investigated by the Bureau for Food and Agricultural Policy (BFAP) in their 2011 Agricultural Baseline. BFAP argues that the critical constraint of job creation in agriculture is the availability of natural resources (arable land and water) for the expansion of production. The investigation finds that a conservative estimate of potential irrigation expansion is 145 000 ha (groundwater is not taken into consideration). BFAP proceeds to attempt to determine how potential available resources can best be utilized to maximize employment growth. This is done by identifying winning agricultural industries that are labour-intensive and have high growth potential. The findings suggest that winning agricultural industries can contribute approximately 200 000 direct employment opportunities with 100 000 jobs downstream jobs in the value chain (BFAP, 2011).
An important caveat is that potential employment creation in agriculture must be investigated in light of the apparent job shedding in agriculture - there has been a reduction in permanent employment in agriculture between 2000 and 2007, accompanied by an increase in seasonal employment (Jacobs, 2009). Based on the Labour Force Survey (LFS) employment in agriculture appears to have declined from 1 574 863 workers in March 2001 to 1 072 429 workers in March 2007. The more recent Quarterly Labour Force Surveys (QLFS) of 2008 to 2011 suggests a continuation of job shedding in agriculture, with employment declining from 808 004 workers in the first quarter of 2008 to 604 275 in the first quarter of 2011. The structure of employment in agriculture must therefore be further investigated and better understood.
4. Conclusion
Economic development, population growth and climate change all increase the demand for water and the need to manage water resources more effectively. Water management needs to be accompanied by a search for alternative sources of water, improved land management and improved productivity. Water management tools need to be evaluated critically to ensure policy coherence in terms of achieving developmental goals. To assist in the selection of the right management tools we need accurate information on water use efficiency, water use requirements, the importance of agriculture to rural development, the potential impacts of climate change and the structure of agricultural employment. Water and agriculture presents us with a critical interface for rural development; therefore agriculture has to be identified as a strategic water user in the pursuit of national and rural development goals.
References
BARNARD, R. (2011) Effect of Climate Change on Agriculture. 1st AFRICAN AGRICULTURE AND WATER DIALOGUE. (2011) Johannesburg: 1st African Agriculture and Water Dialogue.
BLIGNAUT, J. & VAN HEERDEN, J. (2009) Is Water Shedding Next? Working Paper Number 141. Pretoria: Department of Economics, University of Pretoria.
BFAP. (2011) The South African Agricultural Baseline: 2011. Pretoria: Bureau for Food and Agricultural Policy.
DE FRAITURE, C., WICHELNS, D., ROCKSTROM, J., KEMP-BENEDICT, E., ERIYAGAMA, N., GORDON, L., HANJRA, M., HOOGEVEEN, J., HUBER-LEE, A. & KARLBERG, L. (2007) “Looking ahead to 2050: scenarios of alternative investment approaches” in Water for Food, Water for Life: Comprehensive Assessment of Water Management in Agriculture. Molden, D. (ed.). London: Earthscan.
DEPARTMENT OF RURAL DEVELOPMENT AND LAND REFORM. (2010) Comprehensive Rural Development Programme: Consolidated Status Report. Pretoria: Department of Rural Development and Land Reform.
DINAR, A., ROSEGRANT, M. & MEINZEN-DICK, R. (1997) Water Allocation Mechanisms – Principles and Examples. Policy Research Working Paper 1779. Washington DC: World Bank.
GILL, T. & PUNT, C. (2010) The Potential Economic Impact of Inceased Water User Charges and Reallocation of Irrigation Water. Elsenburg: Department of Agriculture, Western Cape.
HASSAN, R., THURLOW, J., ROE, T., DIAO, X., CHUMI, S., & TSUR, Y. (2008) Macro-Micro Feedback Links of Water Management in South Africa: CGE Analyses of Selected Policy Regimes. Policy Research Working Paper No. 4768. World Bank.
JACOBS, E. 2009. Farm Workers, Job Security and Labour Contractors. Elsenburg: Department of Agriculture, Western Cape.
LOVE, D. (2011) Water Use Efficiency. 1st AFRICAN AGRICULTURE AND WATER DIALOGUE. (2011) Johannesburg: 1st African Agriculture and Water Dialogue.
MOLLE, F. & BERKOFF, J. (2007) “Water pricing in irrigation: Mapping the debate in the light of experience” in Irrigation Water Pricing (eds Molle, F. & Berkoff, J). CAB International.MONTGINOUL, M. (2007) “Analysing the Diversity of Water Pricing Sructures: The Case of France” in Water Resources
Management. 21(2007): 861-871.RAUTENBACH, C. (2011) Fog Water Harvesting. 1st AFRICAN AGRICULTURE AND WATER DIALOGUE. (2011) Johannesburg: 1st African Agriculture and Water Dialogue.
STATISTICS SOUTH AFRICA: Labour Force Survey 2001. Available online at; www.statssa.gov.za
STATISTICS SOUTH AFRICA: Labour Force Survey 2007. Available online at; www.statssa.gov.za
STATISTICS SOUTH AFRICA: Quarterly Labour Force Survey 2008. Available online at; www.statssa.gov.za
STATISTICS SOUTH AFRICA: Labour Force Survey 2011. Available online at; www.statssa.gov.za
VAN ZYL, J. & VINK, N. (1997) “The Effects of Water policies on the Farm Sector in the Western Cape” in Agrekon. 36(4): 573-585.
DIE INVLOED VAN BEhUISINgStIPE EN VLOERBEDEKKINg OP DIE gROEI EN OORLEWINg VAN VOLStRUISKUIKENS tOt OP EEN MAAND
Inleiding
Die volstruisbedryf word wêreldwyd gekortwiek deur hoë mortaliteite onder volstruiskuikens (Smith, 1993; Button et al., 1996; Glatz & Miao, 2008). Dit is ‘n aanduiding dat die kunsmatige omstandighede waarin die kuikens grootgemaak word in kommersiële stelsels, nie ideaal is nie. Die onvermoë van die kuikens om aan te pas by hierdie kunsmatige omgewings veroorsaak waarskynlik stres wat aanleiding gee tot die hoë mortaliteite (Cloete et al., 2001). Die suksesvolle grootmaak van volstruiskuikens is daarom ‘n groot uitdaging en vereis bestuur van hoogstaande gehalte, asook ‘n omgewing wat geskik is vir optimale groei en ontwikkeling (Deeming et al., 1996; Cooper, 2000).
Grootmaakpraktyke, -stelsels en –fasiliteite vir volstruiskuikens wissel van ekstensief tot intensief en is gewoonlik uniek vir elke produsent. Die sukses van grootmaakstelsels varieer ook dikwels (Verwoerd et al., 1999, Glatz & Miao, 2008). Daar is ook wesenlike verskille in die aanbevelings wat in die literatuur gegee word, met die gevolg dat standaard riglyne vir die suksesvolle grootmaak van volstruiskuikens steeds ontbreek.
Behuisingsfasiliteite waarin die omgewing en ander faktore tot ‘n groter mate beheer kan word blyk ‘n alternatief te wees vir die ekstensiewe toestande waaronder baie volstruiskuikens met wisselende sukses grootgemaak word (Allen & Morley, 1994). Daar is egter ‘n gebrek aan behoorlike kwantifisering van die optimale behuisingstoestande vir volstruiskuikens. ‘n Groot verskeidenheid behuisingstelsels word tans gebruik – elk met unieke kenmerke (en uitdagings). Verskeie vloeroppervlaktes word verder binne die behuisingstelsels gebruik, ook met wisselende sukses (Glatz & Miao, 2008). Wojcik & Horbanczuk (2005) het gevind dat volstruise nie met groot sukses op sementvloere grootgemaak kan word sonder die gebruik van een of ander vloerbedekking nie.
‘n Behuisingstelsel wat standardisering van die omgewing toelaat behoort in teorie meer beheer oor die eksterne
omgewingsfaktore wat die welsyn van die kuikens beïnvloed moontlik te maak. Die grootmaak van kuikens in omgewingsbeheerde toestande sal ook navorsingspogings vergemaklik deurdat die verskillende faktore beter beheer en ondersoek kan word, wat die bepaling van riglyne vir die suksesvolle grootmaak van volstruiskuikens sal vergemaklik.
‘n Gedeelte van die bestaande kuikenhuis op die Departement van Landbou: Wes-Kaap se Oudtshoorn Navorsingsplaas is vervolgens omskep in ‘n omgewingsbeheerde stelsel met behulp van ‘n skenking van Aircontek Panelling (Pty) Ltd en Peninsula Poultry Appliances (Pty) Ltd.
Die omgewingsbeheerde stelsel (OBS) is vergelyk met die bestaande oop kuikenhuis (OKH) ten opsigte van die groei en mortaliteite van volstruiskuikens tot op ‘n ouderdom van 1 maand, om te bepaal of volstruiskuikens wel binne so ‘n omgewingsbeheerde stelsel grootgemaak kon word.
Binne elke behuisingstelsel is 2 vloerbedekkings ook vergelyk. Omdat koringstrooi algemeen gebruik word as beddegoedmateriaal in die behuising van groot plaasdiere (Lowe et al., 2001), is dit een van die opsies wat ondersoek is. Die ander vloerbedekking wat ondersoek is is plastiek hortjiesvloere, wat veral in die varkbedryf algemeen gebruik word binne behuisingseenhede.
Hierdie resultate sal gebruik word om verdere navorsing met betrekking tot die saamstel van riglyne vir die suksesvolle grootmaak van volstruiskuikens te fasiliteer.
Materiaal en metodes
Die proef is op die Oudtshoorn Navorsingsplaas, geleë net buite Oudtshoorn, uitgevoer. Die kuikenhuisgebou is ‘n toe gebou met sementvloere en ‘n skuins platdakkonstruksie, 2.5m hoog op die laagste punt (suid) en 3.2m op die hoogste punt (noord). Die muur aan die suidekant van die gebou het ‘n ry vensters (1.37m bokant die vloer) wat vertikaal oopswaai, een vir elke hok. Die noordelike kant van die
20 AgriProbe | December 2011 21AgriProbe | December 2011
gebou het 1.15m hoë mure met staal deure en oprolseile wat toegemaak kan word. Die gebou bestaan uit 3 aparte vertrekke, elk met 3 of 4 hokke om ‘n totaal van 10 hokke te gee. Elke hok het toegang na ‘n buite area wat met ogiesdraad toegemaak is, waarheen kuikens vrylik kan beweeg wanneer die deure na buite oopgemaak word. Die hokke binne elke vertrek van die gebou word met 0.75m hoë muurtjies van mekaar geskei.
Een vertrek (met vier hokke) van die kuikenhuis is omskep in ‘n omgewingsbeheerde eenheid deur die installering van geïnsuleerde panele en deure, ‘n uitsuigwaaier (“extracter fan”) en ventilasie openinge wat die bestaande vensters vervang het. ‘n Verdampingsmuur (“wet wall”) is vir verkoelingsdoeleindes teen die buitenste agterste muur aangebring. Die temperatuur, humiditeit en lugvloei binne in die kamer word outomaties beheer deur ‘n geprogrammeerde rekenaar. ‘n Outomatiese propaan gasverwarmer is op ‘n hoogte van 2m aangebring in die agterste hoek van die omgewingsbeheerde vertrek. Die verwarmer is so geplaas dat die verhitte lug voor die ventilasie openinge verby beweeg vir meer effektiewe verspreiding van die hitte. In die OKH is oorhoofse langgolf-infrarooi verwarmers wat bo-kant die kuikens gehang word gebruik vir verhitting. Hierdie verwarmers is gekoppel aan hittesensors en beheerstelsels wat die temperatuur beheer deur die verwarmers outomaties aan en af te skakel.
Die OBS is vooraf geprogrammeer om ‘n vasgestelde temperatuur en ventilasie siklus te handhaaf. Die verwarmer, ventilasie openinge en uitsuigwaaier word outomaties beheer om die temperatuur en ventilasie te handhaaf volgens die geprogrammeerde program.
Plastiek hortjies (“slats”) met ‘n growwe afwerking en koringstrooi is onderskeidelik tydens hierdie studie as vloerbedekking bo-op die sementvloere gebruik. Die strooilaag, met ‘n diepte van ongeveer 30 cm, is bedek met skadunet, aangesien volstruise geneig is om na die strooi te pik wat dan obstruksies in hulle spysverteringskanaal veroorsaak (Wojcik & Horbanczuk, 2005). Twee hokke in beide die OBS en OKH is met plastiekhortjiesvloere toegerus, terwyl die vloere van twee hokke in beide eenhede met strooi en skadunet bedek is. Die hortjiesvloere is ongeveer 25 cm van die vloer gelig sodat mis en urine kon deurval.
ProefprosedureTwee behuisingstipes en twee vloerbedekkings is binne elke behuisingstipe vergelyk in ‘n 2x2 faktoriaal proefontwerp, met twee herhalings vir elke behandeling. Twee groepe dagoud kuikens wat oor ‘n periode van twee weke uitgebroei het, is ewekansig verdeel tussen agt hokke. In totaal was daar 4 groepe per behuisingstipe en 4 groepe per vloerbedekking. Die proef is herhaal oor 3 kuikenuitbroeiseisoene wat strek vanaf Augustus tot Januarie. Die proef is die eerste jaar tydens November uitgevoer, die tweede jaar tydens Augustus en die derde jaar tydens Oktober.
Die kuikens is tot op 1 maand ouderdom in die kuikenhuis gehou, waarna die proef afgesluit is en die kuikens na ander fasiliteite verskuif is. Die hokke is nie tydens die proefperiode skoongemaak nie weens praktiese oorwegings en om stres te beperk. Stalosan® F (‘n produk wat ammoniak en vog absorbeer) is daagliks op die vloeroppervlaktes gestrooi om ‘n higiëniese omgewing te handhaaf. Die bestuurs- en voerprogramme van kuikens was dieselfde in beide die OBS en OKH. Die heersende temperatuur binne die OBS was geprogrammeer op 26ºC vir die eerste twee weke, met ‘n verlaging van 1ºC weekliks daarna.
‘n Pre-aanvangsrantsoen vir volstruise is ad lib voorsien en vars water was daagliks beskikbaar tussen 08:00 en 16:00. Die kuikens is geweeg by die aanvang van die proef (dag een) en by die einde van die proef (dag 30). Kuikenvrektes is daagliks aangeteken. Die totale mortaliteit is hiervolgens bereken. Die omgewingstemperatuur binne- en buite die gebou is ook daagliks aangeteken op twee tye (07:00 en 17:00). Die buitetemperatuur is gemeet met ‘n termometer wat buite onderdak aan die suidekant van die gebou aangebring is. Die binne-temperatuur is op ‘n sentrale punt binne elke vertrek gemeet.
Statistiese ontledingData is met behulp van GenStat 13.2 ontleed. ‘n Multifaktor analise van variansie is gebruik om betekenisvolle behandelingsverskille vir onderskeidelik gewig en mortaltiteit tot op 1 maand te bepaal. Die hoofeffekte was vloer- (2) en behuisingstipe (2) en die interaksie tussen genoemde effekte, met ouderdom as kovariant om voorsiening te maak vir ouderdomsverskille weens die gebruik van kuikens wat oor ‘n tydperk van twee weke uitgebroei het. Jaar is as blokeffek ingereken.
Resultate
Behuisingstipe (OBS teenoor OKH) het nie ‘n betekenisvolle invloed op die liggaamsgewig van volstruiskuikens tot op 1 maand gehad nie (Tabel 1, P = 0.16). Daar was wel ‘n neiging vir kuikens in die omgewingsbeheerde stelsel om laer mortaliteite tot op 1 maand te hê (P = 0.055).
Die tipe vloerbedekking het wel ‘n betekenisvolle invloed op beide maand-oud gewig (P = 0.02) en mortaliteit tot op 1 maand (P = 0.004) gehad. Kuikens het beter gevaar op hortjiesvloere as op strooi wat met skadunet bedek was.
Die vloer by huis interaksie was nie betekenisvol vir gewig (P = 0.49) of mortaliteite (P = 0.16) nie. Binne die OKH was die mortaliteite van kuikens op strooi egter hoër as vir kuikens op hortjiesvloere (0.21 teenoor 0.10, s.f. = 0.02), maar dieselfde tendens is nie binne die OBS gevind nie, waar mortaliteite soortgelyk was ongeag die tipe vloerbedekking.
Groot verskille tussen jare het egter voorgekom in die gemiddelde oorlewing en maand-oud gewigte van kuikens
tabel 1: gemiddeldes en standaardfoute (SF) om die invloed van behuisingstipe en vloerbedekking op die liggaamsgewig en mortaliteite van volstruiskuikens tot op 1 maand ouderdom te beskryf. (P=Betekenispeil)
Maatstawwe
Maand-oud gewig (kg)Mortaliteit (%)
Maand-oud gewig (kg)Mortaliteit (%)
Omgewingsbeheer4.4
0.10
hortjiesvloere4.5
0.09
Oop kuikenhuis4.2
0.15
Strooi4.1
0.16
SF
0.20.02
SF0.2
0.02
P
0.160.055
P0.02
0.004
Behuisingstipe
Vloerbedekking
Daar was ‘n jaar by vloerbedekking interaksie vir beide maand-oud gewig (P=0.057) en mortaliteit tot 1 maand (P=0.009), met vloer wat slegs tydens jaar 1 ‘n betekenisvolle invloed op maand-oud gewig (Figuur 1) en mortaliteit (Figuur 2) gehad het. Die interaksie tussen jaar en behuisingstipe wat egter nie betekenisvol nie.
(P <0.001, Tabel 2). Die gemiddelde gewigte en mortaliteite vir die onderskeie jare word in Tabel 2 aangetoon. Gedurende jaar 1 het die hoogste kuikenmortaliteit voorgekom en was die gemiddelde maand-oudgewigte van die kuikens die laagste.
Figuur 1. gemiddeldes vir die jaar by vloerbedekking interaksie vir maand-oud gewigte van volstruiskuikens. Lyne bokant die kolomme dui standaardfoute aan.
Figuur 3. Verskille in gemiddelde temperatuur buite en binne die kuikenhuis (oop kuikenhuis en toe omgewingsbeheerde stelsel) tydens die onderskeie proefjare soos daagliks gemeet om 7h00 en 17h00. Lyne rondom gemiddeldes dui standaardafwykings aan.
Figuur 4. gemiddelde variasie (standaardafwyking) in die temperatuur geneem teen 7h00 of teen 17h00 binne (oop kuikenhuis en toe omgewingsbeheerde stelsel) en buite die kuikenhuis
Figuur 2. gemiddeldes vir die jaar by tipe vloerbedekkinginteraksie vir mortaliteite tot op 1 maand. Lyne bokant die kolomme dui standaardfoute aan.
Figuur 3 toon die verskille in heersende temperatuur tussen die twee behuisingstipes en die buitetemperature vir die proeftydperke. Dit was duidelik dat die buitetemperature baie meer gewissel het as die temperature binne in die kuikenhuis (Figuur 4). Die wisseling in die OBS was die minste, maar steeds meer as verwag siende dat die temperatuur veronderstel was om volgens ‘n voorafgeprogrammeerde program beheer te word.
Bespreking
Die tipe behuising het nie ‘n groot invloed gehad op oorlewing of gewig nie – waarskynlik omdat die omgewingstoestande binne die twee huise nie aanmerklik verskil het nie, soos gesien kan word uit die temperatuurdata in Figure 3 en 4. Die temperatuur binne die OBS is klaarblyklik nie baie akkuraat beheer nie. Hoë omgewingstemperature en kapasiteitsprobleme met die gasverwarmer kon moontlik hiertoe bygedra het. Die humiditeitsensor moes ook ontkoppel word weens probleme met die gelyktydige beheer van temperatuur en humiditeit.
tabel 2. gemiddelde gewig en mortaliteite van die onderskeie jare se proewe oor behuisings- en vloerbedekkingsbehandelings. Die tyd van die jaar waartydens die proef gedoen is word by elke jaar in hakies aangedui.
Maatstawwe
Aantal kuikens per groep
Maand-oud gewig (kg)
Mortaliteit (%)
1 (Nov. 2005)
39-40
3.1a
29.0a
2 (Aug. 2006)
40
4.4b
3.1b
3 (Okt. 2007)
21.22
5.4b
6.0b
s.f.
0.5
5.2
Jaar
a,b,c dui betekenisvolle verskille (P≤0.001) in rye aan
22 AgriProbe | December 2011 23AgriProbe | December 2011
Die omgewing binne die OKH, daarenteen, was meer stabiel as verwag, moontlik weens die struktuur van die gebou wat die kuikens redelik goed beskerm teen ekstreme buitetemperature. Die ventilasie binne die OKH sou egter waarskynlik minder effektief wees as in die OBS, waar ‘n uitsuigwaaier gebruik is om ventilasie te bevorder. Die opbou van ammoniak (NH3), ‘n toksiese gas wat vrygestel word van die kuikens se uitskeidings, kan problematies wees in die afwesigheid van voldoende ventilasie (Deeming et al., 1996). Die lugvloei en ammoniakvlakke is egter nie gemeet nie en dit is dus moeilik om te bepaal of die natuurlike ventilasie binne die OKH voldoende was of nie.
Die tipe vloerbedekking het wel ‘n invloed op gewig en kuikenoorlewing gehad, wat veral tydens jaar 1 duidelik was. Die strooi wat met skadunet bedek was is nie ideaal vir volstruiskuikens nie, aangesien die oppervlak redelik glad is en geneig was om aan te pak met fekale materiaal. Die kuikens het tydens jaar 1 beduidend swakker gevaar op die strooi en skadunet as op die hortjiesvloere. Die jaar by vloer interaksie kan moontlik te wyte wees aan die tye van die jaar waartydens die proewe gedoen is, alhoewel dit waarskynlik ‘n kombinasie van ongedefinieerde faktore was wat bygedra het tot die verskille tussen jare. Dit was egter duidelik dat behuising en vloerbedekking nie die belangrikste faktore was wat oorlewing en groei bepaal het nie. Lindvall (1981) het aangedui dat digtheid ‘n belangriker invloed op varke se gewigstoename gehad het as die tipe vloerbedekking. Die effek van digtheid op oorlewing en groei is gevolglik ook een van die faktore wat verder ondersoek moet word by volstruisproduksie, en wat ook moontlik die resultate van hierdie proef kon beïnvloed het.
Die resultate toon verder dat volstruiskuikens met ‘n redelike mate van sukses op hortjiesvloere grootgemaak kon word vir ‘n tydperk van 1 maand, sonder dat daar onder die hortjies skoongemaak word. Dit het wesenlike praktiese implikasies, siende dat die meeste vloeroppervlaktes daagliks skoongemaak moet word en dus baie arbeidsintensief is. Deeming et al. (1996) het aanbeveel dat die vloer onder plastiese hortjies elke dag skoongemaak moet word. Dit sou egter prakties onmoontlik wees sonder om stres by die kuikens te veroorsaak binne hierdie stelsel, en is gevolglik nie gedoen nie. Dit blyk dat die gebruik van higiëniese produkte, wat vog absorbeer en ammoniakgasse verminder, moontlik as plaasvervanger vir daaglikse ontsmetting kan dien. Hierdie moontlikheid sal verder ondersoek moet word om ekonomiese en praktiese implikasies teen mekaar op te weeg.
gevolgtrekking
Die resultate wys dat aanvaarbare resultate verkry kan word in ‘n verskeidenheid van produksiestelsels. Kuikens kan ook suksesvol grootgemaak word binne ‘n omgewingsbeheerde stelsel, wat tot groot voordeel benut kan word vir toekomstige navorsing om optimale toestande vir kuikenoorlewing en -groei te bepaal. Die doeltreffendheid van die bestaande verhitting-, verkoeling- en ventilasiestelsel moet egter verder ondersoek word en aanpassings kan gemaak word om die omgewing binne die OBS meer akkuraat te beheer.
Toekomstige proewe sal binne die OBS en OKH gedoen kan word, verkieslik op hortjiesvloere. Die moontlikheid om die kuikens langer op die hortjiesvloere binne die kuikenbehuising te hou voor hulle verskuif word na ander fasiliteite moet ook ondersoek word, aangesien die aanpassing tussen twee uiteenlopende omgewings stres kan veroorsaak tydens hierdie kritiese lewensfase van volstruiskuikens.
Bedankings
Groot dank is verskuldig aan die personeel op die Oudtshoorn Navorsingsplaas wat verantwoordelik was vir die tegniese uitvoering van die proef. Erkenning word verleen aan Aircontek Panelling (Pty) Ltd en Peninsula Poultry Appliances (Pty) Ltd vir die skenking van toerusting vir die omskakeling van die bestaande kuikenhuis. Finansiële bydraes deur die Wes-Kaap Landbounavorsingstrust word ook met dank erken.
Verwysings
Allen, G. & Morley, T., 1994. Environmental options for rearing ostriches. Milne’s Poultry Digest, October, 40-42.
Button, C., Kabay, M. & Rawlin, G., 1996. Ostrich fading syndrome in Australia. In: Improving our understanding of ratites in a farming environment (ed. Deeming, D.C.), Proceedings of a ratite conference, 23-26 March 1996, Manchester, United Kingdom. Pp. 35-38.
Cloete, S.W.P., Lambrechts, H., Punt, K. & Brand, Z., 2001. Factors related to high levels of ostrich chick mortality to 90 days after hatching in an intensive rearing system. Journal of the South African Veterinary Association 72, 197-202.
Glatz, P. & Miao, Z., 2008. Reducing mortality rates in ostrich chicks. RIRDC Publication No 08/187, www.rirdc.gov.au/fullreports/index.html
Lindvall, R.N., 1981. Effect of flooring material and number of pigs per pen on nursing pig performance. Journal of Animal Science, 53, 863-868.
Lowe, D.E., Steen, R.W.J. & Beattie, V.E., 2001. Preferences of housed finishing beef cattle for different floor types. Animal Welfare 10: 395-404.
Smith, C.A., 1993. Research roundup – ostrich chick survival presents challenge. Journal of the American Medical Veterinary Association, 203: 637-643.
Verwoerd, D.J., Deeming, D.C., Angel, C.R. & Perelman, B., 1999. Rearing Environments Around the World. In: The Ostrich: Biology, Production and Health (ed. Deeming, D.C.), CAB International.
Wojcik, A. & Horbanczuk, J.O., 2005. Comparison of the results of rearing ostriches on various floors. Animal Science Papers and Reports 23, 329-334.
This short information article is to introduce you to what these strange “things” are and what they (could) mean to us.
I have heard about truffles before and have always regarded it as some unaffordable, foreign delicacy. Be it the sweet type of chocolaty truffles or the obscure earthy “things”, dug out by dogs or pigs in European forests.
Of course we also have our own indigenous truffles from our arid regions, but they are something else altogether, for another article.
Since a few decades ago, we have fortunately been enlightened and the sweet truffles have become much more accessible to us and quite common. However, those “obscure, earthy” truffles are still fairly unknown to the average South African. The reason for this is most probably due to the fact that they occur naturally in European soils, are rather difficult to find and therefore are very expensive and sought after by the Europeans themselves. Until about 20 years ago, the average South African did not travel much overseas and were thus not exposed to the variety of these delicacies that have been admired in the Northern Hemisphere for ages past.
A truffle is a fungus, such as the commonly known mushrooms, but what differentiates it from ordinary mushrooms, is that truffles are always closely associated with the roots of trees. Thus these organisms are called mycorrhizal mushrooms. They live in a close relationship with the trees, aiding the tree roots in the uptake of phosphorus and nitrogen. Truffles’ culinary uses range form being eaten as slivers of the whole truffle on the plate, through to oils infused with it and many more.
Many different kinds of mycorrhizal mushrooms occur. Only a few examples (the more popular ones) are discussed in this article.• Black truffles of various kinds with the following common names : Périgord black truffle, Winter truffle, Burgundy truffle (2 – 10cm in diameter; very common all over the world) and Chinese truffle, the most important truffle from Asia (10cm or more in diameter). These truffles look very similar and are difficult to differentiate, but they differ tremendously in popularity!• Italian white truffles (Tuber magnatum) being the most expensive truffle, have reached prices of € 5 000 - € 8 000 (approximately R50 000 – R80 000) per kilogramme. They grow associated with oaks and poplars, but are difficult to cultivate, since their spores do not germinate well. They also do not preserve well.
The Périgord black truffle reaches selling prices of between $145 - $5005 / kg (approximately R1 015 to R35 035) according to Dr. Ian Hall, truffle researcher from New Zealand.
He has been involved in establishing the truffle industry in his country with the ground
breaking idea that truffles can be produced in the Southern Hemisphere and thus delivers this delicacy in the “out” season to the very wanting Northern Hemisphere! Australia, New Zealand and Chilli already have actively producing plantations. Successful trials
TRuFFLes – whaT They aRe AND WhAt thEy MEAN tO SOUth AFRICANS
The southern parts at high altitude in South Africa pose a real possibility for this agricultural business opportunity. Best truffle growth occurs at 16-17 degrees Celsius. Soil pH of 7.8 is optimal and high levels of calcium are necessary. Harvesting time in South Africa would be from about July to September, if truffles were formed in the previous December. It still seem to be a very finite activity, needing expert advice and good research, proven by the fact that even at average temperatures of almost 25 degrees Celsius, truffles are produced in areas in Carolina, USA.
The attached map was prepared by mr Mike Wallace of the Institute for Resource Utilisation at Elsenburg. It shows areas in South Africa where the climatic conditions corresponds with other areas in the world where truffles are produced successfully. (Adapted from original table by Ian R. Hall & Allison Frith. For more information see “Taming the Truffle” by Ian Hall, Alessandra Zambonelli & Gordon Brown.)
As with all living organisms, natural enemies of truffles (and their producers!) occur. Poplars and willows have competitive fungi that can threat or replace truffles. The truffle trees are also attacked by pathogenic fungi, such as Phytophthora cinnamomi which can kill off a truffle tree. The truffle itself can also suffer from bacterial rot and virus or nematode attack. Further challenges to venturing in the commercial production of truffles include that it requires manual labour, no pesticides or herbicides may be used, no trained dogs or pigs are present for harvesting, research possibilities in South Africa are limited and rounding off all of these, is the fact that us South Africans have no history with truffles!
This very intriguing field can be investigated by all interested parties via many informative web sites, but also a local company called Woodford, with the following contact details: tel. : +27-21-7913953 • fax : +27-21-7914398cell.: +27-83-2251179e-mail : [email protected]
At present the Department of Agriculture of the Western Cape does not play any active role in this industry, but enquiries are welcome and can be directed to our Plant Pathology Laboratories at :tel.: +27-21-8085269 • fax : +27-21-8085266
PéRIgORD BLACK tRUFFLE PRODUCINg AREAS : CLIMAtE MIN MAX
Latitude (˚:’) N 36 : 10 49 : 03Latitude (˚:’) S 28 : 22 43 : 54Elevation (m) 6 1344Annual rainfall (mm) 345 1443accumulated degree days (<10˚C) 568 2729Mean daily temperature in summer (January) [˚C] 14.5 25.5Mean daily temperature in winter (July) [˚C] 1.6 10.4annual sunshine hours 1704 ≈3400“Summer” sunshine hours (Sept. - April) 1079 1814
24 AgriProbe | December 2011 25AgriProbe | December 2011
Figure 2: Change in wine imports in selected countries over the period 2001 to 2010.Note: Wine imports by Nigeria grew by 8 809% over the decadeSource: ITC (2011)
An alternative strategy may be to rather focus on second tier markets. This approach is proposed by Goldman Sachs (incidentally, also the originators of the “BRIC” story) who argues that the competition in certain developing markets are getting too stiff and that there is value in developing second-tier markets. The so called “Next-11” identified by them are Bangladesh, Egypt, Indonesia, Iran, South Korea, Mexico, Nigeria, Pakistan, Philippines, Turkey and Vietnam (Goldman Sachs, 2007).
The question that remains is whether local agricultural industries are succeeding in adapting to this changing environment. Failing to do so will leave local exporters (and their products) literally lost at sea.
References
Anderson, K (2011) Personal Communication. Executive Director of the Wine Economics Research Centre at the University of Adelaide, Adelaide, Australia.
Anderson, K & Nelgen, S (2011) Global wine markets, 1961 to 2009: A statistical compendium. University of Adelaide Press, Adelaide.
Goldman Sachs (2007) The N-11: More Than an Acronym. Global Economics Paper No: 153, Goldman Sachs Economic Research, New York, 28 March 2007.
ITC (2011) Trademap Database. http://www.trademap.org, International Trade Centre, Geneva.
PPECB (2011) Rooibos export statistics. Monthly Report to SARC, Perishable Products Export Control Board, Bellville.
Provide (2010) South African trade in 2008, focusing on agriculture, forestry and fisheries. Background Paper 2010: 1, Provide Project, Elsenburg.
SAOBC (2011) Export database. South African Ostrich Business Chamber, Oudtshoorn.
SAWIS (2011) South African Wine Industry Statistics. South African Wine Industry Information and Systems, Paarl.
Troskie, DP, Reynolds, S, Punt, C & Lombard, JP (2011) Impact of Thailand’s market closure to South African Fresh Produce. Bureau for Food and Agricultural Policy, Western Cape Department of Agriculture, Elsenburg.
Troskie, D (2010) The Common Agricultural Policy of the EU: up for debate. AgriProbe 7 (2) 4- 5.
fresh fruit in 2007 has already cost the Industry more than R1 billion. Furthermore, 256 jobs (99,5% black; 49,6% female) were lost and the irrecoverable net farm income were as high as 18,9% in certain areas in particular years (Troskie et al, 2011).
the culture of change in global wine trade...
For casual observers today global wine trade at the turn of the previous century holds a number of unexpected surprises. In 1909 Algeria was single handed responsible for 41% of the 1 654 Mega litres of global exports of Wine. Second on the list was Spain with 19% and then France at 12% of total exports. South Africa, with the rest of Africa, barely contributed 1% to global wine exports. On the import side France imported more than half (51%) of all wines, followed by Switzerland (10%), Germany (7%) and then Brazil, Argentina and the UK each at 4% of global imports. Since then the volume of wine imports has increased more than five-fold and is currently calculated to be 8 632 Mega litres (Anderson & Nelgen, 2011). Especially over the last decade this trend of rapid volume growth can also be observed in value terms. Over the previous ten years the value of wine more than doubled from $13,2 billion in 2001 to close to $28,5 billion in 2010 (ITC, 2011).
At the same time the relative importance of importing countries has also changed dramatically. Whereas France was the biggest importer of wine at the turn of the previous century (principally from Algeria), the United Kingdom occupied this position in 2001 (20,0% of all wine imports) with France relegated to the 9th and Switzerland to 6th position. The USA was second (17,8%) followed by Germany (13,3%). At that stage Japan (6,0%) was the biggest eastern wine importer. Together the eleven biggest wine importers (all Northern Hemisphere countries) were responsible for 83,1% of wine imports leaving the rest of the world with 16,9% of the value of imports (Figure 1). Brazil, at 0,5% of global wine imports, was the biggest Southern Hemisphere importer followed by New Zealand (0,5%) and Australia (0,4%) (ITC, 2011).
By 2010 this picture has again changed dramatically. Although the United Kingdom (15,9%), the United States of America (15,7%) and Germany (9,5%) continued to occupy their respective places as the three most important wine importing countries in 2010, it was with smaller shares of a much bigger market. Indeed, whereas these three countries were responsible for 51% of wine imports in 2001, their combined share declined to 41% in 2010. Canada displaced
the Western Cape Agricultural Sector is export driven...
It should not come as a surprise that the Western Cape Province of South Africa is the main conduit for South African Agricultural exports. After all, it was the need to supply passing ships with fresh fruit and vegetables that resulted in the establishment of a Dutch Colony, with all its consequences, at the Cape of Good Hope in 1652. Whilst the rest of South Africa’s Agricultural Sector focussed on the local market (particularly after the discovery of gold and diamonds resulted in a flourishing domestic demand for agricultural products), Western Cape farmers remained predominantly export focussed. Due to this historical focus on exports and because of its coastal location, South Africa’s institutional and physical infrastructure for the export of farm products is indelibly linked to the Western Cape Province. The result is that 45% of South Africa’s Agricultural Exports is finding its way through this Province (Provide, 2010) despite its natural resource challenges.
The implication is that the Western Cape Agricultural Sector is proportionally more exposed to the export market for its wellbeing than is the case of South Africa in general. For instance, more than 90% (R2,1 billion) of the income received by the Ostrich Industry originates from the export of meat, skins and feathers (SAOBC, 2011). Similarly, in the case of plums more than 74% of the volume of production is on average annually exported (Hortgro 2010)) and in the Wine Industry 48,5% of the wine harvest was exported in 2010 (SAWIS, 2011). Even smaller and indigenous industries such as Rooibos sell more than 55% of their products abroad and in certain years it is even as high as 66% of sales (Calculated from PPECB, 2011).
...but leaves it vulnerable to international change.
It was argued in the AgriProbe of June 2010 that the Western Cape export market is still dominated by Europe and more stringent rules and regulations should be expected (see Troskie, 2010). In the meantime the economic situation in Europe has become increasingly under threat with resulting changes in consumer demand and credit worthiness. Even the United States’ investment status was downgraded from AAA to AA+; the first time since 1941. The vulnerability of the Western Cape Agricultural Sector to the vagaries of the export market was clearly illustrated by an impact analysis of partial market closure. In the case study it was shown that the closure of 0,45% of the market for South African
Figure 1: the eleven most important wine importing countries in the World in 2001 and 2010. Source: ITC (2011)
Japan in the contest for the fourth position and an even more interesting tussle took place at the bottom end of the top eleven countries. Denmark, France and Sweden lost their membership of this club and were replaced by Hong Kong (3,7%), Russia (2,9%) and China (2,8%). As an indication of the market diversification that took place in the global wine markets the residue of countries was responsible for 28,2% of wine imports in 2010; a significant increase from the 16,9% in 2001.
...is picking up pace...
A better picture of the contest is probably provided by Figure 2. Macao and Hong Kong (both markets in their own right but also gateways to China) as well as China itself had growth rates higher than 1 500% over the past decade. This information, combined with the data in Figure 1 informs us that this phenomenal growth takes place from an already significant basis. It is worth the while to note that India’s imports grew by 1 300% over this period and a number of African countries are also playing in the major league. Nigeria (8 809%), Gambia (2 909%), Chad (1 177%) and the DRC (1 055%) all grew by more than a thousand percent over this period; albeit from a much smaller base.
Of particular interest is the fact that a number of established wine importers performed worse than the global average import growth of 115%. These countries include the Netherlands (99%), USA (89%), United Kingdom (71%) and Germany (54%).
...requiring shifts in focus, attitudes and ways of doing business.
It is clear that the changes we are observing on the macro-economic terrain are being reflected in trade patterns: the demand for value added farm products are shifting towards the developing world. Countries such as China and India are becoming increasingly important markets for food products and particularly certain value added products substantially contributing to the Agricultural Sector of the Western Cape Province.
However, as this data is freely available and a number of analysts across the globe are coming to the same conclusion, competition in these alternative markets is becoming fierce. For instance, it is reported that Jacob’s Creek, one of Australia’s biggest wine companies, has identified China as a major market for the future. It is not only aggressively entering this market, but has also acquired 30 000 hectares of land to produce wine in China and in this way circumventing cumbersome import requirements. (Anderson, 2011). The implication is that, when these markets are entered, it should not be done at a piecemeal approach.
26 AgriProbe | December 2011 27AgriProbe | December 2011
The total value of buffaloes sold during 2011 as on 06 October 2011 is R197,5 million which in itself contributed more than 40% to the total gross product of game species sold during 2011. No wonder many a commercial farmer is investigating diversifying into this kind of alternative agricultural enterprise.
This strong and healthy industry is the way to go when firstly direct income is to be generated through sales, secondly when secondary income is to be generated through ecotourism and arguably the most important spin-off is that important gene pools are now being conserved and expanded to the benefit of both the agricultural as well as the nature conservation industries!
The Department of Agriculture has a comprehensive up-to-date database on the value of individual game species and track is kept of price movement within this industry. All enquiries are welcome and can be made to the author.
The policy framework gives rise to a number of key programmes that focus on renewable energy as an important economic sector:• creating an enabling environment for investment in the sector (removing red tape, making industrial manufacturing precincts available and facilitating business-to-business linkages)• developing the skills supply required for the sector• promoting research, development & innovation in the sector• harnessing national incentives for investment and manufacturing in renewable energy.
This strategy is aimed at ensuring that a significant proportion of the renewable energy investment stated in the RFP is located in the Western Cape, and that this investment maximises job creation in the province. The strategy also recognises that there must be a balance between the need to grow the economy and promote job creation, on the one hand, and the protection of natural resources on the other. This balance must be achieved, for example, between ensuring that wind and solar plants are constructed in the province, and ensuring that this activity does not cause the loss of large tracts of valuable agricultural land or significant heritage sites. At the same time, if a farmer can continue with his or her original farming activity while also earning an income from the installation of wind turbines on the farm, the deployment of renewable energy could have a positive outcome for both farmer and wind or solar developer.
In November 2010, the Western Cape Department of Economic Development & Tourism established the GreenCape Initiative, a special purpose vehicle mandated to implement its strategy for the development of the renewable energy sector. The GreenCape Initiative works in conjunction with the Department of Economic Development & Tourism, the Department of Environmental Affairs & Development Planning, the City of Cape Town, the Western Cape Investment and Trade Promotion Agency (Wesgro), and the institutions of higher learning in the province.
The GreenCape Initiative will support renewable energy manufacturing projects through a clustering approach. One of the key steps in this regard has been to secure access to low-cost land to facilitate the co-location of companies in the renewable energy value chain. Land has been identified in Atlantis, (located on the outskirts of Cape Town) and the Cape Town City Council has received the first expressions of interest from potential manufacturers. Discussions are also under way with the Small Enterprise Development Corporation and entities such
The Western Cape has abundant wind, solar and wave resources that can be converted into energy – renewable energy. Renewable energies provide a major opportunity for the province to achieve the multiple goals of energy security, a low carbon economy and employment creation. Up to 50% of the wind energy potential in South Africa is located in the Western Cape, while large sections of the province have excellent solar irradiation. At a global level, renewables are viewed as the “new technological wave”, and a number of countries have set very high targets for replacing coal-fired power with renewable energy. The Western Cape believes that it could become a renewable energy hub for South Africa and the Southern African region.
In August 2011, the national government announced a tender for 1850 MW of wind power, and a further 1450 MW of solar power. We believe that at least 1000 MW of wind and 200 MW of solar PV will be installed in the Western Cape between 2012 and 2014. These power plants will come into operation in the second half of 2014. Wind farms will be located along the West Coast, in the Great Karoo and in the Overberg region, while solar farms will be concentrated in the Karoo region.
Furthermore, the Western Cape is ideally located to serve as a supplier base for the neighbouring Northern Cape, which is estimated to have the best solar irradiation potential in South Africa. The capital investment that will flow into the province over the next decade as a result of renewable energy development amounts to approximately R30 billion.
The strategy of the Provincial Government of the Western Cape (PGWC) with regard to the development of the renewable energy sector starts with the White Paper on Sustainable Energy for the Western Cape Province (2010), which sets targets for energy efficiency and explores ways in which to utilise renewable energy. The White Paper sets a provincial target for energy efficiency improvement of 15% by 2014. This target is expressed in relation to the forecast provincial energy demand at the time, taking into account the national energy demands, and thus allowing for expectations of economic growth. Renewable energy electricity generation in the Western Cape must equal 15% of the baseline energy consumption by 2014. This target is likely to be achieved, as the first utility-scale renewable energy plants are expected to come on-stream by June 2014.
Photo: Christo Nowers
thE WEStERN CAPE tO ShARE IN thE DEVELOPMENt OF RENEWABLE ENERgy
BUFFALOES CONtINUE thEIR MOMENtUM IN gRABBINg MEDIA AttENtION
reach a record turnover of close to R450 million which is way above the R303,5 million of the previous year. The number of game sold at game auctions remained fairly stable the last three years and is in the order of 14 000 animals, also indicating that on average the price per animal continued to increase in spite of harsh economic conditions.
Buffalo farming seems to be highly profitable as game farmers are increasingly becoming aware of the need to discriminate between sex and age groups within a specific species. If the performance of buffalo as a species is scrutinised, the following interesting statistics are revealed:
Senatla, a buffalo bull from the private Thaba Tholo Game Reserve nearby Thabazimbi realised a new South African record price of R18 million at a recent auction! This magnificent bull of five and a half years has a set of horns of some 50 inches. This record price follows on last year’s record of R9,2 million paid for a bull. The 800 people that attended this auction saw numerous game species record prices paid with a duiker reaching R5 600, Cape eland cows (R16 500), gemsbok cows (R10 000), nyala bull (R33 000), impala breeding group (R3 440), impala ram (R21 000), steenbok (R8 000), Zambian sable antelope cows (R925 000) and Matetsi sable antelope cows reaching R340 000! The auction generated in total R91,3 million which is more than the total values of all game sold in 2007! At this stage it seems as if the game farming industry will
28 AgriProbe | December 2011 29AgriProbe | December 2011
Early research findings in the sunflower region show that both sunflower yield and the abundance of pollinators decreased with distance from natural habitat. The conservation of natural vegetation patches within sunflower farmland could help to increase pollinator diversity, which in turn can improve honeybee movement between plants, enhancing cross-pollination. Findings also show that the distance from hives is important for honeybee visitations, suggesting that additional colonies may need to be provided during the flowering period to ensure good seed yields. Research will be ongoing in the sunflower, apple and onion regions until 2013.
The linkage to the world of managed honeybees is vitally important to the Global Pollination Project in South Africa, and part of the research will investigate the reliance of certain crops on managed honeybees. In South Africa, the managed honeybee industry is reliant on two services that nature provides for free (ecosystem services): 1) forage provision (to sustain the colony and produce honey); and 2) colony replacement (replenishment of a beekeeper’s colony stock from the capture of wild bees). Therefore, while the commercial crop grower becomes more reliant on the beekeeper for the pollination service their honeybees provide, the beekeeper in turn becomes more reliant on numerous, and at times controversial, forage sources that can sustain their colonies throughout the year, even when no crops are flowering.
This issue has birthed the Honeybee Forage Project, a project funded by the Working for Water Programme and implemented by SANBI and the Agricultural Research Council. The relative importance (quantity and quality) of the various honeybee forage resources in South Africa and their management is very poorly understood and this project aims to contribute to this knowledge base. Some forage species that are vitally important to beekeepers are classified as alien invasives in South Africa in the Conservation of Agricultural Resources Act (CARA). Seven Eucalyptus or gum tree species are listed in CARA and, as gum trees are thought to be responsible for almost 60% of honey production in South Africa, the CARA regulations cause serious concern for beekeepers. The Honeybee Forage Project research aims to investigate possible alternatives to Eucalyptus, and also present recommendations on the management of honeybee forage at regional and national scales.
With the human world’s need for food security, our reliance on the honeybee and other wild pollinators is growing. Therefore, our reliance on viable forage resources, sustainable habitats, and healthy environments for our pollinators is also growing. However, land use for the sole purpose of pollinator forage or as a pollinator habitat is financially unsustainable, so the land and forage species need to have a primary use (such as forestry, agriculture, conservation, recreation). Strategies for the future will have to include landscape-level management of pollinator forage and habitat, awareness of what forage species should be planted and where, and better landscape-level management of pesticides. The two projects hope to address some of these strategies.
There are intimate linkages between crop agriculture, honeybee management, wild pollinators and biodiversity conservation, and such linkages are becoming more important to understand every day.
For further information on the two projects, contact the author.
Globally, honeybees are the most important pollinator of commercial pollinator-dependant crops, with at least 90% of these crops reliant on honeybee services. While wild insect pollinators such as butterflies, bees and beetles are also vital (particularly for the pollination services they provide to natural vegetation), no other insect besides the honeybee can be managed by humans in the numbers required for the pollination of large-scale commercial crops. About 50 crops in South Africa are insect pollinated, with these crops worth over R10 billion annually and supporting at least 100,000 jobs. The flowering time of these crops are short, lasting from a few days to only a few weeks, requiring the services of numerous honeybee hives at the same time. Some 87% of the managed honeybee hives in the Western Cape are used for commercial pollination, with pollination services being responsible for over 60% of beekeepers’ incomes. The strategic importance of honeybees notwithstanding, there is mounting evidence of a global “pollination crisis” with the mysterious disappearance in Europe and North America of hundreds of thousands of managed honeybee colonies, as well as declines in populations of other wild pollinators. The honeybee losses have been termed Colony Collapse Disorder (CCD), an as yet unexplained phenomenon blamed variously on pesticides, environmental pollution, genetically-modified crops, honeybee pests and diseases, the loss of suitable forage for honeybees, and the overworking of managed honeybees needed to service commercial agriculture. In a word, global honeybee populations are ‘stressed’ making them vulnerable to any new perturbation. Thus far South African honeybee populations have not exhibited significant losses, probably because of the relatively unmanaged state of African honeybees, but the recent advent of ‘new’ bee diseases in South Africa suggests that our bees are now more vulnerable and stressed than was previously the case.
Understanding the extent to which world agriculture is threatened by pollinator decline is crucial, both for food security and biodiversity conservation, and has lead to the development of the Global Pollination Project. This Global Environmental Facility (GEF) project is implemented through the United Nations Environment Programme (UNEP) and executed by the Food and Agriculture Organisation of the United Nations (FAO) in coordination with the governments of seven project partner countries: Brazil, Ghana, India, Kenya, Nepal, Pakistan and South Africa. In South Africa, it is being implemented by the South African National Biodiversity Institute’s (SANBI) Applied Biodiversity Research Division based in Cape Town. The project runs until the end of 2013, and entails carrying out scientific research on pollinators and pollination in three agricultural crops: apples near Elgin and Ceres; onion seed production near Oudtshoorn; and sunflower (for oil) production near Bela-Bela. Each crop is highly dependent on insect pollination, and most of the farmers rely on managed honeybees to ensure adequate pollination. Some farms are situated next to natural vegetation and obtain an ecosystem service of pollination from wild pollinators, thus providing an interesting mixture of wild and managed pollination services. The project will investigate pollinator trends of diversity and abundance, pollination deficits, and will determine the management practices that may help to conserve pollinators. Outputs from the project will include landscape level Management Plans, capacity building and public awareness material, scientific articles, insect pollinator specimen records, and recommendations for improving current policy and legislation.
streams are important factors in determining which solution a local council chooses.
Biomass generated from other sources such as farm produce waste or agro-processing waste has the potential significantly to increase the energy that can be generated from waste. An article in the March 2011 edition of AgriProbe has already explored biomass as a source of renewable energy – in particular in the agricultural context. It was argued that there are significant challenges in the local context – one of which is the cost of the technology where the financial incentives provided by the state are too low to make waste-to-energy projects feasible at farm level. Another issue is whether South Africa will adopt a smart metering system that allows an independent, small-scale power producer to feed electricity into the grid and to get paid for what is fed into the power network.
The importance of a pilot project such as the biogas digester on the Department of Agriculture’s farm in the George region is that is demonstrates how different combinations of biomass could potentially be used to generate not only biogas for electricity generation, but also potentially a quality of biogas that could be used as cooking or transport fuel. This last possibility will be explored more fully in the coming months, as the potential for other forms of biofuel (planting crops for the production of biodiesel) may be limited.
Renewable energy clearly holds interesting development opportunities for the Western Cape. The future of power dispensation is a mix of utility-scale power plants and decentralised power generation – fully integrated with the grid or completely off-grid. While there will be significant investment in utility-scale power plants, over time, more and more small-scale power producers will enter the sector, including members of the agricultural sector.
Selected bibliographyDepartment of Energy. 2011a. Electricity Regulation Act No.4 of 2006: Electricity Regulations on the Integrated Resource Plan 2010-2030. Government Gazette, 5 May 2011. [Online] Available: http://www.info.gov.za/view/DownloadFileAction?id=146081
Department of Energy. 2011b. Request for Qualification and Proposals for New Generation Capacity under the IPP Procurement Programme, 3 August 2011.
Department of Environmental Affairs & Development Planning. 2010. White Paper on Sustainable Energy for the Western Cape Province. [Online] Available: http://www.capegateway.gov.za/Text/2010/7/white_paper_-_sustainable_energy_western_cape.pdf
REN21. 2011. Renewables 2011: Global Status Report. [Online] Available: http://www.ren21.net/Portals/97/documents/GSR/REN21_GSR2011.pdf
as Eskom and Sasol with regard to the establishment of a green tech incubation hub in Atlantis. This initiative is aimed at supporting small scale manufacturers in setting up and commercialising concepts and products.
It is further envisaged that the Western Cape will be the home of the South African Wind/Renewable Energy Centre (SAREC), which will take responsibility for the training of technical staff in the wind energy sector (artisan level). This programme recognises the excellent research capacity of the institutions of higher education in the province, and the training capacity at Technical University and the Further Education and Training College levels. All four of the universities are involved in research within the renewable energy field, each with their own focus.
Current research is engaged with both the refinement of technologies already in application in South Africa as along with the development of new technologies that may have particular application in Southern Africa. The province wants to build on its academic strength and encourage cooperation with leading regions in the renewable energy field. Western Cape Universities host a number of students from the sub-Saharan region, thereby facilitating capacity development throughout the region, and gaining recognition as an African leader in the field of renewable energy research and development.
SAREC will complement this by hosting additional wind research & development facilities. The research & development facilities will open opportunities for larger-scale wind technology development than what is currently available within the research institutions in the province. Indications are that the scope of such a centre will have to be broadened to include training, research & development in other renewable energy technologies.
The municipal waste problem in South Africa represents another key area for renewable energy development. There is a growing awareness of the fact that waste is not simply waste – it is potentially an important resource. In the first place, methane gas can be captured from landfill sites, which reduces the amount of this greenhouse gas being released into the atmosphere. Potentially, this could be a significant source of income for the owners and/or operators of the landfills, and could be a source for trade in carbon credits – credits that can be earned for the reduction in greenhouse gas emissions.
Municipalities are also exploring the possibility of reducing the amount of waste sent to landfill by utilising that waste for electricity generation. The City of Cape Town has undergone a detailed process of analysing the waste streams generated in the City, and has embarked on a process to establish waste-to-energy facilities at several of its waste handling sites. Smaller municipalities have also made varying progress in this regard. The work already done suggests that the quantity of waste and the composition of the waste
“If the bee disappears from the surface of the earth, man would have no more than four years to live. No more bees, no more pollination… no more men!” (Unknown)
is required for fodder and oilseed crops, and for producing the seeds of most vegetable crops. Insects, birds, bats, and other animals serve as pollinators while they forage for their own survival, consequently providing a free service upon which we depend more than we probably realise. A world without pollinators would mean a world of far less food choices, more expensive food, and a vastly changed agricultural sector.
This statement, falsely attributed to Einstein and probably a fabrication, has nonetheless been prominently quoted in the world-wide media in the past few years, illustrating the global concern regarding the health of global honeybee populations, and the importance of this insect to the world as we know it. Animal pollination is required for approximately one-third of human food consumed on the planet – mostly the fruits and vegetables we rely on for a healthy and balanced diet. In addition, animal pollination
30 AgriProbe | December 2011 31AgriProbe | December 2011
- Cooperation in the area of good governance - this concept may provide a good platform for healthy competition between the regional governments within the Forum initiative.- Yantai International Wine Festival and the Food Festival together to underline the agricultural component to future bilateral co-operation and used as a platform to promote wine and other products from both provinces. - Other potential areas of co-operation include aquaculture and vegetable production. Since the Western Cape Province has started exploring these it could learn more from Shandong on these areas. A huge potential for vegetable production is attributed to the growing Chinese population in South Africa. Potential also exist for both provinces to exchange researchers and students. - In addition, medicinal/herbal technology to cater for the growing demand of healthy products especially the neutraceutical segment is another possible area of cooperation. - The Agri Mega Exhibition was also highlighted as another future platform for cooperation as two of the Shandong Province companies have already participated in AgriMega Week 2011. An invitation from Minister Van Rensburg was well received by the Shandong government as agricultural machinery is also one of their strong points.
There was a great interest shown in the South African wines as the Pavilion was always occupied by Chinese wine importers and the public. This was also observed at the South African Gala Dinner that was attended by more than 100 Chinese wine importing companies. This could have been a result of the wide media coverage that South African wines received from the local newspapers and television during the festival. The delegation was advised that producers and exporters attending the festival should regard the event as an important first step in entering the Chinese market. However, a lot of work will have to be done to position South African wines in the Chinese market which is currently dominated by the French. There are already indications of positive results as two of the companies that participated in the event have received orders from the Chinese importers. A commitment to participate to the festival again in 2012 is supported by most of the wineries that took part in the 2011 event.
Bilateral relations between Shandong and the Western Cape Provinces are underpinned by several instruments of co-operation dating back from the year 2000. As part of the implementation of the resolutions adopted at the 5th Regional Leaders’ Summit, the visit to Shandong Province led by Minister Van Rensburg was, in essence, a strategy to promote trade and investment opportunities for the South African wine industry in China and to engage with the Shandong political leadership on matters related to opportunities for Chinese companies in the Western Cape.
The delegation comprised of 22 businessmen mainly from the wine industry and senior government officials from the Provincial Government of the Western Cape. The visit, once again, underlined the goodwill that exists towards South Africa with China. Minister van Rensburg together with senior officials of the Provincial Government of the Western Cape met with several strategic political figures, business and academic institutions. Among the list is the Vice Governor of the Shandong Province; Mayor of the Yantai Municipality People’s Government; Shandong Department of Agriculture; Shandong Academy of Agricultural Sciences; Yantai Agricultural Bureau and Yantai Agricultural Science. The delegation also met with the senior management of various well known wine companies in China i.e. Yantai Gisbelle Wine Campany Ltd and Yantai Changyu Pioneer International Limited.
The Shandong Province shares lots of similarities with the Western Cape Province as both have a strong agricultural focus. The Shandong Province’s economy grew by almost 3.9 trillion RMB during the last financial year. This makes Shandong the 3rd largest and fastest-growing province in the People’s Republic of China. The province is the lead producer and exporter of agricultural products in China, which was made possible by extensive research into alternative methods of farming and food production. This was also observed during the visits made at various institutions.
Areas of cooperation identified by governments, business and academia include the following:- Regional Leaders’ Summit (RLS) Co-operation – the RLS is a strategic platform for sub-national government co-operation to identify specific areas of co-operation in response to the growing needs of the population, especially from an economic development perspective.
WEStERN CAPE gOVERNMENt AttENDED thE FIFth yanTai inTeRnaTionaL wine FesTivaL, 23 – 26 SEPtEMBER 2011, ShANDONg PROVINCE, ChINA
According to Dirk Human, Chairman of the SMA, the agreement with the Department of Agriculture cements the alliance between the two. “The Department is a vital partner of the SMA. Along with our other partners, we’re working together to make agriculture sustainable, while conserving our biodiversity.” He said signing the Memorandum of Cooperation with the Minister proved government’s commitment to conservation, good farming practices and rural development.
The long-term management of the SMA is occurring through a number of integrated programmes. These are: restoring the environment, building a tourism offering, producing biodiversity products, skills development and community upliftment, land development and sustainable agriculture. Together these programmes allow the SMA to fulfill its triple bottom line requirements. Human says, “The programmes, particularly our tourism development, will contribute to rural development in the area. They will mean more jobs, more skills, more training and will focus on the well-being of all who live here.”
The SMA’s tourism venture received a major fillip recently, when the first buffalo calf in approximately 200 years was born on the Agulhas Plain. Records show buffalo were last seen here in the late 1700s. Aside from buffalo, the SMA has also reintroduced hippo, red hartebeest and eland into its 46,000 hectares.
The 29th congress of the South African Society for Agricultural Technologist (SASAT) was hosted by the Western Cape branch at Phantom View River Resort outside Knysna with “Going Green” as the theme for the congress. The aim of the South African Society for Agricultural Technologists (SASAT) is to serve the needs of agricultural technologists, under an umbrella body where their specialized talents can be noted, shared and innovated upon, in the interest of progress and improved standard living.
The SASAT consists of 4 branches countrywide which are Western Cape, Mpumalanga, North West and Gauteng. Delegates from over the country attended the congress to present scientific papers and posters, including five technologists from the Institute for Animal Production and Resia Swart received the first prize for her poster, titled “The prediction of oleic and linoleic acid content of sunflower seeds using near-infrared reflectance spectroscopy (NIRS)”.
The Minister of Agriculture and Rural Development in the Western Cape, Gerrit van Rensburg has signed a Memorandum of Cooperation with the Nuwejaars Wetland Special Management Area (SMA). The official signing took place at Agri Mega Week, held in Bredasdorp in September. It’s the first agreement of its kind between the Department of Agriculture and a group of landowners in the province.
The Memorandum of Cooperation ensures the Department and the SMA will work together on new projects on the Agulhas Plain, where the SMA venture is situated.
According to Hennis Germishuys, District Manager: Landcare for the Overberg Region, the agreement formalises the past cooperation between the two for the future. “Through this collaboration, we’re marrying conservation and agriculture , for the benefit of communities and people. “
Through rural development consultant, Matthys de Wet, the Department and the SMA have identified further cooperation opportunities. Germishuys said, “We are looking at utilising invasive alien plants in the SMA to generate energy, with charcoal as a byproduct. The charcoal can also be used in the compost manufacturing process, which the SMA is already undertaking.” The initiative will not only create sustainable jobs, but will also benefit the land and promote sustainable agriculture.
The Nuwejaars Wetland Special Management Area includes 25 landowners in the Overberg district who are collectively managing their land for conservation, while promoting sustainable agriculture. Members have had title deed restrictions signed against their properties to ensure conservation principles are followed. The SMA has applied for Protected Environment (PE) status, and will become the first national PE if granted.
Land included in the venture is home to more than 100 endangered fynbos species, many of these listed on the red list as critically endangered. Threatened Renosterveld is also found here, along with highly irreplaceable wetlands.
WEStERN CAPE AgRICULtURE SIgNS gROUND-BREAKINg DEAL WIth LANDOWNERS
Fltr: Christo Human (first prize - best paper presentation), Resia Swart (first prize - best poster presentation), Musa Mtileni (first prize – best practical presentation), Freddie Barnard (President: SASAT)
Fltr: Dirk Human and Minister Gerrit van Rensburg
Western Cape Senior Delegation meeting with The Yantai Municipal People’s Government