An Effective Approach to Retrofit Existing Station Service Distribution
Systems in a Hydroelectrical Generating Station
By
Kang Liu
A thesis submitted to the Faculty of Graduate Studies of
The University of Manitoba
In partial fulfillment of the requirements for the degree of
MASTER OF SCIENCE
Department of Electrical and Computer Engineering
University of Manitoba
Winnipeg, Manitoba, Canada
Copyright © 2018 by Kang Liu
i
Abstract
A Station Service Distribution System (SSDS) plays an important role in a
hydroelectric generating station. It provides a reliable power source to feed various loads
inside a generating station. Throughout years of operation, SSDS equipment could fail
due to aging, and replacement parts may not be readily available. The utilities are,
therefore, facing many challenges in maintaining the SSDS system availability and
protecting the safety of the site personnel in generating stations.
This thesis proposes an effective approach and several methodologies to resolve
the engineering challenges related to retrofitting an existing station service distribution
system in a hydroelectrical generating station. The approach does not follow the
traditional technical path, but rather a techno-economic method considering system
robustness, operation cost, and safety from a long-term point of view. The approach and
methodologies developed in this thesis are evaluated in a case study to validate their
applicability.
Conclusions show that the developed approach and methodologies effectively
improve the station service distribution system in a hydroelectrical generating station.
The same approach and methodologies can be applied to any generating stations facing
with similar issues.
ii
Acknowledgement
First of all, I would like to express my sincere thanks to my advisor Dr. Shaahin
Filizadeh for his full support and guidance throughout my thesis work. It was a privilege
to work under his supervision.
Secondly, I would like to Mr. David Hildebrand at Manitoba Hydro for sharing
his vast and valuable expertise and knowledge.
I wish to express my appreciations to Dr. Rajapakse and Dr. Derksen for the
comments and feedback to improve my thesis.
Last but not least, I would like to take this opportunity to thank my family and my
beloved ones for their encouragement and support. They are always on my side and their
supports are unconditional.
Without the help of these people, this thesis work would not be possible to
complete.
iii
Table of contents
Abstract ................................................................................................................................ i
Acknowledgement .............................................................................................................. ii
Table of contents ................................................................................................................ iii
List of Tables .................................................................................................................... vii
List of Figures .................................................................................................................... ix
List of Abbreviations ......................................................................................................... xi
Chapter 1 - Introduction ...................................................................................................... 1
1.1 Problem Definition ............................................................................................... 3
1.2 Motivations of Research ....................................................................................... 4
1.2.1 High Fault Current Level on Generator Bus ................................................. 4
1.2.2 Need for Review - Protection System ........................................................... 6
1.2.3 Non-compliance of Modern Codes and Standards: Arc Flash Hazards ....... 7
1.3 Objective .............................................................................................................. 9
1.4 Thesis Organization ............................................................................................ 10
Chapter 2 - Literature Review........................................................................................... 11
2.1 Hydroelectric Station Service Distribution System ........................................... 11
2.2 Fault Current Limitation Techniques ................................................................. 11
2.3 CT Saturation Determination ............................................................................. 13
2.3.1 CT AC Saturation Analysis ............................................................................. 14
iv
2.3.2 CT DC Saturation Analysis ............................................................................. 15
2.4 Risk-Based Failure Mode and Effect Analysis (RB-FMEA) ............................. 17
2.5 Design Guides and Standards ............................................................................. 18
2.5.1 Fault Considerations ................................................................................... 18
2.5.2 Protection Coordination .............................................................................. 19
2.5.3 Modern Industrial Standards for Protective Equipment (Medium- and Low-
Voltage Circuit Breakers) ......................................................................................... 22
2.5.4 Arc Flash Hazard Quantification – IEEE 1584 ........................................... 23
2.5.5 Arc Flash Hazard Quantification – Constant Energy ................................. 28
Chapter 3 - Proposed Approach and Methodologies ........................................................ 32
3.1 CT Saturation ..................................................................................................... 33
3.2 Adding a Current-Limiting Reactor (CLR) ........................................................ 33
3.3 TRV & RRRV Analysis ..................................................................................... 36
3.3.1 Current-Limiting Reactor Associated TRV and RRRV Violations ............ 37
3.4 Voltage Regulations ........................................................................................... 38
3.5 Short Circuit Fault Level and Equipment Duty ................................................. 41
3.6 Arc Flash Hazard Mitigation .............................................................................. 43
3.7 White Box Model of RB-FMEA ........................................................................ 44
Chapter 4 – Application and Evaluation of the General Approach .................................. 48
v
4.1 Case Study Background ..................................................................................... 49
4.1.1 Case Study Review ..................................................................................... 52
4.2 New System Configuration ................................................................................ 56
4.3 Evaluations of the Impact of Current-Limiting Reactor .................................... 58
4.3 Protection Re-Modelling .................................................................................... 62
4.4 Voltage Regulation ............................................................................................. 65
4.4.1 High Impedance Station Service Transformer Model ................................ 65
4.4.2 Standard Impedance Station Service Transformer Model .......................... 68
4.5 Evaluations of Short Circuit Fault Level and Equipment Duty ......................... 70
4.6 Evaluations of Arc Flash Hazards and Mitigations ............................................ 72
4.6.1 Existing SSDS Arc Flash Assessment ....................................................... 73
4.6.2 New system configuration Arc Flash Assessment ..................................... 76
4.6.3 Comparison of Arc Flash Assessment Results .......................................... 78
4.7 Discussion of Keeping the Existing Two-Stage System Configuration ............ 80
4.8 Evaluation of White-Box Model RB-FMEA .......................................................... 82
4.8.1 Evaluation of Operation Life-Cycle Cost with White-Box Model of RB-FMEA
................................................................................................................................... 92
Chapter 5 - Contributions, Conclusions, and Future Work .............................................. 93
5.1 Future work ........................................................................................................ 95
vi
References ......................................................................................................................... 96
Appendix A – Detailed Equipment Data Used in the Thesis ............................................. A
vii
List of Tables
Table 2. 1- LV Circuit Breaker Test Setup ....................................................................... 23
Table 2. 2- Factors for Arc Flash Incident Energy and Protection Boundary Calculation 26
Table 2. 3 - Example of Hand Calculation by Using the IEEE 1584 Formulas ............... 27
Table 2. 4 - Constant k Lookup Table .............................................................................. 29
Table 3. 1 - Recommended Voltage Variable Limits ....................................................... 39
Table 4. 1 - Capacitance Value used in PSCAD/EMTDC Simulation ............................. 59
Table 4. 2 - Voltage Analysis with High Impedance Transformer Model ....................... 67
Table 4. 3 - Voltage Analysis with Standard Impedance Transformer Model ................. 69
Table 4. 4 - MV Circuit Breaker Short-Circuit Duty Report ............................................ 70
Table 4. 5 - LV Circuit Breaker Short-Circuit Duty Report ............................................. 71
Table 4. 6 - Comparison of arc flash assessment results .................................................. 79
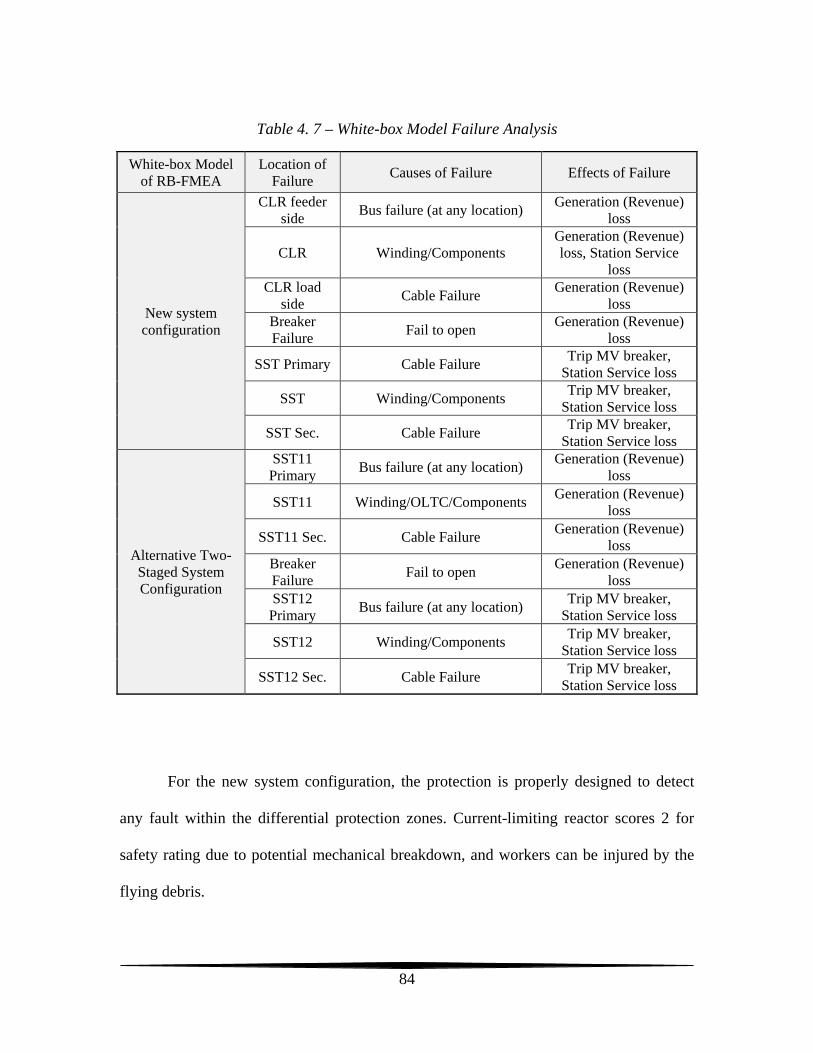
Table 4. 7 – White-box Model Failure Analysis ............................................................... 84
Table 4. 8 – White-box Model of RB-FMEA Safety Rating Scores ................................ 85
Table 4. 9 – White-box Model of RB-FMEA Environmental Damage Rating ................ 87
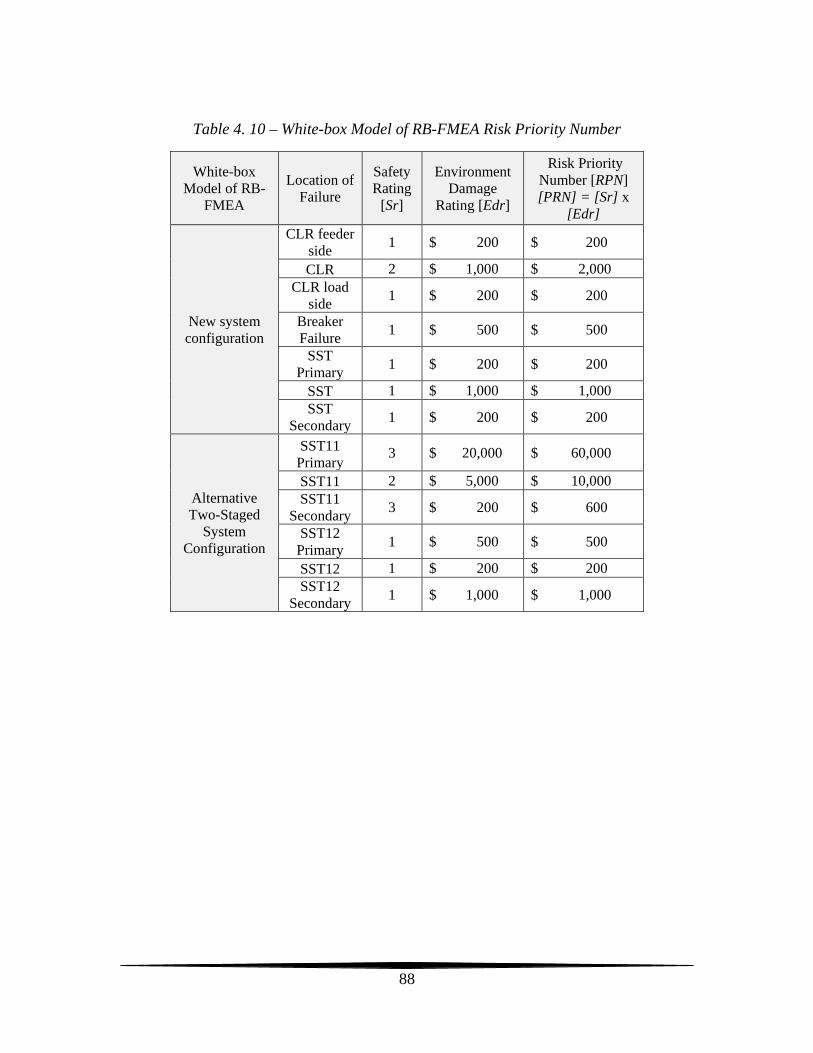
Table 4. 10 – White-box Model of RB-FMEA Risk Priority Number ............................. 88
Table 4. 11 – White-box Model of RB-FMEA Labour Cost ............................................ 89
Table 4. 12 – White-box Model of RB-FMEA Failure Cost ............................................ 90
Table 4. 13 – White-box Model of RB-FMEA strategy failure cost ................................ 91
Table 4. 14 – Operation Life-Cycle Cost with White-Box Model of RB-FMEA ............ 92
Table A. 1 – 230 kV System Data ..................................................................................... A
Table A. 2 - Generators Nameplate Data ........................................................................... A
viii
Table A. 3 - Transformer Nameplate Data ........................................................................ A
Table A. 4 - Medium Voltage Circuit Breaker Nameplate Data ........................................ B
Table A. 5 - Low Voltage Circuit Breaker Nameplate Data ............................................... B
ix
List of Figures
Figure 1. 1 – Cross-sectional view of a generating station intake and powerhouse ........... 2
Figure 1. 2 – Current Flow Before and After a Fault Occurs ............................................. 5
Figure 1.3 - Incident Energy (kA vs time) .......................................................................... 9
Figure 2. 1 - Sample TCC Curve ...................................................................................... 21
Figure 2. 2 – Example of Constant Energy Arc Flash Assessement ................................ 30
Figure 3. 1- Flowchart of the Proposed Approach ............................................................ 32
Figure 3. 2- Two Parameter TRV Envelopes for Circuit Breaker below 100 kV [21] ..... 37
Figure 4. 1 - Station Service Distribution System (SSDS) Single Line Diagram ............. 51
Figure 4. 2 – System Configuration of Load Group 1 ...................................................... 51
Figure 4. 3 – System Configuration of Load Group 2 ...................................................... 52
Figure 4. 4 - Generator Bus Fault Current Level .............................................................. 53
Figure 4. 5 - CT Saturation PSCAD/EMTDC Model ....................................................... 55
Figure 4. 6 - CT Saturation using PSCAD/EMTDC Results ............................................ 56
Figure 4. 7 – New System Configuration Electrical Single Line Diagram ...................... 57
Figure 4. 8 - Initial PSCAD/EMTDC model .................................................................... 59
Figure 4. 9 - TRV Plot for Fault Location #1 ................................................................... 60
Figure 4. 10 - Enlarged TRV Plot for Fault Location #2 .................................................. 61
Figure 4. 11– New System Configuration Protection Scheme (Generator G1 line-up) ... 63
Figure 4. 12 – Section of Arc Flash Assessment on Existing 4.16 kV System ................ 74
Figure 4. 13 – Arc Flash Assessment of Existing 600 V SS1 Switchboard ..................... 75
Figure 4. 14 – Arc Flash Assessment of Existing 600 V SS1 Switchboard Loads ........... 76
x
Figure 4. 15 – Arc Flash Assessment of 600 V SS1 Switchboard Load 1 (New
Configuration) ................................................................................................................... 77
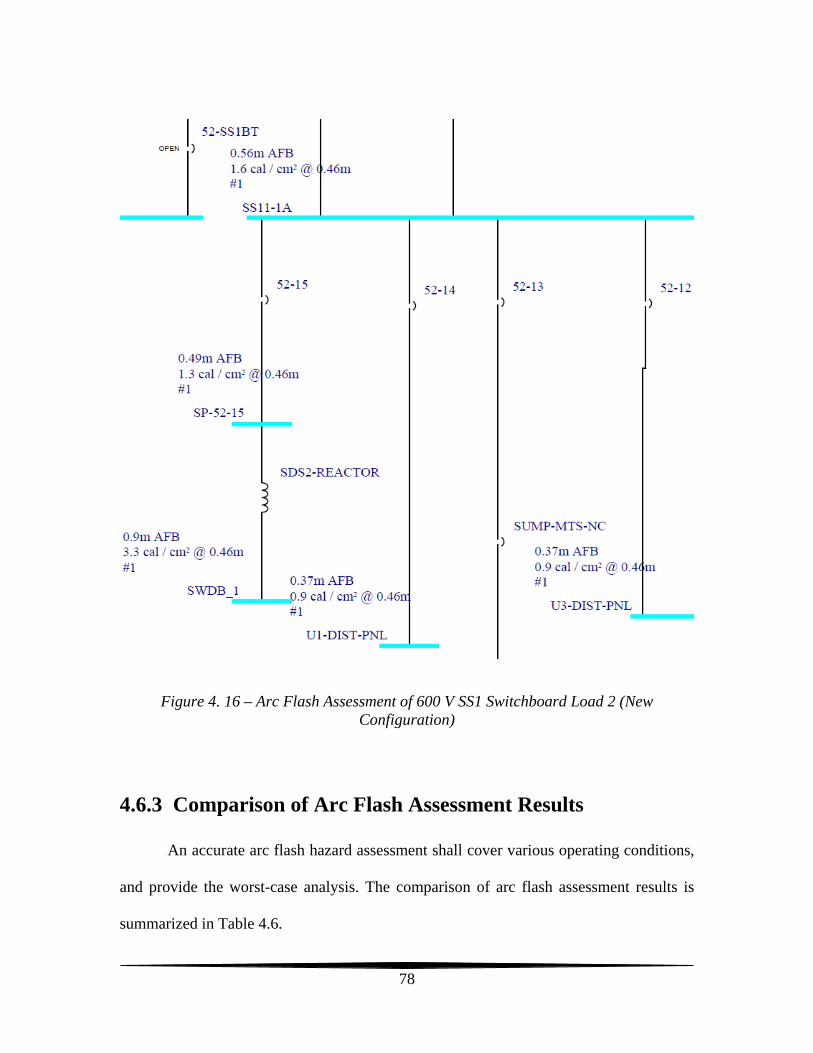
Figure 4. 16 – Arc Flash Assessment of 600 V SS1 Switchboard Load 2 (New
Configuration) ................................................................................................................... 78
Figure 4. 17 – TCC curve identifying cable damage ........................................................ 81
xi
List of Abbreviations
- CSA: Canadian Standard Association
- CLR: Current-Limiting Reactor
- CT: Current Transformer
- DTC: De-energized Tap Changer
- GCB: Generator Circuit Breaker
- HRC: Hazard Risk Category
- IEEE: Institute of Electrical and Electronics Engineers
- LV: Low Voltage
- MV: Medium Voltage
- OLTC: On-Load Tap Changer
- PCB: Polychlorinated Biphenyls
- PPE: Personal Protective Equipment
- PT: Potential Transformer
- SSDS: Station Service Distribution System
- SST: Station Service Transformer
- TCC: Time Current Curve
1
Chapter 1 - Introduction
Hydroelectricity has been the main source of power generation in Canada for
more than a century. In 2015, about 60% of Canada’s electricity was produced by
hydroelectric generating stations [1]. A hydroelectric generating station produces
electricity by having water fall through a directed channel to propel a hydro turbine,
which in turn drives a generator. A typical hydroelectric generating station consists of:
- A powerhouse: A building that houses turbines, generators, intake and tailrace
gates, control and protection devices, and auxiliary equipment. It is the heart of a
generating station where electricity is produced.
- A reservoir: An artificial lake to store water for power generation that provides
flood control at the same time.
- A spillway structure: A flood control structure with a number of spillway gates to
maintain proper and regulated water level in a reservoir.
- A switchyard: A substation that houses a generator step-up transformers (GSU),
high voltage (HV) breakers, HV disconnect switches, and various other electrical
equipment. The electricity is stepped-up to a much higher voltage in the
switchyard to be transmitted to reduce transmission losses.
Figure 1.1 shows a cross sectional view of a typical hydroelectric generating
station.
2
Figure 1. 1 – Cross-sectional view of a generating station intake and powerhouse
Courtesy of Manitoba Hydro [2]
3
1.1 Problem Definition
A Station Service Distribution System (SSDS) plays an important role in a
hydroelectric generating station. It is a key to provide a reliable power source to feed
various loads inside a generating station. Throughout years of operation, SSDS
equipment could fail due to aging and experience difficult maintenance issues. The
utilities are, therefore, facing numerous challenges in maintaining the supply robustness
and protecting the safety of the site workers in a generating station. It becomes necessary
to retrofit/upgrade existing SSDS systems.
There are design guides published by IEEE for electrical power service systems;
they provide essential design criteria and sound practices in general. However, these
design guides do not address any ongoing issues with existing generating stations.
A recent literature review indicates that there is no studies or published papers to
deal with common engineering challenges (such as high fault level on a generator bus),
and how to retrofit and/or improve a station service distribution system in a
hydroelectrical generating station.
4
1.2 Motivations of Research
A literature review indicates that there are no well-established approach and
procedures to deal with existing hydroelectrical generating station SSDS systems. This
thesis aims to develop a systematic approach and several methodologies to resolve
technical issues for long-term system availability, operation maintenance, and safety of a
hydroelectric generating station.
1.2.1 High Fault Current Level on Generator Bus
Many large hydroelectric generating stations throughout the world directly
connect their station service transformer and generator step-up transformer (GSU) to the
generator main bus [3]. From a technical standpoint, the generator is the most reliable
power source within the entire station. In case one or multiple generators are out of
service, it is possible to back-feed the station loads from the outside system grid via a
GSU.
However, this scheme leads to high fault current levels on the generator bus; and
the SST will be exposed to unacceptable thermal and mechanical stresses upon a fault at
its secondary side.
5
As an example, Figure 1.2(a) shows that each generator bus consists of one
generator, one SST transformer, and one GSU transformer. During normal operating
conditions, the generator is the source. It deliveries power to the outside grid and supply
station loads via SST. Upon a fault on the secondary of the SST transformer, the outside
grid and generator behave as sources of current; they all feed the fault location as
illustrated in Figure 1.2(b).
(a) (b)
Figure 1. 2 – Current Flow Before and After a Fault Occurs
(a) before the fault occurs; (b) after the fault occurs
6
1.2.2 Need for Review - Protection System
In general, due to the high fault current level on the generator bus, the station
service transformer protection system needs to be reviewed.
Protection CTs are designed to work in their linear region. Once the CT becomes
saturated it can introduce unacceptable errors and cause improper operation of the
protective devices. As the CT’s primary current increases, the voltage across the
secondary also increases. If the CT’s primary current is many times larger than its rated
current, high voltage spikes may be developed and damage the CT insulation [4].
Furthermore, the high fault current may damage the protective equipment. For
example, Schweitzer transformer protection relay, SEL-787, is a powerful multifunction
relay. It provides transformer over-voltage protection, over-current protection,
differential protection, and more. In the specification section of the relay data sheet, it
specifies that 1-second thermal limit of the relay CT input is 500 A [5]. If the relay sees
more than 500 A current at the CT input, the relay will be damaged.
7
1.2.3 Non-compliance of Modern Codes and Standards: Arc
Flash Hazards
Power generation, transmission, and distribution have been around for over 100
years, and their associated studies are well-established. Arc flash related topics are
relatively new but have drawn a great deal of attention to enhance workers’ safety.
Numerous regulatory bodies and jurisdictions, including NFPA, IEEE, and CSA, have
specific codes/standards on these subjects. Utilities are required to comply with the latest
version of safety codes and standards.
Arc flash is a condition of sudden release of energy due to an electrical arc [6].
An electrical arc is a flashover through air in electrical equipment from one conductor to
another conductor or ground. During an electrical arc flash, air becomes conductive.
Highly intense heat, sound blast, and pressure waves can be produced by an electrical arc.
The heat produced by the arc can reach up to 35,000 °F, which is four times the surface
temperature of the sun. This extremely high temperature can cause serious burn or fatality
[7].
Existing hydroelectric generating stations typically rely on overcurrent protection
to clear low voltage station service faults. Traditionally, protection coordination is
targeted at system availability, which means upon a fault the branch circuit shall be
tripped prior to the main feeder circuit. As long as the main feeder circuit breaker and
8
branch circuit breaker settings do not overlap with a margin, from a protection point of
view it is considered appropriate. Arc flash hazard analysis defines a new approach for
protection. Arc fault current and arc fault duration are the two major factors contributing
to the hazard level. Protective devices typically have large setting ranges, and there are no
set rules how to set up protective devices; all of these can cause unintentionally high arc
flash hazard level.
Arc flash hazard is the total amount of energy, known as incident energy, exposed
to human skin at a specified distance. It is measured in J/cm² or cal/cm²; it is common to
measure it in cal/cm² in Canada. Table 1.1 summaries the arc flash hazard risk category
vs incident energy [7]. Any work whose incident energy exceeds 40 cal/cm² is considered
dangerous, since workers cannot be protected from the blast’s energy wave.
Table 1. 1 – Arc Flash Hazard Risk Category vs. Incdient Energy
Arc Flash Hazard Risk Category Incident Energy (cal/cm²) 0 Less than 1.2 1 >1.2 and ≤4 2 >4 and ≤8 3 >8 and ≤25 4 >25 and ≤40
Arc flash incident energy is proportional to the fault current, duration of the fault,
and arc flash boundary. However, from historical incident data, the majority of arc
flashes occur during equipment maintenance or troubleshooting, when workers accidently
interact with energized electrical equipment. High fault current and slow fault clearing
time mostly contribute to higher incident energy. Figure 1.3 depicts the relationship
9
between fault current and duration of the fault. Example shows for the same fault current,
the longer takes to clear the fault, the higher resulted incident energy is.
Figure 1.3 - Incident Energy (kA vs time)
1.3 Objective
The objective of this thesis is to develop and evaluate a general approach and
several methodologies to resolve the above common issues identified in Section 1.2 for a
typical hydroelectric generating station SSDS system. The approach does not follow the
traditional technical path, but rather a techno-economic approach considering system
0
5
10
15
20
25
30
35
40
45
0 0.2 0.4 0.6 0.8 1 1.2 1.4 1.6
Inci
dent
Ene
rgy
(cal
/cm
²)
Fault Clear Time (s)
Incident Energy vs. Fault Clear Time with 5kA Fault Curent (Example)
10
robustness and availability, operation cost, and safety from a long-term point of view.
The approach and methodologies developed in this thesis are evaluated in a case study to
validate their applicability. The same approach and methodologies can be applied to any
generating stations facing similar issues.
1.4 Thesis Organization
This thesis is divided into five chapters as described below:
- Chapter 1: Introduces the thesis, describes the problem definition, research
motivation, and contributions;
- Chapter 2: Discusses findings of recent journal papers, and identifies
shortcomings. Completion of IEEE standards reviews provides the general
approach and methodologies guidelines. All the findings from this chapter help to
develop the general approach discussed in Chapter 3;
- Chapter 3: Proposes and discusses a new system configuration to retrofit the
existing SSDS system. The new configuration is generic and can be applied to any
generating stations facing with the similar issues;
- Chapter 4: Applies and evaluates the new system configuration and validates its
applicability;
- Chapter 5: Concludes the thesis with a discussion of future work.
11
Chapter 2 - Literature Review
2.1 Hydroelectric Station Service Distribution System
Existing literature on the topic of hydroelectric generating station service
distribution system is quite sparse with the exception of “Station Service Systems for
Large Hydroelectric Generating Stations” by Victor Tawtel and Roderick Stuart [3]. This
article provides a high-level overview of factors that need to be considered when
designing large hydroelectric generating stations. It classifies station service load types,
evaluates different locations to tap SST, and provides sizing guidance of a SST. This
article was published in 1968 and most of its recommendations and design factors are still
valid; however, it does not assess risks associated with each design consideration.
Moreover, it does not foresee the common engineering challenges discussed in Chapter 1,
and neither provides possible solutions to resolve these technical issues.
2.2 Fault Current Limitation Techniques
It is a common practice to have SST directly connected to the generator bus.
However, if the protection system for SST is not well designed, the SST can be
catastrophically damaged due to a fault. To reduce thermal and mechanical stresses on
12
the SST upon a fault, it is necessary to limit the fault current level on the generator bus
that is seen by the SST. In general, there are two ways to limit the fault current: the first
way is to add a current limiting reactor, and the other is to utilize a current limiter [8].
As Terence Hazel discusses in his paper, a current limiter typically has three
components: an explosively section-able conductor (virtually zero impedance), a current
limiting fuse (high impedance), and a fast trigger device [8]. During normal operation,
the current flows through the conductor, which effectively shorts out the current limiting
device. Upon detection of a fault current by the trigger device, it ignites the explosive and
interrupts the current path on the conductor, and forces the fault current to go through the
current limiting fuse. A current limiter is complicated in operation, and requires careful
maintenance of the trigger device.
Compared with a current limiter, a current-limiting reactor (CLR) is not only
more economical but also has negligible negative effects on the system reliability [9].
Also, it becomes more common to utilize a dry type air core CLR, because an air core
reactor has a fixed reactance at all currents, including a high-magnitude fault [10]. This is
an important characteristic of an air core reactor. Adding a current-limiting reactor at the
feeder side provides partial isolation of the load side from a feeder fault. Moreover, using
a CLR on the feeder circuit reduces the required short-circuit interruption capability of a
circuit breaker [11].
There are excellent papers that illustrate air core CLR applications in high voltage
transmission. It is well known that a CLR can affect both Transient Recovery Voltage
13
(TRV) and Rate of Rise of Recovery Voltage (RRRV). However, very little has been
focused on and studied for medium and low voltage applications inside a hydroelectric
generating station powerhouse. None of the resources in literature analyze the effects and
mitigation of impacts on medium voltage vacuum breaker associated with CLRs in a
hydroelectric generating station SSDS system.
2.3 CT Saturation Determination
In a power system, current is normally too high to be directly measured. A current
transformer (CT) is used to make indirectly measurement of the power current.
Like any transformer, the basic concept of CT is electromagnetic induction. When
a current flow through the primary winding of a CT, it creates magnetic fields and in turn
generates magnetic flux around the core. By the same concept, magnetic flux around the
core generates secondary current when the secondary winding connects a load (burden).
A CT normally have a single turn or a few turns at the primary winding, and a large
number of turns at the secondary winding [12]. The typically secondary current of a CT is
either 1A or 5A rated.
Ideally, the CT secondary current shall be in-phase of the primary current, and
also shall be proportional to the primary current in magnitude. When a fault current with
large magnitude flows the CT primary winding, it is maxed out magnetic flux density of
14
the CT core, then CT is saturated. As mentioned in Chapter 1, once the CT becomes
saturated it can introduce unacceptable errors and cause improper operation of the
protective devices. There are two types of CT saturation, symmetrical saturation (AC
saturation) and asymmetrical saturation (DC saturation). It is very important to exam
whether the CT is subjected to AC and/or DC saturation at the given fault current.
AC saturation is due to CT core cannot handle the high magnitude of the primary
current for a given burden. When the core reaches the maximum flux density, even
though the current is still flowing through the CT primary winding, there is no more
magnetic flux change, the CT secondary terminal voltage drops to zero, and hence the
secondary current drops to zero as well [12].
DC saturation is caused by a DC offset in the primary current. A high DC offset,
can cause CT quickly becomes saturated. The DC offset decays with a DC time constant.
The larger X/R ratio, the longer the DC time constant, it takes more cycles to have current
peaks becomes symmetrical.
2.3.1 CT AC Saturation Analysis
The following Formula 2.1, cited from Hargrave, Thompson and Heilman’s paper
[12], can be used to analyze whether CT is subjected to AC saturation.
15
𝐼𝐼𝑓𝑓𝑓𝑓𝑓𝑓𝑓𝑓𝑓𝑓𝐼𝐼𝑃𝑃𝑃𝑃𝑃𝑃𝑃𝑃
×𝑍𝑍𝐵𝐵 + 𝑅𝑅𝑠𝑠
𝑍𝑍𝐵𝐵,𝑆𝑆𝑆𝑆𝑆𝑆 + 𝑅𝑅𝑠𝑠 ≤ 20 (2. 1)
where,
𝐼𝐼𝑓𝑓𝑓𝑓𝑓𝑓𝑓𝑓𝑓𝑓 is the maximum fault current that flows through CT primary winding;
𝐼𝐼𝑃𝑃𝑃𝑃𝑃𝑃𝑃𝑃 is the CT primary current rating. For example, 400:5A CT, 𝐼𝐼𝑃𝑃𝑃𝑃𝑃𝑃𝑃𝑃 is 400;
𝑍𝑍𝐵𝐵 is the CT secondary burden;
𝑅𝑅𝑠𝑠 is the CT internal resistance;
𝑍𝑍𝐵𝐵,𝑆𝑆𝑆𝑆𝑆𝑆 is the standard burden of the CT. For example, for a C400 CT, 𝑍𝑍𝐵𝐵,𝑆𝑆𝑆𝑆𝑆𝑆 is 4 ohm.
However, it is very unlikely to have a symmetric fault current. When a short-
circuit fault occurs, there will always be a DC offset in the short-circuit current; this is
known as asymmetrical current. Therefore, it is more practical to analyze CT DC
saturation.
2.3.2 CT DC Saturation Analysis
The following Formula 2.2, cited from Hargrave, Thompson and Heilman’s paper
[12], can be used to analyze whether CT is subjected to DC saturation.
16
𝐼𝐼𝑓𝑓𝑓𝑓𝑓𝑓𝑓𝑓𝑓𝑓𝐼𝐼𝑃𝑃𝑃𝑃𝑃𝑃𝑃𝑃
×𝑍𝑍𝐵𝐵 + 𝑅𝑅𝑠𝑠
𝑍𝑍𝐵𝐵,𝑆𝑆𝑆𝑆𝑆𝑆 + 𝑅𝑅𝑠𝑠× (
𝑋𝑋𝑅𝑅
+ 1) ≤ 20 (2. 2)
where,
𝐼𝐼𝑓𝑓𝑓𝑓𝑓𝑓𝑓𝑓𝑓𝑓 is the maximum fault current that flows through CT primary winding;
𝐼𝐼𝑃𝑃𝑃𝑃𝑃𝑃𝑃𝑃 is the CT primary current rating;
𝑍𝑍𝐵𝐵 is the CT secondary burden;
𝑅𝑅𝑠𝑠 is the CT internal resistance;
𝑍𝑍𝐵𝐵,𝑆𝑆𝑆𝑆𝑆𝑆 is the standard burden of the CT;
𝑋𝑋𝑅𝑅 is the system X/R ratio.
The Formula 2.2 includes system X/R ratio to take account of DC offset. The DC
offset can cause significant CT saturation. The Formula 2.2 assumes the worst case DC
offset waveform, and therefore, is very conservative [12]. However, it provides a handy
tool to quickly check whether the given CT is subjected to DC saturation.
17
2.4 Risk-Based Failure Mode and Effect Analysis (RB-
FMEA)
Failure Mode and Effect Analysis (FMEA) has wide applications in
manufacturing processes, medical processes, and power systems to identify possible
failure modes and causes, and it is a proven way to mitigate the end effects of failures.
FMEA is a qualitative approach and is not self-informative. For example, a highly severe
but low probably failure mode may have the same scored rating as a less severe with
higher probability failure mode.
Risk-Based Failure Mode and Effects Analysis (RB-FMEA) was developed by
Salman Kahrobaee and Sohrab Asgarpoor [13]. Unlike the traditional FMEA, the RB-
FMEA incorporates the cost associated with possible failure modes. It introduces a new
quantitative way for FMEA based on failure probability and the associated cost for the
failure rather than a qualitative scaling.
In their paper, Kahrobaee and Asgarpoor developed and used RB-FMEA on wind
turbine technologies. For example, they use the resulted Cost Priority Number (CPN)
value to find the critical part of the overall wind turbine that is most likely to fail. This
method is developed to evaluate different wind turbine technologies. It is a useful tool for
designing and manufacturing, but cannot be directly adopted by utility companies.
18
Utilities have great responsibilities to protect worker safety and the environment.
The safety and environmental impacts shall be factored into the overall failure mode
analysis. The RB-FMEA model cannot be directly applied to power system analysis and
needs improvements and modifications that will be introduced in this thesis.
2.5 Design Guides and Standards
IEEE Standard 666 [14] provides guidance and explains good practices for station
service systems in generating stations. It contains examples of single line diagrams and
lists typical station service parameters. Safety, reliability, cost, operation, and
maintenance are identified as basic design considerations. At minimum, fault
considerations and protection coordination shall be evaluated in the design.
2.5.1 Fault Considerations
A short-circuit study is to determine the maximum fault current flowing during an
electrical fault. The short-circuit current (fault current) is used to select protective devices
and/or to verify short-circuit interrupting capability ratings. There are different types of
faults, and they can be classified as three phase faults, phase-to-phase faults, phase-to-
19
ground faults, and phase-to-phase-to-ground faults. Typically bolted symmetrical three
phase faults are considered, because it assumes no impedance between the phases and,
therefore, often represents the most severe of all fault types mentioned earlier. It is a
common practice to perform only three phase fault studies when determining the
maximum possible magnitudes of fault currents [15].
2.5.2 Protection Coordination
Protection coordination study is to set protective devices to detect, localize, and
interrupt the fault current to minimize the effects of the fault. In a properly designed
power system, if an electrical fault occurs on a downstream branch, the branch protective
device shall be tripped first; if the branch protective device fails to operate after a given
time delay, then the main protective device would operate and provide back-up
protection.
Time current curves (TCC) plotted on log-log scale graphs are used to graphically
represent how protective devices respond to various levels of overcurrent; they provide a
handy tool to review the protective devices coordination. In a TCC plot, current is shown
on the horizontal axis with respective voltages, and time is shown on the vertical axis.
Figure 2.1 shows a sample TCC curve [16]. The breaker curves are plotted in light
blue and magenta, and the transformer primary fuse curve is plotted in red. The
20
transformer damage curves are plotted in yellow. The solid damage curve represents a de-
rating based on winding connection type and the type of fault; the dotted curve represents
100% damage curve. Cable damage curves are in green lines. For a proper protection
design, the protecting devices, i.e., breakers, fuses, relays, etc., must be kept to the left of
the damage curves. In addition, upon an electrical fault, the branch protection shall be
tripped before the main breaker. The main breaker shall serve as backup protection in
case the branch circuit breaker fails to operate and interrupt the fault current.
21
Figure 2. 1 - Sample TCC Curve
Courtesy of David Paul from Maverick Technologies [16]
22
2.5.3 Modern Industrial Standards for Protective Equipment
(Medium- and Low-Voltage Circuit Breakers)
When a short-circuit fault occurs, there will be a DC component in the short-
circuit current; this is known as asymmetrical current. The DC component decays with a
DC time constant. For the medium and high voltage circuit breakers, the IEEE standard
defines the DC time constant as 45 ms, assuming X/R ratio = 17 in a 60 Hz system [17].
The larger X/R ratio, the longer the DC time constant. This could lead to a more difficult
scenario to interrupt the short-circuit current.
Unlike MV voltage circuit breakers, which are typically designed and constructed
to interrupt the short-circuit current within 5 cycles, low voltage (LV) circuit breakers are
typically ½ cycle rated. The currents at ½ cycle after fault initiation are used in
calculating the interrupting requirement of low voltage breakers [15]. The circuit breaker
interrupting ratings are based on symmetrical rms values. However, most LV circuit
breakers operate to interrupt the fault current before the first current peak is reached.
IEEE standards for low voltage breakers have adopted the symmetrical rating
structure. Circuit breakers are tested by manufacturers to validate the ability of the device
to successfully interrupt the fault current up to the device interruption rating. Depending
on the type of the device and its rated short-circuit current, the test current is required to
23
have a specific power factor and test X/R ratio. The test setup is summarized in Table 2.1
[18]:
Table 2. 1- LV Circuit Breaker Test Setup
Device Type Power Factor Test X/R
Low Voltage Power Circuit Breakers (LVPCB) 15% 6.6 Molded Case Circuit Breakers (≤ 10 kA) 50% 1.75 Molded Case Circuit Breakers (> 10 kA but < 20 kA) 30% 3.18 Molded Case Circuit Breakers (≥ 20 kA) 20% 4.9
2.5.4 Arc Flash Hazard Quantification – IEEE 1584
IEEE Standard 1584 provides the most comprehensive formulas to calculate the
incident energy releases from an arc flash hazard. The formulas are directly derived from
laboratory testing results. The formulas are still widely used and accepted in industrial
and commercial sectors for equipment up to 15 kV (3 phase).
The essential analysis process experts from IEEE 1584 are as follows [6]:
1. Calculate the bolted fault current;
2. Determine system voltage and system configuration, either grounded or
ungrounded and high resistance grounded;
3. Determine protective equipment operating time;
4. Determine working distance based on equipment and bus gaps;
5. Determine equipment configuration, either open or box;
24
6. Calculate the arcing currents Ia, and calculate another arcing current equal to
85% of Ia;
7. Calculate incident energy and protection boundary.
The key formula and information to calculate arcing current, incident energy and
protection boundary have excerpted from IEEE 1584 and re-stated below [6].
log10 𝐼𝐼𝐼𝐼 = 𝐾𝐾 + 0.662 × log10 𝐼𝐼𝐼𝐼𝐼𝐼 + 0.966𝑉𝑉 + 0.00526𝐺𝐺
+ 0.5588𝑉𝑉(log10 𝐼𝐼𝐼𝐼𝐼𝐼) − 0.0304𝐺𝐺(log10 𝐼𝐼𝐼𝐼𝐼𝐼) (2. 3)
log10 𝐼𝐼𝐼𝐼 = 0.00402 + 0.983 × log10 𝐼𝐼𝐼𝐼𝐼𝐼 (2. 4)
log10 𝐸𝐸𝐸𝐸 = 𝐾𝐾1 + 𝐾𝐾2 + 1.081 × log10 𝐼𝐼𝐼𝐼 + 0.0011𝐺𝐺 (2. 5)
𝐸𝐸 = 4.184 × 𝐶𝐶𝐼𝐼 × 𝐸𝐸𝐸𝐸 × �
𝑡𝑡0.2�
× �610𝑥𝑥
𝐷𝐷𝑥𝑥 � (2. 6)
𝐷𝐷𝐵𝐵 = �4.184 × 𝐶𝐶𝐼𝐼 × 𝐸𝐸𝐸𝐸 × �
𝑡𝑡0.2�
× �610𝑥𝑥
𝐸𝐸𝐵𝐵��
1𝑥𝑥 (2. 7)
where,
Ia is the arcing current (kA);
K is -0.153 for open configuration, and -0.097 for box configuration;
Ibf is symmetrical three-phase bolted fault current (kA);
25
V is system voltage (kV);
G is the gap between conductors (mm), refer to Table 2.2 for details;
En is incident energy (J/cm²) normalized for time and distance;
K1 is -0.792 for open configuration and -0.555 for box configuration;
K2 is 0 for ungrounded or high resistance grounded system and -0.113 for solid grounded
system;
E is incident energy (J/cm²);
Cf is a calculation factor, 1 for voltage above 1kV, and 1.5 for voltage equal or less than
1kV;
t is arcing time;
D is distance from possible arc point to the person (mm);
x is the distance exponent from Table 2.2.
For system voltage less than 1kV, Formula 2.3 shall be used to calculate arcing
current, and for system voltage greater than 1kV but less than 15kV, Formula 2.4 shall be
used to calculate arcing current.
26
Table 2. 2- Factors for Arc Flash Incident Energy and Protection Boundary Calculation
Excerpt from IEEE 1584 [6]
For a simple radial system, hand calculations using the IEEE 1584 formulas are
achievable. To illustrate the process, a spreadsheet is developed by adapting formulas
listed in IEEE 1584. Table 2.3 shows results of calculating incident energy, arc flash
protection boundary based and arc flash hazard classification. It is a requirement from the
standard that incident energy shall also be calculated based on 85% of expected arc
current, because 85% of expected arc current takes longer time to clear, thus may result
in a higher incident energy.
In the spreadsheet example, the fault current is 12.551 kA at 600 VAC un-
grounded system inside a box configuration. The calculated arcing current is 9.689 kA
with incident energy of 2.76 cal/cm²; the overall arc flash risk is classified as category 1
(HRC 1).
27
The example illustrates the capability of hand calculation with known parameters.
However, for non-radial and complex systems, hand calculation using formulas in IEEE
1584 is overly complicated.
Table 2. 3 - Example of Hand Calculation by Using the IEEE 1584 Formulas
Parameters Value Note Fault Current Ibf (kA) = 12.551-0.153 Open Conf. V (kV) = 0.6-0.097 Box Conf. G (mm) = 25
Fault Current Ibf (kA) = 12.551 Arcing time t (s) = 0.018V (kV) = 0.6 x = 1.641
G (mm) = 25Configuration (Enclosed or non-
Enclosed)Box Conf.
Arcing Current Ia (kA) = 9.689477788 Ground Configuration Un-Gronded85% of Ia (kA) = 8.236056119
0.24Arcing Current Ia = 9.689 kA
Parameters Value Note Incident Energy E (Cal/cm^2) = 2.176 J/cm^2-0.792 Open Conf. Boundary Distance Db (m) = 0.654 m-0.555 Box Conf. Arc Flash Classification CAT 1
0 Un-Gnd-0.113 Gnd, HRG
G (mm) = 25
En (J/cm^2) =9.924090169
System voltage (kV)Equipment
typeTypical gap between
conductors (mm)Distance x factor
En (cal/cm^2) = 2.381781641 Open air 10–40 2
85% of En (J/cm^2) = 8.435476644 Switchgear 32 1.473
85% of En (cal/cm^2) = 2.024514394MCC and panels
25 1.641
Cable 13 2
Cf = 1.5 Open air 102 2
Arcing time t (s) = 0.018 Switchgear 13–102 0.973
Working Dist. D (mm) = 455 Cable 13 2
x = 1.641 Open air 13–153 2
Incident Energy E (J/cm^2) =9.068713947 Switchgear 153 0.973
E (cal/cm^2) = 2.176491347 Cable 13 2
85% of E (J/cm^2) = 7.70840685585% of E (cal/cm^2) = 1.850017645 J/cm^2 Cal/cm^2
CAT 0 5.00 1.2CAT 1 16.67 4CAT 2 33.33 8
Parameters Value Note CAT 3 104.17 25Cf = 1.5 CAT 4 166.67 40En = 9.924090169Eb = 5 Open Conf. Box Conf.
t (s) = 0.018 K -0.153 -0.097x = 1.641 K1 -0.792 -0.555
Ibf = 12.551undary Distance Db (mm) = 654.0085489 Un-Gronded Gnd or HRG
Boundary Distance Db (m) = 0.654008549 K2 0 -0.113
K2 =
Flash Potential Boundary
Setting Parameters
Results
IEEE 1584 Table 4—Factors for equipment and voltage classes
K =
Arcing Current
Incident Energy
K1 =
0.208–1
>1– 5
>5–15
28
2.5.5 Arc Flash Hazard Quantification – Constant Energy
What if a work needs to be done without knowing the fault current? In this case,
determining the incident energy and arc flash protection boundary will not be possible.
The clearing time of a fault depends on the upper stream protective device or a
differential zone protection. “For a given location, there exists a series of potential
arcing fault current magnitudes and theoretical clearing times for which incident energy
remains constant” [19]. The constant energy lines can be plotted with the upper stream
protective device TCC curve to determine the arc flash hazard category. This is the
easiest and quickest way to quantify the arc flash hazard independently of system
maximum available short-circuit.
The governing equation for the constant energy lines is:
𝑡𝑡 = �
𝐸𝐸1.2�
× 𝑘𝑘 × 𝐼𝐼𝐼𝐼−1.081 (2. 8)
where,
E is the incident energy corresponding to different arc flash hazard category, e.g., 1.2
cal/cm²;
Ia is the magnitude of the arcing current;
29
k is the unique constant based on various system configuration parameters (refer to Table
2.4).
Table 2. 4 - Constant k Lookup Table [19]
Figure 2.3 illustrates an arc flash hazard assessment by using the constant energy
method. As shown in Figure 2.3, there are five constant energy lines have drawn on the
circuit breaker TCC curve, each line represents an arc flash hazard risk category level.
30
Figure 2. 2 – Example of Constant Energy Arc Flash Assessement
31
The constant energy lines from left to right represent:
- Blue line: Arc Flash Hazard Risk Category (HRC0);
- Cyan line: Arc Flash Hazard Risk Category (HRC1);
- Purple line: Arc Flash Hazard Risk Category (HRC2);
- Green line: Arc Flash Hazard Risk Category (HRC3);
- Red line: Arc Flash Hazard Risk Category (HRC4);
From right to left, which line intersects with the circuit breaker TCC curve short
time trip region first, the arc flash hazard risk category is classified as the next higher
level. For example, in Figure 2.3, the blue line (HRC0) line intersects with the breaker
short trip region and this breaker is classified as HRC1 risk hazard level. Therefore,
downstream any equipment protected by a Siemens ED6 type 15 A molded-case circuit
breaker (installed in an electrical panel) is classified as arc flash risk category 1 (HRC 1).
The constant energy line method provides the worst-case energy level and shall
only be used as a last resort without the need to perform a detailed short-circuit study.
However, the results can be very conservative. The constant energy method adapts IEEE
1584 formulas, and assumes the arcing time lasts up to 2 second. At the 2-second mark,
for most cases, it would most likely to be an overcurrent condition rather than a fault.
Otherwise, the protective device will trip in the instantaneous region, which results in a
much lower incident energy level.
32
Chapter 3 - Proposed Approach and Methodologies
A general approach and methodologies to retrofit and upgrade the existing SSDS
system are proposed in this thesis. The flowchart is also developed for implementing the
proposed general approach.
Figure 3. 1- Flowchart of the Proposed Approach
33
3.1 CT Saturation
Mathematically determining a CT saturation is discussed in Section 2.3. If a CT is
found to be saturated upon a fault inception, the CT needs to be replaced to properly
protect the critical assets in the hydroelectrical generating station.
A more accurate way is to utilize sophisticated a PSCAD/EMTDC model to
simulate the CT behavior upon an electrical fault with actual system and equipment data.
3.2 Adding a Current-Limiting Reactor (CLR)
As identified previously, due to the high magnitude of the fault current on the
generator bus, the SST is exposed to excessive thermal and mechanical stresses at fault,
potentially creating permanent damages. Currently, there is no medium voltage circuit
breaker commercially and economically available to interrupt high generator bus fault
current.
From a technical perspective, it is arguable that depending on the magnitude of
the maximum available fault current, generator circuit breaker (GCB) might be capable to
interrupt the fault current. However, it is not economical and practical to do so. First, the
GCB is quite expensive - it might be more expensive than a dry type station service
34
transformer, and there is no cost/benefit to use a GCB to protect a SST. Secondly, GCB is
large in size and it might be a challenge to place the GCB inside an existing hydroelectric
generating station power house.
Some utilities may decide to bear the risk of damaging critical assets, and accept
the prolonged outage. This thesis assumes it is not acceptable, and proposes a systematic
approach to resolve the high magnitude of the fault current on the generator bus issue.
From the literature review, the best way is to add an air-core current-limiting
reactor into the system to lower the fault current magnitude. The reduced fault current
will facilitate the installation of a medium voltage vacuum circuit breaker, providing the
capability of clearing SST faults. This allows for the implementation of a differential
protection scheme and to clear transformer faults without tripping the generator and GSU
protection zones. The medium voltage vacuum breaker also allows transformer switching
without interrupting generator operations.
Unlike GCB, a typical medium voltage vacuum circuit breaker is small in size and
can be placed in a metal enclosure with arc-resistant construction. The enclosure is a
special design to confine the arc flash incident energy with a directed channel and vent to
discharge the extremely hot arc flash blast wave. The arc-resistant enclosure is able to
minimize the risks and protect workers.
The CLR inductance can be calculated by the following formulas:
35
𝐿𝐿𝑆𝑆 = 𝑉𝑉
√3 × 𝐼𝐼𝑆𝑆𝑆𝑆𝑆𝑆 × 2𝜋𝜋𝐼𝐼 (3. 1)
𝐿𝐿𝑆𝑆 + 𝐿𝐿𝑆𝑆𝐶𝐶𝑅𝑅 = 𝑉𝑉
√3 × 𝐼𝐼𝑆𝑆𝑆𝑆𝐵𝐵 × 2𝜋𝜋𝐼𝐼 (3. 2)
𝐿𝐿𝑆𝑆𝐶𝐶𝑅𝑅,𝑓𝑓𝑃𝑃𝑓𝑓𝑓𝑓𝑓𝑓 = 1.05 × 1.5 × 𝐿𝐿𝑆𝑆𝐶𝐶𝑅𝑅 (3. 3)
where,
𝐿𝐿𝑆𝑆 is the short-circuit inductance from the system;
𝐿𝐿𝑆𝑆𝐶𝐶𝑅𝑅 is the inductance of the CLR;
𝑉𝑉 is the system voltage;
𝐼𝐼𝑆𝑆𝑆𝑆𝑆𝑆 is the short-circuit current of feeder side of CLR (excluding CLR short-circuit
current); and
𝐼𝐼𝑆𝑆𝑆𝑆𝐵𝐵 is the short-circuit current of load side of CLR (including CLR short-circuit current);
In case of a bolted three phase ungrounded fault and accounting for a nominal
operating voltage of 5% system over-voltage [20], the equivalent inductance for the first-
pole-to-clear is calculated in (3.3).
The disadvantage of adding the current-limiting reactor is, it may cause circuit
breaker failure in terms of TRV and RRRV violations, and create a voltage drop to have
36
the service entrance voltage beyond allowable limits. These two issues will be discussed
in the following sections.
3.3 TRV & RRRV Analysis
It is commonly known that a current-limiting reactor (CLR) affects both transient
recovery voltage (TRV) and Rate of Rise of Recovery Voltage (RRRV).
The TRV is the voltage that appears between the breaker terminals immediately
after the current interruption [21]; the breaker selection is considered acceptable if the
selected circuit breaker can withstand the TRV, RRRV, and the fault current [20]. If
either TRV or RRRV exceeds circuit breaker capability, it will cause a significant stress
on the circuit breaker, and ultimately causes breaker failure.
TRV rating of a circuit breaker is defined by an envelope. As per IEEE standard
C37.011, a two-parameter envelope is used. The two parameters are [20]:
- Uc = TRV peak value, in kV
- T3 = Time to reach Uc, in ms
Also, RRRV is defined by Uc divided T3.
The general characteristics of two parameter envelope for circuit breaker rated
100 kV and below are shown in Figure 4.1, where Isc is the rated short-circuit current
37
[20]. The 0.1Isc, 0.3Isc, 0.6Isc and 1.0Isc are also known as T10, T30, T60 and T100,
respectively.
If the TRV oscillation cross or beyond the envelope (horizontal line), then it is
considered as TRV violation. If the RRRV cross the sloped portion of the envelope, it is
considered as RRRV violation. The green, orange, blue, and blue curve shown in Figure
1 provide example of accepted simulated TRV and RRRV results in respect of T10, T20,
T60 and T100 envelops.
Figure 3. 2- Two Parameter TRV Envelopes for Circuit Breaker below 100 kV [20]
3.3.1 Current-Limiting Reactor Associated TRV and RRRV
Violations
38
In case the TRV or RRRV exceeds the standardized values or circuit breaker
capability, there are three common ways to mitigate it:
- Add capacitance across CLR terminals to reduce the TRV frequency;
- Add capacitance across the circuit breaker terminals to reduce the RRRV;
- Select higher interrupting rating or voltage rating for the circuit breaker to lower
the requirements of TRV and RRRV
3.4 Voltage Regulations
Given the fact that the generator voltage may swing up to ±5% in normal
operating conditions along with the voltage drop across CLR and SST, the voltage at the
service entrance point shall be within acceptable voltage ranges specified by CSA C235
standard. Adding a CLR adds an impedance to the feeder system, which in turn reduces
the voltage at the service entrance point. The following table is excerpted from CAN3-
C235 standard [22] to specify voltage limits.
39
Table 3. 1 - Recommended Voltage Variable Limits [22]
Voltage regulation shall be carefully reviewed to ensure the added current-
limiting reactor does not have a negative impact to the station service loads. This thesis
has developed a formula to evaluate the voltage regulation of an existing hydroelectric
generating station based on:
- Generator output voltage swing;
- Station service transformer tap position;
- Station load profile
Comparing with the transformer and current-limiting impedances, it is assumed
that the cable resistance is negligible. The governing equation for service entrance point
voltage is:
40
𝑉𝑉𝑠𝑠𝑠𝑠𝑠𝑠 = �� 𝑉𝑉𝑔𝑔𝑔𝑔𝑔𝑔,𝑜𝑜𝑜𝑜𝑜𝑜
𝑉𝑉𝑔𝑔𝑔𝑔𝑔𝑔,𝑔𝑔𝑜𝑜𝑛𝑛� + %𝑇𝑇𝐶𝐶 − %𝐿𝐿𝐿𝐿𝐼𝐼𝐿𝐿 × (𝑍𝑍% + 𝐶𝐶𝐿𝐿𝑅𝑅%)� × 𝑉𝑉𝑃𝑃 (3. 1)
where,
Vsep is the service entrance point voltage;
𝑉𝑉𝑔𝑔𝑠𝑠𝑓𝑓,𝑜𝑜𝑓𝑓𝑓𝑓 is the generator output voltage swing; typically +/- 5%;
𝑉𝑉𝑔𝑔𝑠𝑠𝑓𝑓,𝑓𝑓𝑜𝑜𝑃𝑃 is the nominal generator output voltage. Since the SST is directly tapped off
from the generator bus; 𝑉𝑉𝑔𝑔𝑠𝑠𝑓𝑓,𝑓𝑓𝑜𝑜𝑃𝑃 can also be the rated HV voltage of the SST;
%𝑇𝑇𝐶𝐶 is the SST tap position. For de-energized tap changer, it typically has five taps,
±5%, ±2.5% and neutral tap;
%𝐿𝐿𝐿𝐿𝐼𝐼𝐿𝐿 is the station load profile;
𝑍𝑍% is the SST impedance;
𝐶𝐶𝐿𝐿𝑅𝑅% is the current-limiting reactor impedance;
𝑉𝑉𝑃𝑃 is the rated voltage for service entrance point, it can also be the rated LV voltage of the
SST.
The developed formula is only applicable if SST is properly sized to meet overall
hydroelectric generating station SSDS system load in a single contingency situation. If
the resulted service entrances voltage does not meet the standard requirement, one option
is to install a new SST with on-load tap changer (OLTC). A typical on-load tap changer
(OLTC) has a range of +/- 15% to regulate the transformer secondary system voltage.
41
The disadvantage of having an OLTC is, OLTC is has higher initial cost, and requires
routinely maintenance.
Alternatively, a new SST with smaller impedance is worth to consider. The
benefit of using a smaller impedance SST is to compensate the voltage drop caused by
current-limiting reactor. The disadvantage is also obvious, it increases the transformer
secondary side fault level, and may cause downstream circuit breaker over-duty and
failure.
3.5 Short Circuit Fault Level and Equipment Duty
By increasing the short circuit current that a circuit breaker needs to interrupt, it
may cause circuit over-duty and failure. If the short circuit current is greater than a circuit
breaker’s interruption capability, the circuit breaker is considered over-duty, and needs to
be replaced.
The methodology used for equipment duty is in accordance with IEEE Standard
C37.010-2016 [17] and IEEE Standard 1015-2006 [18]. The general procedure to
calculate the duty cycle is:
- Find the circuit breaker short circuit interruption rating;
- Calculate the short circuit current that the circuit breaker has to interrupt;
- Calculate the system X/R ratio and determine whether de-rating applies
42
For low voltage circuit breaker, in case the system X/R ratio is greater than the test
X/R, the general approach is to increase the fault current to obtain the adjusted ½ cycle
duty current. The adjusted ½ cycle duty short-circuit current can be calculated as follows
[23]:
𝐼𝐼𝐼𝐼𝐿𝐿𝐼𝐼 = 𝐼𝐼𝐼𝐼𝐼𝐼𝐼𝐼𝐼𝐼 ×
⎩⎨
⎧1 + 𝑒𝑒�−2𝜋𝜋∅𝑠𝑠𝑠𝑠𝑠𝑠�𝑋𝑋 𝑅𝑅� �𝑠𝑠𝑠𝑠𝑠𝑠
�
1 + 𝑒𝑒�−2𝜋𝜋∅𝑓𝑓𝑠𝑠𝑠𝑠𝑓𝑓�𝑋𝑋 𝑅𝑅� �𝑓𝑓𝑠𝑠𝑠𝑠𝑓𝑓
�⎭⎬
⎫ (3. 2)
- where,
- Iadj is adjusted ½ cycle duty current (increase fault current)
- Isymm is symmetrical short-circuit current
- �𝑋𝑋 𝑅𝑅� �𝐼𝐼𝐼𝐼𝐼𝐼 is calculated system X/R ratio
- �𝑋𝑋 𝑅𝑅� �𝑡𝑡𝑒𝑒𝐼𝐼𝑡𝑡 is device test X/R ratio per IEEE standards
- and,
∅𝐼𝐼𝐼𝐼𝐼𝐼 = 0.49 − 0.1 × 𝑒𝑒
�−(𝑋𝑋 𝑅𝑅� )𝑠𝑠𝑠𝑠𝑠𝑠
3 �
(3. 3)
-
∅𝑡𝑡𝑒𝑒𝐼𝐼𝑡𝑡 = 0.49 − 0.1 × 𝑒𝑒
�−(𝑋𝑋 𝑅𝑅� )𝑓𝑓𝑠𝑠𝑠𝑠𝑓𝑓
3 �
(3. 4)
43
3.6 Arc Flash Hazard Mitigation
A general methodology to mitigate arc flash hazards for maintaining an existing
hydroelectric generating station is proposed below. Arc flash hazards can be mitigated for
existing station by the following procedures:
- Gather all equipment data, such as equipment nameplate information, and cable
database;
- Complete a detailed arc flash assessment with the found settings and device
information and identify areas that need to be addressed;
- Perform an engineering study and propose new protective settings to be applied,
and enable instantaneous trip function whenever possible;
- Label all equipment with warning signs indicating arc flash hazard risk category
and arc flash boundary to help workers to be properly dressed;
- Replace the protective device that poses a bottle-neck reducing the incident
energy or utilize remote racking devices or remote access tools
It is the best way to mitigate arc flash hazards at the design stage. The following
ways can be considered when designing a new hydroelectric generating station:
- Design and procure Type 2B arc-resistance rated equipment whenever possible;
- Design and procure load-break and/or horsepower rated disconnect switches;
- Design bus differential protection;
44
- Design with redundancy in the system, allowing for equipment maintenance at de-
energized state.
For an existing hydroelectric generating station, in order to lower the incident
energy, the best way is to adjust the protection settings to clear the fault as quickly as
possible while maintaining protection coordination. If adjusting protection setting cannot
effectively reduce the incident energy level, the protective device needs to be replaced or
the device needs to be de-energized to perform any work.
3.7 White Box Model of RB-FMEA
Kahrobaee and Asgarpoor developed and used Risk-Based Failure Mode and
Effect Analysis (RB-FMEA) on wind turbine technologies [13]. It uses the resulted Cost
Priority Number (CPN) value to find the critical part of the overall wind turbine that is
most likely to fail. It is a powerful tool for the manufacturer, which can have a focus to
improve the wind turbine’s reliability. However, the RB-FMEA model cannot be directly
applied to a power system. If a fault occurs in a power system, and is not detected, it will
cause irreversible catastrophic failure and most likely revenue loss. Furthermore, utilities
have great safety and environmental responsibilities. Safety and environmental impacts
of the failure shall also be factored in the failure mode and effect analysis process.
45
This thesis proposes a new quantitative approach by adapting RB-FMEA, called
white-box model of RB-FMEA. By summing the system components’ CPN value, the
white-box model of RB-FMEA obtains the overall failure cost of the system in question.
It also brings Risk Priority Number (RPN) into the overall analysis process. The total cost
then is converted into Net Present Value (NPV) to compare different strategies.
The general procedure of the proposed white-box model of RB-FMEA process is
as follows:
- Propose multiple design or maintenance strategies;
- For each strategy failure cost:
o Determine the location of the failure;
o Determine the causes of failure;
o Determine the risk priority number (RPN);
o Calculate the location cost priority number (LCPN);
- Calculate strategy failure cost by summing LCPN;
- Calculate net present value (NPV) of each strategy cost;
The calculation procedure is as follows:
𝑅𝑅𝑅𝑅𝑅𝑅(𝑖𝑖) = 𝑆𝑆𝑆𝑆(𝑖𝑖) × 𝐸𝐸𝐿𝐿𝑆𝑆(𝑖𝑖) (3.5)
𝐶𝐶𝐶𝐶(𝑖𝑖) = 𝐷𝐷𝐼𝐼(𝑖𝑖) × 𝑊𝑊𝐸𝐸(𝑖𝑖) × 𝑅𝑅ℎ(𝑖𝑖) (3.6)
𝐶𝐶𝐼𝐼(𝑖𝑖) = 𝐶𝐶𝐶𝐶(𝑖𝑖) + 𝐶𝐶𝐶𝐶(𝑖𝑖) + 𝑅𝑅𝐶𝐶(𝑖𝑖) (3.7)
46
𝐿𝐿𝐶𝐶𝑅𝑅𝑅𝑅(𝑖𝑖) = 𝑅𝑅𝐼𝐼(𝑖𝑖) × 𝐶𝐶𝐼𝐼(𝑖𝑖) × 𝑅𝑅𝑅𝑅𝑅𝑅(𝑖𝑖) (3.8)
𝑆𝑆𝑁𝑁𝑃𝑃𝑉𝑉(𝐼𝐼) = �𝐿𝐿𝐶𝐶𝑅𝑅𝑅𝑅(𝑖𝑖) × �1 − (1 + 𝑅𝑅)𝑁𝑁
𝑅𝑅� (3.9)
where,
i represents each location of failure;
j represents each strategy failure;
k represents each switching;
R represents the interest rate, in %;
N represents the total year for NPV calculation;
Sr represents the potential safety rating. It indicates potential safety hazards to workers;
- High (3) means fatalities;
- Medium (2) means permanent partial disability;
- Low (1) means temporary disability and minor injury;
Edr represents the environmental damage rating. It represents estimated cost to clean up,
in $ value;
Cl represents the labour cost;
Df represents the duration of the failure;
Wn represents the numbers of workers needed;
47
Rh represents the workers hourly pay;
Cp represents the parts costs;
Cs represents the service cost and equipment rental cost;
Rl represents the revenue loss;
Pf represents the probability of failure. Shall be based on historical data, if not available,
reference to (IEEE 493-2007, table 10-4);
Cf represents the overall failure cost;
LCPN represents location cost priority number;
𝑆𝑆𝑁𝑁𝑃𝑃𝑉𝑉 represents strategy failure cost;
This chapter proposed a systematic approach to retrofit an existing hydroelectrical
generating station to address the technical and safety issues. Chapter 4 will use a study
case to validate the applicability of the new approach.
48
Chapter 4 – Application and Evaluation of the General
Approach
In this chapter, the developed general approach and methodologies are applied to
an existing hydroelectric generating stations as a case study. The existing SSDS in the
case study will be reviewed and evaluated in this chapter, as well. The proposed approach
and methodologies is used to retrofit the SSDS system and address the following
technical issues:
- Removal of aged and redundant medium voltage switchgear
- High fault current level on generator bus
- Review the existing protection system
- Implementation of modern safety codes and standards
The following evaluations will be completed in this chapter:
- Evaluation of new system configuration, in this case, the impact of CLR;
- Evaluation of voltage regulation;
- Evaluation of short circuit and equipment duty;
- Evaluation of arc flash hazard of the new system configuration;
- Evaluation of failure cost.
49
4.1 Case Study Background
The SSDS system of the studied hydroelectric generating station presently has
two voltages systems: a 4.16 kV and a 600 V system. Figures 1.2, 1.3, and 1.4 show an
overview of the station service distribution system’s single line diagram.
There are three indoor 4/5 MVA, 13.8:4.16 kV station service transformers
(SST11, SST21, and SST31), fed from generators 1, 2, and 3, respectively, supplying the
4.16 kV switchgear inside the powerhouse. Each transformer is equipped with an on-load
tap changer (OLTC) with a range of +/- 15%. The OLTC is used to regulate the 4.16 kV
system, as the generator output voltage may swing up to +/- 5% during normal operating
condition.
In addition to feeding the generating station and spillway, at one time, the 4.16 kV
system also fed the nearby town sites. However, the generators were often switched on
and off as part of the normal operation, causing frequent momentary interruption to the
town site feeders. In order to overcome the interference, a make-before-break scheme
was added to the 4.16 kV switchgear and was not automated. It needs station operator to
manually engage. The complexity of the make-before-break scheme has led to
inefficiencies in operation. The station operator need to review the appropriate sequence
of steps to perform any switching operation in advance. The town sites are now fed from
a separate 25kV distribution system, the make-before-break scheme is no longer required
and thus has been abandoned.
50
There are two 1 MVA, 4.16 kV:600 V station service transformers (SST21
SST22), fed from the 4.16 kV switchgear. Each transformer is capable to supply the
entire station loads individually. The 4.16 kV switchgear is at its end of service life, and
replacement parts are no longer available. The ring bus in the 4.16 kV switchgear is
meant to provide station service distribution system operation flexibility, since each of
the two-stage station service transformer line-up is capable to supply the entire station
load, the entire 4.16 kV system in the powerhouse can, therefore, be functionally
eliminated and removed without any impact on the station operation. However, the 4.16
kV switchgear contains part of the generators and generator step-up transformer (GSU)
and station service transformer (SST) protection system. Once the switchgear has been
removed, this will lead to unacceptable risk exposure to the generating station’s critical
assets.
To simplify the explanations, throughout this thesis, only generator G1 station
service line-up is explained; generator G2 line-up has an identical configuration to that of
G1 line-up. SST3 in the generator 3 line-up of the studied case has failed; therefore, it
will not be discussed.
51
Figure 4. 1 - Station Service Distribution System (SSDS) Single Line Diagram
Figure 4. 2 – System Configuration of Load Group 1
52
Figure 4. 3 – System Configuration of Load Group 2
4.1.1 Case Study Review
The short circuit fault level and equipment duty evaluations are performed by
using EasyPower software. EasyPower is a computer aided engineering tool to analyze
electrical power systems. It models the power system in a single line basis with
equipment data, and it is capable of performing short circuit analysis, power flow
analysis, protective device coordination, and arc flash hazard analysis [23].
53
Figure 4. 4 - Generator Bus Fault Current Level
In this case, the available symmetrical short-circuit current on the generator bus is
about 74 kA, whose large magnitude will expose the equipment to unacceptable thermal
and mechanical stresses when a fault occurs.
In the studied case, there are two sets of 400:5A C400 CTs at the primary side of
13.8:4.16 kV transformer; one CT is connected to the time-delay overcurrent protection,
and the other one is to form a differential zone to protect the transformer.
Based on short-circuit study results, the symmetrical short-circuit fault current on
the generator bus is 74 kA. It is believed that the two sets of 400:5A CTs at primary side
of the 13.8:4.16 kV transformers will be saturated during a fault.
54
The following information is gathered from the study case, with some
assumptions for missing information:
- The CT secondary connects to a mechanical relay with 0.108 Ω burden
- 350 ft of #10 AWG SIS wire is used to link CT and relay. The #10 AWG has
resistance of 1 Ω per 1000 ft.
- The actual CT secondary winding resistance is not available, it is assumed the CT
has 0.0025 Ω per turn;
- The system X/R ratio is 34.91.
Therefore,
- 𝐼𝐼𝑓𝑓𝑓𝑓𝑓𝑓𝑓𝑓𝑓𝑓 is 74000 A;
- 𝐼𝐼𝑃𝑃𝑃𝑃𝑃𝑃𝑃𝑃 is 400 A;
- 𝑍𝑍𝐵𝐵 is (0.108 + 0.35) = 0.458 Ω;
- 𝑅𝑅𝑠𝑠 is 0.0025 × 80 = 0.2 Ω;
- 𝑍𝑍𝐵𝐵,𝑆𝑆𝑆𝑆𝑆𝑆 is 4 Ω
By applying the Formula 2.1 and Formula 2.2, it will get
𝐼𝐼𝑓𝑓𝑓𝑓𝑓𝑓𝑓𝑓𝑓𝑓𝐼𝐼𝑃𝑃𝑃𝑃𝑃𝑃𝑃𝑃
×𝑍𝑍𝐵𝐵 + 𝑅𝑅𝑠𝑠
𝑍𝑍𝐵𝐵,𝑆𝑆𝑆𝑆𝑆𝑆 + 𝑅𝑅𝑠𝑠=
74000400
× 0.658
4.2= 28.98 > 20
𝐼𝐼𝑓𝑓𝑓𝑓𝑓𝑓𝑓𝑓𝑓𝑓𝐼𝐼𝑃𝑃𝑃𝑃𝑃𝑃𝑃𝑃
×𝑍𝑍𝐵𝐵 + 𝑅𝑅𝑠𝑠
𝑍𝑍𝐵𝐵,𝑆𝑆𝑆𝑆𝑆𝑆 + 𝑅𝑅𝑠𝑠× �
𝑋𝑋𝑅𝑅
+ 1� = 74000
400 ×
0.6584.2
× 35.91 = 1040.7 > 20
The 400:5 A C400 CT will be subjected to both AC and DC saturation.
55
Figure 4.5 shows a PSCAD/EMTDC model to simulate the CT behavior upon an
electrical fault. The simulation result is demonstrated in Figure 4.6, which verifies that
400:5A CTs become saturated upon an electrical fault.
The existing protection system is, therefore, believed to be inadequate to protect
the SST.
Figure 4. 5 - CT Saturation PSCAD/EMTDC Model
56
Figure 4. 6 - CT Saturation using PSCAD/EMTDC Results
4.2 New System Configuration
In summary, the new system configuration includes removing the existing two-
staged station service transformer and the existing 4.16 kV switchgear, and installing a
CLR and a new 13.8:0.6 kV SST in conjunction with new CLRs. Figure 4.7 shows the
new system configuration.
The added current-limiting reactors can be placed where the existing 4/5 MVA,
13.8:4.16 kV station service transformers are. The existing 1 MVA, 4.16:0.6 kV station
service transformers will be replaced by 1 MVA, 13.8:0.6 kV transformers.
57
Figure 4. 7 – New System Configuration Electrical Single Line Diagram
In this case, the available symmetrical short-circuit current on the generator bus is
about 74 kA, whose large magnitude will expose the equipment to unacceptable thermal
and mechanical stresses when a fault occurs. Currently, there is no medium voltage
vacuum circuit breaker commercially and economically available to interrupt 74 kA
short-circuit current.
58
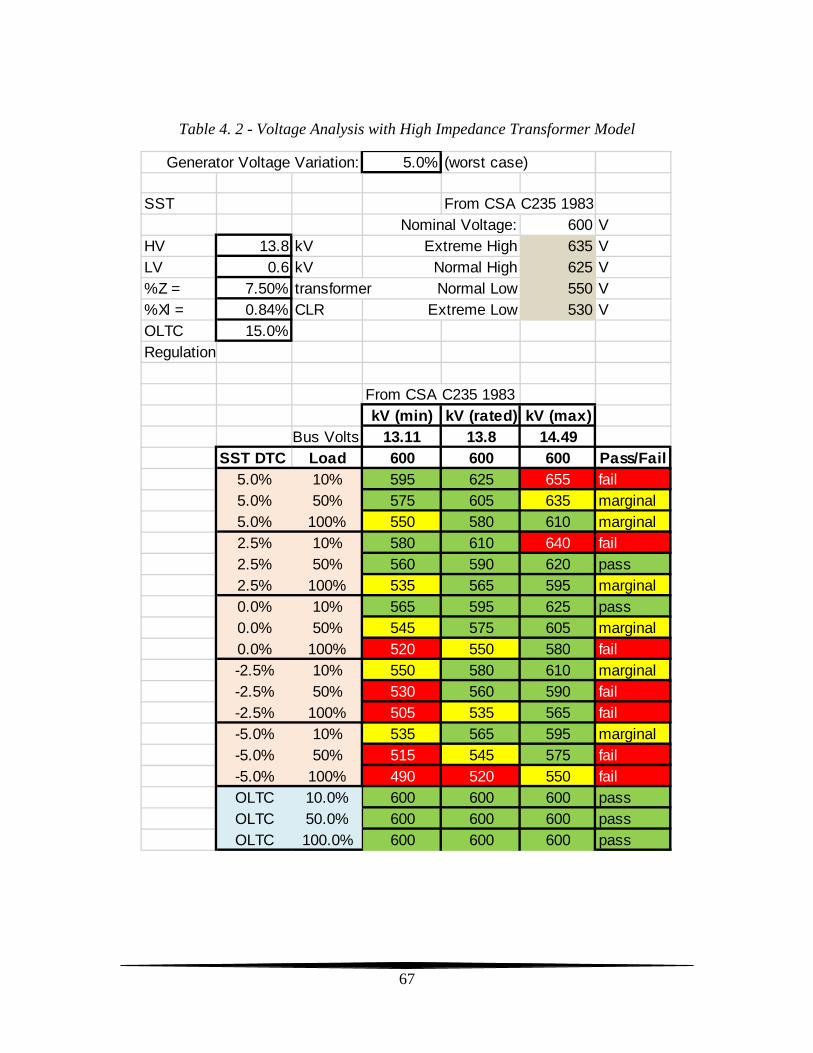
In the studied case, the system voltage is 𝑉𝑉 = 13.8 𝑘𝑘𝑉𝑉, and 𝐼𝐼𝑆𝑆𝑆𝑆𝑆𝑆 = 74 𝑘𝑘𝑘𝑘.
𝐼𝐼𝑆𝑆𝑆𝑆𝐵𝐵 is targeted to 15 𝑘𝑘𝑘𝑘, which is 60% of a typical medium vacuum breaker’s current
interruption capability rating. By applying the formulas 3.1, 3.2 and 3.3, the inductance
of the CLR for this case study is determined as follows.
𝐿𝐿𝑆𝑆𝐶𝐶𝑅𝑅,𝑓𝑓𝑃𝑃𝑓𝑓𝑓𝑓𝑓𝑓 = 1.77 𝐼𝐼𝑚𝑚
4.3 Evaluations of the Impact of Current-Limiting
Reactor
Unless there is a special requirement, a typical 15 kV medium voltage vacuum
circuit breaker has a 25 kA rated interrupting capability. In the new system configuration,
the CLR is sized to limit the short-circuit current to 14.3 kA, which is about 60% of the
rated interrupting capability. Therefore, when evaluating TRV and RRRV simulation
results, T60 envelope is used for the case study.
Although a three-phase ungrounded bolted fault has the highest TRV peak value,
this occurrence is considered rare in reality [20]. Therefore, to evaluate the TRV and
RRRV impacts, three-phase grounded faults are simulated at the following locations:
- At feeder side of the medium voltage circuit breaker (between CLR and the
medium voltage circuit breaker)
59
- At line side of the medium voltage circuit breaker (between the medium voltage
circuit breaker and the 13.8 kV:600 V transformer)
The evaluation is performed using PSCAD/EMTDC simulation platform (refer to
Figure 4.8 for the PSCAD/EMTDC simulation model). The worst-case capacitance
values used in the PSCAD/EMTDC simulations are referenced to in Tables B.3, B.7, and
B.8 from IEEE C37.011 Annex B, and are summarized in Table 4.1. Phase-isolated bus
ducts have been used to interconnect the generator terminals, GSU low voltage side and
new current-limiting reactor; it is assumed the resistance of the phase-isolated bus bars
are zero.
Table 4. 1 - Capacitance Value used in PSCAD/EMTDC Simulation
Equipment Capacitance (pF) Current Transformer 75 Vacuum Circuit Breaker 20 Surge Arrester 80
Figure 4. 8 - Initial PSCAD/EMTDC model
60
Figure 4.9 and Figure 4.10 show the simulation results for fault location #1. As
shown in Figure 4.9, the TRV oscillation is well within the T60 envelope. Although the
RRRV curve cross the T10 (cyan line), it is still well within T60 envelope (red line).
There is no neither TRV or RRRV violation for fault occurs at location #1.
Figure 4. 9 - TRV Plot for Fault Location #1
Figure 4.10 shows the simulation results for fault location #2. As shown in Figure
4.10, the TRV has smaller oscillation within the envelope. There is no neither TRV or
RRRV violation for fault occurs at location #2.
61
Figure 4. 10 - Enlarged TRV Plot for Fault Location #2
A current limiting reactor installed at the load side of a circuit breaker (in series
connection) often faces a high frequency TRV when clearing a fault, which leads to a
TRV violation. In the studied case, nearby equipment such as CTs and arresters provide
sufficient shunt capacitance resulting in the TRV and RRRV meeting the standardized
values. From the above figures, it is concluded that there is no TRV and RRRV violation
for fault at both location #1 and location #2. The sized CLR is deemed adequate.
62
4.3 Protection Re-Modelling
By adding the CLR, the resulting reduced fault current will facilitate the
installation of a medium voltage vacuum circuit breaker, and allows for the
implementation of a differential protection scheme and to clear a transformer fault
without tripping the generator and GSU protection zones. New protection CTs will be
added along with the medium voltage circuit breaker to form two overlapped differential
protection zones.
The first one is the generator differential protection zone. Due to the removal of
the 4.16 kV switchgear, parts of the generators, generator step-up transformer (GSU), and
SST protection system will also be removed. It is necessary and important to re-establish
the generator differential zone. The second one is the station service transformer
differential protection zone. It is a newly created zone to protect the transformer. Figure
4.11 shows the re-modelled protection for the new system configuration.
63
Figure 4. 11– New System Configuration Protection Scheme (Generator G1 line-up)
64
Below is a brief descriptive overview of the re-modeled protection system with
the following scenarios:
- When an overcurrent fault is detected, it trips the MV breaker 52-SS1 and LV
station service breaker 52-SS1;
- When a differential fault is detected or critical high transformer winding
temperature is detected, it trips the breaker 52-SS1 and 600 V station service
breaker 52-SS1.
This protection scheme also includes breaker fail functionality, which will trip the
HV breaker 52-1F and 52-2F and generator breaker 52-G1, in case 52-SS1 fails to
operate.
The advantage of the new system configuration is by adding the current limiting
reactor and circuit breaker to clear a transformer fault without interrupting generation
production. The existing system configuration in the case study does not provide this
benefit.
65
4.4 Voltage Regulation
4.4.1 High Impedance Station Service Transformer Model
Selecting high impedance station service transformer helps to reduce the
maximum available fault current level on the transformer secondary. In general, for like-
for-like replacement, maintaining the same impedance is a sound idea as it maintains the
same fault current level on the transformer’s secondary. This way it will not over-duty
the downstream protective devices. However, in the studied case, since two staged SSTs
are removed, it provides an opportunity to investigate a high impedance station service
transformer model.
From the short-circuit simulation of the existing system, the symmetrical short-
circuit is calculated a 12.692 kA. In order to supply the entire generating station, the new
SST shall be rated at 1 MVA, with 962 A on the secondary. Thus, the impedance of the
new transformer is calculated as follows.
𝑍𝑍% = 962 𝑘𝑘
12692 𝑘𝑘= 7.5%
As shown in Table 4.2, for the high impedance SST model with de-energized tap
changer, it does not have a tap position to fulfill the requirements outlined in CSA C235.
The only way to compensate the voltage drop of SST and CLR is by adding an on-load
66
tap changer. However, it is a costly approach. For the standard impedance SST model, as
long as the de-energized tap changer stays in neutral position, it fulfills service entrance
voltage the requirment specified in CSA C235.
67
Table 4. 2 - Voltage Analysis with High Impedance Transformer Model
Generator Voltage Variation: 5.0% (worst case)
SST From CSA C235 1983Nominal Voltage: 600 V
HV 13.8 kV Extreme High 635 VLV 0.6 kV Normal High 625 V%Z = 7.50% transformer Normal Low 550 V%Xl = 0.84% CLR Extreme Low 530 VOLTC 15.0%Regulation
From CSA C235 1983kV (min) kV (rated) kV (max)
Bus Volts 13.11 13.8 14.49SST DTC Load 600 600 600 Pass/Fail
5.0% 10% 595 625 655 fail5.0% 50% 575 605 635 marginal5.0% 100% 550 580 610 marginal2.5% 10% 580 610 640 fail2.5% 50% 560 590 620 pass2.5% 100% 535 565 595 marginal0.0% 10% 565 595 625 pass0.0% 50% 545 575 605 marginal0.0% 100% 520 550 580 fail-2.5% 10% 550 580 610 marginal-2.5% 50% 530 560 590 fail-2.5% 100% 505 535 565 fail-5.0% 10% 535 565 595 marginal-5.0% 50% 515 545 575 fail-5.0% 100% 490 520 550 failOLTC 10.0% 600 600 600 passOLTC 50.0% 600 600 600 passOLTC 100.0% 600 600 600 pass
68
4.4.2 Standard Impedance Station Service Transformer Model
In the studied case, the first stage SST has an impedance of 7.55%, and the second
stage SST has an impedance of 5.65%. The combined impedance of two staged SST is
over 13%; the first stage SST is equipped with an on-load tap changer of ±15%. The on-
load tap changer not only helps to offset the voltage swing of the generator, but also
provides voltage drop compensation for the SSTs.
With the 7.5% impedance and CLR voltage drops, there is a risk that the service
entrance voltage may not meet the required voltage ranges specified by CSA C235
standard. Alternatively, it is worth considering and analyzing the standard impedance
SST model. Typical impedance for a 1 MVA transformer is 5.75%.
As shown in Table 4.3, as long as the new SST DTC is kept at its neutral position,
it meets the 10% to 100% load requirements without violating the voltage regulation
specified in CSA standard.
69
Table 4. 3 - Voltage Analysis with Standard Impedance Transformer Model
It is concluded that the adding the current-limiting reactor with a standard
impedance transformer has no negative impact on the system voltage regulation
requirements.
Generator Voltage Variation: 5.0% (worst case)
SST From CSA C235 1983Nominal Voltage: 600 V
HV 13.8 kV Extreme High 635 VLV 0.6 kV Normal High 625 V%Z = 5.75% transformer Normal Low 550 V%Xl = 0.84% CLR Extreme Low 530 VOLTC 15.0%Regulation
From CSA C235 1983kV (min) kV (rated) kV (max)
Bus Volts 13.11 13.8 14.49SST DTC Load 600 600 600 Pass/Fail
5.0% 10% 596 626 656 fail5.0% 50% 580 610 640 fail5.0% 100% 560 590 620 pass2.5% 10% 581 611 641 fail2.5% 50% 565 595 625 marginal2.5% 100% 545 575 605 marginal0.0% 10% 566 596 626 marginal0.0% 50% 550 580 610 pass0.0% 100% 530 560 590 marginal-2.5% 10% 551 581 611 pass-2.5% 50% 535 565 595 marginal-2.5% 100% 515 545 575 fail-5.0% 10% 536 566 596 marginal-5.0% 50% 520 550 580 fail-5.0% 100% 500 530 560 failOLTC 10.0% 600 600 600 passOLTC 50.0% 600 600 600 passOLTC 100.0% 600 600 600 pass
70
4.5 Evaluations of Short Circuit Fault Level and
Equipment Duty
The methodology used for equipment duty is in accordance with IEEE Standard
C37.010-2016 [17] and IEEE Standard 1015-2006 [18]. The general procedure to
calculate the duty cycle is:
- Find the circuit breaker short circuit interruption rating;
- Calculate the short circuit current that circuit breaker to interrupt;
- Calculate the system X/R ratios and determine whether de-rating applies
The procedure is demonstrated by the studied case, and summarized in Table 4.4
and Table 4.5.
Table 4. 4 - MV Circuit Breaker Short-Circuit Duty Report
Equipment Ratings Duties
Name Voltage
(kV)
1/2 Cycle (kA)
Int*
(kA)
1/2 Cycle (kA)
1/2 Cycle
%
Int*
(kA)
Int*
%
X/R
Ratio 52-SST11 13.8 65 25 36.032 -44.60% 14.317 -42.70% 12.57 52-SST12 13.8 65 25 36.032 -44.60% 14.317 -42.70% 12.57
* Int standard for breaker interrupting capability
Table 4.4 shows the calculated short-circuit and duty values for all medium
voltage circuit. The calculated X/R ratios for all medium voltage circuit breakers are less
than 17; therefore, no de-rating applies. There is no over-duty MV circuit breaker found.
71
The highlighted fields in Table 4.5 indicates that the calculated system X/R ratio is
greater than the test X/R ratio, which means de-rating shall be applied. Even with the de-
rating, there is no over-duty LV circuit breaker.
Table 4. 5 - LV Circuit Breaker Short-Circuit Duty Report
Equipment Ratings X/R Isc Duties
Name ½ Cycle
Test Calculated System
½ Cycle ½ Cycle ½ Cycle (kA) (kA) (kA) %
52-SS101 42 6.6 21.14 13.336 15.219 -63.77% 52-SS102 42 6.6 6.1 12.692 12.521 -70.19% 52-SS201 42 6.6 16.93 14.899 16.723 -60.18% 52-SS202 42 6.6 6.1 12.692 12.521 -70.19%
52-11 22 6.6 14.48 15.119 16.737 -23.92% 52-12 200 6.6 2.3 7.929 6.298 -96.85% 52-13 200 6.6 5.29 12.646 12.154 -93.92% 52-14 200 6.6 2.3 7.929 6.298 -96.85% 52-15 22 6.6 4.26 11.825 10.878 -50.55% 52-16 22 6.6 5.83 12.621 12.351 -43.86% 52-17 22 6.6 5.83 10.147 9.930 -54.86% 52-21 22 6.6 4.24 11.815 10.858 -50.64% 52-22 22 6.6 14.25 15.106 16.698 -24.10% 52-23 200 6.6 2.3 7.924 6.294 -96.85% 52-24 200 6.6 2.3 7.924 6.294 -96.85% 52-25 22 6.6 14.32 15.11 16.710 -24.05% 52-26 22 6.6 5.83 12.692 12.420 -43.54% 52-28 22 6.6 5.83 12.692 12.420 -43.54%
If a circuit breaker is found to be in over-duty, it has to be replaced with one that
has a higher current interruption capability.
72
4.6 Evaluations of Arc Flash Hazards and Mitigations
Arc flash analysis defines a new approach for protection. Prior to the arc flash
regulations, coordination studies were targeted at system availability, which means upon
a fault, the branch circuit shall be tripped prior to the main feeder circuit. Compliance
with the arc flash regulations, this may not hold true. Arc fault current and arc fault
duration are the two major factors contributing to the hazard level. Traditional protection
coordination may take longer clear a fault, in turn, causing higher incident energy.
Without changing out station service low voltage protective devices on the
existing generating station, improving protection coordination may reduce the arc flash
hazard level [24]. The quicker a protective device clears the fault, the less the resulted
incident energy level.
To quantify the improvement of arc flash hazard level by the proposed approach
outlined in Chapter 3, arc flash assessments on both existing system configuration and
new system configuration are conducted.
73
4.6.1 Existing SSDS Arc Flash Assessment
Due to inadequate protection, the arc flash hazard risks on 4.16 kV system is very
high. They are classified as arc flash risk category 4 (HRC 4) with an arc flash boundary
of 489.5” (12.43 m). This is not feasible in the practical world, unless the worker is fully
dressed up for arc flash risk category 4 and prepared to be exposed to the potential high
risks.
The arc flash hazard assessment results are illustrated in Figure 4.12, 4.13 and
4.14.
74
Figure 4. 12 – Section of Arc Flash Assessment on Existing 4.16 kV System
75
The incident energy level on the 600V SS1 switchboard is even worse than the
4.16 kV system. SS1 switchboard is classified as extremely dangerous, which means no
live work shall proceed.
Figure 4. 13 – Arc Flash Assessment of Existing 600 V SS1 Switchboard
76
Figure 4. 14 – Arc Flash Assessment of Existing 600 V SS1 Switchboard Loads
4.6.2 New system configuration Arc Flash Assessment
The new system configuration with adjusted protective device setting results in a
much safer system. The arc flash assessment indicates all 600 V SS1 switchboard loads
are all classified as arc flash risk category 1 (HRC1).
77
Figure 4. 15 – Arc Flash Assessment of 600 V SS1 Switchboard Load 1 (New Configuration)
78
Figure 4. 16 – Arc Flash Assessment of 600 V SS1 Switchboard Load 2 (New Configuration)
4.6.3 Comparison of Arc Flash Assessment Results
An accurate arc flash hazard assessment shall cover various operating conditions,
and provide the worst-case analysis. The comparison of arc flash assessment results is
summarized in Table 4.6.
79
Table 4. 6 - Comparison of arc flash assessment results
Arc Fault Bus
Name
Existing Configuration New system configuration
Arc Flash Boundary (inches)
Incident Energy
(cal/cm2)
Arc Flash
Hazard Risk
Category
Arc Flash Boundary (inches)
Incident Energy
(cal/cm2)
Arc Flash
Hazard Risk
Category SP-52-11 24.3 1.9 #1 24.3 1.9 #1 SP-52-15 20.3 1.4 #1 20.3 1.4 #1 SP-52-16 24.3 1.9 #1 24.3 1.9 #1 SP-52-17 20.4 1.4 #1 20.4 1.4 #1 SP-52-22 65.3 8 #3 29.4 2.5 #1 SP-52-25 24.4 1.9 #1 24.4 1.9 #1 SP-52-26 19 1.3 #1 19 1.3 #1 SP-52-28 24.3 1.9 #1 24.3 1.9 #1
SS11-1A 203.9 42.8 Ext Danger 29.5 2.5 #1
SS11-1B 203.7 42.8 Ext Danger 29.6 2.5 #1
SS22-2A 203.9 42.8 Ext Danger 29.5 2.5 #1
SS22-2B 203.7 42.8 Ext Danger 29.6 2.5 #1
SWBD_2 35.6 3.3 #1 35.6 3.3 #1 SWBD-3 42.1 4.2 #2 20.3 1.4 #1 SWDB_1 35.6 3.3 #1 35.6 3.3 #1
U1-DIST-PNL
136.9 23.8 #3 15.4 1 #0
U2-DIST-PNL
136.9 23.8 #3 15.4 1 #0
U3-DIST-PNL
136.9 23.8 #3 15.4 1 #0
U4-DIST-PNL
33.7 3 #1 15.4 1 #0
80
It is demonstrated that the new system configuration with adjusted protection
settings on the existing protective device can reduce the arc flash hazard level and protect
the site personnel.
4.7 Discussion of Keeping the Existing Two-Stage
System Configuration
The proposed approach in new system configuration leads to a simpler system
configuration as it eliminates unnecessary equipment from the system. Introducing a CLR
and a medium voltage circuit breaker not only protects the SST but also improves system
operability.
Alternatively, if the utility company decides to bear the risk of damaging critical
assets, and accept the prolonged outage, the existing two staged SSTs configuration can
be kept. Two stage transformers will be connected by 5kV cable after the switchgear
removal. However, whether this first stage transformer is thermally and mechanically
capable to withstand 74 kA fault current remains unknown. Utility companies typically
do not have detailed transformer design data, and it is necessary to consult with
transformer manufacturer for its capability.
81
Another disadvantage is generation production will be interrupted upon any
station service feeder fault, since there is no breaker between the generator bus and the
600 V switchboard.
Figure 4. 17 – TCC curve identifying cable damage
82
4.8 Evaluation of White-Box Model RB-FMEA
To quantify the evaluation, this thesis uses two system models with high-level
cost estimations and assumptions for the studied case: (1) the new system configuration
and (2) the existing case with two staged configuration with medium voltage circuit
breaker installed between the two stages SST as discussed in the previous section.
The NPV calculation assumptions are:
- 5% annual interest rate;
- Generation loss is $27,000 per day;
- 3 groups of 2 workers per group working 24 hours a day (8 hours per group) to
locate failure point, assess equipment and temporary remedy work to bring
generators back in service;
- Worker’s hourly rate is $150;
- Both configurations require new station service transformers;
- 40 years of life expectancy of a station service transformer;
- It takes one day to bring the generator back in service for major incidents for the
new system configuration as there is no risks exposed to the generator and GSU.
One day allows technicians to perform the generator, GSU and station service
feeder equipment and protection system condition checks prior to bringing the
generator back in service.
83
- It takes 5 days to bring the generator back in service for major incidents for the
two-staged configuration. Theoretically, after isolation of fault location, the
generator can be back in service within one day. Practically, it is not possible. The
generator, bus ducts, GSU, station service feeder equipment and protection
system need to be re-checked and verified prior to bringing the generator back in
service.
The possible failure location and possible causes are identified in Table 4.8. Each
failure location can cause generation loss or station service loss. When generation loss
occurs, it means revenue loss for the utility company. For the studied case, the new
system configuration has no risk exposed to the GSU and generator. After pinpointing the
failure location, the generator can be placed back on-line. The white-box model of RB-
FMEA process is demonstrated in the following tables.
For both of the new system configuration and the two-staged system
configuration, adding the MV circuit breaker creates two overlapped differential
protection zones, one is GSU, generator, and CLR differential zone, the other one is the
SST differential zone. If a fault occurs inside the GSU, generator and CLR differential
zone, the protection will trip the generator and open the generator circuit breaker.
Similarly, if a fault occurs inside the SST differential zone, the MV and LV breakers will
be tripped open to isolate the transformer from the system without causing a generation
loss. The failure locations with associated causes of failure and effects of failure are
summarized in Table 4.8.
84
Table 4. 7 – White-box Model Failure Analysis
White-box Model of RB-FMEA
Location of Failure Causes of Failure Effects of Failure
New system configuration
CLR feeder side Bus failure (at any location) Generation (Revenue)
loss
CLR Winding/Components Generation (Revenue) loss, Station Service
loss CLR load
side Cable Failure Generation (Revenue) loss
Breaker Failure Fail to open Generation (Revenue)
loss
SST Primary Cable Failure Trip MV breaker, Station Service loss
SST Winding/Components Trip MV breaker, Station Service loss
SST Sec. Cable Failure Trip MV breaker, Station Service loss
Alternative Two-Staged System Configuration
SST11 Primary Bus failure (at any location) Generation (Revenue)
loss
SST11 Winding/OLTC/Components Generation (Revenue) loss
SST11 Sec. Cable Failure Generation (Revenue) loss
Breaker Failure Fail to open Generation (Revenue)
loss SST12 Primary Bus failure (at any location) Trip MV breaker,
Station Service loss
SST12 Winding/Components Trip MV breaker, Station Service loss
SST12 Sec. Cable Failure Trip MV breaker, Station Service loss
For the new system configuration, the protection is properly designed to detect
any fault within the differential protection zones. Current-limiting reactor scores 2 for
safety rating due to potential mechanical breakdown, and workers can be injured by the
flying debris.
85
For the two-staged system configuration, it relies on over-current protection to
protect the 13.8:4.16 kV transformer. However, the CT will be saturated upon a fault,
causing protection failure. The cable and transformer are not properly protected, and
more importantly, workers are exposed to electrocution risks. Therefore, scores of 3 are
given for fault locations occur at either the primary or secondary of the 13.8:4.16 kV
transformer. Similar to CLR, 13.8:4.16 kV transformer scores 2 for safety rating due to
potential mechanical breakdown, and workers can be injured by the flying debris. Table
4.8 below provides the safety rating scores for given failure locations and brief
explanations.
Table 4. 8 – White-box Model of RB-FMEA Safety Rating Scores
White-box Model of RB-
FMEA
Location of Failure
Safety Rating
[Sr] Comments
New system configuration
CLR feeder side
1
If the phase isolation bus duct or 15kV cable insulation breakdown or damaged,
protection shall detect it, and protects the worker
CLR 2 Worker may get injured from flying debris, if CLR fails.
CLR load side
1 If 15kV cable insulation breakdown or damaged, protection shall detect it, and
protects the worker Breaker Failure 1 No real threat
SST Primary
1 If 15kV cable insulation breakdown or damaged, protection shall detect it, and
protects the worker
SST 1 No real threat due to much lower fault current
SST Secondary
1 If 600 V cable insulation breakdown or damaged, protection shall detect it, and
protects the worker
86
Table 4.8 – White-box Model of RB-FMEA Safety Rating Scores (Continued)
Alternative Two-Staged
System Configuration
SST11 Primary
3 Due to inadequate protection, workers may be subjected to electrocution
SST11
2 Due to inadequate protection, SST may be damaged, and workers are subjected injury
due to flying debris
SST11 Secondary 3 Due to inadequate protection, workers may
be subjected to electrocution
SST12 Primary
1 If 5kV cable insulation breaks down or is damaged, protection shall detect it, and
protect the worker
SST12 1 No real threat due to much lower fault current
SST12 Secondary
1 If 600 V cable insulation breaks down or is
damaged, protection shall detect it, and protect the worker
The existing cables contain Polychlorinated biphenyls, known as PCB. PCB is
toxic, increase incidence of liver and kidney cancer and extremely persistent. It doesn’t
breakdown naturally, and difficult to destroy. Since 1977, Canada has banned the sale
and production of PCB, and since 1985, it has been illegal to release PCB to environment
[25]. Government of Canada has very strict regulations to handle, storage and dispose
PCB contaminated materials. The actual cost for handling and disposal of materials
contain PCB varies case by case, Table 4.9 lists the cost associated with environmental
damage rating for each failure location.
87
Table 4. 9 – White-box Model of RB-FMEA Environmental Damage Rating
White-box Model of RB-
FMEA
Location of Failure
Environment Damage
Rating [Edr] Comments
New system configuration
CLR feeder side $ 200
Damaged material disposal – Cable ($ value assumed, new cable contains
no PCB)
CLR $ 1,000 Air core, no insulation oil – Material disposal / Salvage ($ value assumed)
CLR load side $ 200
Damaged material disposal – Cable ($ value assumed, new cable contains
no PCB) Breaker Failure $ 500 Damaged material disposal – Cable
($ value assumed)
SST Primary $ 200
Damaged material disposal – Cable ($ value assumed, new cable contains
no PCB)
SST $ 1,000 Dry type, no insulation oil – Material disposal / Salvage ($ value assumed)
SST Secondary $ 200
Damaged material disposal – Cable ($ value assumed, new cable contains
no PCB)
Alternative Two-Staged
System Configuration
SST11 Primary $ 20,000
Cable may catch fire, and damage adjacent cables. Existing cable
contains PCB. Assumed $10,000 to cleanup fire damage and $10,000 to proper dispose of PCB contaminated
cable
SST11 $ 5,000 Assumed SST severely damaged, and shattered
SST11 Secondary $ 200
Damaged material disposal – Cable ($ value assumed, new cable contains
no PCB)
SST12 Primary $ 500
Damaged material disposal – Cable ($ value assumed, new cable contains no PCB). Damaged material disposal
– Cable ($ value assumed)
SST12 $ 200 Dry type, no insulation oil – Material disposal / Salvage ($ value assumed)
SST12 Secondary $ 1,000
Existing cable contains PCB. Assumed $10,000 cleanup and proper disposal of PCB contaminated cable. Damaged material disposal – Cable
($ value assumed)
88
Table 4. 10 – White-box Model of RB-FMEA Risk Priority Number
White-box Model of RB-
FMEA
Location of Failure
Safety Rating
[Sr]
Environment Damage
Rating [Edr]
Risk Priority Number [RPN] [PRN] = [Sr] x
[Edr]
New system configuration
CLR feeder side 1 $ 200 $ 200
CLR 2 $ 1,000 $ 2,000 CLR load
side 1 $ 200 $ 200
Breaker Failure 1 $ 500 $ 500
SST Primary 1 $ 200 $ 200
SST 1 $ 1,000 $ 1,000 SST
Secondary 1 $ 200 $ 200
Alternative Two-Staged
System Configuration
SST11 Primary
3 $ 20,000 $ 60,000
SST11 2 $ 5,000 $ 10,000 SST11
Secondary 3 $ 200 $ 600
SST12 Primary 1 $ 500 $ 500
SST12 1 $ 200 $ 200 SST12
Secondary 1 $ 1,000 $ 1,000
89
Table 4. 11 – White-box Model of RB-FMEA Labour Cost
White-box Model of RB-
FMEA
Location of Failure [Cl] [Df]
labour costs: [Cl] = [Df] x [#of men] x [man hour
rate]
Duration of Failure, respect to generation loss (hours). Time includes locating failure point,
assessing equipment and temporary remedy work to
bring generators back on-line
New system configuration
CLR feeder side
$ 7,200 24 hours to replace cables
CLR $ 21,600
72 hours to complete condition assessment and temporary
bypass CLR if needed
CLR load side $ 7,200 24 hours to replace cables
Breaker Failure $ 3,600 12 to replace the breaker
SST Primary $ 7,200
24 hours to replace cables, does not cause generation loss
SST $ 21,600
72 hours to make emergency replacement, doesn’t cause
generation loss
SST Secondary $ 7,200
24 hours to replace cables, does not cause generation loss
Alternative Two-Staged System Configuration
SST11 Primary $ 36,000 24 hours to replace cables
SST11 $ 36,000 120 hours to make emergency
replacement SST11
Secondary $ 36,000 24 hours to replace cables
SST12 Primary $ 7,200
24 hours to replace cables, does not cause generation loss
SST12 $ 21,600
72 hours to make emergency replacement, does not cause
generation loss SST12
Secondary $ 36,000 24 hours to replace cables, does
not cause generation loss
90
Table 4. 12 – White-box Model of RB-FMEA Failure Cost
White-box Model of RB-
FMEA
Location of Failure [Cp] [Cl] [Rl] [Cf]
Parts costs (temporary
remedy equipment,
$ value assumed)
labour costs: Revenue Loss: [Rl]
Overall Failure cost: [Cf] = [Cp] +
[Cl] + [Rl]
New system configuration
CLR feeder side
$ 1,000 $ 7,200 $ 27,000 $ 35,200
CLR $ 1,000 $ 21,600 $ 81,000 $ 103,600 CLR load
side $ 1,000 $ 7,200 $ 27,000 $ 35,200
Breaker Failure $ 40,000 $ 3,600 $ 13,500 $ 57,100
SST Primary $ 1,000 $ 7,200 $ - $ 8,200
SST $ 150,000 $ 21,600 $ - $ 171,600
SST Secondary $ 1,000 $ 7,200 $ - $ 8,200
Alternative Two-Staged System Configuration
SST11 Primary $ 1,000 $ 36,000 $ 135,000 $ 172,000
SST11 $ 150,000 $ 36,000 $ 135,000 $ 321,000 SST11
Secondary $ 1,000 $ 36,000 $ 135,000 $ 172,000
SST12 Primary $ 1,000 $ 7,200 $ 27,000 $ 35,200
SST12 $ 150,000 $ 21,600 $ 81,000 $ 252,600 SST12
Secondary $ 1,000 $ 7,200 $ 27,000 $ 35,200
91
Table 4. 13 – White-box Model of RB-FMEA strategy failure cost
White-box Model of RB-
FMEA
Location of
Failure
Prob. of Failure
[Pf] [Cf] [CPN] [LCPN] [SNPV]
Historical data
(IEEE 493-
2007)
Overall Failure cost: [Cf]= [Cp] + [Cl] + [Rl]
[CPN] = [Pf] x [Cf] x [RPN]
[LCPN] = ∑𝐶𝐶𝑅𝑅𝑅𝑅
New system configuration
CLR feeder side
0.0003 $ 35,200 $ 200
$ 843,942 $ 14,481,274
CLR 0.00042 $ 103,600 $ 2,000 CLR load side
0.00076 $ 35,200 $ 200
Breaker Failure 0.02352 $ 57,100 $ 500
SST Primary 0.00076 $ 8,200 $ 200
SST 0.00042 $ 171,600 $ 1,000 SST Sec. 0.00283 $ 8,200 $ 200
Alternative Two-Staged System Configuration
SST11 Primary 0.0003 $ 172,000 $ 60,000
$6,450,520 110,685,030
SST11 0.00061 $ 321,000 $ 10,000 SST11
Sec. 0.00283 $ 72,000 $ 600
SST12 Primary 0.0003 $ 35,200 $ 500
SST12 0.00042 $ 252,600 $ 200 SST12
Sec. 0.00283 $ 35,200 $ 1,000
The white-box model of RB-FMEA process was applied to the studied case, and
the results demonstrate the applicability of proposed model for hydroelectric generating
station. The white-box model of RB-FMEA defines a new quantitative approach for
power system design and maintenance strategies.
92
4.8.1 Evaluation of Operation Life-Cycle Cost with White-Box
Model of RB-FMEA
It is anticipated the new system configuration is superior to the alternative two-
staged system configuration; the question is by how much.
For the studied case, the new system configuration not only mitigates the potential
risks that exposed to the SST, GSU, and generator, but also saves operating cost. The
switching of the SST in new system configuration is independent of the generator, thus
no revenue loss. For the two-staged system configuration, with every transformer
switching, it is required to switch the generator off-line. Table 4.14 shows that the
operation life-cycle with the white-box model RB-FMEA is about 13% of the alternative
two-staged system configuration.
Table 4. 14 – Operation Life-Cycle Cost with White-Box Model of RB-FMEA
New system configuration
Alternative Two-Staged System Configuration
SST switching 13.8:0.6 kV 13.8:4.16 kV 4.16:0.6 kV Switching Frequency 4 4 4
Labour Cost $ 300 $ 1,200 $ 300 Generation Loss $ - $ 4,500 $ -
Total $ 1,200 $ 22,800 $ 22,800 NPV of switching $ 20,591 $ 391,227 $ 391,227
Total NPV of switching $ 20,591 $ 782,454 SNPV $ 14,481,274 $ 14,501,865
Operation Life-cycle NPV $ 14,501,865 $ 111,467,484
93
Chapter 5 - Contributions, Conclusions, and Future
Work
Development of a general approach and methodologies to resolve electrical issues
for a hydroelectric generating station SSDS system has been completed in this thesis.
This thesis uses a case study to develop a procedure to evaluate and validate the proposed
approach to achieve long-term system availability, low operation maintenance, and safety
of a SSDS system. It concludes that the same approach, methodologies, and evaluation
process can be applied to any generating stations facing similar issues.
The contributions of this thesis are as follows:
- Provision of comprehensive overview of modern industrial design guides and
standards;
- Identification of common electrical hydroelectric generating station SSDS system
technical and safety issues;
o Quantify the fault current level on the generator bus using computer
simulations (in EasyPower);
o Confirmed the inadequacy of protection CT by PSCAD/EMTDC;
- Implementation of current-limiting reactor at medium voltage in SSDS system;
o Evaluation of TRV and RRRV impacts of the proposed CLR
- Development of general equations for voltage regulation analysis;
94
- Development of a white-box model of RB-FMEA to quantify overall system
failure cost;
- Comparison of arc flash hazard assessment results;
- Discussion of arc flash hazard mitigation techniques;
- Validation of general applicability of the proposed approach and methodologies.
As a result of this thesis study, it demonstrated a systematic approach to improve
a station service distribution system in a hydroelectrical generating station. The new
system configuration not only greatly reduces the stress exposed to SST upon a fault on
its secondary, but also improves overall system protection scheme and safety.
Furthermore, it makes the maintenance more cost effective. Based on the studies case,
over the course of 120 years operation, the operating cost of the new system
configuration is less than 4% of the current configuration.
The general approach and methodologies developed in thesis demonstrated a
systematic way to resolve technical issues for long-term system availability, operation
maintenance, and safety of a hydroelectric generating station.
95
5.1 Future work
The transient stability of current-limiting reactor shall be studied to analyze how
the system reacts when faults or switching operations occur in the generating station. It
may allow for ease of the applicability of the proposed approach and methodologies.
Furthermore, from the generator bus fault analysis results, two major contributors
are identified to be the generator and GSU transformer. It is worth investigating and
developing a general model to effectively interrupt fault current contributed from GSU
transformer.
96
References
[1] National Energy Board, "Canada's Adoption of Renewable Power Sources,"
National Energy Board, Calgary, 2017.
[2] Manitoba Hydro, "Powerhouse - Electrical Single Line Diagram," Winnipeg.
[3] V. Tawtel and R. H. Stuart, "Station Service Systems for Large Hydroelectric
Generating Stations," IEEE Transactions on Power Apparatus and Systems, Vols.
PAS-87, no. 2, pp. 579-584, Feb 1968.
[4] WECC, "Relaying Current Transformer Application Guide - White Paper,"
WECC, Salt Lake City, 2014.
[5] Schweitzer Engineering Laboratories, Inc., "SEL-787 Transformer Protection
Relay Data Sheet," 15 August 2017. [Online]. Available:
https://cdn.selinc.com/assets/Literature/Product%20Literature/Data%20Sheets/78
7_DS_20170815.pdf?v=20170823-055122. [Accessed 29 July 2018].
[6] IEEE Std 1584, IEEE Guide for Performing Arc-Flash Hazard Calculations, New
York: The Insitute of Electrical and Electronics Engineers, Inc, 2002.
[7] C. S. Pierre, D. Castor, C. Davis, R. Luo and S. Shrestha, Practical Solution
Guide to Arc Flash Hazards, Tualatin: EasyPower LLC, 2013.
97
[8] T. Hazel, "LIMITING SHORT-CIRCUIT CURRENTS IN MEDIUM-
VOLTAGE," 14 October 2017. [Online]. Available: https://www.schneider-
electric.co.in/documents/support/white-papers/Limiting_short-circuit.pdf.
[9] H. Seyedi and B. Tabei, "Appropraite Placement of Fault Current Limiting
Reactors in Different HV Substation Arrangements," Circuits and Systems, pp.
252-262, July, 2012.
[10] C. Kaehler, "COMPARISON OF AIR-CORE AND IRON-CORE REACTORS
FOR," [Online]. Available: http://www.meher-
mangoldt.com/downloads/Comparison%20of%20ACR%20and%20ICR%20for%
20MV%20Power%20Quality%20Applications.pdf. [Accessed 28 May 2018].
[11] IEEE Std C57.16, IEEE Standard for Requirements, Terminology, and Test Code
for Dry-Type Air-Core Series-Connected Reactors, New York: The Insitute of
Electrical and Electronics Engineers, Inc., 2011.
[12] A. Hargrave, M. J. Thompson and B. Heilman, "Beyond the knee point: A
practical guide to CT saturation," in 2018 71st Annual Conference for Protective
Relay Engineers (CPRE), College station, TX, USA, 2018.
[13] S. Kahrobaee and S. Asgarpoor, "Risk-Based Failure Mode and Effect Analysis
for Wind Turbines (RB-FMEA)," in North American Power Symposium (NAPS),
Boston, MA, USA, 2011.
98
[14] IEEE Standard 666, IEEE Design Guide for Electric Power Service Systems for
Generating Stations, New York: The Insitute of Electrical and Electronics
Engineers, Inc., 1991.
[15] IEEE Standard 399, IEEE Recommended Practice for industrial and Commercial
Power System Analysis, New York: The Insitute of Electrical and Electronics
Engineers, Inc., 1997.
[16] D. Paul, "Unerstanding Time Current Curves: Part 1," 28 Janunary 2014.
[Online]. Available:
http://blog.mavtechglobal.com/blog/2014/01/28/understanding-time-current-
curves-part-1.
[17] IEEE Standard C37.010, IEEE Application Guide for AC High-Voltage Circuit
Breakers > 1000 Vac Rated on a Symmetrical Current Basis, New York: The
Insitute of Electrical and Electronics Engineers, Inc., 2016.
[18] IEEE Standard 1015, Applying Low Voltage Circuit Breakers Used in Industrial
and Commercial Power Systems, New York: The Insitute of Electrical and
Electronics Engineers, Inc., 2006.
[19] H. W. Tinsley and M. Hodder, "A practical approach to arc flash hazard analysis
and reduction," IEEE Transactions on Inductry Application, vol. 41, no. 1, pp.
144 - 154, 2005.
99
[20] IEEE Standard C37.011, IEEE Guide for the Application of Transient Recovery
Voltage for AC High-Voltage Circuit Breakers, New York: The Insitute of
Electrical and Electronics Engineers, Inc., 2011.
[21] L. Kothalawala, "Transient Recovery Voltage Study (Webinar)," Winnipeg, 2016.
[22] CAN3-C235, Preferred Voltage Levels for AC System, 0 to 50 000 V, Toronto:
Canadian Stanards Association, 1983.
[23] EasyPower LLC, EasyPower Training Manual, Tualatin: EasyPower LLC, 2017.
[24] X. Liang, B. Bagen and D. W. Gao, "An Effective Approach to Reducing Arc
Flash Hazards in Power Systems," IEEE Transactions on Industry Applications,
vol. 52, no. 1, pp. 67-75, Jan. - Feb. 2016.
[25] Environment and Climate Change Canada, "Government of Canada,"
Government of Canada, 14 June 2017. [Online]. Available:
http://www.ec.gc.ca/Toxiques-toxics/Default.asp?lang=En&n=444EED1B-
1&pedisable=true. [Accessed 04 August 2018].
[26] IEEE Standard 493, IEEE Recommended Practice for the Design of Reliable
Industrial and Commercial Power Systems, New York: The Insitute of Electrical
and Electronics Engineers, Inc., 2007.
[27] IEEE Standard C57.12.59, IEEE Guide for Dry-type Transformer Through-Fault
100
Current Duration, New York: The Insitute of Electrical and Electronics
Engineers, Inc., 2001.
[28] IEEE Std C37.110, IEEE Guide for the Application of Current Transformers
Used for Protective Relaying Purposes, New York: The Institute of Electrical and
Electronics Engineers, Inc., 2007.
[29] J. F. Maida, "Arc Flash Overview & Qualifications," 18 August 2009. [Online].
Available: http://slideplayer.com/slide/1576490/. [Accessed 08 April 2018].
A
Appendix A – Detailed Equipment Data Used in the
Thesis
Table A. 1 – 230 kV System Data
Thevenin Equivalent Impedance (pu) Fault Level System
Description Base kV R0 + jX0 R1 + jx1
31 (kA)
SLG (kA)
Transmission System
230 kV 0.01279+j0.08053 0.00667+j0.05938 4.2 3.8
Table A. 2 - Generators Nameplate Data
Generator Base (kV)
Rating (MVA)
Irated (kA) RPM X/R X"dv
(%) X'dv (%)
G1 13.8 132.25 5.53 112 102.832 15.1 20.1 G2 13.8 132.25 5.53 112 102.832 15.1 20.1 G3 13.8 132.25 5.53 112 102.832 15.1 20.1 G4 13.8 115 4.81 112 95.9025 15.1 20.1
Table A. 3 - Transformer Nameplate Data
Transformer HV (kV)
LV (kV) Type Class Temp MVA Z X/R
GSU1 230 13.8 Oil ONAN/ ONAF/ ONAF
65 90/
120/ 150
7.23 25.93
GSU2 230 13.8 Oil ONAN/ ONAF/ ONAF
65 90/
120/ 150
7.23 25.93
GSU3 230 13.8 Oil ONAN/ ONAF/ ONAF
65 90/
120/ 150
7.23 25.93
GSU4 230 13.8 Oil ONAN/ ONAF/ ONAF
65 90/
120/ 150
7.23 25.93
SST11 13.8 4.16 Dry ANAF 65 4/5 7.55 8.26 SST12 4.16 0.6 Dry AA 65 1 5.58 5.84
B
Table A.3 - Transformer Nameplate Data (Continued)
SST21 13.8 4.16 Dry ANAF 65 4/5 7.55 8.26 SST22 4.16 0.6 Dry AA 65 1 5.58 5.84 SST31 13.8 4.16 Dry ANAF 65 4/5 7.34 8.26
Table A. 4 - Medium Voltage Circuit Breaker Nameplate Data
MV Breakers
Base (kV) Mfr Style Irated
(kA) Cycles Max (kV) Int (kA)
52-GR10 4.16 ITE 5-HK-150 1200 5 4.76 20.825
52-GR20 4.16 ITE 5-HK-150 1200 5 4.76 20.825
52-GR30 4.16 ITE 5-HK-150 1200 5 4.76 20.825
52-GR40 4.16 ITE 5-HK-150 1200 5 4.76 20.825
52-SS11 4.16 ITE 5-HK-150 1200 5 4.76 20.825 52-SS12 4.16 ITE 5-HK-150 1200 5 4.76 20.825 52-SS21 4.16 ITE 5-HK-150 1200 5 4.76 20.825 52-SS22 4.16 ITE 5-HK-150 1200 5 4.76 20.825
52-SS31A 4.16 ITE 5-HK-150 1200 5 4.76 20.825
52-SS31B 4.16 ITE 5-HK-150 1200 5 4.76 20.825
52-SSBT1 4.16 ITE 5-HK-150 1200 5 4.76 20.825
Table A. 5 - Low Voltage Circuit Breaker Nameplate Data
LV Breaker
Base (kV)
Breaker Mfr
Breaker Style
Irated (A)
SC Int
(kA)
Trip Mfr Trip Type
52-11 0.6 West DS-206 800 22 West Amptector I-A
52-12 0.6 West DSL-206 800 200 West Amptector I-A
52-13 0.6 West DSL-206 800 200 West Amptector I-A
52-14 0.6 West DSL-206 800 200 West Amptector I-A
52-15 0.6 West DS-206 800 22 West Amptector I-A
C
Table A.5 - Low Voltage Circuit Breaker Nameplate Data (Continued)
52-16 0.6 West DS-206 800 22 West Amptector I-A
52-17 0.6 West DS-206 800 22 West Amptector I-A
52-18 0.6 West DS-206 800 22 West Amptector I-A
52-19 0.6 West DS-206 800 22 West Amptector I-A
52-21 0.6 West DS-206 800 22 West Amptector I-A
52-22 0.6 West DS-206 800 22 West Amptector I-A
52-23 0.6 West DSL-206 800 200 West Amptector I-A
52-24 0.6 West DSL-206 800 200 West Amptector I-A
52-25 0.6 West DS-206 800 22 West Amptector I-A
52-26 0.6 West DS-206 800 22 West Amptector I-A
52-27 0.6 West DS-206 800 22 West Amptector I-A
52-28 0.6 West DS-206 800 22 West Amptector I-A
52-29 0.6 West DS-206 800 22 West Amptector I-A
52-HG101 0.6 West DS-416 1600 42 West Amptector
I-A 52-
HG102 0.6 West DS-416 1600 42 West Amptector I-A
52-HU 0.6 ITE KD 3000 75 ITE (Std) 52-
SS101 0.6 West DS-416 1600 42 West Amptector I-A
52-SS102 0.6 West DS-416 1600 42 West Amptector
I-A 52-
SS1BT 0.6 West DS-416 1600 42 West Amptector I-A
52-SS201 0.6 West DS-416 1600 42 West Amptector
I-A 52-
SS202 0.6 West DS-416 1600 42 West Amptector I-A
52-SS2BT 0.6 West DS-416 1600 42 West Amptector
I-A