Page 1
Rochester Institute of TechnologyRIT Scholar Works
Theses Thesis/Dissertation Collections
5-3-1965
An experimental apparatus for measuring therelative illumination of finite conjugate lensesClaude Fedele
Leo Neumann
Follow this and additional works at: http://scholarworks.rit.edu/theses
This Thesis is brought to you for free and open access by the Thesis/Dissertation Collections at RIT Scholar Works. It has been accepted for inclusionin Theses by an authorized administrator of RIT Scholar Works. For more information, please contact [email protected] .
Recommended CitationFedele, Claude and Neumann, Leo, "An experimental apparatus for measuring the relative illumination of finite conjugate lenses"(1965). Thesis. Rochester Institute of Technology. Accessed from
Page 2
SENIOR RESEARCH PROJECT
AN EXPERIMENTAL APPARATUS FOR MEASURING THE RELATIVE
ILLUMINATION OF FINITE CONJUGATE LENSES
by
Claude Fedele
Leo Neumann
ROCHESTER INSTITUTE OF TECHNOLOGY
ROCHESTER, NEW YORK
Submitted:
03 May, 1965
Page 3
TABLE OF CONTENTS
ABSTRACT i
INTRODUCTION 1
OBJECTIVES 3
DESCRIPTION OF APPARATUS 3
CALIBRATION OF EQUIPMENT 12
EVALUATION PROCEDURE : . . . 13
RESULTS 15
CONCLUSIONS 18
DISCUSSION OF RESULTS 18
ACKNOWLEDGEMENT 20
APPENDIX I
Page 4
ABSTRACT
The apparatus described is designed to measure relative
illumination of finite conjugate lenses with comparableaccu-
-
||T[|
illT**""T"""1
racy and reliability than existing methods and provides a
graphical output with less time expended for data aquisition.
A
An opto-mechanical scanning system is utilizes for trans-
mitting light pulses from known image field positions to a
photomultiplier tube. The light pulses are transmitted to the
phototube via an optical system consisting of an array of
lucite rods (light pipes) positioned in the image plane of the
lens under test. The rods terminate at a cylindrical housing
which contains a rotating lens prism assembly which scans the
end of each lucite rod in sequence and relays the illumination
values to the photomultiplier. The output current of the tube
is displayed on a cathode ray tube oscilloscope and photographed,
Data obtained with this apparatus -was compared to data
obtained using photographic photometry. Results indicate that
the apparatus is very repeatable and that data aquisition time
is significantly reduced.
Page 5
INTRODUCTION;
A number of photographic systems produce excellent qualitative
results. By suitable calibration of the various components of
the system, the information gathering capability of the system
can be greatly increased. One of the calibrations frequently
encountered in the field of photographic instrumentation involves
the measurement of relative illumination or the amount of illumin
ation "falloff"
in the image plane of a photographic objective.
This decrease in illuminance - at the off axis positions may be
due to such causes as barrel vignetting, absorption and cosine
variations. Relative illumination is defined as the ratio of the
illuminance at the focal plane, for off-axis field positions, to
the illuminance for the center of the field. This assumes that
the luminance of the object field, as observed from the lens, is
the same throughout the field, or that the field is a Lambert's
law surface. Relative illumination is specified as the per cent
of axial illuminance for image points at given angular distances.
Two methods of measurement exist.
Extended Source Method
This method is based on filling the lens with light from an
extended uniform source of adequate size, placed in -.the object
plane of the lens. The extended source should be uniformly bright
over the useful area to within 3$. A photodetector is displaced
laterally to the position corresponding to the required angular
positions and the corresponding percentage of axial illumination
is determined from a calibration curve of the photocell. Curves
Page 6
are plotted of p|r/e,cent illuminance vs field angle or distance
from the axis.
Densitometric Method :
In this method, the photoelectric detector is replaced
by a photographic emulsion. Exposures are made and the films
processed with control, strips which were exposed in a sensi
tometer. The negatives are densitometered at the positions
corresponding to the required angular positions. The illuminance
is determined from a calibration curve derived from the sensi
tometric data. A curve of per cent illuminance versus distance
from axis is plotted.
Both of these methods are time consuming and the accuracy
of results doubtful when equipment is adapted to obtain data.
Recording of data and plotting of curves becomes tedious when
a great number of lenses are evaluated. The proposed apparatus
is designed to minimize these problems.
Page 7
OBJECTIVES;
To design, construct and evaluate a system for measuring
the relative illumination of finite conjugate lenses. This
apparatus will measure relative illumination with equal or
better accuracy than existing methods with a considerable
reduction in data aquisition time.
DESCRIPTION OF APPARATUS;
cy^Pr.,ri>&A
The apparatus is ampri-.&e4 of five main components;
1. Light Source
2. Optical Bench
3. Scanning System
4. Multiplier Photometer
5. Readout Equipment
Light Source;
The requirement for a maximum of J% variation in
luminance across the object format was achieved by using three
high intensity projection lamps in a plane parallel to a
diffusing screen comprised of flashed opal and groundglass.
The source is enclosed to prevent stray light from reaching
the scanning system, and air cooled by two fans. This arrang
ement resulted in a source uniformly bright to within 2% over
a six inch diagonal. (See Figure 1)
Fig. 1 Light Source
Page 8
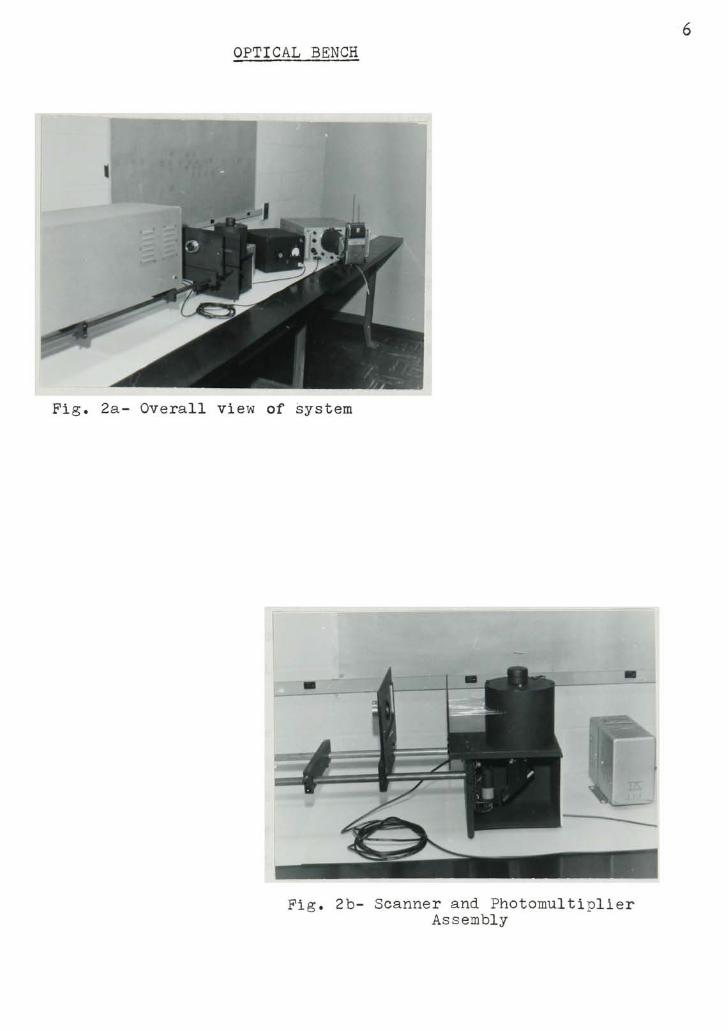
Optical Bench;
The optical bench consists of a lens holder and light
source holder which slide along two parallel six foot long
steel ways. The scanning system and image plane are mounted
permanently on one end of the bench, so that changes in
magnification are facilitated by moving the light source and
lens relative to the scanning system. (Refer to Fig. 2)
Scanning System;
The scanning system consists of an array oY nineteen
diameter lucite rods mounted apart in the image
plane of the lens under test. The image diagonal is6.25"
long.
The light pipes serve to transmit the light from the image
plane to the inner wall of a cylindrical aluminum housing.
The aluminum housing contains a rotating lens-prism assembly
which transmits the light from the end of each light pipe in
sequence, to a photomultiplier tube. The scanner is driven by
a synchronous, 6 RPM motor, resulting in a scan rate across ..
the image plane of 4 seconds, with one complete scan every 10
seconds. It is mounted in a ball bearing race for rigidity and
smooth operation. (Refer to Fig. 3)
Lens #1 ( 6mm,, f;1.2 ) forms an image of the light pipe
exit face at the entrance pupil of lens#2. Lens #2 ( 50mm, f:2 )
produces an enlarged image of the exit pupil of lens#l at the
photocathode of the photomultiplier tube, ensuring that the
entire surface of the photocathode is uniformly illuminated.
A folded optical path is used to keep the apparatus as compact
as possible*
(in principle)* A similar scanning systemAwas used by J. Hughes, RIT '64- inhis Research Project, "A Kinetic Densitometer".
Page 9
Xo
z
<O
K-
Q.
o
go
v.H
ED
^S^^
izr
Page 10
OPTICAL BENCH
Fig. 2a- Overall view of system
Fig. 2b- Scanner and Photomultiplier
Assembly
Page 11
A groundglass is located in the image plane, just below the
light pipe array to facilitate focussing and measurement of
magnification. A reticle of known dimensions mounted at the
light source is used in this operation. (Refer to Fig. 3 )
Photomultiplier Photometer;
A photomultiplier photometer was constructed for maximum
sensitivity and for the ability to substitute phototubes of
different spectral sensitivities. The direct current supply
voltages for the photomultiplier are provided fty a full wave
rectified power supply. (For circuit, refer to Fig. 4)
Voltages for each dynode and for the anode are provided by
equally spaced taps on a voltage divider network across the
rectified power supply. The photomultiplier tube (RCA 931 -A)
features a combination of high photosensitivity, high secondary
emission and small D.C. dark current. The spectral response
covers the range from approximately 3000 to 6200 angstroms,
with a peak at 4000 angstroms. The output current of the 931A
is a linear function of the exciting illumination under
normal operating conditions. (Refer to Fig. 4a)
Readout Equipment;
The output of the photomultiplier was displayed on a
cathode ray tube oscilloscope. A chart recorder may also be
used, if a | RPM motor is substituted for the 6 RPM motor.
The output is displayed as voltage vs horizontal sweep time,
which can be interpreted as per cent illuminance vs. distance
in the image plane of the lens. (Refer to Fig. 4b)
Page 12
8
Image PlaneDrive
Motor
Front Surface
Mirror
Fig. 3 SCANNING SYSTEM
Page 13
SCANNING APPARATUS
Figure 3&
Page 14
10
CO
-p
tH
o
>
<H O
CO ri
w
SSio
co
O -P
O -P
o a
o
O CM
CM ri
u(D
Bfn
O
CO
CCtiVO
Jh IEh
P
C
s
&,
o
oEn
Voltage Divider- 10-20000/v, 1 watt 1-esistors
'X
CO
o
>
o
Vh O
CJ ,-H
CO
p
r-i
O
>
o
o
o
CO
-p
iH
o
VA
LfiJu
0)
faD
as
p
O
>
I
CO
CL)
a
o
co
m as o
H hBm E-t a
o
S3
(1)
O
o
.-H
o
S3
oEh
uuuuiimlmiujuu
nnnnn
nnnnn- .?*
o
o
rH
Q)/
-P
c
CC
LJ
_J
a.
o
o
X
Q.i
O
UJ
X
o
CO
<
o
ccI-
o
UJ
-J
UJ
cc
Ul
ut
O
OX
Q.
,3? 5
/
>VA
<M O
O -P
I ri
a sO W
Page 15
PHOTOMETER AND READOUT EQUIPMENT11
Fig. 4a- Photomultiplier Tube Housing
Fig. 4b- Power Supply and Oscilloscope
Page 16
12
Calibration of Equipment; , n
6tu.,&
Considerable variation was encountered in the -^l4mAgme
exirt-i4g "from the light pipes due to such causes as unequal (rod)
length, losses due to surface imperfections, variation in polish
at the light pipe ends, and losses at the radii where the pipes
enter the cylindrical housing. This variation was minimized by
utilizing sections of continuous neutral density wedges mounted
over the image plane end of the light rod array. With the light
source mounted close to the image plane, the continuous wedges
were moved across each of the light pipes, one at a time, while
observing the output signal on the oscilloscope. Density values
ranged from .10 to .56. Using this method, the illumination
exiting from each of the pipes was matched to k%.
The linearity of the phototube output was checked by
adjusting the output of the tube so that a value of 100^ was
observed on the oscilloscope graticule and then introducing
known neutral density values into the optical path. The resulting
transmission values were compared to calculated values and
indicated that there was no measureable departure from linear
ity.
,o-^xX^
The combined s^aoiiity-of the photomultiplier, power
supply, oscilloscope, and light source showed a drift (in per
cent:, illuminance value) of not more than li% over a period of
ten minutes when all components were operated from a constant
voltage transformer.
Page 17
13
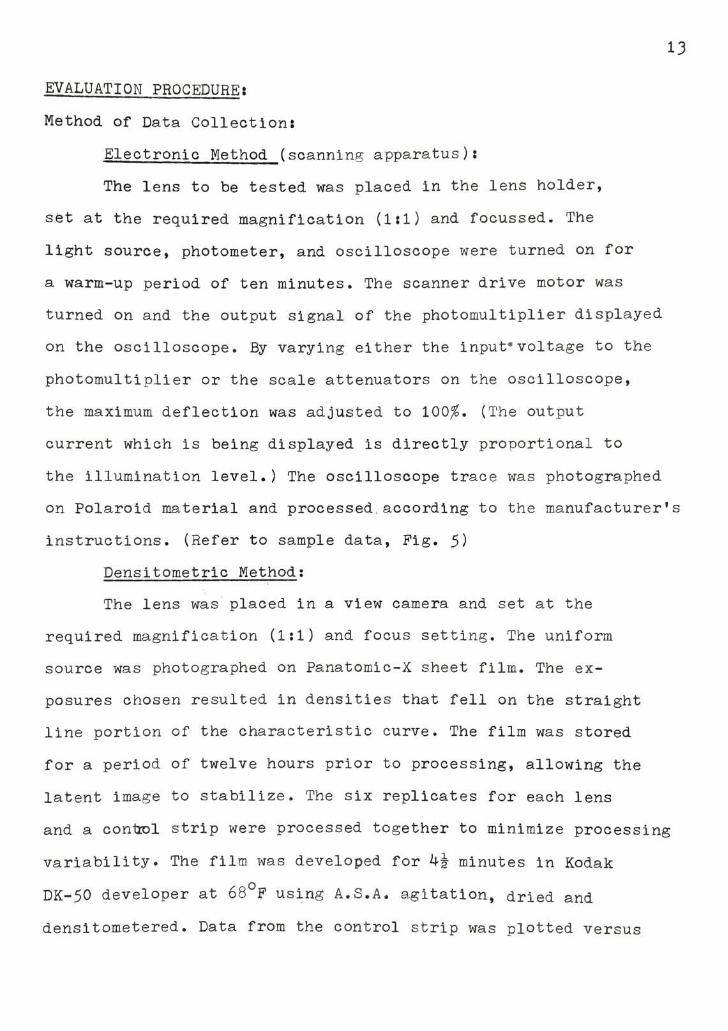
EVALUATION PROCEDURE;
Method of Data Collection;
Electronic Method (scanning apparatus);
The lens to be tested was placed in the lens holder,
set at the required magnification (1;1) and focussed. The
light source, photometer, and oscilloscope were turned on for
a warm-up period of ten minutes. The scanner drive motor was
turned on and the output signal of the photomultiplier displayed
on the oscilloscope. By varying either theinput*
voltage to the
photomultiplier or the scale attenuators on the oscilloscope,
the maximum deflection was adjusted to 100^. (The output
current which is being displayed is directly proportional to
the illumination level.) The oscilloscope trace was photographed
on Polaroid material and processed, according to the manufacturer's
instructions. (Refer to sample data, Fig. 5)
Densitometric Method;
The lens was placed in a view camera and set at the
required magnification (1;1) and focus setting. The uniform
source was photographed on Panatomic-X sheet film. The ex
posures chosen resulted in densities that fell on the straight
line portion of the characteristic curve. The film was stored
for a period of twelve hours prior to processing, allowing the
latent image to stabilize. The six replicates for each lens
and a control strip were processed together to minimize processing
variability. The film was developed for k^ minutes in Kodak
DK-50 developer at 68 F using A.S.A. agitation, dried and
densitometered. Data from the control strip was plotted versus
Page 18
14
SAMPLE DATA
for
ELECTRONIC METHOD
Fig. 5a- Oscilloscope Trace-
No lens in system
Fig. 5b- Relative Illumination
for6"
f;4.5 lens
Fig. 5c- Relative Illumination
for3"
f;1.9
Page 19
15
illuminance at the sensitometer step wedge. (Refer to appendix I)
Densities at the required image field positions were converted
to illuminance values and tabulated.
Replicated data from both methods was averaged and plotted.
(Refer to Fig. 6a, 6b) The resulting curves were compared
statistically, using the densitometric method as a standard.
Variance was calculated to determine the repeatability of the
two methods. (Refer to Appendix II,III)^
RESULTS ;
1) The relative illumination as determined by the densitomet
ric method and by the electronic method is as follows;
3"
f;1.9 Lens
/Distance
L in iiDensitometric
Electronic
100
100
_2_
92
92
80
79
ll
59
39
34
2i11
>e from axis
inches
Relative
Illumination
6"f;4.5 Lens
0i
2 1 ii 2 2* 3Densitometric 100 99 98 96 93 89 8o
Electronic 100 99 98 97 94 91 86
ibi stance from axis
v~ in inches
KRelative
Illumination
2) The variance of each of the two methods is as follows;
3"f;1.9 Lens
Densitometric; s = 169
Electronic s = 0.60
6"f;4.5 Lens
\
Densitometric; s^= 58.4
Electronic ; s2= O.35
3) The data aquisition and evaluation time for both methods
are as follows;
Densitometric
Electronic
min.
55'
5'
max.
120
20'
Page 20
Figure 6a
Relative Illumination of6"
f;4.5 lens
16
OFF AXIS DI8TANCE IN INCHE8
Page 21
Figure 6b
Relative Illumination for3"
f;1.9 lens
17
JI r~~*' 5"
OFF AXIS DISTANCE IN INCHESA' Mil l-t-r-t-rrl
Page 22
18
CONCLUSIONS;
1.) Data aquired using the scanning apparatus is
comparable to data obtained by the densitometric method.
2.) The apparatus exhibits a higher degree of repeat
ability than the densitometric method.
3.) Data aquisition time is reduced by a factor of
six to ten times.
DISCUSSION OF RESULTS;
Inspection of the relative illumination curves reveals
that in one case,(6"
f;4.5 lens) the apparatus produces data
that are somewhat higher than the densitometric method indicates,
while in the case of the3"
f; 1.9 -lens, the reverse is true.
Statistical tests, however, failed to detect any significant
difference between the two methods. A possible explanation
for this is that most of the electronic data falls well within
the two sigma limits marked on the densitometrically derived
curves. (Refer to Fig. 6a, 6b)
The variability of the densitometric data is very high
when compared to the electronic data. This can, in part, be
explained by the nature of photographic photometry. When meas
uring relative illumination, only a small portion of the D-log E
curve is utilized, and relatively small density differences
must be detected. There are a great number of steps in the
photometric process, each step introducing a certain amount of
variability. Since a small density difference results in a
rather large change in transmission, one would expect that
errors are magnified.
Page 23
19
The scanning apparatus is simple to operate and serves
to minimize the number of steps involved in the aquisition of
data. The chances for error (especially human error) are min
imized and considerable savings in time are realized.
1. Department of Defense, USA, "Military Standard Photographic
Lenses,MIL-STD-150A"
(1950)
2. Radio Corporation of America, "DataSheet- 931-A Multiplier
Phototube','
(1958)
3. Jerome Li, "Introduction to StatisticalInference','
The Science
Press Inc., Pennsylvania, (1957)
4. "Symbols, Definitions and Tables", Industrial Statistics
Committee, EKCO. (1958)
Page 24
20
ACKNOWLEDGEMENTS
The authors are indebted to professors B. Carroll,
A. Rickmers, W. Shoemaker, and H. Todd for their cooperation
and guidance in the execution of this project.
Furthermore, we wish to thank Elgeet Optical Co. for
the loan of the oscilloscope and light source. The help, advice
and encouragement received from Robert Volk and Ken Hood of
the R.I.T. Mechanical Department, Richard Neumann, Lenore
Fedele, Alfonso Nazzaro, Robert Nobilini and James Savage was
gratefully appreciated.
Page 26
APPENDIX
T asoaM honiNOO ^o^jjswe
Page 27
APPENDIX II
STATISTICAL ANALYSIS
;X Test for Goodness of Fit -3"ftl. 9 lens
Hls xe^xpV Xe=*p
Xe *P
1 100 100
2 93 91
3 80 79
4 62 63
5 32 39
6 8 12
Xe= Averages of Electronic
Data
X = Averages ofDensitomet-
^ric Data
Using the general formula
(Xe Xp)
we obtain;
^V ioo 91 80 63 39 12
X = 2.39
^C = 11.07 (book value)
y~S,os
On the basis of the above evidence, we state with 95% confidence
that there is no difference between the two methods.
A similar test on the6"
f;4.5 data yielded the following
results;
X- = 0.645
4.
"YL = 11.07 (book value)
Calculation of Standard Deviation
General formula
\ n-l
-\2
?(*-*).
Calculated Values for3" f :19
Densitometric Method;
Electronic Method ;
s = 13
s = 0.775
Calculated Values for6"
f;4.5
Densitometric Method;
Electronic Method :
s = 7.6
s = 0.59
Page 28
APPENDIX III
F Test;
General Formula; F =
The following values were calculated:
3"ftl. 9 lens
2
p = (13) = 281Cal (.775)2
6"f;4.5 lens
F =
(7>*>)2
= 168alC
U590)2
Pbook=^
5,5, .05
2
la.
4
On the basis of the above evidence, we can state with 95$ confi
dence, that there is a significant difference between the variances
of the two methods. The variance of the photographic method is
significantly higher than the variance of the apparatus.