AN EXPERIMENTAL STUDY OFAIR-WATER POOL ENTRAINMENT IN HIGH GAS FLUX REGION Peng Zhang 1 , Peipei Chen 2 , Wei Li 1 , Zhi Di 1 , Lei Zhang 1 , Xiao Hu 1 , Yaheng Zou 1 1. State Nuclear Power Technology R&D Center Future S&T City, Changping, Beijing, China 2. State Nuclear Power Technology Corporation North Road of 3 rd Circle, Beijing, China [email protected]; [email protected]; [email protected]; [email protected];[email protected]; [email protected]; [email protected]ABSTRACT Pool entrainment is an important phenomenon in LOCA transient in both conventional and passive PWR plants. Kataoka & Ishii pool entrainment model is widely used in small break LOCA and reactor transient analysis, but has limited validation against experimental data in high gas flux region. This paper is to report an experimental study of air-water pool entrainment with prototypic gas flux conditions of AP1000.The test section is 2200 mm long and 380 mm in diameter, and built by transparent material for visualization. The range of air flow superficial velocity is 0.98-5.41 m/s. The two phase mixture level is measured by Guided Wave Radar (GWR), and the water entrainment is recorded by weight measure after it is separated from entrainment separator. A correlation of pool entrainment in high gas flux region is proposed based on experimental data obtained in this study. The phenomenon of entrainment saturation is found in high gas flux region. The visualization indicates that pool entrainment in high gas flow region is in transition to jet/fountain flow, which might has strong exit effect. KEYWORDS pool entrainment, two phase mixture level, small break LOCA 1. INTRODUCTION Entrainment from a liquid pool by gas flow in boiling or pool entrainment is recognized as an important phenomenon in nuclear engineering system. In conventional Pressurized Water Reactors (PWR), pool entrainment plays an important role in boric acid concentration balance in long term core cooling analysis. For advanced passive PWR, such as AP1000, pool entrainment is one of key phenomena in small break LOCA analysis. Existing safety analysis codes are reported to have limited capability in modeling pool entrainment in upper plenum after Automatic Depressurization System (ADS) is actuated [1, 2]. Other modern PWR design, such as APR1400, has adopted Safety Depressurization System (SDS) to rapidly depressurize reactor primary system in case of events beyond the design basis accidents. Pool entrainment through SDS valve at the top of pressurizer has significant impact on liquid discharge and two phase swelling during depressurization transient [3]. The most referenced pool entrainment model is developed by Kataoka [4], and is widely used in safety analysis codes [1-3]. Kataoka proposed three regions in pool entrainment mechanism and modeled them 1900 NURETH-16, Chicago, IL, August 30-September 4, 2015
Transcript
AN EXPERIMENTAL STUDY OF AIR-WATER POOL ENTRAINMENT INHIGH GAS FLUX REGION
Pool entrainment is an important phenomenon in LOCA transient in both conventional and passive PWR plants. Kataoka & Ishii pool entrainment model is widely used in small break LOCA and reactor transient analysis, but has limited validation against experimental data in high gas flux region. This paper is to report an experimental study of air-water pool entrainment with prototypic gas flux conditions of AP1000.The test section is 2200 mm long and 380 mm in diameter, and built by transparent material for visualization. The range of air flow superficial velocity is 0.98-5.41 m/s. The two phase mixture level is measured by Guided Wave Radar (GWR), and the water entrainment is recorded by weight measure after it is separated from entrainment separator. A correlation of pool entrainment in high gas flux region is proposed based on experimental data obtained in this study. The phenomenon of entrainment saturation is found in high gas flux region. The visualization indicates that pool entrainment in high gas flow region is in transition to jet/fountain flow, which might has strong exit effect.
KEYWORDSpool entrainment, two phase mixture level, small break LOCA
1. INTRODUCTION
Entrainment from a liquid pool by gas flow in boiling or pool entrainment is recognized as an important phenomenon in nuclear engineering system. In conventional Pressurized Water Reactors (PWR), pool entrainment plays an important role in boric acid concentration balance in long term core cooling analysis.For advanced passive PWR, such as AP1000, pool entrainment is one of key phenomena in small break LOCA analysis. Existing safety analysis codes are reported to have limited capability in modeling pool entrainment in upper plenum after Automatic Depressurization System (ADS) is actuated [1, 2]. Other modern PWR design, such as APR1400, has adopted Safety Depressurization System (SDS) to rapidly depressurize reactor primary system in case of events beyond the design basis accidents. Pool entrainment through SDS valve at the top of pressurizer has significant impact on liquid discharge and two phase swelling during depressurization transient [3].
The most referenced pool entrainment model is developed by Kataoka [4], and is widely used in safety analysis codes [1-3]. Kataoka proposed three regions in pool entrainment mechanism and modeled them
1900NURETH-16, Chicago, IL, August 30-September 4, 2015 1900NURETH-16, Chicago, IL, August 30-September 4, 2015
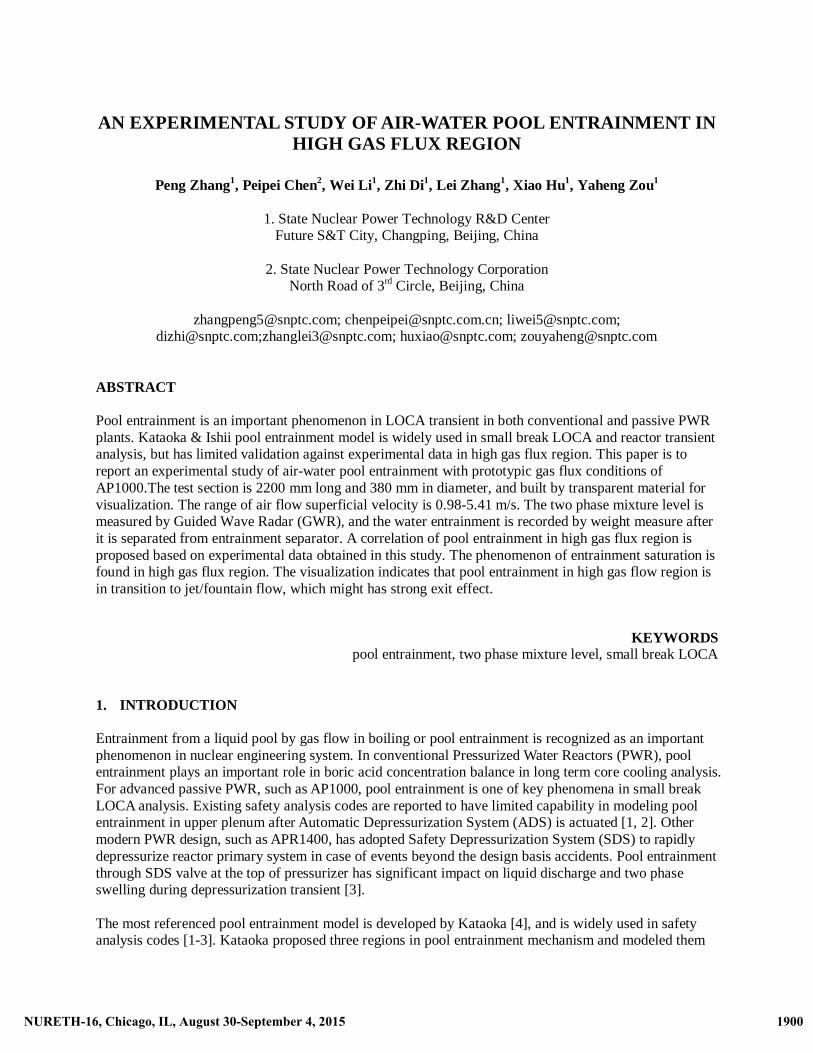
differently: (a) near surface region, (b) momentum controlled region, and (c) deposition controlled region. For each region, the statistical total entrainment rate Efg is characterized as a function of gas superficial velocity, two phase mixture level, vessel diameter and fluid properties.
Figure 1. Pool Entrainment Experimental Data in Literature
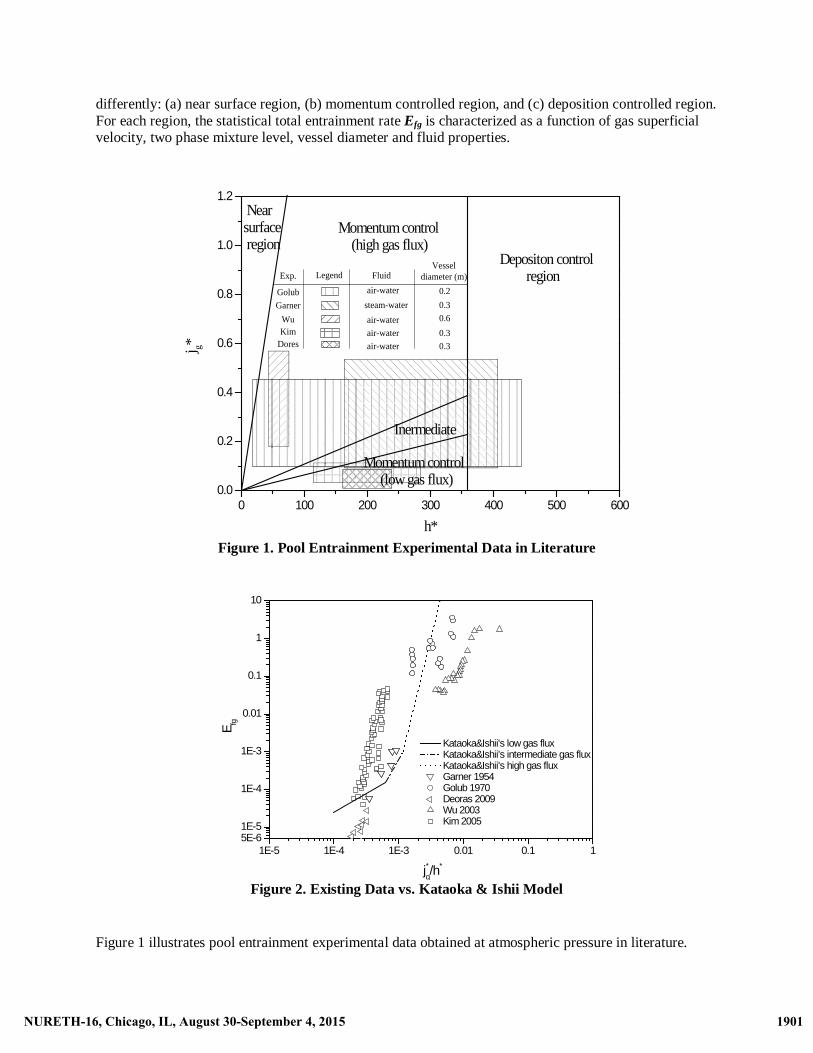
Figure 2. Existing Data vs. Kataoka & Ishii Model
Figure 1 illustrates pool entrainment experimental data obtained at atmospheric pressure in literature.
KimWu
Dores
Garner
Golub
Exp. FluidVessel
diameter (m)Legend
air-water 0.2
steam-water 0.3
air-water
air-water
air-water 0.6
0.3
0.3
0 100 200 300 400 500 6000.0
0.2
0.4
0.6
0.8
1.0
1.2 Nearsurface region
Momentum control (high gas flux)
Inermediate
Momentum control (low gas flux)
j g*
h*
Depositon control region
1E-5 1E-4 1E-3 0.01 0.1 15E-61E-5
1E-4
1E-3
0.01
0.1
1
10
Kataoka&Ishii's low gas fluxKataoka&Ishii's intermediate gas fluxKataoka&Ishii's high gas fluxGarner 1954Golub 1970Deoras 2009Wu 2003Kim 2005
Efg
j*g/h*
1901NURETH-16, Chicago, IL, August 30-September 4, 2015 1901NURETH-16, Chicago, IL, August 30-September 4, 2015
Results from Garner [5] and Golub [6] were used by Kataoka and Ishii to develop their model. Most of experiments were conducted at conditions with jg
*, the non-dimensional form of gas superficial velocity, less than 0.5, or with air/steam superficial velocity less than 2.5 m/s approximately. However, in a typical AP1000 SBLOCA accident with double-ended DVI line breaks, the steam superficial velocity at upper plenum, where pool entrainment occurs, will stay in the range of 2.5-10 m/s for a few hours. Due to the lack of available data at high gas flux region, Kataoka only suggested a proportional relationship of a power function in the ratio of superficial gas velocity and height above two phase mixture surface.
20~7** )/( hjE gfg � (1)
Therefore, more experimental data at high gas flux is needed for pool entrainment modeling or to complete the empirical correlation like Equation 1.
Some recent experimental studies are reported by Wu [2], Kim [3] and Deoras [6] with more advanced instrumentation and better documentation. Test sections used in above experiments have specific outlet features, which are chosen to simulate prototypic engineering design. For instance, test sections in Kim [3]and Deoras [6] have reduced area at outlet, which may result in strong Bernoulli effects at top of test section and cause higher gas velocity and entrainment rate. Wu conducted pool entrainment test at ATLATS facility with flow outlet at side of test section to reflect the geometry configuration of reactor upper plenum and hot leg, which may result in lower entrainment rate. Therefore, as shown in Figure 2, experiment data from Wu [2], Kim [3] and Deoras [6] shows some level of deviation from the predictions by Kataoka&Ishii’s model.
This paper is to report an experimental study of pool entrainment at high gas flux, of which data is scarce in literature. Analysis of two phase mixture level instrumentation used in experiment is also provided. Experiment results are discussed, and an empirical correlation is proposed for pool entrainment rate ofhigh gas flux region.
2. EXPERIMENT APARATUS AND INSTRUMENTATION
2.1. Experiment Set-up
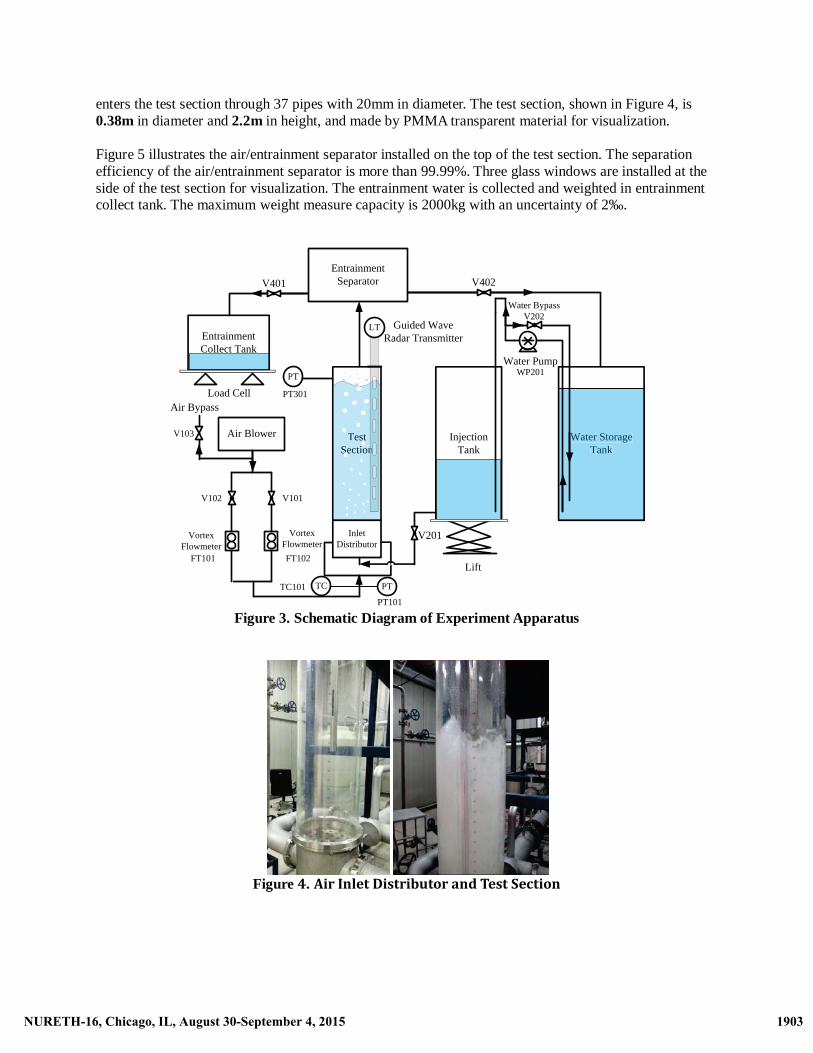
The schematic diagram of the experiment facility is shown in Figure 3. The test facility include air supply system, water supply system, test section, entrainment separator, water entrainment collect tank, instrumentation and data acquisition system.
The air blower is able to supply air flow at maximum volumetric flow rate about 37 m3/min, which corresponds to a superficial gas velocity jg= 5.5m/s in the test section and dimensionless superficial gas velocity jg
*�1.1. The air flow rate can be adjusted by the inverter of air blower and a bypass loop. Two
independent air supply lines are designed for high/low air flow demands.
Deionized water is prepared in the injection tank and the storage tank before experiments. The flow rate of supplied water to the injection tank can be controlled by a bypass loop between the injection tank and the storage tank. Water is injected from the bottom of the test section, thus the injection tank and the test section have the same collapsed water level at all times. The injection tank is supported by a lift which gives more flexibility to control the water level if necessary.
In order to have a uniform air flow, an air inlet distributor is installed at the bottom of the test section as shown in Figure 3. Air enters the test section through about 300 holes with 5mm in diameter, while water
1902NURETH-16, Chicago, IL, August 30-September 4, 2015 1902NURETH-16, Chicago, IL, August 30-September 4, 2015
enters the test section through 37 pipes with 20mm in diameter. The test section, shown in Figure 4, is 0.38m in diameter and 2.2m in height, and made by PMMA transparent material for visualization.
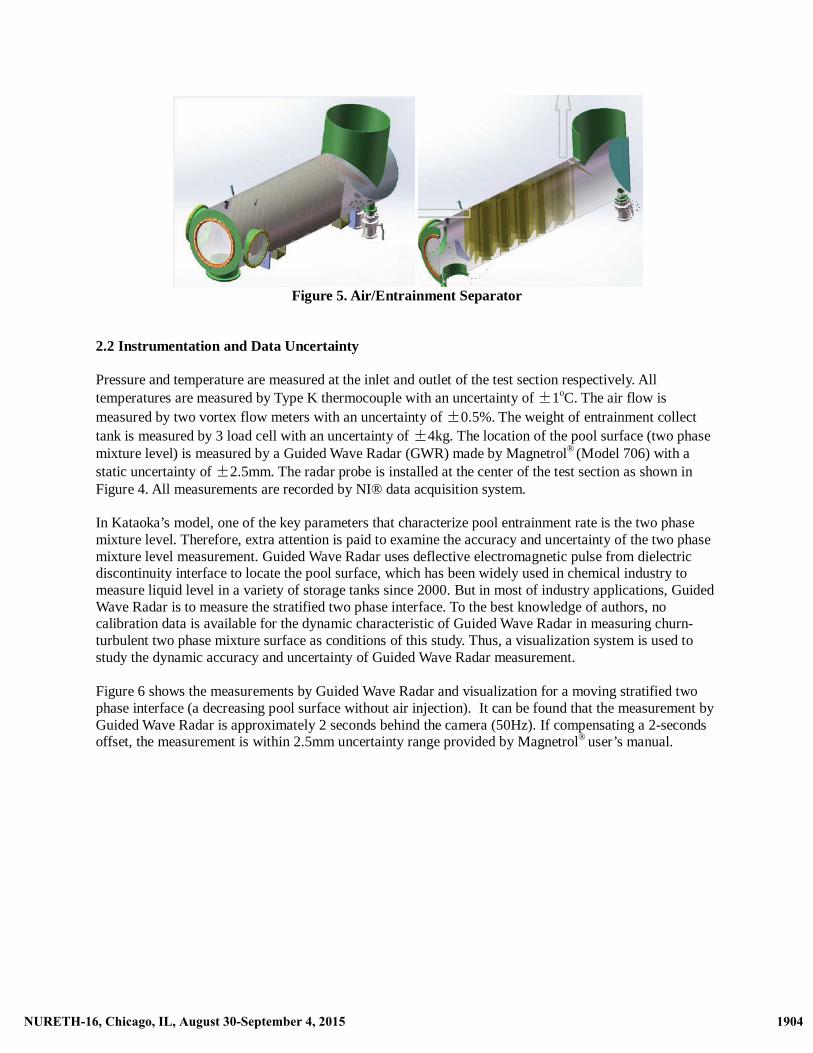
Figure 5 illustrates the air/entrainment separator installed on the top of the test section. The separation efficiency of the air/entrainment separator is more than 99.99%. Three glass windows are installed at the side of the test section for visualization. The entrainment water is collected and weighted in entrainment collect tank. The maximum weight measure capacity is 2000kg with an uncertainty of 2‰.
Figure 3. Schematic Diagram of Experiment Apparatus
Figure 4. Air Inlet Distributor and Test Section
TestSection
Air Blower
V102 V101
FT102
VortexFlowmeter
FT101
InletDistributor
PT
PT101
EntrainmentSeparator
LT Guided WaveRadar TransmitterEntrainment
Collect Tank
Water Storage Tank
InjectionTank
V201
Water PumpWP201PT
PT301
V401 V402
Lift
Air Bypass
V103
Load Cell
Water Storage Tank
VortexFlowmeter
TCTC101
TestSectionn
Water BypassV202
1903NURETH-16, Chicago, IL, August 30-September 4, 2015 1903NURETH-16, Chicago, IL, August 30-September 4, 2015
Figure 5. Air/Entrainment Separator
2.2 Instrumentation and Data Uncertainty
Pressure and temperature are measured at the inlet and outlet of the test section respectively. All temperatures are measured by Type K thermocouple with an uncertainty of 1oC. The air flow is measured by two vortex flow meters with an uncertainty of 0.5%. The weight of entrainment collect tank is measured by 3 load cell with an uncertainty of 4kg. The location of the pool surface (two phase mixture level) is measured by a Guided Wave Radar (GWR) made by Magnetrol® (Model 706) with a static uncertainty of 2.5mm. The radar probe is installed at the center of the test section as shown in Figure 4. All measurements are recorded by NI® data acquisition system.
In Kataoka’s model, one of the key parameters that characterize pool entrainment rate is the two phase mixture level. Therefore, extra attention is paid to examine the accuracy and uncertainty of the two phase mixture level measurement. Guided Wave Radar uses deflective electromagnetic pulse from dielectric discontinuity interface to locate the pool surface, which has been widely used in chemical industry to measure liquid level in a variety of storage tanks since 2000. But in most of industry applications, Guided Wave Radar is to measure the stratified two phase interface. To the best knowledge of authors, nocalibration data is available for the dynamic characteristic of Guided Wave Radar in measuring churn-turbulent two phase mixture surface as conditions of this study. Thus, a visualization system is used to study the dynamic accuracy and uncertainty of Guided Wave Radar measurement.
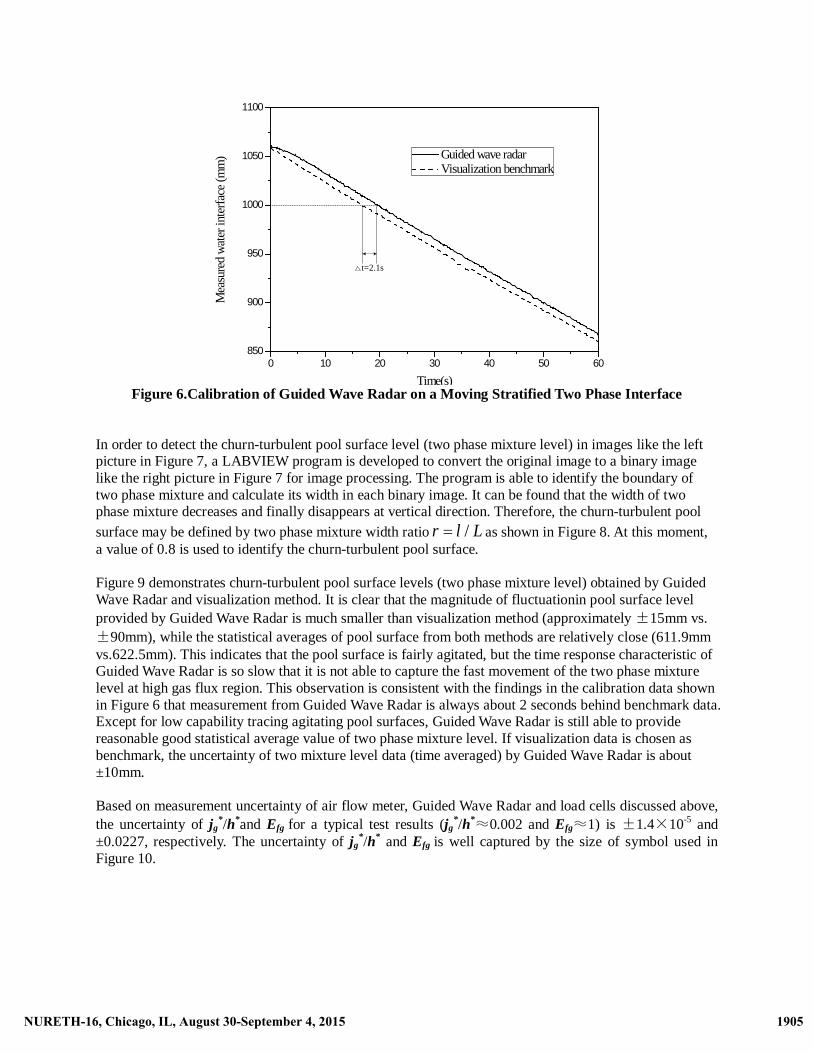
Figure 6 shows the measurements by Guided Wave Radar and visualization for a moving stratified two phase interface (a decreasing pool surface without air injection). It can be found that the measurement by Guided Wave Radar is approximately 2 seconds behind the camera (50Hz). If compensating a 2-secondsoffset, the measurement is within 2.5mm uncertainty range provided by Magnetrol® user’s manual.
1904NURETH-16, Chicago, IL, August 30-September 4, 2015 1904NURETH-16, Chicago, IL, August 30-September 4, 2015
Figure 6.Calibration of Guided Wave Radar on a Moving Stratified Two Phase Interface
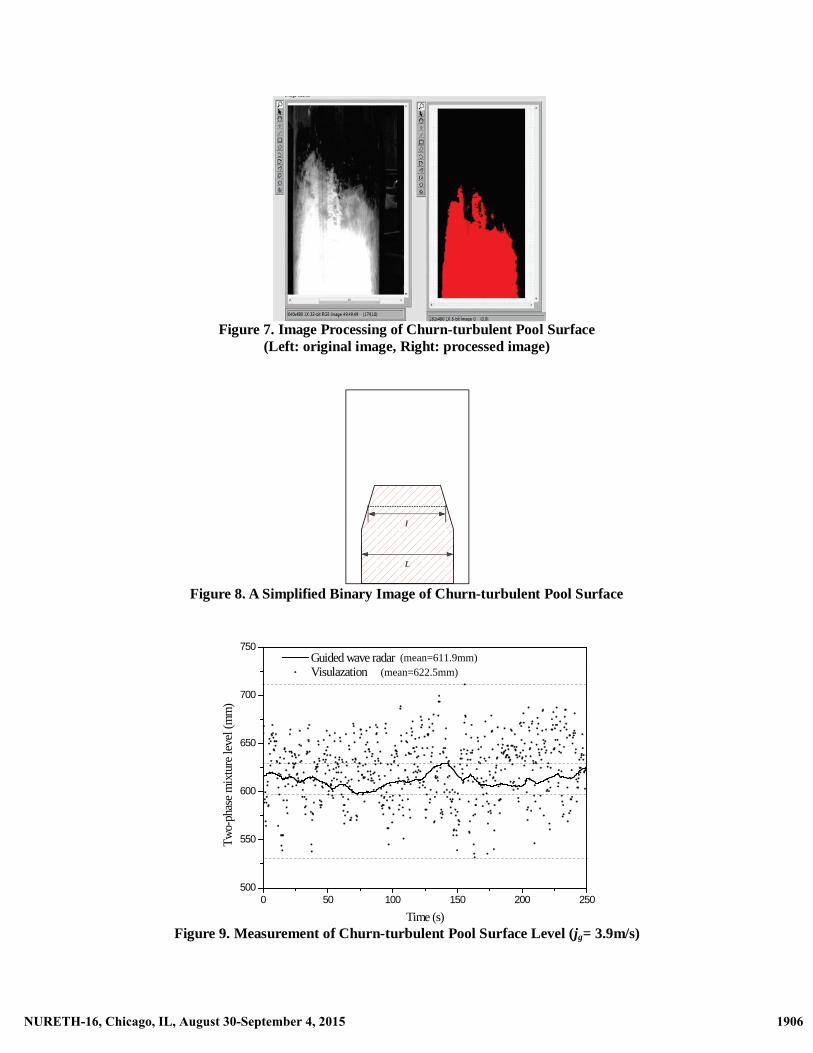
In order to detect the churn-turbulent pool surface level (two phase mixture level) in images like the left picture in Figure 7, a LABVIEW program is developed to convert the original image to a binary image like the right picture in Figure 7 for image processing. The program is able to identify the boundary of two phase mixture and calculate its width in each binary image. It can be found that the width of two phase mixture decreases and finally disappears at vertical direction. Therefore, the churn-turbulent pool surface may be defined by two phase mixture width ratio /r l L� as shown in Figure 8. At this moment, a value of 0.8 is used to identify the churn-turbulent pool surface.
Figure 9 demonstrates churn-turbulent pool surface levels (two phase mixture level) obtained by Guided Wave Radar and visualization method. It is clear that the magnitude of fluctuationin pool surface level provided by Guided Wave Radar is much smaller than visualization method (approximately 15mm vs.
90mm), while the statistical averages of pool surface from both methods are relatively close (611.9mm vs.622.5mm). This indicates that the pool surface is fairly agitated, but the time response characteristic of Guided Wave Radar is so slow that it is not able to capture the fast movement of the two phase mixture level at high gas flux region. This observation is consistent with the findings in the calibration data shown in Figure 6 that measurement from Guided Wave Radar is always about 2 seconds behind benchmark data. Except for low capability tracing agitating pool surfaces, Guided Wave Radar is still able to provide reasonable good statistical average value of two phase mixture level. If visualization data is chosen as benchmark, the uncertainty of two mixture level data (time averaged) by Guided Wave Radar is about ±10mm.
Based on measurement uncertainty of air flow meter, Guided Wave Radar and load cells discussed above, the uncertainty of jg
*/h*and Efg for a typical test results (jg*/h* 0.002 and Efg 1) is 1.4 10-5 and
±0.0227, respectively. The uncertainty of jg*/h* and Efg is well captured by the size of symbol used in
Figure 10.
0 10 20 30 40 50 60850
900
950
1000
1050
1100
Mea
sure
d w
ater
inte
rfac
e (m
m)
Time(s)
Guided wave radar Visualization benchmark
t=2.1s
1905NURETH-16, Chicago, IL, August 30-September 4, 2015 1905NURETH-16, Chicago, IL, August 30-September 4, 2015
Figure 7. Image Processing of Churn-turbulent Pool Surface(Left: original image, Right: processed image)
l
L
lllllllll
LLLLLLLL
Figure 8. A Simplified Binary Image of Churn-turbulent Pool Surface
Figure 9. Measurement of Churn-turbulent Pool Surface Level (jg= 3.9m/s)
0 50 100 150 200 250500
550
600
650
700
750 Guided wave radarVisulazation
Two-
phas
e m
ixtu
re le
vel (
mm
)
Time (s)
(mean=622.5mm)(mean=611.9mm)
1906NURETH-16, Chicago, IL, August 30-September 4, 2015 1906NURETH-16, Chicago, IL, August 30-September 4, 2015
2.3 Test Conditions
The experiments are carried out under atmosphere pressure and room temperature (approximately 20oC). In Kataoka’s model, the entrainment rate is characterized by the ratio of two non-dimensional parameters,jg
*/ h*, for given pressure and temperature. Total of 43 tests are performed under wide range of air flow and two phase mixture level conditions, which are illustrated in Table I.
All experiments are conducted at steady state condition. For a given air flow rate, two phase mixture level in test section can be controlled by adjusting liquid supply line bypass valve (V202). Data will be recorded once the steady two phase mixture level is achieved at given air flow rate. The minimum data recording time is 300 seconds. For test conditions with low entrainment rate, recording time will be extended in order to reduce data uncertainty of weight measurement of entrainment collect tank.
3. RESULTSAND DISCUSSION
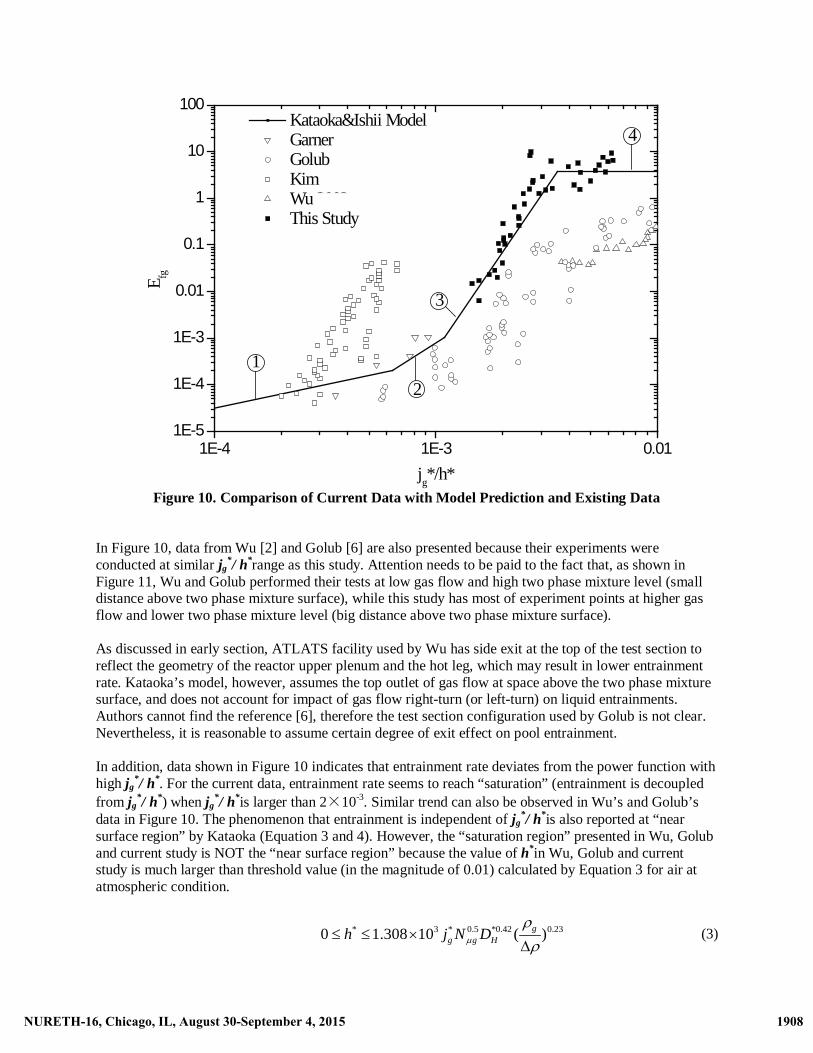
The results of current study are shown in Figure 10 with other pool entrainment experimental data available in literature. All test data are plotted against predictions by Kataoka’s model (line 1-4) using air physical properties at atmospheric pressure and 20oC. Line 1-4 respectively represent low, intermediate, high gas flux and near surface region defined in Kataoka’s model. It can be seen that current data agrees with Kataoka’ model reasonably well in high gas flux region. Kataoka suggests a power function relationship between entrainment rate and the ratio jg
*/ h* with power parameter of 7~20 in high gas flux region, (see Equation 1). If one takes the format as Equation 1, the following correlation gives the best fitting to current data.
6.7**19 )/(100.4 hjE gfg �� (2)
1907NURETH-16, Chicago, IL, August 30-September 4, 2015 1907NURETH-16, Chicago, IL, August 30-September 4, 2015
Figure 10. Comparison of Current Data with Model Prediction and Existing Data
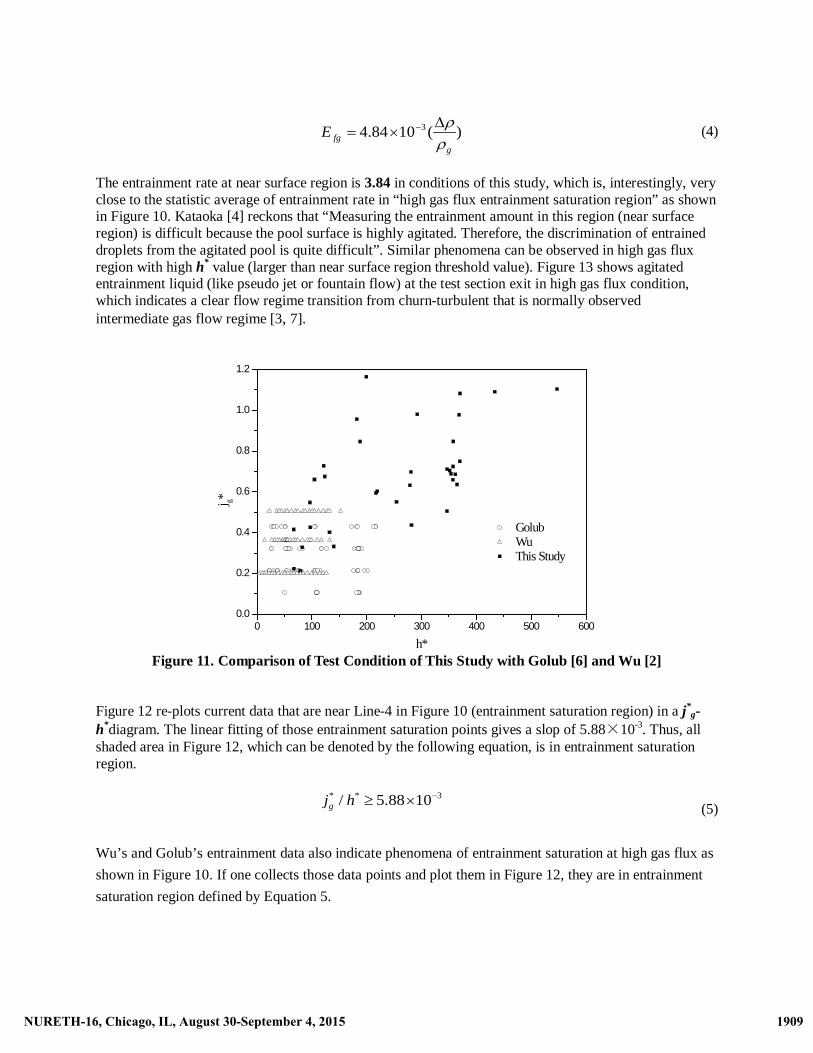
In Figure 10, data from Wu [2] and Golub [6] are also presented because their experiments were conducted at similar jg
*/ h*range as this study. Attention needs to be paid to the fact that, as shown in Figure 11, Wu and Golub performed their tests at low gas flow and high two phase mixture level (small distance above two phase mixture surface), while this study has most of experiment points at higher gas flow and lower two phase mixture level (big distance above two phase mixture surface).
As discussed in early section, ATLATS facility used by Wu has side exit at the top of the test section to reflect the geometry of the reactor upper plenum and the hot leg, which may result in lower entrainment rate. Kataoka’s model, however, assumes the top outlet of gas flow at space above the two phase mixture surface, and does not account for impact of gas flow right-turn (or left-turn) on liquid entrainments. Authors cannot find the reference [6], therefore the test section configuration used by Golub is not clear.Nevertheless, it is reasonable to assume certain degree of exit effect on pool entrainment.
In addition, data shown in Figure 10 indicates that entrainment rate deviates from the power function with high jg
*/ h*. For the current data, entrainment rate seems to reach “saturation” (entrainment is decoupled from jg
*/ h*) when jg*/ h*is larger than 2 10-3. Similar trend can also be observed in Wu’s and Golub’s
data in Figure 10. The phenomenon that entrainment is independent of jg*/ h*is also reported at “near
surface region” by Kataoka (Equation 3 and 4). However, the “saturation region” presented in Wu, Golub and current study is NOT the “near surface region” because the value of h*in Wu, Golub and current study is much larger than threshold value (in the magnitude of 0.01) calculated by Equation 3 for air atatmospheric condition.
* 3 * 0.5 *0.42 0.230 1.308 10 ( )gg g Hh j N D�
��
� � ��
(3)
1E-4 1E-3 0.011E-5
1E-4
1E-3
0.01
0.1
1
10
100
3
4
2
Kataoka&Ishii ModelGarnerGolubKimWu 2003 This Study
E fg
jg*/h*
1
1908NURETH-16, Chicago, IL, August 30-September 4, 2015 1908NURETH-16, Chicago, IL, August 30-September 4, 2015
)(1084.4 3
gfgE
���
�� (4)
The entrainment rate at near surface region is 3.84 in conditions of this study, which is, interestingly, very close to the statistic average of entrainment rate in “high gas flux entrainment saturation region” as shown in Figure 10. Kataoka [4] reckons that “Measuring the entrainment amount in this region (near surface region) is difficult because the pool surface is highly agitated. Therefore, the discrimination of entrained droplets from the agitated pool is quite difficult”. Similar phenomena can be observed in high gas flux region with high h* value (larger than near surface region threshold value). Figure 13 shows agitated entrainment liquid (like pseudo jet or fountain flow) at the test section exit in high gas flux condition, which indicates a clear flow regime transition from churn-turbulent that is normally observed intermediate gas flow regime [3, 7].
Figure 11. Comparison of Test Condition of This Study with Golub [6] and Wu [2]
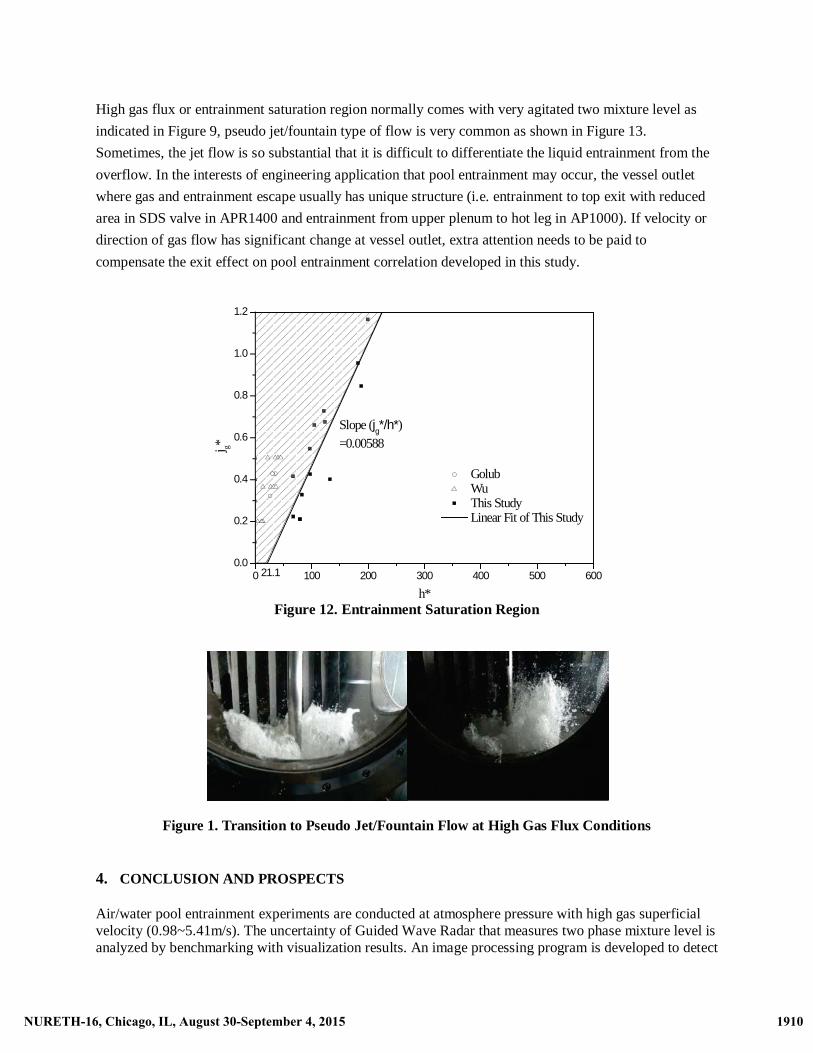
Figure 12 re-plots current data that are near Line-4 in Figure 10 (entrainment saturation region) in a j*g-
h*diagram. The linear fitting of those entrainment saturation points gives a slop of 5.88 10-3. Thus, all shaded area in Figure 12, which can be denoted by the following equation, is in entrainment saturation region.
* * 3/ 5.88 10gj h �(5)
Wu’s and Golub’s entrainment data also indicate phenomena of entrainment saturation at high gas flux as
shown in Figure 10. If one collects those data points and plot them in Figure 12, they are in entrainment
saturation region defined by Equation 5.
0 100 200 300 400 500 6000.0
0.2
0.4
0.6
0.8
1.0
1.2
Golub Wu This Study
j g*
h*
1909NURETH-16, Chicago, IL, August 30-September 4, 2015 1909NURETH-16, Chicago, IL, August 30-September 4, 2015
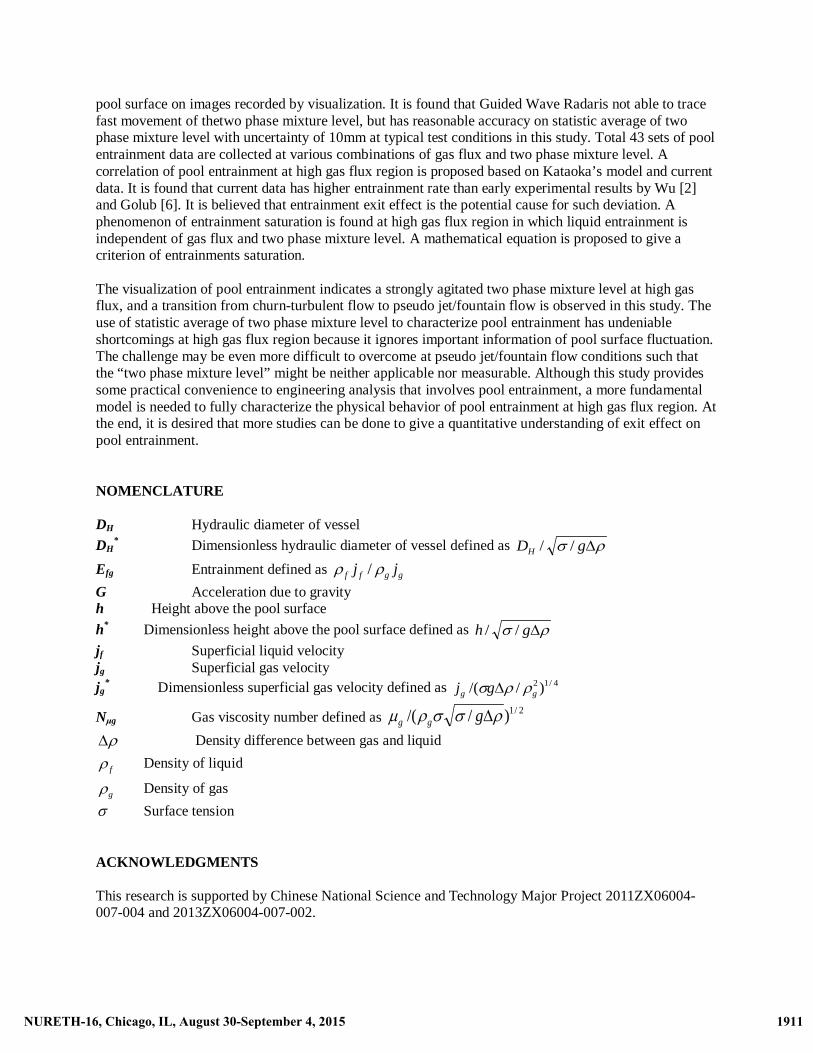
High gas flux or entrainment saturation region normally comes with very agitated two mixture level as
indicated in Figure 9, pseudo jet/fountain type of flow is very common as shown in Figure 13.
Sometimes, the jet flow is so substantial that it is difficult to differentiate the liquid entrainment from the
overflow. In the interests of engineering application that pool entrainment may occur, the vessel outlet
where gas and entrainment escape usually has unique structure (i.e. entrainment to top exit with reduced
area in SDS valve in APR1400 and entrainment from upper plenum to hot leg in AP1000). If velocity or
direction of gas flow has significant change at vessel outlet, extra attention needs to be paid to
compensate the exit effect on pool entrainment correlation developed in this study.
Figure 12. Entrainment Saturation Region
Figure 1. Transition to Pseudo Jet/Fountain Flow at High Gas Flux Conditions
4. CONCLUSION AND PROSPECTS
Air/water pool entrainment experiments are conducted at atmosphere pressure with high gas superficial velocity (0.98~5.41m/s). The uncertainty of Guided Wave Radar that measures two phase mixture level is analyzed by benchmarking with visualization results. An image processing program is developed to detect
0 100 200 300 400 500 6000.0
0.2
0.4
0.6
0.8
1.0
1.2
Slope (jg*/h*)
=0.00588
21.1
Golub Wu This Study Linear Fit of This Study
j g*
h*
1910NURETH-16, Chicago, IL, August 30-September 4, 2015 1910NURETH-16, Chicago, IL, August 30-September 4, 2015
pool surface on images recorded by visualization. It is found that Guided Wave Radaris not able to trace fast movement of thetwo phase mixture level, but has reasonable accuracy on statistic average of twophase mixture level with uncertainty of 10mm at typical test conditions in this study. Total 43 sets of pool entrainment data are collected at various combinations of gas flux and two phase mixture level. Acorrelation of pool entrainment at high gas flux region is proposed based on Kataoka’s model and current data. It is found that current data has higher entrainment rate than early experimental results by Wu [2]and Golub [6]. It is believed that entrainment exit effect is the potential cause for such deviation. A phenomenon of entrainment saturation is found at high gas flux region in which liquid entrainment is independent of gas flux and two phase mixture level. A mathematical equation is proposed to give acriterion of entrainments saturation.
The visualization of pool entrainment indicates a strongly agitated two phase mixture level at high gas flux, and a transition from churn-turbulent flow to pseudo jet/fountain flow is observed in this study. The use of statistic average of two phase mixture level to characterize pool entrainment has undeniable shortcomings at high gas flux region because it ignores important information of pool surface fluctuation.The challenge may be even more difficult to overcome at pseudo jet/fountain flow conditions such thatthe “two phase mixture level” might be neither applicable nor measurable. Although this study provides some practical convenience to engineering analysis that involves pool entrainment, a more fundamental model is needed to fully characterize the physical behavior of pool entrainment at high gas flux region. At the end, it is desired that more studies can be done to give a quantitative understanding of exit effect on pool entrainment.
NOMENCLATURE
DH Hydraulic diameter of vessel
DH* Dimensionless hydraulic diameter of vessel defined as �� �gDH //
Efg Entrainment defined as ggff jj �� /
G Acceleration due to gravityh Height above the pool surface
h* Dimensionless height above the pool surface defined as �� �gh //jf Superficial liquid velocityjg Superficial gas velocityjg
* Dimensionless superficial gas velocity defined as 4/12 )//( gg gj ��� �
N�g Gas viscosity number defined as 2/1)//( ����� �ggg
�� Density difference between gas and liquid
f� Density of liquid
g� Density of gas
� Surface tension
ACKNOWLEDGMENTS
This research is supported by Chinese National Science and Technology Major Project 2011ZX06004-007-004 and 2013ZX06004-007-002.
1911NURETH-16, Chicago, IL, August 30-September 4, 2015 1911NURETH-16, Chicago, IL, August 30-September 4, 2015
REFERENCES
1. AP1000 Design Control Document, Revision 19, 15.6-312. Q. Wu, P. Young, K. Abel, Y. Yao, Y.J.Yoo, K.B. Welter , S. M. Bajorek, J. Han, “Liquid Entrainment
in Reactor Vessel”, 13th International Conference on Nuclear Engineering, Beijing, China(2005).3. C. H. Kim, H. C. No, “Liquid entrainment and off-take through the break at the top of a vessel”,
Nuclear Engineering and Design, 235, pp.1675–1685(2005).4. I. Kataoka, M. Ishii, “Mechanistic Modeling and Correlations for Pool Entrainment Phenomenon”,
NUREG/CR-3304(1983).5. F.H. Garner, S.R.M. Ellis, J.A. Lacey, “The Size Distribution and Entrainment of Droplets”, Trans.
Inst. Chem, Engs. 32(222)(1954).6. S.I. Golub, “Investigation of Moisture Carryover and Separation in Evaporation Apparatus”,
Candidates Dissertation, MEI(1970) (quoted from refer. [4]).7. M. P.Deoras, Z. M.Rahul, N. I.Kannan, “Experiment Study of Liquid Carryover in Separator Drum”,
Nuclear Engineering and Design, 240, pp.76-83(2010).
1912NURETH-16, Chicago, IL, August 30-September 4, 2015 1912NURETH-16, Chicago, IL, August 30-September 4, 2015