Page 1
Via Sapientiae:The Institutional Repository at DePaul University
College of Science and Health Theses andDissertations College of Science and Health
6-1-2012
An Exploration of Engagement: A CustomerPerspectiveLaura M. [email protected]
This Dissertation is brought to you for free and open access by the College of Science and Health at Via Sapientiae. It has been accepted for inclusion inCollege of Science and Health Theses and Dissertations by an authorized administrator of Via Sapientiae. For more information, please [email protected] .
Recommended CitationFlynn, Laura M., "An Exploration of Engagement: A Customer Perspective" (2012). College of Science and Health Theses andDissertations. Paper 8.http://via.library.depaul.edu/csh_etd/8
Page 2
AN EXPLORATION OF ENGAGEMENT: A CUSTOMER PERSPECTIVE
A Dissertation
Presented in
Partial Fulfillment of the
Requirements for the Degree of
Doctor of Philosophy
BY
LAURA M. FLYNN
JUNE, 2012
Department of Psychology
College of Science & Health
DePaul University
Chicago, Illinois
Page 3
ii
DISSERTATION COMMITTEE
Jane Halpert, Ph.D.
Chair
Douglas Cellar, Ph.D.
Margaret Posig, Ph.D.
Robert Rubin, Ph.D.
Annette Towler, Ph.D.
Page 4
iii
ACKNOWLEDGMENTS
I would like to express my sincere appreciation to my dissertation chair
Jane Halpert and committee members Douglas Celler, Annette Towler, Margaret
Posig, and Robert Rubin for their guidance throughout this process. Additionally,
I would like to specially thank my parents, along with my spouse, brother and
grandmother for their support and encouragement during my educational training.
Page 5
iv
VITA
The author, Laura M. Flynn (formerly Laura M. Miller), was born in
Arlington Heights, Illinois, July 3, 1983. She graduated high school from Loyola
Academy in Wilmette, Illinois in 2001. Following, she received her Bachelor of
Arts degree in 2005 and her Master of Arts degree in 2008 both from DePaul
University with high honors.
Page 6
v
TABLE OF CONTENTS
Dissertation Committee …………………………………………………………..ii
Acknowledgments ……………………………………………………………….iii
Vita ……………………………………………………………………………….iv
List of Tables ………………………………………………………………........vii
List of Figures …………………………………………………………….......…ix
CHAPTER I. INTRODUCTION ………………………………………………...1
Employee Engagement ……………………………………....…………4
Consumer Behavior …………………………………………………...11
Customer Service Behavior .......……………………………………....13
Customer Engagement ………………………………………………...17
Process of Customer Engagement ………………………………….…20
Antecedents of Customer Engagement ….………………………….…21
Customer Commitment ……………………………………………..…22
Customer Satisfaction …………………………………………….…...25
Customer Involvement ……………………………………………..….28
Customer Trust ……………………………………………………...…31
Brand Image ………………………………………………………..….33
Customer Engagement Outcome Variables …………………...……….34
Loyalty & Word of Mouth Referral ……………………………..….....34
Share of Wallet ………………………………………………………...35
Website Behaviors ……………………………………………………..36
Transactions …………………………………………………………...36
Page 7
vi
Retention ………………………………………………………………36
E-Commerce …………………………………………………………...37
Business-to-Business Relationships …….……………………………..40
Rationale ………………………………………………………….........42
Statement of Hypotheses ……………….…………………………....…43
CHAPTER II. METHOD ……...…….………………………………………….48
Research Participants .......……………..………………………………48
Procedure …………………………….………………………………..49
Measures …………………………….………………………………...56
CHAPTER III. RESULTS ……………… ….…………………………….........63
CHAPTER IV. DISCUSSION ……………………………………………..…..84
CHAPTER V. SUMMARY ……………………………………………….......103
References ……...……………………………………………………...……….105
Appendix ……………………………………………………………………….123
Page 8
vii
LIST OF TABLES
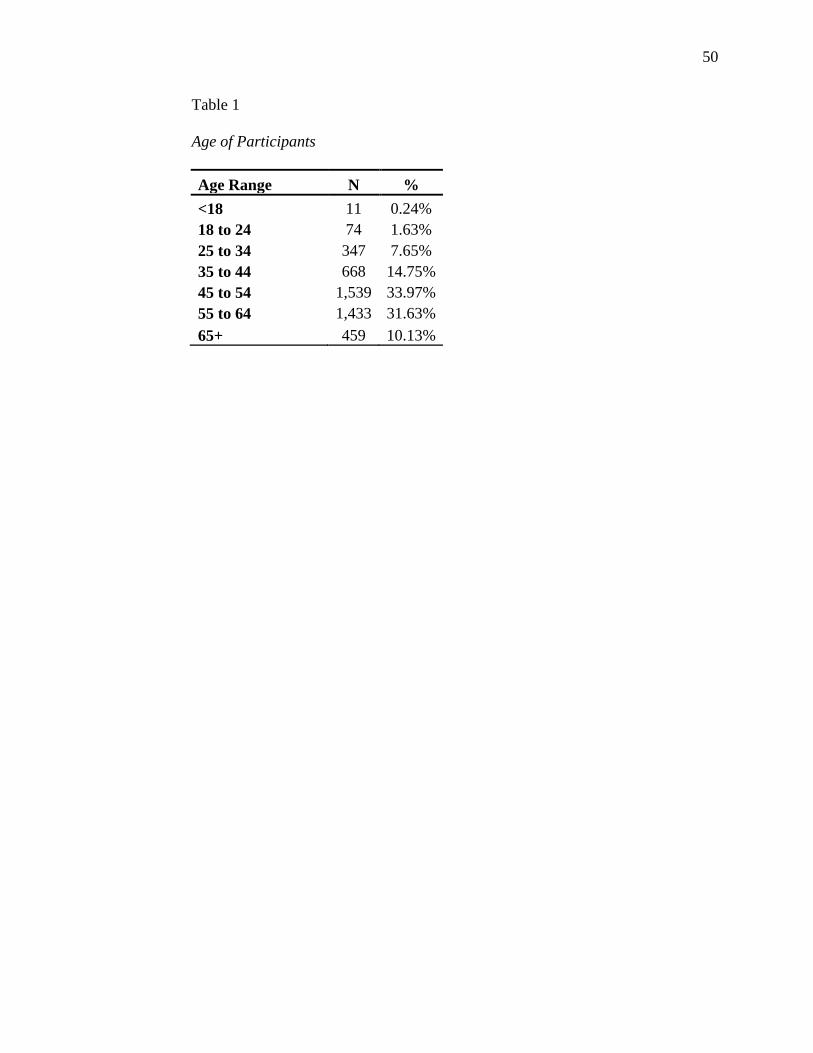
Table 1. Age of Participants.……………………………………………………..50
Table 2. Job Title of Participants.………………………………………………..51
Table 3. Job Role of Participants………………………………………………...52
Table 4. Preferred Search Medium……………………………………………....53
Table 5. Preferred Purchasing Medium………………………………………….54
Table 6. Business Type of Participants…………………………………………..55
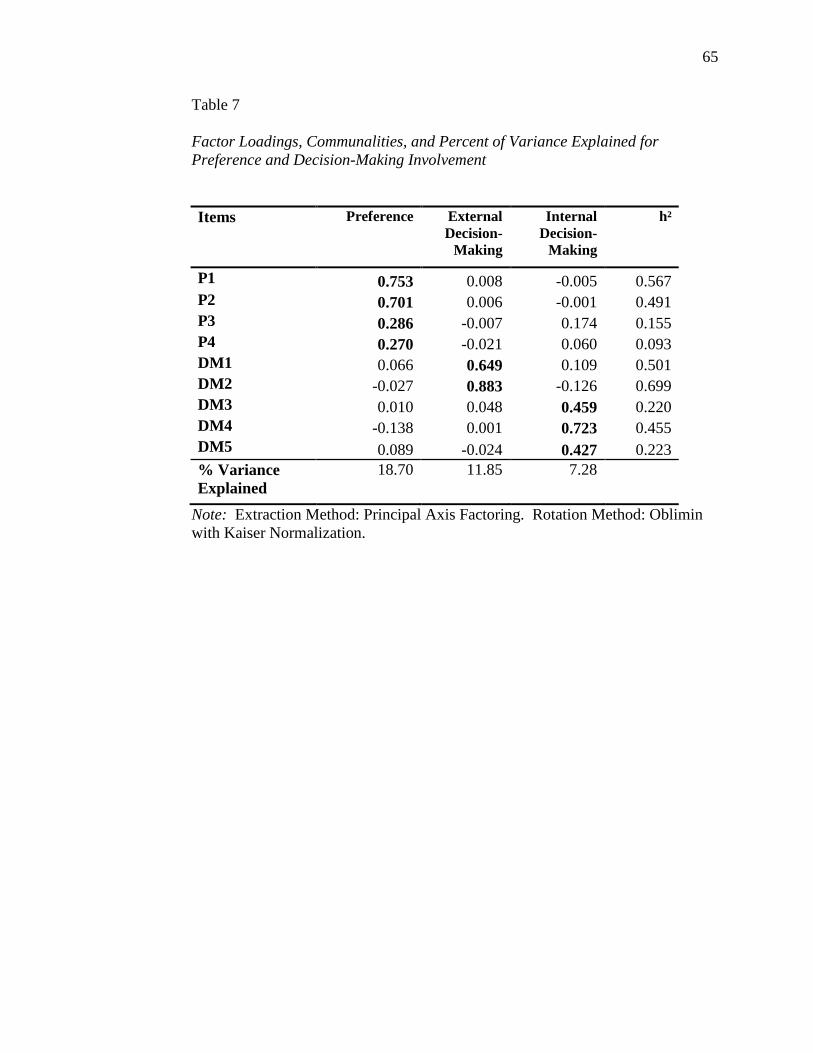
Table 7. Factor Loadings, Communalities, and Percent of Variance Explained for
Preference and Decision-Making Involvement …...…..………………..………65
Table 8. Factor Loadings, Communalities, and Percent of Variance Explained for
Satisfaction …………………………………………………………..…...…….66
Table 9. Factor Loadings, Communalities, and Percent of Variance Explained for
Commitment ………………………………………………………...……...…..67
Table 10. Factor Loadings, Communalities, and Percent of Variance Explained
for Brand Image and Trust...………….………………………………...………68
Table 11. Factor Loadings, Communalities, and Percent of Variance Explained
for Loyalty…….…….……..………………………..…………………………..69
Table 12. Factor Loadings, Communalities, and Percent of Variance Explained
for Customer Engagement……………………………………….………..……70
Table 13. Means, Standard Deviations, and Correlations Among Variables .....71
Table 14. Unstandardized, Standardized, and Significance Levels for Model....76
Table 15. Unstandardized Covariance Estimates and Significance Levels for
Model...………………………………………………………………………….77
Page 9
viii
Table 16. Unstandardized, Standardized, and Significance Levels for Partial
Mediation……………………………………….…………………………….…81
Page 10
ix
LIST OF FIGURES
Figure 1. Customer Engagement Measurement Framework …………...………..5
Figure 2. Customer Engagement Structural Regression Model ………..….…..73
Figure 3. Customer Engagement Path Model ……………….…………...……. 75
Figure 4. Customer Engagement Path Model with Parameter Estimates …..…...79
Page 11
1
CHAPTER I.
INTRODUCTION
Across many organizations, business leaders have shown an ever
increasing interest in the concept of engagement. Engagement can be defined as
the personal investment one puts forth in order for an organization to succeed
(Macy & Schneider, 2008). Organizations are eager to understand how
engagement could provide insight on how to produce more value added
contributions to make work more effective. As a result, within the internal
networks of an organization, human resources and leadership/organizational
development departments are beginning to survey and evaluate engagement
among employees more readily (Hewitt Associates LLC, 2005). Furthermore,
there is a need for organizations to expand the notion of employee engagement to
other domains such as exploring customer engagement. Since there is an
increased interest in engagement measurement within organizations, it is
important to facilitate a science-practitioner approach that will incorporate an
appropriate theoretical foundation (Harter, Schmidt, & Hayes, 2002; Macey &
Schneider, 2008). The majority of engagement literature to date has focused on
employee engagement. This body of literature relates job characteristics with the
attitudes and behaviors demonstrated by employees at work. Employee
engagement has sparked discussions on how the concept is defined, how it should
be measured, and what value it brings to an organization. Since there are limited
publications on customer engagement, evidence from employee engagement
Page 12
2
literature will be utilized to support the customer engagement framework
presented.
Following the engagement trend, organizations have a growing curiosity
to learn not only how their employees are engaged, but also to what extent their
customers are engaged as well. Customer engagement is viewed alike to
employee engagement where customers are viewed as exceeding performance
expectations to help a provider succeed. Customer engagement has become a
popular concept to businesses as they are seeking out new ways to retain and
acquire customers, especially during times of an economic downturn (McEwen,
2004). Furthermore, organizations are concerned with the ways in which they can
engage their customers across different channels. Today, many organizations
conduct business in different channels, such as the internet, phone, or by visiting a
store location. Customers’ personal preference can dictate which channels or
mediums are mostly considered to search for products or conduct a business
transaction (Kim, Ferrin, & Rao, 2009; Lee & Bellman, 2008). To add another
layer of complexity, differences exist with these processes depending on the type
of business (i.e., business-to-business (B2B), business-to-customer (B2C),
customer-to-customer (C2C)). All these factors should be considered when
organizations are making attempts to engage their customer base.
The concept of engagement has a foundational element that can be applied
to multiple domains, such as employee or customer engagement. In the domain
of customer engagement it is just as important to understand what drives
customers to conduct business with certain organizations and what causes those
Page 13
3
same customers to repeat business transactions (Bowden, 2009a). Definitions for
engagement can be translated to fit customer engagement and the relations
customers have with a business instead of relations of employees to a work
organization. Two definitions that will be of focus for defining customer
engagement in this study are the following: 1) Repeated interactions that
strengthen the emotional, psychological, or physical investment a customer has in
a brand, 2) the willingness of customers to invest oneself and discretionary effort
to help a provider succeed (Macey & Schneider, 2008). From these definitions,
interactions with either a business or brand are of focus instead of characteristics
of work which is the case in employee engagement.
Engagement fundamentally incorporates cognitive, emotional, and
psychological components and it can be used as a proxy in customer behavior
research for evaluating customer relationships with a company or brand. Then,
engagement becomes relevant to evaluating service performance based on
customers’ attitudes towards feelings of confidence, trust, integrity, pride, and
passion in this customer-brand relationship (McEwen, 2004). Employees or
customers who are engaged add value to an organization such that company
specific knowledge is developed over time.
The current study sought to adapt a measurement framework for employee
engagement to customer engagement. Specifically, the Utrecht Work
Engagement Scale with a three-factor structure of vigor, dedication, and
absorption was modified to assess customer engagement (Schaufeli, Salanova,
Gonzalez-Roma, & Bakker, 2002). Customers and employees face similar tasks
Page 14
4
and challenges on a daily basis. For example, an employee might find challenges
with identifying the correct approach to deliver a report whereas a customer may
be challenged with selecting the right tool to purchase to complete a job back in
the warehouse. With the construct of engagement, both of these groups have
opportunities to demonstrate persistence, pride, and enthusiasm as well as
investing effort to help a business succeed. Additionally, the current study
focused on the business-to-business context which is typically understudied
compared to business-to-consumer contexts. As a final addition to the current
study, it was sought to understand customer engagement online or through the e-
Commerce service channel. Figure 1 summarizes the relationships examined in
the current study. The following section will review literature concerning 1)
employee engagement, 2) consumer behavior, 3) customer engagement, 4) type of
business, and 5) the role of e-Commerce while providing supporting evidence
from employee engagement research. Following this literature review,
hypotheses, methodology, analysis, discussion, and implications of research will
be discussed.
Employee Engagement
Prior to discussing customer engagement, the history and current state of
the literature on employee engagement will be briefly discussed. The surge of
interest in employee engagement was partially a result of high quality talent
leaving organizations followed by decreased levels of productivity. There was a
shift in the employment contract that would no longer guarantee lifetime
employment in exchange for commitment and loyalty to an organization starting
Page 15
5
Figure 1. Customer Engagement Measurement Framework.
Page 16
6
in the 1980’s (Welbourne, 2007). With this work culture shift, employees
welcomed changing jobs or organizations when thought necessary. With other
work opportunities available, employees did not see the need to put forth extra
effort or overtime. These changes promoted a new vision in organizations which
was the notion of employee engagement.
Academic research was slow to jump on the engagement bandwagon.
However, engagement is noted to have roots in social science disciplines
including management, psychology, education, and public health (Burke, 2008;
Wallerstein & Bernstein, 1988). Within organizational behavior literature, the
study of engagement has been of increased interest since relationships have been
linked to high job satisfaction, low absenteeism, high organizational commitment
and performance (Harter et al., 2002; Salanova, Agut, & Peiro, 2005). Findings at
the business-unit level of analysis have revealed that high employee engagement
subsequently impacts customer satisfaction and loyalty (Harter et al., 2002).
Employee engagement has continued to gain the attention of many
researchers and practitioners. Engagement is seen as originating from attitude
research and extends to demonstrate relationships with profitability through
increases in employee productivity and decreased turnover, along with customer
sales, satisfaction, and retention (Harter et al., 2002; Hewitt Associates LLC,
2005; Macey & Schneider, 2008). To stay competitive, organizations should find
strategic ways to function beyond contractual relationships and move from
compliance to cooperative behaviors. With the study of engagement, it is hoped
that the attitudes and behaviors necessary for this transition become clearer.
Page 17
7
Even though there does not seem to be a unified definition of employee
engagement, several definitions have common underlying themes. Typically
individuals associate positive terms with the definition of engagement since it is
thought of as a desirable condition. Engagement has been thought to encompass
elements from motivation and attitudinal research with focus on involvement,
commitment, passion, enthusiasm, effort, and energy (Macey & Schneider, 2008).
For the most part, engagement has been studied or defined from a psychological
state perspective. Additionally, there is other research that has attempted to
understand behavioral (e.g., organizational citizenships behaviors (OCB)) and
dispositional (e.g., positive affect) components of engagement (Bernthal, 2004;
Towers-Perrin, 2003; Wellins & Concelman, 2005). Specific definitions for
engagement are as follows: a high internal motivational state (Colbert, Mount,
Harter, Witt, & Barrick, 2004), the willingness to invest oneself and expend one’s
discretionary effort to help an employer succeed (Erickson, 2005), the
individual’s involvement and satisfaction with as well as enthusiasm for work
(Harter et al., 2002), the shared variance among job performance, withdrawal, and
citizenship behavior (Newman & Harrison, 2008) and persistent, positive
affective-motivational state of fulfillment characterized by vigor, dedication, and
absorption (Schaufeli et al., 2002). Most commonly, however, the definition of
engagement tends to combine both role performance and affective states (Macey
& Schneider, 2008). Engagement has been thought to exist either on a
continuum, ranging from low to high, or as a dichotomy, engagement or
disengagement (Macey & Schneider, 2008).
Page 18
8
As reviewed in the following sections, Macey and Schneider conceptually
described employee engagement as having state, behavioral, and trait components
(2008). The discussion around these components will be reviewed in the above
order. The concept of state engagement has received the most attention in
literature to date. State engagement acts as an antecedent for behavioral
engagement. State engagement is defined as having feelings of absorption,
satisfaction, involvement, attachment, energy and enthusiasm towards work
(Macy & Schneider, 2008). Schaufeli et al. (2002) defined work engagement “as
a positive, fulfilling, work-related state of mind that is characterized by vigor,
dedication, and absorption.” It is assumed that engagement will be relatively
stable when considering mostly stationary job and organizational factors.
Additionally, the feelings associated with engagement are thought to be attributed
to characteristics of the job. Several job attitudes have significant individual and
business-level outcomes such as profit, sales, and customer ratings (e.g., Harter et
al., 2002; Judge, Thoresen, Bono, & Patton, 2001). These research findings
continue to emphasize the value of attitudes in the workplace and continued ways
to foster their development. The challenge however is to distinguish the
measurement of engagement from previously existing attitudes. For example,
Schaufeli and colleagues promote the measurement of vigor, dedication, and
absorption components of engagement to make this distinction clearer (Schaufeli
et al., 2002).
Behavioral engagement is thought of as effort directed towards in-role and
extra-role behaviors (e.g., Erickson, 2005; Towers-Perrin, 2003). These
Page 19
9
behaviors are directly observable actions. Effort has traditionally been thought to
encompass three components, duration, direction, and intensity (Campbell &
Pritchard, 1976; Kanfer, 1990). Once individuals are energized and focused with
state engagement, behavioral engagement ensues as attitudes transformed into
actions. In this regard, engagement results in behaviors that are typically viewed
as positive. The current study will focus on the relationship between state
engagement and behavioral outcomes. As state engagement is flawed with
measurement confusion, behavioral engagement is suspect to similar scrutiny.
When defining behavioral engagement measurement, it is hard to distinguish
between everyday work behaviors and behaviors resulting from engagement. In
this regard, engagement behaviors are better identified as being atypical or in
addition to required work performance.
As mentioned previously, individuals are more likely to invest time and
effort in tasks that coincide with their self identity (Kahn, 1990). Furthermore,
when individuals are more invested in their roles, they will go beyond typical
performance and reevaluate in-role behaviors for improvement, thus, leading to
optimal performance (Brown, 1996). Focusing on behaviors that are classified as
above expectations, innovative and proactive in making contributions to the
workplace are of interest when investigating behavioral engagement, assuming
employees have the necessary knowledge and skill sets (Macey & Schneider,
2008).
Trait engagement can be understood as the orientation one has towards
various experiences and encounters. Several existing traits are combined in trait
Page 20
10
engagement. These constructs include motivation orientations, positive
affectivity, and personality traits of being conscientious and proactive (Crant,
2000; Roberts, Chernyshenko, Stark, & Goldberg, 2005). For example, one may
have a predisposition that usually offers a positive or negative affectivity towards
day to day activities. These internal traits are then displayed through
psychological states and can provide an explanation as to why some employees
are more likely to be engaged than others. In general, trait engagement has a
distal impact on behavioral engagement whereas state engagement has more
proximal causes on behavioral engagement (Kanfer, 1990). Trait engagement is
more likely to interact with situational factors, such as leadership styles and job
characteristics, which ultimately influence state and behavioral engagement
depending if the situational factors are experienced as being positive or negative.
To summarize the employee engagement literature, a new approach to
understanding constructs that have been studied for several years are now
combined into an overarching framework with employee engagement that offers a
fresh perspective on how workers interact with their jobs and job environments.
When evaluating the aforementioned variables, it is highly plausible to conclude
that a similar framework would fit the ways in which customers interact with an
organization as well. For instance, customer satisfaction and commitment would
be just as relevant to engagement as would these variables from an employee’s
perspective. Before customer engagement is discussed, the fundamentals of
consumer behavior research are reviewed.
Page 21
11
Consumer Behavior
As the marketplace continues to grow domestically and abroad with
increased competition, understanding consumer behavior becomes even more
critical. A larger breadth of product offerings and options allows for more
opportunities for customers to switch to a competitor. Furthermore, in times of
economic uncertainty, businesses are even more susceptible to customer churn as
low prices are of greater demand. There is some evidence that shows that US
corporations lose approximately fifty percent of their customers in five years
(Ganesh, Arnold, & Reynolds, 2000). Businesses continue to be surprised when a
top customer is lost to a competitor when they expected to receive the order.
The consumer behavior process is viewed as having three phases: pre-
purchase, purchase, and post-purchase or post-consumption (Kim, Ferrin, & Rao,
2009). After this cycle, a repurchase phase is possible if the customer returns to a
supplier for repeat business. The consumer purchase process is similar for both
online and offline retailing avenues. Understanding these three phases helps
conceptualize how attitudes are formed and impact phases differently. For
example, trust plays a larger role in formulating intentions and making an initial
purchase decision than in post-consumption. Developing attitudes and beliefs
occur in the pre and post purchase stages where expectations are confirmed or
violated , thus allowing for attitudes to be realigned if necessary for future
purchases. The major distinction between pre and post purchase stages is that in
the post-purchase stage the consumer has a substantial and direct previous
experience to draw conclusions from (Kim et al., 2009). The post-purchase
Page 22
12
evaluation process allows for confirmation of pre-purchase standards on several
attributes including performance of product, satisfaction with transaction and
consumption. In the purchase phase, it is important to evaluate the conversion
from behavioral intention to an actual transaction decision since intentions are a
predictor for behaviors (Kim et al., 2009; Ranganathan & Ganapathy, 2002).
Customer retention is typically studied from a sales or technology use
perspective; however, the contributing factors behind how customers are retained
are mostly overlooked (Carter, 2008). As noted in various research studies, the
majority of sales are generated from existing customers and less from customers
that are first time or new buyers (Oliver, 1999). New customers are more likely
to examine and take action on competitor offerings than repeat or loyal customers
that have established a relationship with a business. In the purchasing process,
relationships transition from being transactional to transformational in nature
when relational bonds are developed with business personnel. When a stronger
relationship is developed between a customer and business, the customer is more
likely to expand the types and amount of products purchased in future purchases
instead of seeking out other offers from competing businesses. Some businesses
attempt to proactively shift the relationship by providing customer relationship
building, facilitating meetings between top customers and senior executives,
improving lines of communication, and creating value for customers that could
act as a buffer to possible defects in future transactions (Carter, 2008). In the long
term, acquiring customers is more costly to a business than retaining them due to
direct costs such as selling costs, commissions, and costs of unsuccessful
Page 23
13
prospecting (Bai, Hu, & Jang, 2006; Buttle, 1996). Therefore, understanding the
reasons why customers continue or discontinue transacting with a business is
fundamentally important for future growth or expansion initiatives.
Customer Service Behavior
A customer can be defined as an individual or organization that makes a
purchasing decision (Scullin, Fjermestad, & Romano, 2004). As organizations
are continually searching for ways to stay competitive and grow market share,
developing and retaining a strong customer base is imperative. When studying
customer engagement, one has to identify contributing factors that can foster or
inhibit customers from being engaged. Factors such as price, product availability,
store locations, and website search and select capabilities also impact the
customer experience and the likelihood of a customer to purchase or repurchase
from the provider. Also, the service provider is one of these factors as it drives
quality of service customers receive. To a great extent, service providers impact
customer experience by providing assistance, product recommendations,
completing special orders, and service to rectifying product defects or service
failures. It is important to continually improve service since poor service quality
is the key reason why customers switch to competitors (Weitzel, Schwarzkopf, &
Peach; 1989; Zemke & Schaaf, 1989).
A key element in improving customer service is by fostering an
organizational service climate. When an organization demonstrates a concern for
customers, employees develop perceptions of work behaviors that promote quality
customer service. Human resource practices can develop service climate by
Page 24
14
training, motivating and rewarding employees for providing superior customer
service (Salanova, Agut, & Peiro, 2005; Schneider, White, & Paul, 1998).
Service climates will be stronger when employees perceive that their behaviors of
delivering quality service are rewarded and supported. Even support from clearly
defined job functions and characteristics can aid employees in finding task
identity, task significance, skill variety, and autonomy in their job when
interacting with customers. Research has indicated that the conditions of work
largely contribute to work outcomes such as productivity, satisfaction, and
retention as well as having direct effects on engagement (e.g., Oldham &
Hackman, 1981). Additionally, given the close interaction between employees
and customers, a reciprocal relationship may influence service climate (Schneider
et al., 1998). For example, an employee’s perception of service climate may be
influenced by the satisfaction of a customer. The same concern for customers and
employees must be shared among management and leadership in order for the
climate for service to sustain (Schneider, Ehrhart, Mayer, Saltz, & Niles-Jolly,
2005). When employees interact with customers based on their perceptions of
service climate, customers will perceive the quality of service which will increase
their chances of being retained as a future customer (e.g., Luo & Homburg, 2007).
In addition, customer loyalty and satisfaction as well as firm performance will
increase (e.g., Schneider et al., 1998, 2005). In context with engagement,
employees who are satisfied, committed, and engaged at work will embrace a
service climate in order to help an employer succeed. When the linkages between
employee behaviors and quality of service are made clear, engaged employees
Page 25
15
will put forth extra effort in their service interactions with customers. In this
regard, employees demonstrate customer-focused organizational citizenship
behaviors which mediate the relationship between a service climate and customer
satisfaction (Schneider et al., 2005). In turn, service climate along with customer
satisfaction and loyalty could facilitate customer engagement.
When employees interact with customers, it is central that the customer’s
needs are met or exceeded. Customer-facing employees, employees that interact
face to face with customers daily, have it in their self-interest to be motivated to
produce a superior customer experience such that the customer returns in the
future. Customer service orientation was operationalized through job analysis and
identified to involve four key pieces including active, polite, helpful, and
personalized customer relations (Fogli & Whitney, 1998). With these constructs
in mind, positive customer interactions would be described as being friendly,
reliable, responsive, and courteous. Also, it is thought that customer interaction is
more important than customer satisfaction in business-to-business (B2B) markets
because the quality of the interaction can have a greater influence on retaining
customers than satisfaction with areas of the purchasing cycle such as delivery
fulfillment (Grunholdt, Martensen, & Kristensen, 2000). Interactions provide
businesses with opportunities to assess the value suppliers or other businesses can
provide by experiencing quality of product offerings and service provided. As
competition grows, businesses have to rely on other aspects of their business
model to attract and retain customers such as customer service. For example, if
the organization cannot always guarantee the lowest prices, other offerings need
Page 26
16
to substitute for this negative attribute such as superior customer service or
solutions offerings (e.g., electronic data interchange-EDI, workflow
management). Thus, employees interacting with customers need to consider these
dimensions along with a high degree of responsiveness and reliability in order to
foster a desirable customer relationship.
Furthermore, customers can have a relationship orientation with providers
or suppliers. A buyer’s relationship orientation depends on the goals of the
customers. For instance, customers seeking a long term relationship will value
factors such as satisfaction, corporate image, product quality, and service quality
as they anticipate repeated interactions with a provider (Lee & Bellman, 2008).
On the other hand, if a customer is concerned with a quick purchasing decision or
a single transaction event, attributes of product quality are most important. Also,
when the long-term relationship is valued, businesses can capitalize on higher
price tolerance and cross-selling opportunities (Reichheld & Sasser, 1990).
Businesses can take advantage of cross-selling opportunities when required or
optional accessories are available for a base product or if other products that are
often purchased together are offered to the customer. The importance of these
factors mentioned above could be realized through the application of the customer
engagement framework. Understanding this orientation has several impacts for a
business such as tailored marketing campaigns with customer intelligence gained
through customer engagement measurements.
Page 27
17
Customer Engagement
Engagement has the opportunity to occur when an individual needs to
develop a relationship with another business when operational dependencies exist.
This situation is especially prevalent with B2B operations when individuals need
to be in frequent contact with other businesses to ensure that their own business
operates smoothly on a daily basis. When this is the case, individuals are charged
with the responsibility of identifying and transacting with the best businesses as
well as leveraging their technical expertise. It is the suppliers or distributors to
these businesses that need to identify how to attract, retain, and engage customers
to maintain sustainability. The suppliers or distributors are businesses that
provide other businesses with the products and services needed to ensure faultless
operation. For example, a distributor will provide products to a factory when a
conveyer belt breaks that halts production of products. These service providers
influence customer engagement through quality of service and products, meeting
needs and expectations of customers, and by facilitating a personal relationship.
When the aforementioned obligations are met or exceeded, customers will
reciprocate by investing effort to help the service provider succeed by making
repeat purchases, declining competitor offers, and referring others to the business.
These interactions clearly illustrate the applicability of engagement in additional
domains. Therefore, the purpose of this study is to examine the customer
engagement relationship in a B2B context.
There is an ever growing need to understand engagement from a customer
perspective and as a result academic research on this concept is on the rise.
Page 28
18
However, as with employee engagement, there has been no consensus on a model
for customer engagement. Also, the term engagement has been applied to
measurement of satisfaction, loyalty, and commitment along with several other
attitudes or to describe generic behaviors (e.g., repeated transactions). For
example, Sprott, Czeller, and Spangenberg (2009) limited their scope of
measurement to absorption in a brand relationship. Recently, there was a special
issue of the Journal of Service Research that discussed the concept of customer
engagement. Some authors debated that engagement is sets of behaviors that are
beyond transactions where others indicated that transactions are the foundational
element (e.g., Kumar, Aksoy, Donkers, Venkatesan, Wiesel & Tillmanns, 2010;
Van Doorn, Lemon, Mittal, Nass, Pick, Pirner, & Verhoef, 2010; Verhoef,
Reinartz, & Krafft, 2010). Clear definitions for what these engagement behaviors
are do not exist, rather there are proposed metrics to measure engagement. For
instance, Kumar et al., (2010) identified four customer engagement metrics which
include customer lifetime value, customer referral behavior, customer influencer
value (i.e., word of mouth activity), and customer knowledge value. Even though
this framework is in its infancy, the propositions proposed lack specificity and
uniqueness from other constructs. On the positive side, van Doorn et al., (2010)
did acknowledge antecedents of engagement including commitment, satisfaction,
trust, and brand image which are also found to be important constructs with
employee engagement. Additionally, Hollebeek (2011a, 2011b) has proposed a
conceptual model for customer brand engagement based on qualitative interviews
and focus groups. There are no indications that the proposed model has been
Page 29
19
empirically tested to date. Hollebeek (2011a) identified key themes of
engagement to be immersion, passion, and activation which aligns with the
Utrecht Work Engagement Scale (Schaufeli et al., 2002) utilized in the current
study.
As previously mentioned, in the customer research literature there is not a
clear understanding of what engagement really means. Therefore, a previously
tested measure of employee work engagement will be adapted to attempt to
measure customer engagement. Through this adaptation, the measurement of how
customers engage to make a service provider succeed will be of main focus,
instead of how employees engage to make their place of work succeed. Along
with the main measurement of customer engagement, antecedent variables will
also be tested in a broader framework. For the main measurement of customer
engagement, the Utrecht Work Engagement Scale (UWES-9) will be utilized with
revision (Schaufeli et al., 2002). The scale is comprised of three engagement
components which are vigor, dedication, and absorption. Vigor is defined as
demonstrating high levels of energy, resilience, and persistence when faced with
difficulties as well as investing effort (Schaufeli et al., 2002). Dedication is
defined as having a sense of enthusiasm, pride, inspiration, significance, and
challenge (Schaufeli et al., 2002). Lastly, absorption refers to being deeply
engrossed in work and is further defined as being characterized by time passing
rapidly and having difficulties detaching one’s self from work (Schaufeli et al.,
2002). This conceptualization of engagement provides a unique perspective and
does not attempt to reorganize previously defined constructs under new titles.
Page 30
20
Furthermore, the UWES-9 has been previously tested and found to have stable
indicators of reliability across various studies (Schaufeli et al., 2002). With the
use of this scale as the measure of engagement, antecedents and outcomes of
engagement will be evaluated as well as discussed in the following sections.
Process of Customer Engagement
A common theme across engagement definitions has to do with the notion
of repeated interactions, thus implying that customers go through a process
leading to different levels of engagement. The process of engagement is
important to recognize as it describes the depth of the relationship that a customer
can develop (Bowden, 2009a). In the marketing literature, understanding the role
of consumer-brand relationships assists with identifying important concepts that
are unique to the study of engagement (Hardaker, Simon, & Fill, 2005). To
explain the quality of relationship, the role of commitment, trust, involvement,
and satisfaction are considered, along with other attitudinal variables.
Within this framework the difference between new versus repeat
customers is called upon. Specifically, new customers will have different
expectations, knowledge structures, and attribute-level information when
transacting with a business for the first time (Mittal, Katrichis, & Kumar, 2001;
Patterson, 2000; Soderlund, 2002). Furthermore, new customers are more likely
to weight external attributes more than internal cues when evaluating a service-
brand relationship (Patterson, 2000).
The preferred medium for searching and purchasing behaviors may
depend on prior order history or familiarity with a product, service, or brand. If a
Page 31
21
customer is making a repeat purchase of a product, he or she is more familiar with
the qualities of the product and has established an expectation for what should be
received. In this situation, new versus repeat customers have differences in
information-processing patterns due to lesser or greater levels of experience
(Bowden, 2009a). Information processing patterns are different due to the context
of customer experience, customer familiarity, customer expertise, and cognitive
knowledge structures (Alba & Hutchinson, 1987; Bowden, 2009b; Johnson &
Mathews, 1997; Matilla & Wirtz, 2002; Soderlund, 2002). Repeat customers
have established stable criteria to evaluate consumption situations and rely on
heuristics or mental short cuts that assist in problem-solving or decision-making
that was developed through prior experiences (Huber, Beckman, and Hermann,
2004). Once knowledge structures have been established by repeat customers,
attitudes begin to be formed especially in regards to commitment and trust
towards a particular brand or business. In the context of the current study,
however, customers with repeated interactions will be of primary focus.
Antecedents of Customer Engagement
There are several attitudinal variables that are researched under
engagement. These variables will be explored as antecedents of customer
engagement in the current study. In the next pages, the concepts behind these
variables will be discussed from a customer engagement standpoint while
providing supporting literature from the employee engagement domain.
Page 32
22
Customer Commitment
More attention is being directed towards researching commitment and the
implications that it has for studying engagement. Organizational commitment can
be defined as the degree to which an individual identifies with his or her
organization (Buchanan, 1974; Meyer & Allen, 1991; Mowday & Steers, 1979).
In the customer context, the definition of commitment is applied to understand the
degree to which customers have a psychological attachment with a business in
which they transact. Even though previous research has identified commitment as
being a unidimensional construct (e.g., Blau, 1985), additional research has
identified three distinct themes present in commitment (Allen & Meyer, 1990;
Meyer & Allen, 1991). Specifically, they were identified in Meyer and Allen’s
Three Component Model of Commitment (1991), which includes affective,
continuance, and normative commitment. Affective commitment refers to the
affective attachment one has to an organization, in which individuals stay with an
organization because they want to. Continuance commitment was identified as
the perceived cost of leaving the organization, in which individuals remain at or
transacting with an organization because they need to. Normative commitment
refers to the perceived obligation to remain with the organization, in which
individuals stay with the organization because they feel that they ought to.
Customers experience similar types of commitment that employees of an
organization experience (e.g., Amine, 1998; Tsiros & Mittal, 2009). Customers
are capable of forming an attachment to a brand or provider resembling affective
commitment. Affective commitment has been defined as an emotional feeling
Page 33
23
that exhibits the psychological closeness a customer has with a brand or business
(Amine, 1998). Research has identified several outcomes of consumer affective
commitment including a greater desire to repeat purchase and remain with the
brand, invest in the brand, and have a greater propensity to spread positive word
of mouth recommendations (Harrison-Walker, 2001; Wetzels, De Ruyter, & Van
Birgelen, 1998). Additionally, outcomes associated with high commitment
include demonstrations of prosocial behaviors and less withdrawal when
commitment is conceptualized as feelings of positive attachment measured by a
willingness to exert effort for, have pride in, and identify personally with an
organization (Meyer & Allen, 2002; Mowday, Porter,& Steers, 1982; Macey &
Schneider, 2008).
It is argued that customers are able to make relationship-based evaluations
that are superior to evaluations of tangible attributes of a product or service
(Bowden & Corkindale, 2005; Pullman & Gross, 2003). Feelings of attachment
and emotional connectivity have a greater influence on the formation of customer
preference. Furthermore, under service failure conditions, subsequent negative
attitudes or behaviors are mitigated based on the psychological closeness formed
through affective commitment (Mattila, 2004). In this instance, customers are
more likely to consult their prior affective experiences instead of cognitive beliefs
when deciding future behaviors or interactions with the brand or business.
Additionally, affective commitment is viewed as having a stronger driving force
for loyalty than other factors such as satisfaction, price, corporate image, and
Page 34
24
continuance commitment (Johnson, Gustafsson, Andreassen, Lervik, & Cha,
2001).
When customers embark on a business relationship, customers
instrumentally evaluate the likelihood of a poor decision and the subsequent
outcomes of this decision (Amine, 1998; Bowden, 2009a). Correspondingly,
customers often rely on an attribute based analysis when choosing a product or
brand for repeat consumption. Usually, these customers are motivated to limit
negative information to the target attribute while over-emphasizing other positive
attributes (Ahluwalia, Unnava, & Burnkrant, 1999). Bias in information-
processing can influence customers to continue their business relationship based
on feelings of need and reciprocal obligation, similar to normative and
continuance commitment. Commitment plays an important role in curtailing the
search for and actions towards other alternatives or competitors (Tsiros & Mittal,
2009). Specifically, repeat customers of a business have developed an expectancy
framework for service and product quality that they would not want to sacrifice if
they switched providers. Therefore, customers develop similar affective,
reciprocal, and continuance attitudes as employees would under the commitment
constructs.
From a practical standpoint, organizations seek to understand how
commitment and engagement produce value. As a result, customer lifetime value
calculations are used to understand the net present value of future profits from a
customer (Peppers & Rogers, 2004). However, these values are based on
purchasing behaviors only, thus failing to examine commitment or engagement as
Page 35
25
a whole. Furthermore, organizations, especially B2B firms, are noted for
implementing loyalty programs that produce less than desirable results because
they are based on discounts with a purchasing focused initiative (Lacey &
Morgan, 2009). These programs are geared to enhance the relationships with
customers by offering discounts and promotional opportunities. Although
customers view these offers as beneficial, a transformational relationship
component is lacking that would block other competitors from enticing less
committed customers. This described relationship is an application of the
relationship marketing theory which incorporates the creation, development, and
maintenance of long term relationships between a firm and its customers (Morgan
& Hunt, 1994). Without the fostering of relational continuity, customers are less
committed. This notion is similar to a customer’s relationship orientation as well.
A customer that purchases generic products that are offered universally across
vendors is more likely to prefer the short term transactional relationship versus the
customer who prefers to partner with the business to fulfill unique product needs
(Lee & Bellman, 2008). In this case, more committed customers are willing to
sacrifice price to reduce the risk of supply failure.
Customer Satisfaction
At the center of marketing theory, two concepts are of main interest,
customer satisfaction and service quality, which are thought to lead to positive
outcomes such as customer loyalty, intent to purchase, word of mouth
recommendations, profit, market share, and return on investment (Allen &
Willburn, 2002; Mittal & Kamakura, 2001; Sureschandar, Rajendran, &
Page 36
26
Anantharaman, 2002). Customer satisfaction can be understood as the
comparison of service and product quality expectations before and after purchase
(Oliver, 1999). Another definition for customer satisfaction is the output resulting
from a customer’s subjective judgment of observed performance (Oliver, 1999;
Oliver, Rust, & Varki, 1997).
Satisfaction has been found to be comprised of two components: affective
and cognitive satisfaction (Fisher, 2000; Schleicher et al., 2004; Weiss, 2002).
The affective component of satisfaction refers to the positive or negative feelings
that one has towards an identified target, whereas cognitive components of
satisfaction refer to the beliefs or thoughts one has towards the target. Positive
affectivity has been defined using descriptors such as alert, enthusiastic, proud,
determined, and strong (Watson, Clark, & Tellegen, 1988; Wellins & Concelman,
2005). The inclusion of positive affectivity is incorporated into the measurement
proposed by Schaufeli et al. (2002) with the dedication construct, which will be
measured in the current study as well. Satisfaction can be impacted by several
factors, including organizational culture, management, characteristics of the
individual’s job, and quality of service.
Customer satisfaction has been investigated since 1970 with over seventy
research studies (e.g., Geyskens, Steenkamp, & Kumar, 1999; Lee & Bellman,
2008; Schenider & Bowen, 1985; Schneider et al., 1998, 2005). Within this
research, particular focus has been dedicated to understanding satisfaction as a
key driver of repeat business. When customers have numerous satisfied
experiences, they would be more likely to be engaged as they develop a longer
Page 37
27
term relationship with the provider. Developing a customer base that is stable,
profitable, and requires less cost to service is the ultimate goal for organizations.
Similarly, satisfaction is heavily researched in the employee domain. Many
researchers have noted its important role within an organization in terms of the
satisfaction-job performance relationship (r=.30) (e.g., Iaffaldano & Muchinsky,
1985; Judge, et al., 2001; Spector 1997).
At the forefront of building a new customer-brand relationship is to create
a sense of reciprocity by providing non-standardized service interactions that are
above expectations that delight the customer (Price, Arnould, & Tierney, 1995).
As a result, customers place extra value on the service relationship and have
greater retention and intentions to make a repeat purchase in the future along with
acting as a vehicle for acquisitions of new customers based on word of mouth
referrals.
However, with marketing research, there is a growing trend that indicates
the reliance on solely measuring customer satisfaction fails to account for other
influences on behaviors. With this sole measurement, it fails to distinguish
among loyalty, repeat purchase intentions, and the depth of customers’ emotional
responses to consumption situations (Anderson & Mittal, 2000; Amine, 1998;
Giese & Cote, 2000). Furthermore, once an organization’s performance level has
reached a standard which is deemed acceptable with customers, satisfaction alone
can no longer predict future interactions or repeat purchases (Lee & Bellman,
2008). As such, Bowden (2009a) proposed a conceptual framework to remedy
Page 38
28
this problem by focusing customer-brand relationship transformation through
increased experiences.
Customer Involvement
Customers have certain preferences when they are partaking in a
purchasing process. For instance, when gathering product information or making
a purchasing decision, customers may have certain preferences for using online or
offline mediums. Equally, customers will have different degrees of involvement
ranging from wanting a seller to recommend a product to gathering information
themselves to make an informed purchasing decision. Customers would have low
involvement when they are not actively gathering product information to make a
purchasing decision and instead would rely on the input of a seller for
information. Customer involvement differs from employee involvement as
customer involvement focuses on the degree of effort the customer takes
responsibility for in a purchasing process. As a result, understanding the role of
customer involvement in the engagement model is important.
In the consumer behavior literature, involvement is comprised of two key
components, motivation and relevancy. Involvement is defined as goal-directed
motivation towards a decision that is viewed as being personally relevant to the
customer (Mittal & Lee, 1989). From the employee perspective, involvement has
been defined as the degree to which one relates to his or her job and the
subsequent work performed (Cooper-Hakim & Viswesvaran, 2005). The day to
day tasks that individuals complete are central to their work roles. When
customers are motivated, they feel a sense of commitment and self worth when
Page 39
29
able to attain a goal which may include selecting the right product or service
provider. Empowerment plays a central role with thoughts on self-efficacy along
with feelings of authority and responsibility (Mathieu, Gilson, & Ruddy, 2006).
In the perspective of the customer, empowerment translates into the customer’s
perceived ability, or self-efficacy, to locate product information and make a
purchasing decision as well as the controllability or availability of resources and
opportunities (Ajzen, 2002; Bandera, 1986). Outcomes of empowerment include
effort, persistence, and initiative (Spreitzer, 1995). Research has indicated that
involvement is an antecedent of commitment (Brown, 1996). When employees
are involved, they are more likely to put forth extra effort and display positive
behaviors. The behavior of putting forth extra effort is relevant to the concept of
organizational citizenship behaviors (OCB). The dimensionality of OCB includes
showing support for others, support for the organization, and being conscientious
which is applicable when both employees and customers demonstrate these
behaviors (Borman, 2004; LePine, Erez, & Johnson, 2002). Additionally, OCB is
thought to be a part of contextual performance which can facilitate a more helpful
and supportive environment (LePine et al., 2002). When considering OCB as an
outcome of engagement, these are behaviors demonstrated that are beyond typical
or what would be expected in a given situation or frame of reference (Macey &
Schneider, 2008).
During the pre-consumption process, customers can be involved to
different extents depending on the product information available. Customers will
be more involved when they are searching for more quantitative and qualitative
Page 40
30
product information (Scullin et al., 2004). In this case the customer is choosing to
actively seek out and evaluate additional attributes to make a purchasing decision.
Therefore, the decision-making process is prolonged based on information
gathering and preference evaluation. Lower involvement decisions tend to occur
during impulse buying decisions or when an ample amount of information is
provided, alternatives are readily available, low risk or cost is perceived, and
when past purchases lead to a clear favorite for future purchases (Scullin et al.,
2004; Stanton, Miller, & Layton, 1994). The extent to which a customer is
involved can impact levels of commitment or developing an emotional attachment
to a business that might impact subsequent behaviors such as being more
responsive to marketing efforts. Therefore, customers are more willing to engage
themselves with other efforts and opportunities that a business might offer.
Similarly, this same concept has been referred to as the “stickiness” that
involvement creates in a customer-brand relationship, which also facilitates
increased loyalty over the long term (Oliva, Oliver, & Bearden, 1995). Other
findings with customer involvement include a greater likelihood of discounting
conflicting informational messages in order to preserve existing cognitive
schemas (Roser, 1990) and greater level of other brand rejection (Belonax &
Javalgi, 1989).
Involvement has been seen as the catalyst for commitment as well as
satisfaction. It is reasoned that satisfaction alone cannot drive engagement.
Without involvement, a customer is less likely to be committed to a brand or
service provider regardless if a customer is satisfied with certain attributes of their
Page 41
31
merchandise. If a customer is satisfied, but uncommitted, he or she is more likely
to switch brands or service providers on a regular basis because the business is
seen as unimportant in the decision-making process (Hofmeyr & Rice, 2000).
Customer Trust
Trust is another construct to incorporate in the study of customer
engagement. Trust is developed through a customer’s experience and the
assumption that the provider is able to respond to the customer’s needs with a
consistent level of quality (Delgado-Ballester & Munuera-Aleman, 2001).
Additionally, trust is defined as a subjective belief that a business or entity will
fulfill transactional obligations as the consumer understands them (Kim, Ferrin, &
Rao, 2009). That is, trust is a customer’s belief that a firm is reliable, sincere, and
will stand by its word. Trust can be placed in multiple targets such as in a channel
(e.g., online, salesperson in store location), product information, the purchasing
process, or company (Pavlou & Fygenson, 2006; Plank, Reid, & Pullins, 1999).
The development of trust acts as a catalyst for the transformation of a
cognitive to affective customer-brand relationship (Hess & Story, 2005). A new
customer will primarily rely on cognitive processes to understand the utility of the
purchase decision, thus weighing the costs and benefits of choosing a certain
provider to transact with. A repeat customer with a more stable set of knowledge
structures for the expected interactions will rely more on emotional or affective
connections and identification with a provider. Additionally, customers that
develop a higher level of trust will demonstrate not only their in-role job functions
but extra-role behaviors as well (Kahn, 1990; McGregor, 1960). Over time, it is
Page 42
32
assumed with trust that whatever personal investment is put in by the customer
will be reciprocated by the service provider. Through this norm of reciprocity,
customers have intrinsic and/or extrinsic motivation acting as a driving force to
carry out behaviors defined as being engaged. When a customer demonstrates
contextual performance by frequenting the establishment more often, providing
positive word-of-mouth referrals, or increasing spend, the customer trusts that the
organization will reward their time and investment (Coyle-Shapiro & Conway,
2005). In the employee context, when additional job tasks are performed that
exceed usual actions, role expansion is said to occur. These extra tasks are
motivated by the norm of reciprocity such that employees perform additional job
tasks in return for being treated well (Coyle-Shapiro, Kessler, & Purcell, 2004).
With role expansion, engaged employees are performing additional actions that
help the organization succeed. Understanding this process makes it clear that
trust is a necessary component to facilitate engagement.
The role of trust is even more important in e-commerce because
consumers must have confidence in transaction processes that are not transparent
online with the Internet. Trust has been identified as a vital factor for the success
of e-commerce (Gefen, 2000; Kim, et. al, 2009). Trust is easier to develop in
offline channels such as physical store locations where face to face interactions
will facilitate personal relationships. The theory of reasoned action model (TRA)
(Fishbein & Ajzen, 1975, Ajzen & Fishbein, 1980) discusses the assumption that
humans make rational decisions based on available information and that the best
determinate of a behavior is the intention or cognitive readiness to perform a
Page 43
33
behavior. A web based trust model was proposed by McKnight & Choudhury, &
Kacmar (2002) that explained the role that trust has in the TRA model. This
model suggests that trusting beliefs about online vendor attributes leads to trusting
intentions, which subsequently leads to trust-related behaviors. Likewise, the
expectation-confirmation theory (ECT) indicates that consumers who built up
trusting intentions with perceptions of positive utility during the pre-purchase
phase, will develop loyalty or intentions for repeat business when the transaction
was satisfactory and expectations were confirmed during post-purchase
consumption.(Kim et. al., 2009).
Brand Image
Brand image is another important construct to incorporate when studying
customer engagement. During the pre-consumption phase, consumers rely upon
various sources of information to determine whether or not they will enter into a
transactional situation. For a repeat customer, information can be gathered from
prior consumption experiences with a particular business; however, for new
customers, they must rely on non-experiential information. New customers may
turn to information available through advertisements and word of mouth
recommendations to formulate expectations for process, product, and service
quality (Kim et. al., 2009). Regardless of the type of customer, image is used as a
screening tool when considering multiple vendors for a purchase. Relationships
with corporate image or credibility have been found with satisfaction, loyalty and
purchasing intentions (Martensen, Gronholdt, & Kristensen, 2000). These
Page 44
34
expectations will then be subsequently used as criteria to evaluate post-
consumption experience.
Customer Engagement Outcome Variables
This next section will discuss the hypothesized outcome variables of
customer engagement as outlined in the measurement framework. Outcome
variables of loyalty and word of mouth referral, share of wallet, website
behaviors, transactions, and retention will be reviewed.
Loyalty & Word of Mouth Referral
After a customer transacts with a business, they form an opinion on their
overall experience. These attitudes or feelings can encompass satisfaction ratings
on various elements of the purchasing process or their evaluations for future
behavioral intentions. Behavioral intentions are motivational by nature as they
describe the willingness of customers to perform some described behavior (Ajzen,
1991). The average correlation between behavioral intentions and actual
behaviors has been reported to be .53 based on an earlier meta-analysis
(Sheppard, Hartwick, & Warshaw, 1988). The notion of behavioral intentions fits
within the overarching framework of the theory of reasoned action which
describes the linkages of attitudes driving intentions and then subsequent
behaviors (Ajzen & Fishbein, 1980). Behavioral intent can manifest in many
constructs such as future purchasing intent and the intent to recommend the
business to others. These two aspects are investigated as additional outcomes of
customer engagement in the current study.
Page 45
35
Share of Wallet
An outcome variable of interest is share of wallet since it has been
identified as a key measure of customer relationship management. Organizations
are intrigued to better understand the volume of business a customer conducts
with them versus other vendors or competitors. Size of wallet is defined as the
volume of sales a customer or organization spends on selected product categories
or total business volume (Glady & Croux, 2009). An example for when select
product categories would be of interest would be if the organization only sells
cleaning supplies. Then the organization interested in knowing the size of wallet
might only care about cleaning size of wallet if that is the only market share they
are focused on increasing. Once the size of wallet is determined, share of wallet
can be obtained by taking the percentage of business completed with the company
compared to the size of wallet. Share of wallet then is defined as the proportion
of sales transacted with the focal organization. Based on the remaining difference
percent, the potential wallet is also identified which is the potential growth in
business. The difficult part with this calculation is that both metrics are usually
unobservable. As a result, organizations usually develop predictive models with
transaction and business information data such as size, locations, and frequency of
purchases (Glady & Croux, 2009). Share of wallet is thought to provide guidance
on customer loyalty, direction for retention efforts, and identification of high
growth potential customers (Gupta & Zeithaml, 2006; Zeithaml, 2000).
Page 46
36
Website Behaviors
Additional outcome variables that will be studied in the current research
will incorporate clickstream behaviors as well as online sales and order
transactions. Clickstream data records what website links are being clicked on
and the time and frequency behind this behavior. This type of data is valuable
because it will provide information on what portions or functionality of the site
customers are engaging with, number of page views per session, and duration of
visit (Sawhney, Verona, & Prandelli, 2005). Today, clickstream data is a primary
focus in the e-commerce platform for understanding ways in which customers
interact with a website.
Transactions
Information on sales and order transactions will be used to further explore
purchasing behaviors. A deeper analysis will also examine product category
saturation which will produce understanding as to the number of different product
categories a customer purchases from a single provider (Gefen & Straub, 2000).
Retention
As part of consumer behavior literature, a customer lifecycle is important
to understand. As part of the current research, customer retention rates will be
examined as another outcome variable of customer engagement (Bowden, 2009a;
Schneider et al., 1998, 2005). Typically, retention is defined by the behavioral
intention to return to an establishment or intentions to recommend the
organization to others (Swan & Oliver, 1989; Zeithaml, Berry, & Parasurman,
1996). Despite this typical practice, there is a need to examine the actual
Page 47
37
behaviors of retention beyond intentions. One avenue for this research would be
to measure visits, transactions, or sales as the behavior of retention. For instance,
retention will be evaluated across time periods to determine whether a customer
remained active with sales transactions. An example retention measurement
would evaluate the number of customers that purchased thirteen to twenty months
prior and whether or not these customers also made a purchase in the last twelve
months.
The aforementioned variables will be investigated as consequences of
customer engagement. As noted in this literature review, customers that are
identified as having higher levels of engagement than other customers will display
different behaviors. Engaged customers would be expected to have greater
transactions and share of wallet with an organization once a relationship is
established, especially a relationship with a transformational component.
Additionally, engaged customers would more than likely demonstrate different
behaviors on a website. If customers are more dedicated and absorbed, they will
make multiple attempts to find products or services needed rather than
abandoning a challenging task. Also, engaged customers may utilize more areas
of a website as they invest time into learning about a business and their solutions
offerings. All of these variables serve as indicators that customers are investing
themselves and putting forth effort with a particular business.
E-Commerce
The introduction of the internet has transformed the way in which
organizations approach marketing to customers. With the introduction of online
Page 48
38
retailing or e-tailing, consumers are relying on the internet as the medium for
transacting with businesses for products or services. Revenue generated from the
e-commerce platform continues to grow along with continued research
publications on this topic (Wareham, Zheng, & Straub, 2005). E-Commerce in
this sense relies on information technology and e-marketing acceptance on the
part of customers. Two primary consumer behaviors online are searching, or
gathering product information, and purchasing products (Gefen & Straub, 2000).
These two actions could be viewed as part of customer engagement. First the
search process involves making at least one or several attempts to find a needed
item. This process involves a degree of dedication or certain level of effort when
the customer has to either make multiple attempts to find the desired product or
must sift through results pages ranging from one to thousands of products to
choose from. Customers then spend additional time and resources to identify
specifications and alternatives or accessories for their product choice all in order
to make a well informed decision. Consumers have a time and cost savings
advantage when shopping online in addition to convenience, wide product
selections, and the ease of obtaining product detail information (Kim et. al.,
2009). Additionally, consumers turn to the internet to view product reviews to
help with their decision-making process and are able to consult competing
vendors for the superior sales offering. Compared to physical store locations,
customers can view product information regardless if a product is in stock. Being
able to view and compare several products to weigh risks and benefits prior to
Page 49
39
purchase through online retailing allows customers to place more trust and
confidence in their decision-making process.
Businesses can take advantage of e-tailing by incorporating features that
promote engagement. The internet is a platform for engagement since it offers the
capabilities of interactivity, enhanced reach, persistence, speed, and flexibility
(Sawhney et al., 2005). With the creation of online customer communities or
virtual environments, businesses can learn about customers’ needs and receive
feedback on product and service quality. Furthermore, organizations are using
these environments to facilitate on-going dialogue for product innovation
(Sawhney et al., 2005). In essence, a social environment is created among
individuals with shared interests that facilitate an avenue for customer knowledge
to be tapped. In this regard, customers are no longer viewed as passive recipients
of information and innovation, instead they are at the fore-front of the ideas being
generated and creating value for organizations.
Aforementioned was the notion of customer knowledge sharing. This is
especially relevant for business-to-business relationships. Business customer
communities (BCCs) have been formed for the purpose of a long-term knowledge
exchange relationship (Erat, Desouza, Schafer-Jugel, & Kurzawa, 2006). These
communities not only interact through online exchanges, but commonly arrange
offline discussions as well. Businesses are able to utilize these communities to
tap into lead users and involve customers in product development life-cycles.
With the introduction of such communities a shift in internet marketing
has moved from transactional marketing to facilitative marketing (Erat et al.,
Page 50
40
2006). In this new phase of e-commerce, the focus is directed towards knowledge
sharing between the business and the customers and amongst customers
themselves. This shift is prompting organizations to view transactions as working
with instead of working for the customers. With this approach problems are
defined and solved together, thus promoting customer engagement.
With these advantages, barriers to engagement exist as well. Customers
must be willing to share their personal information online in order to transact.
There is a great security concern with identity theft and fraud when shopping
online. Additionally, concerns arise over product uncertainty when a customer is
unable to physically hold and inspect a product (Ba & Pavlou, 2002). Needing to
purchase complex items such as powered machinery could lend a buyer to prefer
a store location as a medium for shopping since he or she could speak with a
representative to gain in-depth product information as well as inspect the product
from multiple angles at a close proximity. Also, not all individuals prefer the
medium of the internet if they are not technically savvy or do not have access to a
computer. These uncertainties create barriers for e-commerce adoption, however,
gaining trust from customers is an important buffer against these uncertainties.
Business-to-Business Relationships
When consulting customer behavior literature, there is a greater abundance
of research concerning business-to-consumer (B2C) than business-to-business
(B2B) relationships (Molinari, Abratt, & Dion, 2008). Therefore, it is important
to also explore contributing factors that foster in business-to-business (B2B)
relationships as well. For instance, understanding any differences between B2C
Page 51
41
and B2B customer relationships will determine if certain research models are
transferrable or need to be redefined.
Research on the B2B context has been underrepresented even though B2B
companies make up an important sector in many global economies. Prior
research has focused on distinguishing between offering goods vs. services,
predictors of repurchase and exploring limited attitudinal constructs. For
example, satisfaction, perceived quality, and value have been found to be
antecedents of positive financial outcomes, word-of-mouth recommendations, and
repeat purchase intent (Dubrovski, 2001; Ittner & Larcker, 1996).
One primary difference between these two contexts is the end user who is
consuming the products or services, that is an individual or business. For
businesses, product availability may be more critical than the lowest ticketed price
when machine repairs are needed to operate the business. Additionally, B2B
operations are unique such that the customer base is smaller and each customer
generates a greater proportion of sales (Anderson & Narus, 2004; Narus, 2005).
Supplier consolidation is another trend in the B2B environment where businesses
find value in saving time and money. When businesses transact with fewer
suppliers (i.e., other businesses) they typically receive lower pricing as an
incentive. Supplier consolidation will occur when a customer has had multiple
interactions with the target business and has gained trust and a sense of product
and service quality. These factors bring a heightened sense of urgency in B2B
environments. Typically, businesses that have longer tenured relationships with
customers are more profitable (Tsiros, Ross, & Mittal, 2009). Organizational
Page 52
42
avenues for customer outreach such as the internet, services provided, and
interactions with sales personnel plays a critical role in the development of
relationship commitment. Thus, focusing on strategic ways to retain inter-firm
relationships, such as through customer engagement, is important for growth and
profitability.
Rationale
There are many implications and applications for this research. With the
current study, employee engagement is taken a step further to understand business
outcomes that result from customer engagement. By gaining a deeper
understanding of customer engagement, implications from this study can help
influence measurement within organizations. Previously mentioned,
organizations tend to over rely on measures of satisfaction to assess consumption
responses (Anderson & Mittal, 2000; Amine, 1998; Giese & Cote, 2000). These
measures are over-simplistic when it comes to understanding the complex
relationships that customers form with a brand or an organization. It is
anticipated that with an expanded framework, the measurement of additional
constructs will provide greater research value.
Additionally, by understanding customer engagement, organizations can
gain a deeper insight into customer expectations, goals, attitudes, and behaviors.
The role of cognitive and affective processes is highlighted in this measurement
model by considering the drivers or predictors of customer engagement. With
this deeper understanding of customer engagement, managers are informed on the
importance of building relationships with customers instead of solely relying on
Page 53
43
satisfaction with tangible attributes of product or services sold. Also,
organizations can gain a sense of what they are doing right or wrong through the
customer’s perspective.
Therefore, practitioners are more aware of other factors that impact the
development of customer engagement and subsequent outcomes. With these
implications, assessments of customer engagement could occur within
organizations. Initial measurement could serve as a baseline for future
engagement measurements. With this undertaking, customers can be assigned an
engagement score that can be used for additional measurements as well as
targeting for marketing campaigns.
Statement of Hypotheses
With continuing research efforts, the construct of engagement will become
more defined conceptually as well as in other areas of interest such as with
customer engagement. In the current study, the Utrecht Work Engagement scale
(Schaufeli et. al., 2002) was adapted to a customer context instead of an employee
context for which it was originally developed. Due to the identified similarities
between research on employee and customer needs and psychological processes,
it is hypothesized that the three factor structure of the Utrecht Work Engagement
scale will apply in both contexts with the measurement of vigor, dedication, and
absorption. This factor structure incorporates all the positive constructs reviewed
in the state engagement literature including pride, enthusiasm, and affectivity
(e.g., Macey & Schneider, 2008; Wellins & Concelman, 2005).
Page 54
44
Hypothesis I: A three factor structure will result for measuring customer
engagement as found for employee engagement when adapting the Utrecht
Work Engagement scale.
Once the previous hypothesis is addressed, additional relationships are
explored for customer engagement. It is sought to identify a larger model that
incorporates traditional measures of attitudinal constructs such as satisfaction and
commitment. Furthermore, aspects that are found to be more crucial to the
consumer behavior purchasing cycle such as trust, brand image, and preference
and decision-making involvement will be studied in this model. Customer
satisfaction is important to incorporate as it provides information or subjective
judgment on experience, service, or product quality (Allen & Willburn, 2002; Lee
& Bellman, 2008). As with employees, customers are also capable of forming an
attachment to a brand or provider, therefore indicating commitment to be another
construct for evaluation in the model presented. Customers are subjected to
forming feelings of attachment and obligation that have been discussed in the
commitment literature (Johnson et. al., 2001; Tsiros & Mittal, 2009). Trust and
brand image both incorporate the notion that a provider or business will fulfill
their obligations to customers (Gefen, 2000). Customers are more likely to
transact with businesses that are viewed as being more reliable, sincere, fix
problems fast, and are viewed as a knowledge source of information (Kim et. al.,
2009). Preference and decision-making involvement are all constructs that are
viewed as being more important in the pre-purchase stage. Customers may prefer
to be involved with conducting business offline versus online which would impact
Page 55
45
which channels they would be more or less engaged with. Furthermore,
customers may be more or less involved in searching for information or making a
purchase decision depending on notions of self-efficacy and motivation.
Hypothesis II: There will be a significant relationship between customer
attitudinal variables and customer engagement.
Hypothesis IIa. Satisfaction will be positively related to
engagement.
Hypothesis IIb. Affective and normative commitment will be
positively related to engagement, whereas continuance
commitment will be negatively related to engagement.
Hypothesis IIc. Trust and brand image will be positively related to
engagement.
Hypothesis IId. Preference and decision-making involvement will
be positively related to engagement.
To understand the value of having an engaged customer base, behavioral based
outcome variables of sales, orders, average order value, visits and interactions on
the website are predicted. As defined by engagement, customers will have
repeated interactions with a business and in this particular study, the e-commerce
space of a business. If a customer is spending more time searching for
information, learning more about the organizations, and investing themselves
more towards a single provider, there should be an increased number of
transactions with that provider. Furthermore, through these repeated interactions,
Page 56
46
customers will be more likely to continue transacting over longer periods of time
increasing their tenure with a particular business.
Hypothesis III. There will be a significant relationship between
engagement and online behaviors and transactions.
Hypothesis IIIa. There will be a positive relationship between
engagement and the number of behavioral interactions with a
website including sessions, and depth of visit with number of page
views.
Hypothesis IIIb. There will be a positive relationship between
engagement and customer transactions including sales, orders,
and average order value.
Hypothesis IIIc. There will be a positive relationship between
engagement and share of wallet which is the percent of sales spent
with one business compared to all sales.
Hypothesis IIId. There will be a positive relationship between
engagement and customer retention.
Hypothesis IIIe. Customer loyalty defined by likelihood of repeat
purchase and customer referral of business to others will be
positively related to customer engagement.
To summarize the aforementioned relationships, the current study seeks to
examine the applicability of employee engagement measurement to customer
engagement in addition to investigating both antecedents and consequences of
customer engagement on the internet in a B2B setting. By better understanding
Page 57
47
these relationships, a broader perspective of engagement and possible beneficial
outcomes will be gained.
Page 58
48
CHAPTER II.
METHOD
The current study used archival data to evaluate the aforementioned
hypotheses. In this sample, data were collected electronically from 4,530
participants who were either customers or anonymous visitors to a B2B
commerce website. The company for which the data were collected supports
other businesses in the area of building and equipment maintenance operations.
Participants were asked to complete surveys that collect information on their
general shopping preferences and attitudes (e.g., satisfaction, commitment)
towards a particular business, and online engagement. Furthermore, participants
were asked to complete additional survey questions on intentions of referral or
repeat purchases with a particular business. Demographic information was also
collected. The following section will provide more information on the research
participants, procedure for data collection, and the scale properties of the
measures used for this study.
Research Participants
An archival data set was used for the current study. Data were collected
during the third quarter of 2009. A total of 4,530 surveys were completed by
participants electronically. Participants were all current customers with the target
business or visited the commerce website during the data collection period. From
the sample, 82.3% (N= 3,730) of participants completed the survey from an email
notification and 17.7% (N= 800) of participants completed the survey by selecting
a survey link located on the business website. Participation in the study was
Page 59
49
voluntary and no incentives were offered. According to Cohen (1992), a sample
size of 599 would be needed to detect a small effect size with four predictors at a
.05 significance level. The sample size for the archival data exceeded this
criterion.
Demographic information was collected in order to assess how this
information may be related to customer engagement and the related outcome
variables. Tables 1 through 6 present demographic information on age, job title,
job role, preferred search medium, preferred purchasing medium, and business
type of the participants.
Procedure
There were two methods in which participants were solicited to partake in
the research. In the first method, current customers received a link in an email
that provided access to the survey. For the second method, a link was posted on
the commerce website that allowed any visitor to take the survey. When an
individual accessed the survey, they were asked for their consent to participate in
the research study. If an individual did not provide consent, the survey would
end. If an individual provided consent they proceeded to complete the following
sections of the survey: preference and decision-making involvement, satisfaction,
commitment, brand image-trust, engagement, referral, and repeat purchase intent.
At the end of the survey, participants were asked if they would provide their email
address if they consented to have their survey responses matched to their
customer data with the business. Providing an email address was not mandatory
for participation. When participants provided an email address, sales, order,
Page 60
50
Table 1
Age of Participants
Age Range N %
<18 11 0.24%
18 to 24 74 1.63%
25 to 34 347 7.65%
35 to 44 668 14.75%
45 to 54 1,539 33.97%
55 to 64 1,433 31.63%
65+ 459 10.13%
Page 61
51
Table 2
Job Titles of Participants
Job Title N %
Supervisor 1,439 31.76%
Purchasing Agent 1,304 28.78%
Administrative Role 522 11.53%
Sales Personnel 139 3.06%
Engineer 533 11.76%
Other 593 13.10%
Page 62
52
Table 3
Job Role of Participants
Job Role N %
Recommend Products to Order 1,475 32.55%
Recommend Vendors to Order
from 660 14.56%
Place Order to Purchase Products 2,232 49.28%
Evaluate Bids from Vendors 163 3.60%
Page 63
53
Table 4
Preferred Search Medium
Search Medium N %
Online 2,850 62.92%
Paper Catalog 1,136 25.07%
Visiting a Store Location 93 2.05%
Calling a Vendor Directly 243 5.36%
Other 208 4.60%
Page 64
54
Table 5
Preferred Purchasing Medium
Purchasing Medium N %
Call to Place Order 1,733 38.25%
Give to Someone Else to Place
Order 545 12.02%
Place Order Online 1,685 37.19%
Fax Order 140 3.08%
Email Order 105 2.31%
Visit Store Location 280 6.19%
Order from Different Vendor 43 0.96%
Page 65
55
Table 6
Business Type of Participants
Business Type N %
Government 1,103 24.34%
Corporation 800 17.67%
Commercial or Local Business 2,626 57.98%
Page 66
56
retention, share of wallet, and web site behavioral data were matched to their
survey responses. Customers were debriefed with the purpose of the study which
was to receive feedback from customers and improve the website.
Measures
The flow of the survey was organized based on the target of the item (i.e.,
the focal business, website for focal business, customer). Survey items were
counterbalanced with the exception of the satisfaction and loyalty measures which
were their own separate sections.
Participants completed the involvement measure which consisted of items
covering areas of channel preference and decision-making involvement. In total
there were 10 items in this measure in which 5 were for preference and 5 were for
decision-making. A sample item for channel preference is “I am most successful
at my job when I purchase online compared to offline”. A sample item for the
decision-making is “I must view all sides of an item/tool prior to making a
purchase” and “I am confident I can select the right product on my own”. One of
the five preference questions was categorical that specifically asked about a
preferred shopping channel (e.g., website, store location, catalog). Otherwise,
each item was measured on a five-point Likert-type scale ranging from strongly
disagree (1) to strongly agree (5). These questions were created for the survey,
thus pre-existing information for the scale properties was unknown. In order to
score the measure, responses to each set of statements were averaged in order to
acquire an involvement score for each participant. To understand the
psychometric properties for the archival data, internal consistency reliability was
Page 67
57
assessed after performing an exploratory factor analysis. Principal axis factoring
with oblimin rotation discovered a three factor solution with 37.83% variance
explained overall. The first factor included items for channel preference such as
preference for making purchases online verses in a store location. This subscale
explained 18.70% variance. The second and third factors included items from the
decision-making involvement measure. Based on a review of these items, a
possible distinguishing point was the reference criteria in the question. One factor
encompassed items that had an external referent, such as a decision on product
choice must be made after visiting a store location or holding an item prior to
purchase. In this case an individual had to physically perform an action before
making a decision. This second factor accounted for 11.85% of variance. The
third factor encompassed items that had an internal referent, such as having a need
to be involved in the purchasing process versus allowing a company
representative (seller) to make these decisions. This factor accounted for 7.28%
of variance. The coefficient alpha reliabilities for the preference and two
decision-making factors are α=.69, α=.73, and α=.71, respectively.
For the satisfaction measure, there were a total of three satisfaction
questions which measured searching, purchasing, and overall satisfaction. A
sample item from this measure is “How satisfied are you with your overall
experience on the website?” Each of the satisfaction items was measured on a 10
point scale ranging from extremely dissatisfied (1) to extremely satisfied (10). In
order to score the measure, responses to each statement were averaged in order to
acquire a satisfaction score for each participant. Reliability was assessed since it
Page 68
58
was previously unknown. An exploratory factor analysis was also conducted to
assess the factor structure for these items. By using principal axis factoring it was
discovered that the three items made up one factor which explained 71.94%
variance. The coefficient alpha reliability for the satisfaction factor is .88.
The commitment measure was modified from Meyer and Allen’s (1990)
3-component model. Due to concerns of survey length, 6 of 18 possible
statements from the original measure were selected. The 6 statements were
modified to fit the customer and business context instead of the employee context
in which they were originally created. The shortened version used in the archival
data consisted of 6 statements that are measured on a 5-point Likert scale
(strongly disagree-strongly agree). An example of a statement is “I owe a great
deal to <business name> .” Participants selected the response choice that best
corresponds to their opinion. The measure is comprised of 3 components as
identified by Meyer and Allen (1991), which are affective, continuance, and
normative commitment. A principal axis factor analysis revealed a similar three
factor solution that explained 50.82% variance in total with 42.34%, 6.32% and
2.17% explained variance in affective, normative, and continuance commitment
subscales. In order to score the measure, responses to each set of statements were
averaged in order to acquire a commitment score for each participant. Previously
reported reliability estimates for the three components are respectively .87, .79,
and .73. In the current study, coefficient alpha reliabilities were reassessed since
modifications were made to the original measure. Coefficient alpha reliabilities
Page 69
59
are as follows: affective commitment α=.81, normative commitment α=.64, and
continuous commitment α=.61.
The brand image-trust measure was developed internally and consisted of
five items. A sample item from this measure is “I feel confident when buying
from <business name>”. Each item was measured on a five point Likert scale
ranging from strongly disagree (1) to strongly agree (5). In order to score the
measure, responses to each set of statements were averaged in order to acquire a
brand image and trust score for each participant. To better understand the
psychometric properties of this scale a factor and reliability analysis was
conducted. A principal axis factor analysis revealed a single factor solution that
explained 60.66% variance. Coefficient alpha reliability for the brand image
scale was α=.86.
The loyalty measure was completed after the brand image-trust measure.
This measure consisted of two items measuring likelihood of referring the
business to another party and likelihood of making a repeat purchase. The referral
item was measured on a five point scale ranging from definitely will not
recommend (1) to definitely will recommend (5). The repeat purchase item was
measured on a five point scale ranging from definitely will not purchase (1) to
definitely will purchase (5). In order to score the measure, responses to each set
of statements were averaged in order to acquire a referral score for each
participant. A principal axis factor analysis revealed a single factor solution that
explained 63.50% variance. Since both the referral and repeat purchase measure
Page 70
60
contained single items, reliability could not be assessed. Prior retest reliabilities
for these items are unknown.
The engagement measure, Utrecht Work Engagement Scale (Schaufeli et
al., 2002), was modified to reflect engagement from a customer perspective
instead of an employee context in which it was developed. This measure has a
three factor structure with the subscales of vigor, dedication, and absorption. An
example of a vigor item is “On <business name website>, I try several searches
for a product when things do not go well”. An example of a dedication item is
“To me, shopping on <business name website> can sometimes be challenging”.
An example of an absorption item is “I am proud of the work <business name>
carries out”. Each item was measured on a five point scale ranging from strongly
disagree (1) to strongly agree (5). In order to score the measure, responses to
each set of statements were averaged in order to acquire an engagement score for
each participant. From prior research on this scale, reliability for these subscales
has ranged from .83 to .97 (Schaufeli et. al., 2002). Principal axis factoring with
oblimin rotation revealed a three factor structure that explained 22.71%, 13.24%,
and 4.00% variance for absorption, dedication, and vigor factors. The following
coefficient alpha reliabilities resulted for the current study with the scale
modifications made: dedication α=.81, vigor α=.69, and absorption α=.61.
Data for the remaining variables tested in this study came from the
organization’s customer database. Sales data are defined as offline, website, or
other e-commerce sales such as electronic data interchange (EDI) or electronic
procurement (E-Pro). For the engagement study, sales in the offline and website
Page 71
61
channel were of main focus. Offline and website sales were defined as the sales
dollars fulfilled through the respective channels during twelve months of activity.
Orders were defined as the number of orders fulfilled through offline or website
channels during twelve months of activity. To calculate average order value per
customer, the following formula was used: sales dollars divided by the number of
orders in twelve months.
Data to calculate share of wallet were available through the utilization of a
customer database. For this calculation, data were gathered on sales dollars spent
with the target organization compared to total sales dollars spent across all
vendors. The denominator in this equation, total spend, is determined from
predictive modeling conducted in house that is based on size, site locations,
industry segment, economic factors, and other variables. In this study, share of
wallet was defined as the amount of business conducted with the target company
measured in sales dollars compared to total sales dollars spent with all businesses
in a twelve month period.
Behavioral website data were gathered from a clickstream database. Data
captured provided information on where customers are clicking on a particular
site, what pages were being viewed, average time spent on a page or for the site
visit, and commerce activities. Behavioral actions such as visits, viewing
products, adding products to a cart, and completing checkout were considered
commerce activities. These activities provided information on conversion events
such as visit to order, product view to cart, and product view to order conversion
rates. For this study, variables of main interest were number of sessions and page
Page 72
62
views. Sessions were defined as the number of times a browser window is
opened with the website of the target business. A session is terminated once the
browser window is closed. Page views were defined as the number of pages
viewed on the website of the target business.
Retention was calculated for each customer based on sales activity in a
given time period. Retention was defined as the number of customers that
purchased in the last twelve months that also purchased within the last thirteen to
twenty four months. This process is repeated based on the first purchase year of
the customer to get a retention rate over the lifetime of the customer.
Demographic data was the final measure completed at the end of the
survey. Information was gathered on age, hours spent on target website during
non-work hours, position, and job role. These data were used to facilitate a better
understanding of the participants and how this data relates to customer
engagement.
Page 73
63
CHAPTER III.
RESULTS
The current study investigated whether the measurement of customer
engagement revealed the same factor structure as employee engagement.
Furthermore it was of interest to determine significant drivers of customer
engagement as well as outcomes of engagement. With this undertaking, drivers
of satisfaction, commitment, brand image, and involvement were investigated
along with outcome variables of website page views, account logins, sales, orders,
average order value, retention, share of wallet, and loyalty.
Based on these variables of interest, the following represents a summary
of the findings. A similar factor structure resulted for customer engagement when
using the Utrecht Work Engagement Scale (Schaufeli et al., 2002). As a
reminder, the context of the questionnaire was modified to represent a customer
context. The remaining hypotheses were partially supported since satisfaction
was not a significant driver of engagement and only page views, sales, average
order value, and loyalty were significant outcomes of engagement.
Supplementary analyses examined possible reasons for these findings. All
findings will be discussed in more detail in the following section.
The statistical approaches of factor analysis, regression, analysis of
variance and structural equation modeling were utilized to test the main
hypotheses as well as exploratory analyses. Prior to conducting these analyses, a
data cleaning process was completed. Data were screened for accuracy, missing
data, outliers, normality, linearity, and homoscedasticity. After reviewing the
Page 74
64
archival data file, there were no missing data because incomplete participant
responses were removed prior to receiving the file. An outlier analysis yielded
evidence that the following variables needed to be transformed: sales, orders,
website page views, and login sessions. Due to a positively skewed distribution,
which exceeded a critical absolute value of 3.29 (Tabachnick & Fidell, 2007), the
aforementioned variables were corrected by applying a natural log transformation
which shifted the skewed distribution to more closely resemble a normal
distribution. After analyzing frequencies and visually inspecting scatterplots and
histograms, issues surrounding linearity and homoscedasticity did not appear to
be problematic. Standardized residual plots were examined to detect
heteroscedasticity. From a visual inspection of these plots, the conditional
distribution of errors does not vary for different values of the independent
variables.
As noted in the method section, factor analyses were conducted on the
following measures in order to evaluate how items loaded together: preference
and decision-making involvement, satisfaction, commitment, brand image and
trust, loyalty, and engagement. Exploratory factor analysis was used instead of
confirmatory factor analysis because scales were adapted to fit the customer
context and dimensionality nor reliability was not inspected previously. The
dimensionalities of these measures are presented in Table 7 through Table 12.
Additionally, Table 13 presents descriptive statistics and correlations among all
study variables. It can be seen that the significant correlations are among
variables that were measured in the survey.
Page 75
65
Table 7
Factor Loadings, Communalities, and Percent of Variance Explained for
Preference and Decision-Making Involvement
Items Preference External
Decision-
Making
Internal
Decision-
Making
h²
P1 0.753 0.008 -0.005 0.567
P2 0.701 0.006 -0.001 0.491
P3 0.286 -0.007 0.174 0.155
P4 0.270 -0.021 0.060 0.093
DM1 0.066 0.649 0.109 0.501
DM2 -0.027 0.883 -0.126 0.699
DM3 0.010 0.048 0.459 0.220
DM4 -0.138 0.001 0.723 0.455
DM5 0.089 -0.024 0.427 0.223
% Variance
Explained
18.70 11.85 7.28
Note: Extraction Method: Principal Axis Factoring. Rotation Method: Oblimin
with Kaiser Normalization.
Page 76
66
Table 8
Factor Loadings, Communalities, and Percent of Variance Explained for
Satisfaction
Items Satisfaction H²
S1 0.877 0.770
S2 0.890 0.792
S3 0.773 0.597
% Variance
Explained
71.94
Note: Extraction Method: Principal Axis Factoring. Rotation Method: Oblimin
with Kaiser Normalization.
Page 77
67
Table 9
Factor Loadings, Communalities, and Percent of Variance Explained for
Commitment
Items Affective
Commitment
Normative
Commitment
Continuance
Commitment
h²
A1 0.344 -0.002 -0.481 0.561
A2 0.697 -0.029 -0.172 0.651
N1 0.036 0.923 0.099 0.771
N2 0.045 0.600 -0.301 0.562
C1 0.294 -0.122 0.406 0.430
C2 -0.013 0.053 0.280 0.074
% Variance
Explained
42.33 6.32 2.17
Note: Extraction Method: Principal Axis Factoring. Rotation Method: Oblimin
with Kaiser Normalization.
Page 78
68
Table 10
Factor Loadings, Communalities, and Percent of Variance Explained for Brand
Image and Trust
Items Brand Image &
Trust
h²
BI&T1 0.713 0.509
BI&T2 0.858 0.737
BI&T3 0.861 0.741
BI&T4 0.808 0.653
BI&T5 0.627 0.393
% Variance
Explained
60.66
Note: Extraction Method: Principal Axis Factoring. Rotation Method: Oblimin
with Kaiser Normalization.
Page 79
69
Table 11
Factor Loadings, Communalities, and Percent of Variance Explained for Loyalty
Items Loyalty h²
L1 0.797 0.635
L2 0.797 0.635
% Variance
Explained
63.50
Note: Extraction Method: Principal Axis Factoring. Rotation Method: Oblimin
with Kaiser Normalization.
Page 80
70
Table 12
Factor Loadings, Communalities, and Percent of Variance Explained for
Customer Engagement
Items Absorption Dedication Vigor h²
A1 0.712 0.074 0.025 0.517
A2 0.813 -0.015 0.000 0.661
A3 0.693 0.122 -0.146 0.478
D1 -0.284 0.446 0.191 0.319
D2 -0.031 0.806 0.127 0.712
D3 0.115 0.589 -0.041 0.348
V1 -0.040 0.230 0.486 0.319
V2 0.232 -0.066 0.285 0.151
V3 0.039 0.030 0.285 0.090
% Variance
Explained
22.71 13.24 4.00
Note: Extraction Method: Principal Axis Factoring. Rotation Method: Oblimin
with Kaiser Normalization.
Page 81
71
Table 13
Means, Standard Deviations, and Correlations among Variables
Notes: ( ) indicate internal reliability estimates; *p< .05, ** p<.001
Measures M SD 1 2 3 4 5 6 7 8 9 10 11 12 13
1. Preference &
Decision-Making
Involvement 3.97 0.48 (.69)
2. Satisfaction 7.60 2.19 .19** (.88)
3. Commitment 3.66 0.78 .31** .39** (.81)
4. Brand Image &
Trust 4.10 0.73 .32** .45** .75** (.86)
5. Engagement 3.46 0.54 .41** .31** .65** .64** (.78)
6. Login Sessions 48.01 92.05 -.01 .01 .03 .02 .02 ( - )
7. Page Views 808.50 1,769.92 .07* .01 .05 .05 .10** .89** ( - )
8. Sales $6,665.71 $25,977.04 -.03 .01 .05 .04 .05** .53** .61** ( - )
9. Transactions 17.52 49.98 -.03 -.03 .03 .03 .04 .56** .63** .86** ( - )
10. Share of Wallet 0.37 0.35 -.04* .01 .12** .06** .03 .20** .18** .19** .17** ( - )
11. Average Order
Value $290.89 $718.35 -.12** .02 -.02 -.01 -.02 .04 .03 .08 .01 .13** ( - )
12. Loyalty 4.45 0.74 .25** .50** .51** .58** .35** .08** .09** .07 .09* .03 .04 ( - )
13. Retention 0.80 0.40 -.07** .02 .04 .02 .01 .24** .24** .40** .25** .32** .12** .01 ( - )
Page 82
72
In order to test hypothesis I, the factor structure of the customer
engagement measure was evaluated. The customer engagement measure revealed
a similar factor structure to the Utrecht Work Engagement Scale (Schaufeli et al.,
2002) from which it was adapted, thus hypothesis I was supported (See Table 12).
More specifically, total variance explained was 39.95% across the three sub-
scales of vigor, dedication, and absorption. Because a similar factor structure
resulted, the remaining hypotheses proceeded to be evaluated.
The remaining hypotheses were tested utilizing structural equation
modeling (SEM) through IBM SPSS AMOS software (version 17). With this
undertaking, various SEM models were attempted. First, a structural regression
model was incorporated as the preferred approach since it incorporates both
measurement and path modeling (Anderson & Gerbing, 1988; Barrett, 2007;
Bollen, 1989; Kline, 2005; Tabachnick & Fidell, 2007). Figure 2 summarizes the
relationships examined in the structural regression model. This preferred
approach was initially deemed feasible since the measurement model could be
identified as the number of unique pieces of information of observed variables
was greater than the number of free parameters to estimate, each latent variable
had an established scale, and factors had at least 2 indicators with uncorrelated
errors and single factor loadings. Additionally, the measurement model is
identified since latent endogenous variables are recursive and do not contain
feedback loops or correlated disturbances. For the path model, parameter
Page 83
73
Figure 2. Customer Engagement Structural Regression Model.
Page 84
74
estimates for free parameters could be obtained. When running the analyses as
described above, complications were encountered that caused the model to be
specified again. Convergence failures occurred when the software could not
reach a satisfactory solution due to underidentification. Because the model should
have been structurally identified, these failures are possible for parameter
estimates close to zero that dropped further during the matrix inversion process,
thus indicating an underidentified problem and the need to respecify the original
model.
The next attempt at structural regression modeling removed the second
order relationships; however, the parameters for the model still could not be
estimated. As an alternate approach, only path modeling with maximum
likelihood method was utilized to test the remaining hypotheses (see Figure 3).
The model fit was moderately acceptable (χ2(72) = 5770.95, p<.001; CFI = .842,
IFI= .845 RMSEA = .091), providing partial support for the hypotheses although
improvements in fit indices are desirable. All parameter estimates and
covariances are listed in Table 14 and Table 15. Although the chi-square model
fit statistic is significant, the measure of fit was not deemed to be problematic
since the sample size exceeded 400 cases (O’Boyle & Williams, 2011). Alternate
measures of fit were consulted to evaluate the model. Comparative fit indices
approached 1.00 and error or the discrepancy measure of RMSEA hovered around
the accepted upper bound of .08. Although this exceeds the rule of thumb,
Kenny, Kaniskan, and McCoach (2011) have noted the RMSEA cut-off value
Page 85
75
Figure 3. Customer Engagement Path Model.
Page 86
76
Table 14.
Unstandardized, Standardized, and Significance Levels for Model.
Parameter Estimate Unstandardized Standardized p
Satisfaction --> Engagement -.001 (.003) -.006 .664
Commitment --> Engagement .254 (.012) .365 .000
Brand Image & Trust -->
Engagement .226 (.014) .305 .000
Preference & Decision-Making
Involvement --> Engagement .229 (.014) .203 .000
Engagement --> Logins 1.143 (4.77) .007 .811
Engagement --> Page Views 208.8 (91.53) .064 .023
Engagement --> Sales 3,495 (1,711.70) .073 .041
Engagement --> Transactions 4.42 (3.30) .048 .181
Engagement --> Share of Wallet .009 (.014) .014 .524
Engagement --> Average Order
Value 133.14 (65.10) .101 .041
Engagement --> Loyalty .601 (.021) .440 .000
Engagement --> Retention .041 (.032) .029 .081
Note: ( ) Standard Error ; N = 4,530; χ2(72) = 5770.95, p < .001; CFI = .842,
IFI= .845 RMSEA = .091
Page 87
77
Table 15.
Unstandardized Covariance Estimates and Significance Levels for Model.
Covariances Estimate S.E P
Satisfaction <--> Commitment .678 .031 .000
Satisfaction <--> Brand Image & Trust .723 .029 .000
Commitment <--> Brand Image & Trust .432 .012 .000
Brand Image & Trust <--> Preference &
Decision-Making Involvement .115 .006 .000
Commitment & Trust <--> Preference &
Decision-Making Involvement .119 .007 .000
Satisfaction & Trust <--> Preference &
Decision-Making Involvement .209 .018 .000
Page 88
78
may be closer to .100 or greater in samples compared to populations for which the
.08 cut-off was recommended.
From the parameter estimates, hypothesis I was partially supported. (See
Figure 4). Although commitment (β=.365, p=.000), brand image and trust (β
=.305, p=.000), and preference and decision-making involvement (β=.203, p
=.000) revealed significant relationships with engagement, satisfaction failed to
produce similar results.
Hypothesis II was partially supported as well. Engagement showed
significant relationships with page views (β =.064, p<.05), sales (β =.073, p<.05),
average order value (β =.101, p<.05), and loyalty (β =.440, p=.000). The
hypothesized relationships that were not supported were between engagement and
logins, transactions, share of wallet, and retention.
To further investigate these findings and relationships with engagement
and demographic variables, exploratory analyses were conducted. In this process,
path modeling, Pearson correlations, and analysis of variance (ANOVA) were
utilized. First, the indirect effects for variables in the path model were evaluated
to understand the role of engagement as an intervening variable. For this
undertaking, direct paths were estimated from the predictors of engagement to the
outcome variables of engagement. Testing for partial mediation involves a three
step process (Baron & Kenny, 1986; Cohen, Cohen, West, & Aiken, 2003): 1)
The initial variables must be related to the outcome variables; 2) the initial
Page 89
79
Figure 4. Customer Engagement Path Model with Parameter Estimates.
Page 90
80
variables must be related to the mediator, engagement; 3) and the mediator must
be related to the outcome variables. Therefore, only a limited set of variables
from the original model were tested for mediation. None of the initial variables
demonstrated a significant relationship with page views, average order value or
sales on the website; however, the significant relationship with the measure of
loyalty remained. As a result, partial mediation was tested for commitment, brand
image, and preference and decision-making involvement with the outcome
variable of loyalty. The resulting alternative model showed a significant chi-
square (χ2(36) = 4112.99, p<.001) with satisfactory model fit (CFI = .882, IFI=
.883 RMSEA = .091) which demonstrated improvement from the initial test of the
hypothesized model (See Table 16).
Sobel tests (1982) were then utilized to test for mediation to detect
whether engagement significantly carries the influence of the initial variables to
loyalty. The Sobel tests (1982) provided support for engagement mediating the
relationship between commitment (z = 2.85, p = .004), brand image (z = 2.84, p =
.005), and preference and decision-making involvement (z = 2.83, p = .004). The
respective indirect effects were .018, .016, and .017 which are practically
meaningful.
Furthermore, additional significant relationships emerged with the direct
effects of the initial variables and the outcome variables. Commitment was
significantly related to share of wallet (β=.155, p<.001) and retention (β =.021,
p<.05). Preference and decision-making involvement showed a relationship with
Page 91
81
Table 16.
Unstandardized, Standardized, and Significance Levels for Partial Mediation
Parameter Estimate Unstandardized Standardized P
Commitment --> Engagement .254 .366 .000
Brand Image & Trust --> Engagement .226 .304 .000
Preference & Decision-Making Involvement
--> Engagement .228 .202 .000
Commitment --> Loyalty .115 .122 .000
Brand Image & Trust --> Loyalty .315 .311 .000
Preference & Decision-Making Involvement
--> Loyalty .062 .040 .004
Engagement --> Loyalty .072 .053 .004
Page 92
82
share of wallet (β = .089, p<.001) and retention (β = .095, p<.05). Lastly,
satisfaction was significantly related to retention (β =.0128, p<.05).
Pearson correlations and regression were utilized to investigate
relationships with engagement and additional website behavior and transactional
data. Two demographic questions captured how often the website was visited
during non-work hours as well as the frequency of visits to an additional content
website owned and sponsored by the target business. Engagement was positively
related to non-work hour visits (F(5,3433)= 61.987, r=.255, R2 =
.020, b= .704,
t=8.632, p<.001), content website visits (F(5,3433)= 54.129, r=.256, R2 =
.042,
b= 1.016, t=12.477, p<.001), and percent of sales though e-commerce compared
to offline sales (F(5,3433)= 17.062, r=.103, R2 =
.009, b= 9.748, t=4.327, p<.001)
while controlling for satisfaction, commitment, brand image and trust, and
preference and decision-making involvement.
Finally, ANOVA was utilized for survey questions that required
categorized responses. Engagement was significantly related to age (F(5,3582) =
3.787, p<.05). Tukey HSD post hoc tests revealed significant relationships with
engagement for the following age groups: 65 years of age or older (M=3.54,
SD=.559) had higher engagement than customers with 25-34 years of age
(M=3.40, SD=.586) (p<.05), 35-44 years of age (M=3.43, SD=.533) (p<.05), and
45-54 years of age (M=3.44, SD=.556) (p<.046). Engagement was not
significantly related to job role (F(5,3582) = 1.497, ns) or job title (F(5,3582) =
1.296, ns). Next, the relationship between engagement and various industry
segments was evaluated. This analysis produced a significant relationship
Page 93
83
between engagement and industry segment of customers that responded to the
survey (F(5,3582, p<.05). Tukey HSD post hoc tests revealed significant
relationships with engagement for the following industry segment groups:
government customers (M=3.48, SD=.539) had higher engagement than heavy
manufacturing customers (M=3.34, SD=.467) (p<.05) and retail and wholesale
customers (M=3.51, SD=.578) had higher engagement than heavy manufacturing
(p<.05).
Page 94
84
CHAPTER IV.
DISCUSSION
With the increased interest in engagement in research and organizations,
the current study integrated engagement from a customer perspective to
understand predictors of engagement as well as outcomes of engagement. As
hypothesized, customer engagement demonstrated a similar structure to employee
engagement which enabled the remaining relationships to be evaluated. Through
these efforts it was discovered that customer commitment, brand image and trust,
and preference and decision-making involvement were positively related to
engagement. Satisfaction was the only attitudinal variable that was not
significantly related to engagement. Furthermore, customer engagement was
significantly related to website behaviors of page views, website sales, average
order value and loyalty.
In the broadest sense, all businesses have a common goal which is to grow
revenue and profitability. With this goal in mind, businesses are faced with the
challenge of how to retain as well as increase their customer base. Businesses
need to find new ways to attract and engage their customers with their products
and services, especially since customers are assuming a more active role in the
information gathering and decision-making process (Sawhney, et al., 2005). For
businesses to be equipped to handle the changing demands of customers, they
must determine what drives customers to conduct business with a given
organization as well as what causes those same customers to either have repeat
transactions or select a competitor for future transactions (Bowden, 2009a).
Page 95
85
Given this common business goal, understanding the service-profit chain
theory is imperative. The service-profit chain theory links a series of
relationships that ultimately lead to profitability and growth (Heskett, Jones,
Loveman, Sasser, & Schelsinger, 1994). Several propositions are identified for
customer and employee linkages. The propositions for customers include the
following: 1) profit and growth are influenced primarily by customer loyalty, 2)
loyalty is a result of customer satisfaction, and 3) customer satisfaction is
influenced by the value provided to customers with product and service offerings.
The propositions for employees include the following: 1) value provided to
customers is created by productive, loyal, and satisfied employees and 2)
employee satisfaction is generated from having high-quality support services and
policies that enable employees to deliver value to customers.
In today’s competitive environment, customers are persuaded by the value
that businesses can provide. Poor service quality or value is the key driver for
why customers switch to competitors (Weitzel, Schwarzkopf, & Peach, 1989;
Zemke & Schaaf, 1989). Furthermore, the interactions between a business and a
customer produce value in themselves. In some cases, especially in B2B
transactions, the service interaction is valued more by the customer than the
satisfaction with the actual products (Grunholdt, Martensen & Kristensen, 2000).
The loyalty of a customer is paramount since loyal customers account for a high
proportion of sales and profit growth overtime (Heskett et al., 1994).
Additionally, it is more costly to a business to acquire new customers than to
retain existing customers (Bai et al., 2006; Buttle, 1996). Recently, it was
Page 96
86
determined that customer retention plays an important role in determining firm
performance and profitability (Towler, Lezotte, & Burke, 2011). Customer
retention, defined by actual return behavior instead of intentions, significantly
mediated the relationship between customer satisfaction and store profitability in
addition to confirming the known relationships in the service-profit chain
theoretical framework. (Towler, Lezotte, & Burke, 2011). Since there will
always be multiple businesses that can provide the same variety of products, the
value created or the quality of service provided can help a business stand out as
being superior than its competitors. These topics are important to understand
since service capabilities are linked to differentiation and price tolerance (Carter,
2008; Heskett et al., 1994).
Although the current study only focused on customer measured variables,
the employee propositions in the service-profit chain are important to discuss as
well. The foundation of this theory is built from an internal service quality which
is similar to organizational service climate literature. When employees are
provided with the tools and resources to deliver quality customer service, they
will develop positive attitudes around satisfaction and loyalty while increasing
productivity (Heskett et al., 1994; Salanova et al., 2005; Schneider et al., 1998;
Towler, Lezotte, & Burke, 2011). Leaders as well as human resources
departments have to support behaviors perceived by employees to deliver value to
customers (Kamakura, Mittal, de Rosa, & Mazzon, 2002; Salanova et al., 2005;
Schneider et al., 1998). These stated supporting behaviors include workplace and
job design, rewards and recognition, and a performance management system that
Page 97
87
encourages customer-oriented behaviors. These practices have been shown to
contribute to work outcomes such as productivity, satisfaction, retention, and
engagement (e.g., Heskett et al., 1994; Kamakura et al., 2002; Oldham &
Hackman, 1981). As organizations focus on strengthening their internal value
and service quality, results will also be evident through customer ratings.
Customers will perceive the internal value as it is demonstrated through external
service value delivered by employees. Therefore, organizations must strengthen
their internal core human management practices before expecting customers to
fully understand the value the organization can provide.
Within the service-profit chain framework, engagement can contribute to
employee and customer assessments of service operations. Engagement in both
contexts is viewed as an individual willingly investing and putting forth extra
effort to ensure an organization or business succeeds (Bowden, 2009a; Macey &
Schneider, 2008). Accordingly, engagement can be used as a proxy to evaluate
the relationship between the employee, customer, and organization. Prior
research has indicated the relationship engagement has with other attitudinal
variables such as high job satisfaction, commitment, and performance (Harter et
al., 2002; Salanova et al., 2005). Within the customer context, engagement has
been linked to higher customer satisfaction, loyalty, retention, and sales
performance (Harter et al., 2002).
As postulated in the current study, similar relationships were discovered
for engagement. As defined by Schaufeli et al., engagement consists of vigor,
dedication, and absorption (2002). This measure demonstrated a similar factor
Page 98
88
structure when evaluating customer engagement as hypothesized. When
customers demonstrate high levels of energy, effort, enthusiasm, pride, and
dedication, they are said to be engaged with the service provider or organization.
As businesses move away from contractual relationships, a change in
behavior is required to engage customers. As noted earlier, customers want to
play a more active role when gathering information and transacting with a
business. In this regard, businesses need to demonstrate cooperative behaviors
with customers instead of just being compliant. Businesses need to actively
pursue creating, developing, and maintaining long-term customers through
engagement (Bowden, 2009a; Morgan & Hunt, 1994). As in the context of the
present study, e-commerce was the platform for which engagement was
measured. New ways to engage customers through technology are rapidly
developing. The internet has transformed the way in which customers search and
purchase products (Kim et al., 2009). Offering a website to customers is yet
another medium for customers to assess value provided by the organization. As
website sales continue to grow, e-commerce interactions and transactions will be
more accepted by customers (Wareham et al., 2005). Businesses need to create
and bridge relationships through the internet with customers that would have
otherwise been facilitated through face-to-face interactions in physical store
locations. The creation of social environments facilitated by online communities,
blogging, customer commentary and feedback are avenues that businesses must
start to address.
Page 99
89
In addition to the measurement of engagement, similar relationships were
found for the predictors of engagement. First, customer commitment was a
significant predictor of engagement which is consistent with prior research.
Highly committed customers should have high levels of engagement. When
customers encounter a positive transactional experience, they will form a
psychological attachment with the target business as they complete more
transactions overtime (Blau, 1985). In accordance with prior research,
supplementary analyses revealed both a direct and an indirect relationship with
loyalty as well.
Through multiple interactions, the customer will personally identify with
the perceived value of the business in addition to their product offerings. As the
relationship develops over time, customers will move away from attribute-based
evaluations and instead towards relationship-based evaluations (Bowden &
Corkindale, 2005; Pullman & Gross, 2003). When customers are committed to a
business they have a greater desire to repeat purchase, invest and engage in the
brand, and have a greater propensity to provide word of mouth referrals
(Harrison-Walker, 2001; Wetzels et al., 1998).
Conversely, customer satisfaction was not a significant predictor of
engagement. It was hypothesized that highly satisfied customers should have
high levels of engagement. The positive relationship between satisfaction and
engagement was hypothesized due to the affective and cognitive components of
satisfaction (Macey & Schneider, 2008). Customers would develop positive or
negative feelings towards a business based on their experiences. Then, a
Page 100
90
customer with high satisfaction would be more inclined to form attitudes
consistent with engagement such as displaying enthusiasm, effort, and persistence
(Schaufeli et al., 2002). As noted in Table 13, the correlation between satisfaction
and engagement showed a significant relationship. However, when the other
predictors were included in the model the satisfaction–engagement relationship
was reduced to a non-significant relationship. Compared to the other predictors,
satisfaction did not make a large enough contribution to the predictive power of
engagement. Supplementary analyses did reveal a significant direct relationship
with satisfaction and loyalty as found in prior research. A possible explanation
for the nonsignificant relationship between satisfaction and engagement could be
that the satisfaction score was not high enough to engage customers. The average
satisfaction score was 7.6 on a 10-point scale for this study. When reviewing
literature on customer satisfaction and loyalty, it is noted that extremely high
satisfaction scores result in significant relationships with loyalty, profitability, and
performance (Heskett et al., 1994; Kamakura et al., 2002; Mittal & Kamakura,
2001). Usually, when the average satisfaction score is closer to the highest rating
with smaller variance (e.g., 9 on a 10-point scale), positive outcomes result such
as loyalty, referrals, profit, market share, and return on investment (Allen &
Willburn, 2002; Sureschandar et al., 2002). The content of the satisfaction
questions could serve as another possible explanation for the contrary findings.
Some measures of satisfaction have been criticized for failing to capture the depth
of responses to given situations (Oliver, 1999). The satisfaction questions from
the current study were very broad and did not inquire about specific aspects or
Page 101
91
attributes of the customers’ experiences. Additionally, the questions were framed
for the online context so responses could reflect satisfaction with the medium
instead of the product or service received. Alternative items should be
incorporated in future measurements.
The remaining predictors of engagement supported the relationships
hypothesized for the study (i.e., involvement, brand image). Highly involved
customers should have high levels of engagement. Customers can have different
levels of involvement based on their willingness to be active in both the decision-
making and transaction process. Customers may not believe they have the
knowledge to make an informed product decision and may want the expertise of
the business to guide their decision. Motivation and relevancy are key factors of
involvement when the decision is deemed as personally relevant to the customer
(Mittal & Lee, 1989). When customers are more active in this process,
engagement is more likely to result since customers will put forth extra effort and
display positive behaviors such as extensive product information research, more
frequent transactions, and positive perceptions of brand-image (Mathieu et al.,
2006; Mittal & Lee, 1989). Furthermore, involvement can impact commitment
and the development of a transformational relationship between the customer and
business.
Correspondingly, customers who perceive a strong brand image should
have a high level of engagement. Brand image and trust are strong predictors of
engagement since these attitudes are formed after multiple interactions with a
business. When customers are engaged, they assume that a business provider is
Page 102
92
able to respond to their needs with a consistent level of quality (Delgado-Ballester
& Munuera-Aleman, 2001; Kim et al., 2009). As a new customer, brand image is
used as a tool to eliminate possible vendors based on non-experimental
information. As a result, a transformation occurs from a cognitive to affective
customer-brand relationship where customers will demonstrate extra-role
behaviors such as positive word of mouth referrals and increased spend (Hess &
Story, 2005; Kahn, 1990). At this point in the relationship, customers trust that
their personal investment into the business will be reciprocated. In addition to
engagement, brand image and trust were correlated with satisfaction and
displayed a significant direct relationship with loyalty which is consistent with
previous literature.
In addition to the predictors of engagement, outcome variables were also
partially supported. Starting with website behaviors, only page views, not logins
were significant outcomes of engagement. Highly engaged customers should
have significantly more page views than lower engaged customers. Page views
are an indicator of how many interactions a customer has with a website in a
given time period. Consistent with the engagement literature, page views would
serve as an outcome when customers display persistence, challenge, and effort in
pursuit of product or content information (Sawhney et al., 2005; Schaufeli et al.,
2002). Customers who have more interaction with the website would then be
more inclined to make a purchase. Contrary to expectations, the number of logins
was not a significant outcome of engagement. A possible reason for this result
could be that engaged customers are not logging in for all of their website visits,
Page 103
93
thus their identity appears as anonymous. Because logins are only required at
time of purchase, it is possible that login behaviors are similar regardless of level
of engagement. The relationship between logins and sales is highly correlated for
this reason. However, there are other functions beyond purchasing for login
sessions such as checking custom product pricing, contract information, and order
history records beyond making a purchase. As a result, login sessions were
viewed as an outcome variable of engagement although it could influence sales
activity. A similar argument can be made for page views influencing sales.
Business-level outcomes were also partially supported. Only sales and
average order value were significant outcomes of engagement where customers
that were highly engaged should have higher sales and average order value
compared to lower engaged customers. Once customers are engaged with a
business, it is assumed that they will buy more products from the target business
as their relationship strengthens (Gefen & Straub, 2000). Additionally,
engagement has demonstrated relationships with sales performance which is
consistent with current findings (Harter et al., 2002; Salanova et al., 2005).
Although the relationship between engagement and transactions was not
supported in the current study, it is possible that customers included more items in
their order which would reduce the transaction count. As more research is
conducted on customer engagement, it would be interesting to focus on
understanding engaged customer behaviors related how they purchase in terms of
frequency and size. Surprisingly, share of wallet was not a significant outcome of
customer engagement. Share of wallet has been identified as a key indicator of
Page 104
94
customer relationship management (Glady & Croux, 2009). It is presumed that
when a customer has developed a relationship with a business, they will spend
more of their wallet with the target business instead of allocating their spend to
other businesses (Zeithaml, 2000). A possible explanation for the findings could
be the tenure of the customer or contractual obligations to other providers. The
tenure of customers was unavailable with the archival data, but should be
researched in the future. If customers are newer, they may still have contractual
obligations to other providers in the near term. These customers should be
monitored as they could increase their sales in the future. This situation is
especially prevalent with B2B relationships. Share of wallet has shown to be
related to loyalty, retention, and identification of high growth potential customers
(Gupta & Zeithaml, 2006; Zeithaml, 2000). Retention of customers was another
outcome of engagement that was not significant. It would be assumed that
engaged customers would be retained over time because a customer-brand
relationship would have formed. In conjunction with commitment, customers
would exhibit a psychological closeness with a business as the number of
interactions increase (Amine, 1998). Although retention was not a significant
outcome of engagement, satisfaction had a direct significant effect on retention
which is supported by previous research. This finding should not come as a
surprise since satisfaction has demonstrated significant relationships with repeat
purchase intentions, positive word of mouth referral, and retention (Anderson &
Mittal, 2000; Giese & Cote, 2000).
Page 105
95
Lastly, the relationship between engagement and loyalty was supported
such that highly engaged customers should have higher levels of loyalty. In this
instance loyalty was defined by likelihood of repeat purchase and positive word of
mouth referral. In addition to engagement, all predictors of engagement had
significant direct effects on loyalty. In agreement with prior research, loyalty
refers to behavioral intentions that are motivated by the willingness of customers
to perform a given behavior (Ajzen, 1991). Intentions to repurchase or to refer
others to a business are manifestations of behavioral intentions as outlined in the
theory of reasoned action (Ajzen & Fishbein, 1980). This theory makes sense
given the attitudes, intentions, and behaviors that were included in the model
tested in the current study.
To summarize, significant outcome variables of engagement were page
views, website sales, average order value and loyalty. Although these
relationships were significant, these findings should be discussed to determine if
statistical difference is large enough to be of value in a practical sense.
Engagement had low correlations with page views, sales, and average order value.
Additionally, the standardized path coefficients were less than .10 which indicates
a small effect. Future research should attempt to replicate these findings.
Supplementary analyses also revealed interesting findings. A partial
mediation model was estimated for variables that met the mediation criteria.
Specifically, the significant relationship with loyalty persisted with commitment,
brand image, and preference and decision-making involvement with engagement
partially mediating these relationships. However, none of the direct effects
Page 106
96
revealed a significant relationship with sales, average order value and website
page views as did engagement. Therefore, the value of engagement was
demonstrated since significant relationships resulted with firm performance
variables. In additional supplementary analyses, engagement was significantly
related to spending more time on the business website during non-work hours and
visits to their content website while controlling for the predictors of engagement.
These findings should indicate to organizations the importance of customer
engagement especially since behavioral and financial outcomes revealed
significant relationships. Further understanding of these outcomes is warranted
with additional research. Consistent with prior research, retention was a
significant outcome of commitment, satisfaction, and involvement when
evaluating the direct effects. Commitment and involvement were significantly
related to share of wallet indicating customers spend more of their total dollars
with the target business as their commitment and involvement increase. All these
findings point to a common theme - the development and maintenance of
customer relationships is imperative. When strong relationships develop,
customers are willing to increase spend and devote extra effort and time to a
target business.
From the supplementary analyses, additional relationships were revealed
with engagement for the demographic data collected. Engagement scores
increased with age. The customer base for the target business is older and more
tenured which coincides with the findings. For example, it would be surprising
for this sample to have the highest engagement scores among customers in the 18
Page 107
97
to 25 years of age range. The largest proportion of participants fell into the 45-54
and 55-64 years of age ranges.
Limitations of Research
Even though the findings presented above contribute to the understanding
of customer engagement and its larger framework, a few limitations can be noted
in this study. First, limitations are present with archival data. Reliabilities for the
measures were not known and needed to be examined in the current study. Some
reliability estimates could be improved by either removing or refining items in
future research. In the instance of single indicators, test-retest reliability could not
be determined. Also, the framework tested was limited to the data available. For
example, information on customer tenure was not available to evaluate
differences with engagement. Second, participant burnout due to the length of the
survey may have influenced careless responding to some questions. This
limitation is possible especially considering that participants could have been
completing the survey while at work since they were sent to business email
addresses. Third, utilization of a structural regression model could not be
estimated due to underidentification issues with the parameter estimates. Use of
structural regression modeling is preferred as it incorporates both measurement
and path modeling. Fourth, non-response bias could have influenced the findings.
With the use of archival data, further investigation of self-selection bias is not
possible because known values of certain variables are not available to evaluate
the differences between respondents and non-respondents (e.g., age, sales,
average order value). It is feasible that respondents could have answered
Page 108
98
differently to the survey questions than non-respondents. Fifth, utilization of a
self-report survey for a large portion of data collection could pose an issue with
common method biases (Podsakoff, MacKenzie, Jeong-Yeon, & Podsakoff,
2003). Common method variance has the potential to create spurious variance
that could be artificially attributed to the constructs measured instead of the
measurement method. Method bias is a source of measurement error which
threatens the validity of results by exerting a systematic effect on the observed
correlations. Method variance is bi-directional which leads to either inflated or
deflated correlations resulting in both Type I and Type II errors (Podsakoff, et al.,
2003). However, Conway & Lance (2010) suggest that the notion of upwardly
biased relationships from self-report measures is a misconception. Research cited
showed that measurement error balanced inflationary effects of common method
bias and that same-method observed score correlations were an accurate depiction
of true score correlations (Conway & Lance, 2010). For common method
variance, the design of the study and statistical controls can be utilized to ensure
accurate interpretation of results. For example, the use of multiple sources for
data collection, separation of measurement for the predictor and criterion
variables, Harman’s single-factor test, or partial correlation procedures can help
control for common method bias (Podsakoff et al., 2003). The current study was
able to incorporate the procedural remedy of counterbalancing question order to
control for priming effects and other biases related to the question context for the
majority of survey sections. However, statistical techniques could further assist
with controlling for common method bias. Finally, the measurement of customer
Page 109
99
engagement could have benefited if data on employee variables were collected.
Future research could address this limitation.
Implications
Despite the aforementioned limitations, this study provides useful
information to businesses that focus on developing customer engagement and
broader outcomes for an organization. Over the years there has been an increased
interest in the concept of engagement; however, the majority of research has been
concentrated in the employment context. With organizations trying to find new
ways to stay competitive, understanding the dynamic role that customers
experience with a brand or business will be beneficial. Businesses could identify
actionable steps to take that could facilitate engagement (i.e., absorption,
dedication, and persistence). The current study seeks to incorporate an all
encompassing model that analyzes the relationships of attitudinal variables with
customer engagement along with outcomes. With such a model, one can utilize
engagement as an indicator of service provider performance. Additionally, the
current findings demonstrate the importance of developing a positive brand image
and commitment in customers to facilitate engagement. Furthermore,
engagement demonstrated a direct effect on sales, average order value, and page
view behaviors on the website.
Consumer behavior research has indicated that the needs of customers are
ever evolving (Fogli & Whitney, 1991; Ganesh, Arnold, & Reynolds, 2000).
Customers are transacting with multiple businesses through multiple channels.
Customers want to be participators and knowledge sharers instead of only end
Page 110
100
users in a consumption process (Erat et al., 2006; Sawhney et al., 2005).
Businesses need to take a more proactive approach to managing the relationships
developed with their customer base by understanding their visitation and buying
patterns as well as other needs. If service providers understand the importance of
establishing an engaged customer base, then they can create platforms that will
invite customers to participate in their growth, evaluate new ideas or products,
and provide insight into what solutions and capabilities customers need. The
internet serves as an excellent way to engage customers. With the growing usage
of the internet as a means of finding products and transacting, this platform serves
as an excellent way to maximize engagement. Websites should provide an outlet
for customers to interact, share ideas, and provide feedback. Today, the use of
social media by businesses where appropriate is commonplace. These outlets
provide more opportunities for referrals and brand awareness, value that is
generated in addition to purchasing behavior. During this cycle, service providers
will benefit by retaining customers and increasing revenue, while customers will
benefit from having their voice heard and needs met. Organizations should rely
on their human resource practices to foster a climate where customer service is
valued and rewarded.
Finally, this research has focused on the B2B context. In this case, an
individual’s job role is to seek out businesses to transact with in order to perform
his or her job. Within this context, the individual could be engaged at work and
engaged as a customer with the businesses with whom they frequently transact.
Page 111
101
Future Directions
Future research is necessary to further explore customer engagement and
both its predictors and outcomes. First, the measurement of customer engagement
should be retested. This study was the first known attempt at measuring the
construct by adapting an employee engagement measure. In addition, research
should be extended to other job sectors as this study focused on repair and
maintenance operations. Also, the context of the study was centered on
engagement online in the e-commerce space. Future research could evaluate how
engagement changes in a broader context that would include offline interactions
as well. Next, it is worth evaluating how engagement is developed in different
business types. For instance, different aspects of engagement could be valued
more depending on whether the business focuses on other businesses, consumers,
or both. Furthermore, future research should evaluate additional predictors and
outcomes of engagement. Variables that were found to be non-significant but
have received support in prior literature should be reevaluated in future
measurements (e.g., satisfaction). Measures on tenure, profitability, and revenue
growth over a given time period are just a few suggestions. Another future
direction would be to measure engagement over time in a longitudinal study. The
current study was cross-sectional and assumes that the variables measured are
constant across the customer-brand relationship. With this undertaking,
moderators of engagement should be investigated such as repurchase frequency
and length of time between service encounters. Understanding customer tenure
will also assist in this evaluation. Lastly, future research should incorporate
Page 112
102
measures of both employee and customer engagement as well as predictors and
outcomes in each context to better understand the linkages described in service
climate and service-profit chain literature.
Page 113
103
CHAPTER V.
SUMMARY
Businesses are constantly faced with an ever increasing competitive
environment. There is a growing need for businesses to better understand how
they can maintain and interact with their customer base. To facilitate this
understanding, engagement research should be integrated. However, the literature
on engagement from a customer perspective is in its infancy. Furthermore,
identifying the measurement framework of customer engagement and outcome
variables has yet to be decided as well.
Therefore, it was hypothesized that customer engagement would have a
similar factor structure to employee engagement. Also, it was hypothesized that
satisfaction, commitment, brand image, and preference and decision-making
involvement would predict engagement. Furthermore, outcome variables of
business sales and transactions, website behaviors, and loyalty were assessed.
Archival data was utilized to evaluate these relationships which included 4,530
participants that were customers of a B2B maintenance and supply business and
utilized the business’ website.
A similar factor structure resulted for the measurement of customer
engagement. Structural equation modeling showed partial support for the
hypothesized predictors of engagement since the relationship between satisfaction
and engagement was not significant. The hypothesized outcome variables of
engagement were also partially supported since only loyalty, sales, average order
value, and website page views were significant. When direct paths from the
Page 114
104
antecedents of engagement to the outcomes of engagement were modeled,
significant relationships remained only for loyalty, thus indicating the
contribution of engagement in predicting business outcomes such as sales and
average order value. The implications and future research of customer
engagement, e-commerce, and business-to-business contexts are discussed.
Page 115
105
REFERENCES
Ahluwalia, R., Unnava, R., & Burnkrant, R. (1999). Towards understanding the
value of a loyal customer: An information-processing perspective.
Marketing Science Institute, 99, 88-116.
Ajzen, I. (2002). Perceived behavioral control, self-efficacy, locus of control, and
the theory of planned behavior. Journal of Applied Social Psychology, 32,
665-683.
Ajzen, I. (1991). The theory of planned behavior. Organizational Behavior &
Human Decision Processes, 50, 179-211.
Ajzen, I., and Fishbein, M. (1980). Understanding attitudes and predicting social
behavior. Englewood Cliffs, NJ : Prentice-Hall.
Alba, J. & Hutchinson, W. (1987). Dimensions of consumer expertise. Journal
of Consumer Research, 13, 411-454.
Allen, N.J. & Meyer, J.P. (1990). The measurement and antecedents of affective,
continuance, and normative commitment to the organization. Journal of
Occupational Psychology, 63, 1-18.
Allen, D. & Willburn, M. (2002). Linking customer and employee satisfaction to
the bottom line. Milwaukee, WI: American Society for Quality.
Amine, A. (1998). ‘Consumers’ true brand loyalty: The central role of
commitment. Journal of Strategic Marketing, 6, 305-319.
Anderson, J.C. & Gerbing, D.W. (1988). Structural equation modeling in
practice: A review and recommended two-step approach. Psychological
Bulletin, 103, 411-423.
Page 116
106
Anderson, E. & Mittal, V. (2000). Strengthening the service profit chain. Journal
of Service Research, 3, 107-120.
Anderson, J. C. & Narus, J.A. (2004). Business market management:
Understanding, creating, and delivering value (2nd Edition). Upper
Saddle River, New Jersey: Pearson Education.
Ba, S., & Pavlou, P. A. (2002). Evidence of the effect of trust in electronic
markets: Price premiums and buyer behavior. MIS Quarterly, 23 (4), 243-
268.
Bai, B., Hu, C., & Jang, S. (2006). Examining e-relationship marketing features
on hotel websites. Journal of Travel & Tourism Marketing, 21, 33-47.
Bandura, A. (1986). Social foundations of thought and action: A social cognitive
theory. Englewood Cliffs, NJ: Prentice-Hall.
Baron, R.M. & Kenny, D.A. (1986). The moderator-mediator variable distinction
in social psychological research: Conceptual, strategic, and statistical
considerations. Journal of Personality and Social Psychology, 51(6),
1173-1182.
Barrett, P. (2007). Structural equation modeling: adjudging model fit. Personality
and Individual Differences, 42, 815–824.
Belonax, J., & Javalgi, R. (1989). The influence of involvement and product class
quality on consumer choice sets. Journal of the Academy of Marketing
Science, 17, 209-216.
Page 117
107
Bernthal, P. (2004). Measuring employee engagement. Retreived March 29,
2009, from
www.ddiworld.com/pdf/ddi_MeasuringEmployeeEngagement_wp.pdf
Blau, G.J. (1985). The measurement and career prediction of career commitment.
Journal of Occupational Psychology, 58, 277-288.
Bollen, K.A. (1989). Structural equations with latent variables. New York, New
York: Wiley.
Borman, W.C. (2004). The concept of organizational citizenship. Current
Directions in Psychology Science, 13,238-241.
Bowden, J.L. (2009a). The process of customer engagement: A conceptual
framework. Journal of Marketing Theory, 17, 63-75.
Bowden, J.L. (2009b). Customer engagement: A framework for assessing
customer-brand relationships: The case of the restaurant industry. Journal
of Hospitality Marketing & Management, 18, 574-596.
Bowden, J. & Corkindale, D. (2005). Identifying the initial target consumer for
innovations: An integrative approach. Marketing Intelligence &
Planning, 23, 562-573.
Brown, S.P. (1996). A meta-analysis and review of organizational research on
job involvement. Psychological Bulletin, 120, 235-255.
Buchanan, B. (1974). Building organizational commitment: The socialization of
managers in work organizations. Administrative Science Quarterly, 19,
533-546.
Page 118
108
Burke, M.J. (2008). On the skilled aspect of employee engagement. Society for
Industrial and Organizational Psychology, 1, 70-71.
Buttle, F. (1996). Relationship marketing: Theory and practice. London: Paul
Chapman Publishing Ltd..
Campbell, J.P., & Pritchard, R.D. (1976). Motivation theory in industrial and
organizational psychology. In M.D. Dunnette (Ed.), Handbook of
industrial and organizational psychology (pp. 63-130). Chicago:Rand-
McNally.
Carter, T. (2008).Customer engagement and behavioral considerations. Journal of
Strategic Marketing, 16, 21-26.
Cohen, J. (1992). A power primer. Psychological Bulliten,112, 155-159.
Cohen, P., Cohen, J., West, S.G., & Aiken, L.S. (2003). Applied multiple
regression/ correlation analysis for the behavioral sciences (3rd
Edition).
Mahwah, NJ: Lawrence Erlbaum Associates, Inc., Publishers.
Colbert, A.E., Mount, M.K., Harter, J.K., Witt, L., & Barrick, M.R. (2004).
Interactive effects of personality and perceptions of the work situation on
work place deviance. Journal of Applied Psychology, 89, 599-609.
Conway, J.M. & Lance, C.E. (2010). What reviewers should expect from authors
regarding common method bias in organizational research. Journal of
Business Psychology, 25, 325-334.
Cooper-Hakim, A., & Viswesvaran, C. (2005). The construct of work
commitment: Testing an integrated framework. Psychological Bulletin,
131, 241-259.
Page 119
109
Coyle-Shapiro, J.A.M., Kessler, I., & Purcell, J. (2004). Exploring
organizationally directed citizenship behavior: Reciprocity or “It’s my
job?” Journal of Management Studies, 41, 85-106.
Crant, J.M. (2000). Proactive behavior in organization. Journal of Management,
27, 435-462.
Delgado-Ballester, E. & Munuera-Aleman, J. (2001). Brand trust in the context
of consumer loyalty. European Journal of Marketing, 35, 1238-1258.
Dubrovski, D. (2001). The role of customer satisfaction in achieving business
excellence. Total Quality Management, 12, .920-925.
Erat, P., Desouza, K.C., Schafer-Jungel, A., & Kurzawa, M. (2006). Business
customer communities and knowledge sharing: Exploratory study of
critical issues. European Journal of Information Systems, 15, 511-524.
Erickson, T.J. (2005). Testimony submitted before the U.S. Senate Committee on
Health, Education, Labor, and Pensions, May 26.
Fishbein, M., & Ajzen, I. (1975). Belief, attitude, intention, and behavior: An
introduction to theory and research. Reading, M.A.: Addison-Wesley.
Fisher, C.D. (2000). Mood and emotions while working: Missing pieces of job
satisfaction? Journal of Organizational Behavior, 21, 185-202.
Fogli, L., & Whitney, K. (1998). Assessing and changing managers for new
organizational roles. In Jeanneret, R., & Silzer, R. Individual
psychological assessment: Predicting behaviors in organizational settings
(pp. 285-329). San Francisco: Jossey-Bass.
Page 120
110
Ganesh, J., Arnold, M., & Reynolds, K. (2000). Understanding the customer base
of service providers: An examination of the differences between switchers
and stayers. Journal of Marketing, 64(3), 65–87.
Gefen, D. (2000). E-commerce: The role of familiarity and trust. Journal of
Management Science. 28(6) 725–737.
Gefen, D., & Straub, D. (2000). The relative importance of perceived ease-of-use
in IS adoption: A study of e-commerce adoption. Journal of AIS, 1 (8),
1-30.
Geyskens, I., J., Sleenkamp, E.M., & Kumar, N. (1999). A meta-analysis of
satisfaction in marketing channel relationships. Journal of Marketing
Research, 36, 223-238.
Giese, J. & Cote, J. (2002). Defining consumer satisfaction. Academy of
Marketing Science Review, 2000 (1), 1-26.
Glady, N. & Croux, C. (2009). Predicting customer wallet without survey data.
Journal of Service Research, 11, 219-231.
Grunholdt, L., Martensen, A., & Kristensen, K. (2000). The relationship between
customer satisfaction and loyalty: Cross-industry differences. Total
Quality Management, 11, 509-514.
Gupta, S. & Zeithaml, Z.A. (2006). Customer metrics and their impact on
financial performance. Marketing Science, 25(6), 718-739.
Hardaker, S. & Fill, C. (2005). Corporate service brands: The intellectual and
emotional engagement of employees. Corporate Reputation Review, 7,
365-376.
Page 121
111
Harrision-Walker, J. (2001). The measurement of word-of-mouth
communications and an investigation of service quality and customer
commitment as potential antecedents. Journal of Service Research, 4, 60-
75.
Harter, J.K., Schmidt, F.L., & Hayes, T.L. (2002). Business-unit-level
relationship between employee satisfaction, employee engagement, and
business outcomes: A meta-analysis. Journal of Applied Psychology, 87,
268-279.
Hess, J. & Story, J. (2005). Trust-based commitment: Multidimensional
consumer-brand relationships. Journal of Consumer Marketing, 22, 313-
322.
Hessket, J.L., Jones, T.O., Loveman, G.W., Sasser, W.E., & Schelsinger, L.A.
(1994). Putting the service-profit chain to work. Harvard Business
Review, March-April, 164-174.
Hewitt Associates LLC. (2005). Employee engagement. Retrieved March
20,2008, from
http://was4.hewitt.com/hewitt/services/talent/subtalent/ee_engagement.ht
m
Hofmeyr, J., & Rice, B. (2000). Commitment-led marketing: The key to brand
profits is in the customer’s mind. Chichester, UK: Wiley.
Hollebeek, L. (2011a). Exploring customer brand engagement: Definition and
themes. Journal of Strategic Marketing, 19(7), 555-573.
Page 122
112
Hollebeek, L. (2011b). Demystifying customer brand engagement: Exploring the
loyalty nexus. Journal of Marketing Management, 27, 785-807.
Huber, F., Beckman, S., & Hermann, A. (2004). Means-ends analysis: Does the
affective state influence information processing style? Psychology &
Marketing, 21, 715-737.
Iaffaldano, M.T. & Muchinsky, P.M. (1985). Job satisfaction and performance: A
meta-analysis. Psychological Bulletin, 97, 251-273.
Ittner, C.D. and Larcker, D.F. (1996). Measuring the impact of quality initiatives
on firm financial performance. Advances in the Management of
Organizational Quality, 1, 1-37.
Johnson, C. & Mathews, B. (1997). The influence of experience on service
expectations. International Journal of Service Industry Management, 8,
290-305.
Johnson, M., Gustaffson, A., Anderassen, T., Lervik, L., & Cha, J. (2001). The
evolution and future of national customer satisfaction index models.
Journal of Economic Psychology, 22, 217-245.
Judge, T.A., Thorsen, C.J., Bono, J.E., & Patton, G.K. (2001). The job
satisfaction-job performance relationship: A qualitative and quantitative
review. Psychological Bulletin, 127, 376-407.
Kahn, W.A. (1990). Psychological conditions of personal engagement and
disengagement at work. Academy of Management Journal, 33, 692-724.
Kamakura, W.A., Mittal, V., de Rosa, F., & Mazzon, J.A. (2002). Assessing the
service-profit chain. Marketing Science, 21, 294-317.
Page 123
113
Kanfer, R. (1990). Motivation theory and industrial/organizational psychology.
In M.D. Dunnette & L.M.Hough (Eds.) Handbook of industrial and
organizational psychology (2nd ed., Vol 1, pp. 75-170). Palo Alto, CA:
Consulting Psychologists Press.
Kenny, D. A., Kaniskan, B., & McCoach, D. B. (2011). The performance of
RMSEA in models with small degrees of freedom. Unpublished paper,
University of Connecticut.
Kim, D.J., Ferrin, D.L., & Rao, H.R. (2009). Trust and satisfaction, two stepping
stones for successful e-commerce relationships: A longitudinal
exploration. Information Systems Research, 20, 237-257.
Kline, R.B. (2005). Principles and practice of structural equation modeling (2nd
ed). New York: Guilford Press.
Kumar, V., Aksoy, L., Donkers, B., Venkatesan, R., Wiesel, T., & Tillmanns, S.
(2010). Undervalued or overvalued customers: Capturing total customer
engagement value. Journal of Service Research, 13, 297-310.
Lacey, R. & Morgan, R.M. (2009). Customer advocacy and the impact of B2B
loyalty programs. Journal of Business & Industrial Marketing, 24, 3-13.
LePine, J.A., Erez, A., & Johnson, D.E. (2002). The nature and dimensionality of
organizational citizenship behavior: A critical review and meta-analysis.
Journal of Applied Psychology, 87, 52-65.
Lee, Y.W. & Bellman, S. (2008). An augmented model of customer loyalty of
organizational purchasing of financial services. Journal of Business-to-
Business Marketing, 15(3), 290-322.
Page 124
114
Luo, X. & Homburg, C. (2007). Neglected outcomes of customer satisfaction.
Journal of Marketing, 71 (2) 133-49.
Macey, W.H., & Schneider, B. (2008). The meaning of employee engagement.
Industrial and Organizational Psychology: Perspectives on Science and
Practice, 1, 3-30.
Maithieu, J.E., Gilson, L.L., & Ruddy, T.M. (2006). Empowerment and team
effectiveness: An empirical test of an integrated model. Journal of
Applied Psychology, 91, 97-108.
Martinsen, A., Grönholdt, L., & Kristensen, K. (2000), The drivers of customer
satisfaction and loyalty: Cross-industry findings from Denmark. Total
Quality Management 11, 544-553.
Mattila, A. (2004). The impact of service failures on customer loyalty: The
moderating role of affective commitment. International Journal of
Service Industry Management, 15, 134-149.
Mattila, A. & Wirtz, J. (2002). The impact of knowledge types on the consumer
search process: The moderating role of affective commitment.
International Journal of Service Industry Management, 13, 214-230.
McEwen, W. (2004). Why satisfaction isn’t satisfying. Gallup Management
Journal Online, November 11. Available at
http://gmj.gallup.com/content/14023/Why-Satisfaction-Isnt-
Satisfying.aspx.
McGregor, D.M. (1960). The human side of enterprise. New York: McGraw-
Hill.
Page 125
115
McKnight, D. H., Choudhury, V., & Kacmar, C. (2002). The impact of initial
consumer trust on intentions to transact with a web site: A trust building
model. Journal of Strategic Information Systems, 11, 297–323.
Meyer, J.P. & Allen, N.J. (1991). A three-component conceptualization of
organizational commitment. Human Resource Management Review, 1,
61-89.
Meyer, J.P. & Allen, N.J. (2002). Commitment to organizations and
occupations: Extensions and test of a three component conceptualization.
Journal of Applied Psychology, 78, 538-551.
Mittal, B., & Lee, M. (1989). A causal model of consumer involvement. Journal
of Economic Philosophy, 10, 363-389.
Mittal, V. & Kamakura, W. (2001). Satisfaction, repurchase intent and
repurchase behavior: Investigating the effect of customer characteristics.
Journal of Marketing Research, 38, 131-142.
Mittal, V., Katrichis, J., & Kumar, P. (2001). Attribute performance and
customer satisfaction overtime: Evidence from two field studies. Journal
of Service Research, 15, 343-356.
Molinari, L.K., Abratt, R., Dion, P. (2008). Satisfaction, quality and value
effects on repurchase and positive word-of-mouth behavioral intentions in
a B2B services context. Journal of Services Marketing, 22, 363-373.
Morgan, R.M. and Hunt, S.D. (1994). The commitment-trust theory of
relationship marketing. Journal of Marketing, 58(3), 20-38.
Page 126
116
Mowday, R.T., Porter, L.W., & Steers, R.M. (1982). Employee-organization
linkages: The psychology of commitment, absenteeism, and turnover.
New York: Academy Press.
Mowday, R.T. & Steers, R.M. (1979). The measurement of organizational
commitment. Journal of Vocational Behavior, 14, 224-247.
Narus, J. A. (2005). Connect with your suppliers: A wholesaler-distributor's guide
to electronic communications systems. Washington, D.C.:National
Association of Wholesaler-Distributors.
Newman, D.A. & Harrison, D.A. (2008). Been there, bottled that: Are state and
behavioral work engagement new and useful construct “wines”?
Industrial and Organizational Psychology, 1, 31-35.
O'Boyle, E. H., Jr., Williams, L. J. (2011). Decomposing model fit: Measurement
vs. theory in organizational research using latent variables. Journal of
Applied Psychology, 96, 1-12.
Oldham, G.R. & Hackman, J.R. (1981). Relationships between organizational
structure and employee reactions: Comparing alternative frameworks.
Administrative Science Quarterly, 26, 66-83.
Oliva, T., Oliver, R., & Bearden, W. (1995). The relationships among consumer
satisfaction involvement and product performance. A catastrophe theory
application. Behavioral Science, 40, 104-132.
Oliver, R. (1999). Whence consumer loyalty? Journal of Marketing, 63(1), 33–44.
Oliver, R., Rust, R., & Varki, S. (1997). Customer delight: Foundations,
findings, and managerial insight. Journal of Retailing, 73, 311-336.
Page 127
117
Patterson, P. (2000). A contingency approach to modeling satisfaction with
management consulting services. Journal of Service Research, 3, 138-153.
Pavlou, P.A. & Fygenson, M. (2006). Understanding and predicting electronic
commerce adoption: An extension of the theory of planned behavior. MIS
Quarterly, 30, 115-143.
Peppers, D. & Rogers, M. (2004). Managing customer relationship: A strategic
framework. Wiley, Hoboken.
Plank, R. E., Reid, D.A., & Pullins, E.B. (1999). Perceived trust in business-to-
business sales: A new measure. Journal of Personal Selling & Sales
Management 19(3) 61–71.
Podsakoff, P. M., MacKenzie, S. B., Jeong-Yeon, L., & Podsakoff, N. P. (2003).
Common Method Biases in Behavioral Research: A Critical Review of the
Literature and Recommended Remedies. Journal of Applied Psychology,
88(5), 879
Price, L., Arnould, E., & Tierney, P. (1995). Going to extremes: Managing
service encounters and assessing provider performance. Journal of
Marketing, 59, 83-97.
Pullman, M. & Gross, M. (2003). Welcome to your experience: Where you can
checkout anytime you’d like but you can never leave. Journal of Business
& Management, 9, 215-232.
Ranganathan, C., & Ganapathy, S. (2002). Key dimensions of business-to-
consumer web sites. Information Management, 39(6), 457–465.
Page 128
118
Reichheld. F. F. & Sasser, W.E. (1990). Zero defections: Quality comes low
service. Harvard Business Review, 68 (September-October), 105-111.
Roberts, B.W., Chernyshenko, O.S., Stark, S., & Goldberg, L.R. (2005). The
structure of conscientiousness: An empirical investigation based on seven
major personality questionnaires. Personnel Psychology, 58, 103-139.
Roser, R. (1990). Involvement, attention, and perceptions of message relevance
in the response to persuasive appeals. Communication Research, 17, 571-
600.
Salanova, M., Agut, S., & Peiro, J.M. (2005). Linking organizational resources
and work engagement to employee performance and customer loyalty:
The mediation of service climate. Journal of Applied Psychology, 90,
1217-1227.
Sawhney, M., Verona, G. & Prandelli, E. (2005). Collaborating to create: The
internet as a platform for customer engagement in product innovation.
Journal of Interactive Marketing, 19, 4-17.
Scullin, S.S., Fjermestad, J., & Romano Jr., N.C. (2004). E-Relationship
marketing: Changes in traditional marketing as an outcome electronic
customer relationship management. The Journal of Enterprise
Information Management, 17(6), 410-415.
Schaufeli, W. B., Salanova, M., Gonza´lez-Roma´, V., & Bakker, A. B. (2002).
The measurement of engagement and burnout: A two sample confirmatory
factor analytic approach. Journal of Happiness Studies, 3, 71–92.
Page 129
119
Schleicher, D.J., Watt, J.D., & Greguras, G.J (2004). Reexamining the job
satisfaction-performance relationship: The complexity of attitudes.
Journal of Applied Psychology, 89, 165-177.
Schneider, B., & Bowen, D.E. (1985). Employee and customer perceptions of
service in banks: Replication and extension. Journal of Applied
Psychology, 70, 423-433.
Schneider, B., Ehrhart, M.G., Mayer, D.M., Saltz, J., & Niles-Jolly, K. (2005).
Understanding organizational-customer linkages in service settings.
Academy of Management Journal, 48, 1017-1032.
Schneider, B., White, S.S., & Paul, M.C. (1998). Linking service climate and
customer perceptions of service quality: Test of a causal model. Journal
of Applied Psychology, 83, 150-163.
Sheppard, B. H., Hartwick, J., & Warshaw, P. (1988). The theory of reasoned
action: A meta-analysis of past research with recommendations for
modifications and future research. Journal of Consumer Research, 15(3),
325-343.
Sobel, M.E. (1982). Asymptotic intervals for indirect effects in structural
equations models. In S. Leinhart (Ed.), Sociological methodology (p.290-
312). San Francisco, CA: Jossey-Bass.
Soderlund, M. (2002). Customer familiarity and its effects on satisfaction and
behavioral intentions. Psychology & Marketing, 19, 861-880.
Spector, P. E. (1997). Job satisfaction: Application, assessment, causes, and
consequences. Thousand Oaks, CA: Sage.
Page 130
120
Spreitzer, G.M. (1995). Psychological empowerment in the workplace:
Dimensions, measurement, and validation. Academy of Management
Journal, 38, 1442-1465.
Sprott, D., Czellar, S., & Spangenberg, E. (2009). The importance of a general
measure of brand engagement on market behavior: Development and
validation of a scale. Journal of Marketing Research, 46, 92-104.
Stanton, W.J., Miller, K.E., & Layton, R.A. (1994). Fundamentals of marketing.
Roseville, NSW: McGraw-Hill.
Sureschandar, G.S., Rajendran, C., & Anantharaman, R.N. (2002). The
relationship between service quality and customer satisfaction – A factor
specific approach. Journal of Services Marketing , 16, 363-379.
Swan, J.E. & Oliver, R.L. (1991). An applied analysis of buyer equity perceptions
and satisfaction with automobile salespeople. Journal of Personal Selling
& Sales Management, 11, 15-26.
Tabachnik, B.G. & Fidell, L.S. (2007). Using multivariate statistics (5th
ed.).
Boston, MA: Pearson Education, Inc.
Towers-Perrin. (2003). Working today: Understanding what drives employee
engagement. Stamford, CT: Author.
Towler, A., Lezotte, D.V., & Burke, M.J. (2011). The service climate-firm
performance chain: The role of customer retention. Human Resource
Management, 50, 391-406.
Page 131
121
Tsiros, M., Ross, W.T., Jr & Mittal, V. (2009). How commitment influences the
termination of B2B exchange relationships. Journal of Service Research,
11, 263 - 276.
Van Doorn, J., Lemon, K.N., Mittal, V., Nass, S., Pick, D., Pirner, P., & Verhoef,
P.C. (2010). Customer engagement behavior: Theoretical foundations
and research directions. Journal of Service Research, 13, 253, 266.
Verhoef, P.C., Reinartz, W.J., & Krafft, M. (2010). Customer engagement as a
new perspective in customer management. Journal of Service Research,
13, 247-252.
Wallerstein, N., & Bernstein, E. (1988). Empowerment education: Freir’s ideas
adapted to health education. Health Education Quarterly, 15, 379-394.
Wareham, J., Zheng, J.G., & Straub, D. (2005). Critical themes in electronic
commerce research: A meta analysis. Journal of Information Technology,
20, 1-19.
Watson, D., Clark, L.A., & Tellegen, A. (1988). Development and validation of
brief measures of positive and negative affect: The PANAS scales.
Journal of Personality and Social Psychology, 54, 1063-1070.
Weiss, H.M. (2002) Deconstruction job satisfaction: Separating evaluations,
beliefs, and affective experiences. Human Resource Management Review,
12, 173-194.
Weitzel, W., Schwarzkopf, A.B., & Peach, E.B. (1989). The influence of
employee perceptions of customer service on retail store sales. Journal of
Retailing, 65 (1), 27-39.
Page 132
122
Welbourne, T.M., ( 2007 ). Employee engagement: Beyond the fad and into the
executive suite. Executive Forum, Spring, 45-51.
Wellins, R., & Concelman, J. (2005). Creating a culture for engagement. Work
Performance Solutions (www.wpsmag.com). Retrieved July 19, 2005,
from www.ddiworld.com/pdf/wps_engagement_ar.pdf
Wetzels, M., De Ruyter, K., & Van Birgelen, M. (1998). Marketing service
relationships: The role of commitment. Journal of Business & Industrial
Marketing, 13, 406-423.
Zeithaml, V. A. (2000). Service quality, profitability and the economic worth of
customers: What we know and what we need to learn. Journal of the
Academy of Marketing Science, 28 (2), 67-85.
Zemke, R. & Schaaf, D. (1989). The service edge: 101 companies that profit
from customer care. New York: Penguin Books.
Page 133
123
Appendix A
Survey Questions
Page 134
124
Channel Preference Involvement
What is your preferred method of searching for products you need for your
company?
Online/Web Paper Catalog Visit a Branch Call a Vendor Other
I am most successful at my job when I search online compared to offline.
1 2 3 4 5
Strongly Disagree Disagree Neutral Agree Strongly Agree
I am most successful at my job when I purchase online compared to offline.
1 2 3 4 5
Strongly Disagree Disagree Neutral Agree Strongly Agree
It is important that I have a personal relationship with the vendors I buy from.
1 2 3 4 5
Strongly Disagree Disagree Neutral Agree Strongly Agree
I appreciate talking to a knowledgeable representative/seller for opinions and
guidance on the right product for the job.
1 2 3 4 5
Strongly Disagree Disagree Neutral Agree Strongly Agree
Page 135
125
Decision-Making Involvement
I must view all sides of an item/tool prior to making a purchase.
1 2 3 4 5
Strongly Disagree Disagree Neutral Agree Strongly Agree
I am confident I can select the right product on my own.
1 2 3 4 5
Strongly Disagree Disagree Neutral Agree Strongly Agree
I need to hold a tool or part in my hands before buying it.
1 2 3 4 5
Strongly Disagree Disagree Neutral Agree Strongly Agree
I appreciate having a variety of products to consider.
1 2 3 4 5
Strongly Disagree Disagree Neutral Agree Strongly Agree
I personally use the products I purchase from <business name>.
1 2 3 4 5
Strongly Disagree Disagree Neutral Agree Strongly Agree
Page 136
126
Satisfaction
How satisfied are you with your overall experience on the website?
1 2 3 4 5 6 7 8 9 10
Extremely Dissatisfied Extremely Satisfied
How satisfied are you with the ease of purchasing items on <business name
website>?
1 2 3 4 5 6 7 8 9 10
Extremely Dissatisfied Extremely Satisfied
How satisfied are you with the ease of searching for products on <business name
website>?
1 2 3 4 5 6 7 8 9 10
Extremely Dissatisfied Extremely Satisfied
Page 137
127
Commitment
I owe a great deal to <business name>.
1 2 3 4 5
Strongly Disagree Disagree Neutral Agree Strongly Agree
<Business name> helps my business succeed.
1 2 3 4 5
Strongly Disagree Disagree Neutral Agree Strongly Agree
Even if it were to your advantage, I do not feel it would be right to discontinue
doing business with <business name> now.
1 2 3 4 5
Strongly Disagree Disagree Neutral Agree Strongly Agree
If I were to discontinue business with <business name>, I feel there are too few
qualified online vendors to consider.
1 2 3 4 5
Strongly Disagree Disagree Neutral Agree Strongly Agree
If I had not already put so much of myself into working with <business name>, I
might consider doing business elsewhere.
1 2 3 4 5
Strongly Disagree Disagree Neutral Agree Strongly Agree
When I buy from <business name>, I feel like <business name> partners with me
to get the job done.
1 2 3 4 5
Strongly Disagree Disagree Neutral Agree Strongly Agree
Page 138
128
Brand Image
I feel confident when buying from <business name>.
1 2 3 4 5
Strongly Disagree Disagree Neutral Agree Strongly Agree
<Business name> helps me solve problems.
1 2 3 4 5
Strongly Disagree Disagree Neutral Agree Strongly Agree
<Business name> has a reputation for integrity.
1 2 3 4 5
Strongly Disagree Disagree Neutral Agree Strongly Agree
Even in turbulent times, I can trust that <business name> will be there for me.
1 2 3 4 5
Strongly Disagree Disagree Neutral Agree Strongly Agree
All <business name> customers are treated the same regardless of how much they
buy.
1 2 3 4 5
Strongly Disagree Disagree Neutral Agree Strongly Agree
Page 139
129
Loyalty
How likely are you to recommend <business name> to other colleagues?
1 2 3 4 5
Definitely Will Will Not May or May Not Will Definitely Will
Not Recommend Recommend Recommend Recommend Recommend
How likely are you to conduct business with <business name>in the future?
1 2 3 4 5
Definitely Will Will Not May or May Not Will Definitely Will
Not Recommend Recommend Recommend Recommend Recommend
Page 140
130
Engagement - Example Questions
On <business name website> I invest effort to find products desired.
1 2 3 4 5
Strongly Disagree Disagree Neutral Agree Strongly Agree
I am excited when visiting <business name website>.
1 2 3 4 5
Strongly Disagree Disagree Neutral Agree Strongly Agree
When I have extra time, I feel like viewing featured content, stories, and articles
on <business name website>.
1 2 3 4 5
Strongly Disagree Disagree Neutral Agree Strongly Agree
I am content when searching intensely on <business name website>.
1 2 3 4 5
Strongly Disagree Disagree Neutral Agree Strongly Agree
I am proud of the work <business name> carries out.
1 2 3 4 5
Strongly Disagree Disagree Neutral Agree Strongly Agree
When searching for a product, I always know the brand or model number for the
products I want.
1 2 3 4 5
Strongly Disagree Disagree Neutral Agree Strongly Agree
To me, shopping on <business name website> can sometimes be challenging.
1 2 3 4 5
Strongly Disagree Disagree Neutral Agree Strongly Agree
Page 141
131
When searching for a product, I evaluate several products before making a
purchase.
1 2 3 4 5
Strongly Disagree Disagree Neutral Agree Strongly Agree
On <business name website>, I try several searches for a product when things do
not go well.
1 2 3 4 5
Strongly Disagree Disagree Neutral Agree Strongly Agree
Page 142
132
Demographics
Which of the following categories best describes your age?
1 Less than 18 years old
2 18 to 24
3 25 to 34
4 35 to 44
5 45 to 54
6 55 to 64
7 65 and over
How often do you visit <business name website> during non-work hours?
1 Never
2 Less than once a year
3 Once a year
4 A couple of times a year
5 Monthly
6 Weekly
7 Daily
Page 143
133
Which of the following best describes your primary job responsibilities?
1 Executive, Owner, or Officer
2 Department or Group Manager
3 Supervisor
4 Purchasing Agent
5 Technician
6 Contractor
7 Administrative
8 Sales Personnel
9 Engineer
10 Other