An Introduction to Clinical Trials: Design Issues Edgar R Miller III PhD, MD Welch Center for Prevention, Epidemiology and Clinical Research Johns Hopkins University School of Medicine and Bloomberg School of Public Health 2 Type of Studies • Non-experimental (Observational) – Case report – Case series – Cross-sectional (survey) – Case-control – Prospective, observational (cohort) • Experimental – Randomized, clinical trial (RCT) 3 Study designs • Observational studies: – Observe both exposures and outcomes • Experimental studies (clinical trials) – Assign exposures – Observe outcomes 4 Advantages of Clinical Trials • Often provides the strongest evidence in support of cause-effect relationships • Basis for clinical and public health policy • Minimize/eliminate bias and confounding
Transcript
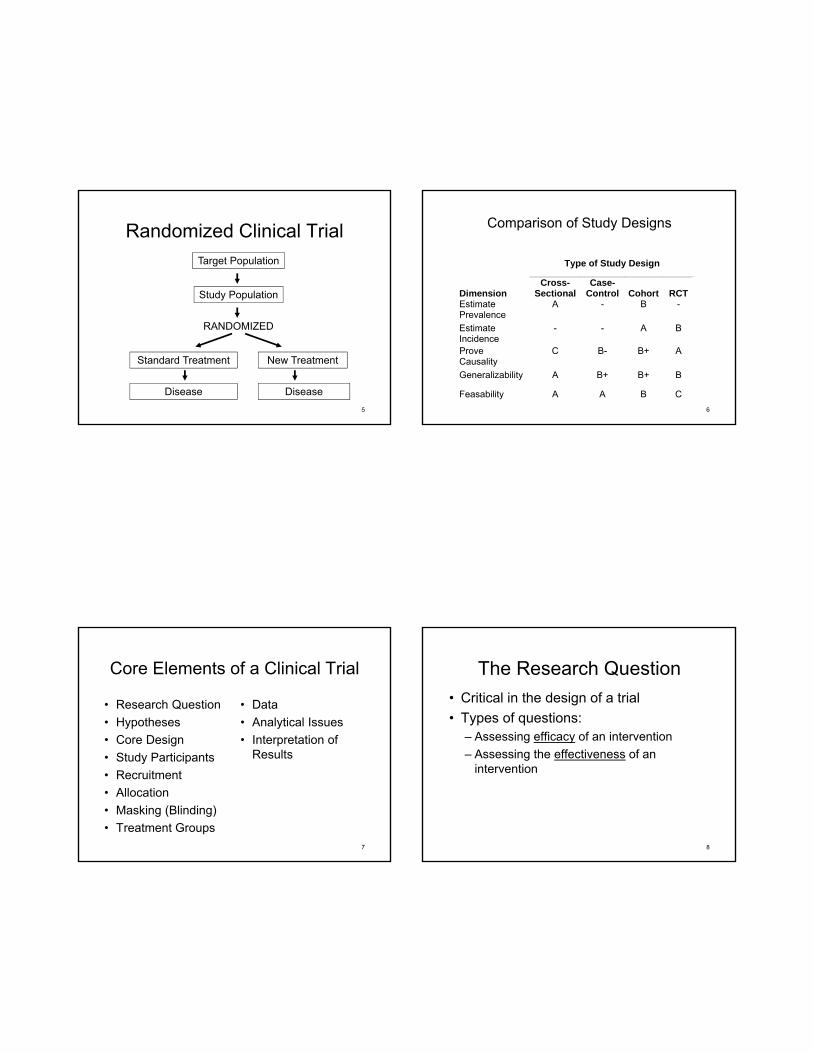
An Introduction to Clinical Trials:Design Issues
Edgar R Miller III PhD, MD
Welch Center for Prevention, Epidemiology and Clinical Research
Johns Hopkins University
School of Medicine and Bloomberg School of Public Health
2
Type of Studies
• Non-experimental (Observational)– Case report– Case series– Cross-sectional (survey)– Case-control– Prospective, observational (cohort)
• Experimental– Randomized, clinical trial (RCT)
3
Study designs
• Observational studies: – Observe both exposures and outcomes
Main Clinical Composite OutcomeDeclining GFR Event, ESRD, or Death
%w
ith
Eve
nts
Metoprolol vs. Amlodipine:RR= 20%, p=0.17 Ramipril vs. Amlodipine: RR= 38%, p=0.004
MetoprololRamiprilAmlodipine
0
5
10
15
20
25
30
35
40
Follow-up Month0 6 12 18 24 30 36 42 48 54 60
RR = Risk Reduction
Ramipril vs. Metoprolol
RR = 22%, p = 0.042
RR = Risk Reduction, Adjusting for Baseline Covariates
27
Study Participants
Target Population
Accessible Population
Study Samples
28
Study Participants: Example
• Target Population -> Healthy Elderly
• Accessible Population -> Retired Teachers
• Study Sample -> Volunteer Teachers who respond to mass mailing
29
Study Participants
• Ideal ‘Accessible’ Population– high risk for disease
– candidates for treatment
– representative of target population
– feasibility considerations• recruitment
• follow-up
• high quality data
30
Enrollment Criteria
• Inclusion Criteria– characteristics of accessible population
• Exclusion Criteria– considerations related to:
• adherence to therapy
• follow-up
• safety
• ethics
31
Common Recruitment Strategies
• General mailings– Licensed drivers– Voters– Employee paychecks
• Targeted mailings– HMO enrollees– AARP members
• Mass media– Radio– TV ads– Newspapers– Posters/flyers
• Screenings– Worksite– Community
• Physician Referral• Medical Record Review• Internet / WWW
– Clinical trial registries– Banner ads– Social networks
32
Comments on Recruitment
• Recruitment begins with design
• Response rate is always lower than expected
• Required resources are more than expected
• Dedicated personnel are necessary
33
More Comments on Recruitment
• Recruitment period is often longer than expected
• Implement several strategies to identify best source
• Prepare back-up strategies
• Monitor recruitment– Early
– Often
– Locally
34
Recruitment “Funnel”(Example: VITAL Pilot Study)
4,774 Mailed Invitations
2,034 Questionnaires Returned
765 Interested After Initial Mailing
323 Randomizable after Second Mailing (7% cumulative)
297 Randomized
43%
38%
41%
35
Allocation
• Random– stratified
– blocked
• Non-Random– haphazard
– systematic
36
Why randomize?
• Two critical reasons:– to eliminate selection BIAS
– to reduce/avoid CONFOUNDING from known and, more importantly, unknown confounders
37
Masking (Blinding)
• Single Blind– Observers (persons who collect outcome
variable) do not know treatment assignment
• Double Blind– Study participants AND observers do not know
treatment assignments
• Triple Blind– Data interpreters, study participants, and
observers do not know treatment assignments 38
Masking (Blinding)
Single Masked
Double Masked
Triple Masked
Outcome Assessor(s)
X X X
Participant X X
Data Interpreter
X
39
Selection of Groups
• Active Treatment Group
• Comparison Group– Placebo (no active therapy)
– Usual care (referral back to personal MD)
– Active control group (provision of standard therapy)
40
Problems with selecting active treatment group
• Many Candidate treatments – observation studies, animal models, or
theoretically based
• Strong evidence rarely exists to guide selection of intervention
• Dose/intensity are uncertain
41
Comparison Group
• Placebo – used in setting of:– No standard therapy OR
– Standard therapy but risk of not providing it is minimal
• Usual care OR active control – common
42
Problems with standard of care approach
• Efficacy of ‘Usual care’ often not tested
• Variations in standard of care are common:– across providers
– between experts and providers
– secular trends occur
43
Data
• Baseline data– Determine eligibility
– Describe study participants
– Define subgroups
– Address confounding
• Measures of Adherence
• Outcome Variables
44
Outcome Variables
• Principal outcome– most important variable after
randomization code– specified in hypothesis– determinant of sample size
• Secondary Outcomes– relevant to research question
45
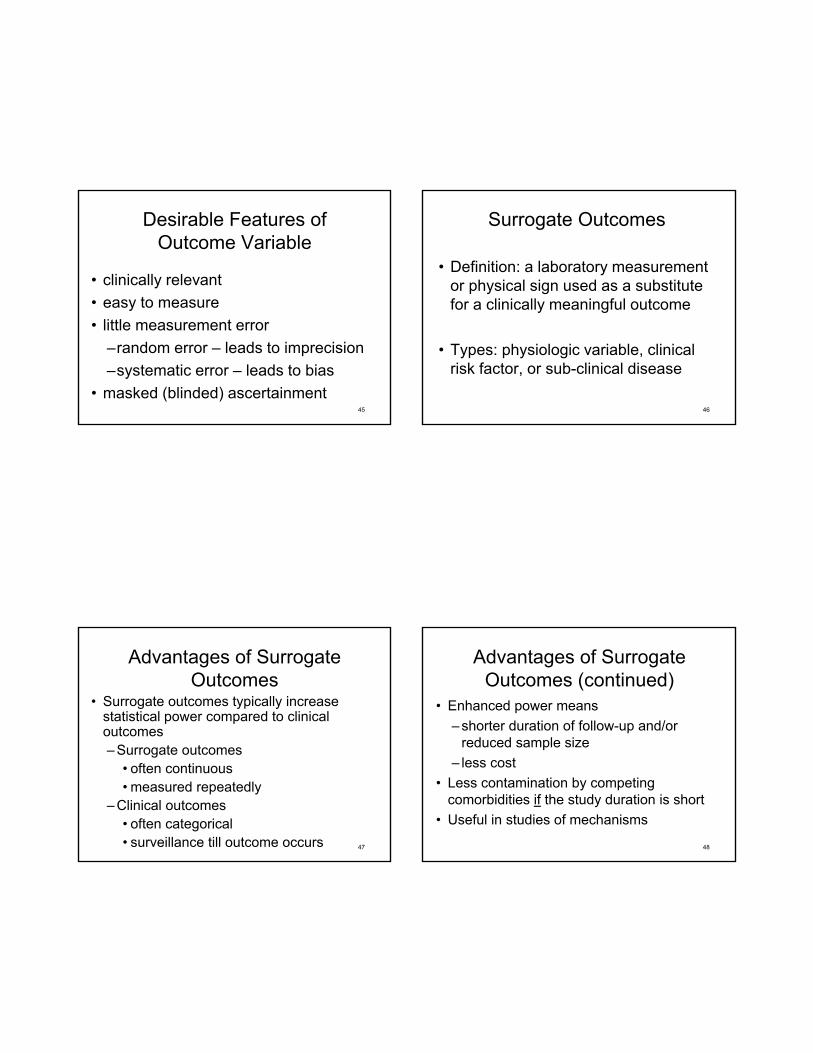
Desirable Features of Outcome Variable
• clinically relevant
• easy to measure
• little measurement error
–random error – leads to imprecision
–systematic error – leads to bias
• masked (blinded) ascertainment46
Surrogate Outcomes
• Definition: a laboratory measurement or physical sign used as a substitute for a clinically meaningful outcome
• Types: physiologic variable, clinical risk factor, or sub-clinical disease
47
Advantages of Surrogate Outcomes
• Surrogate outcomes typically increase statistical power compared to clinical outcomes– Surrogate outcomes
• often continuous• measured repeatedly
– Clinical outcomes• often categorical• surveillance till outcome occurs 48
Advantages of Surrogate Outcomes (continued)
• Enhanced power means
– shorter duration of follow-up and/or reduced sample size
– less cost
• Less contamination by competing comorbidities if the study duration is short
• Useful in studies of mechanisms
Surrogate and clinical outcomes: a continuum
Total Mortality
Cause-Specific Mortality
Morbid Events
Established Risk Factor
Antecedent of the Risk
Factor
Surrogate and clinical outcomes: an example
Total Mortality
CVD Mortality
MIBlood Pressure
Weight Angina
Relationship between Surrogate and Clinical Outcomes
Surrogate Outcome
Relationship between Change in Surrogate Outcome and Change
in Clinical Outcomes
Change in Surrogate Outcome
Clinical and Surrogate Outcomes: Cardiovascular
Clinical Surrogate
Stroke Ultrasound measurement of intimal medial thickness of the carotid artery
Blood pressure
Myocardial infarction
Quantitative coronary angiography
Electron beam computerzied tomography
Sudden death
Ventricular arrhythmia
Heart failure Ejection fraction
Weaknesses
Disadvantages of Surrogate Outcomes
• Measurement of surrogate outcomes can involve complex, technical procedures– procedures sometimes new (therefore,
longitudinal data is scant)– procedures become obsolete– many technical and analytic issues, often
unapparent
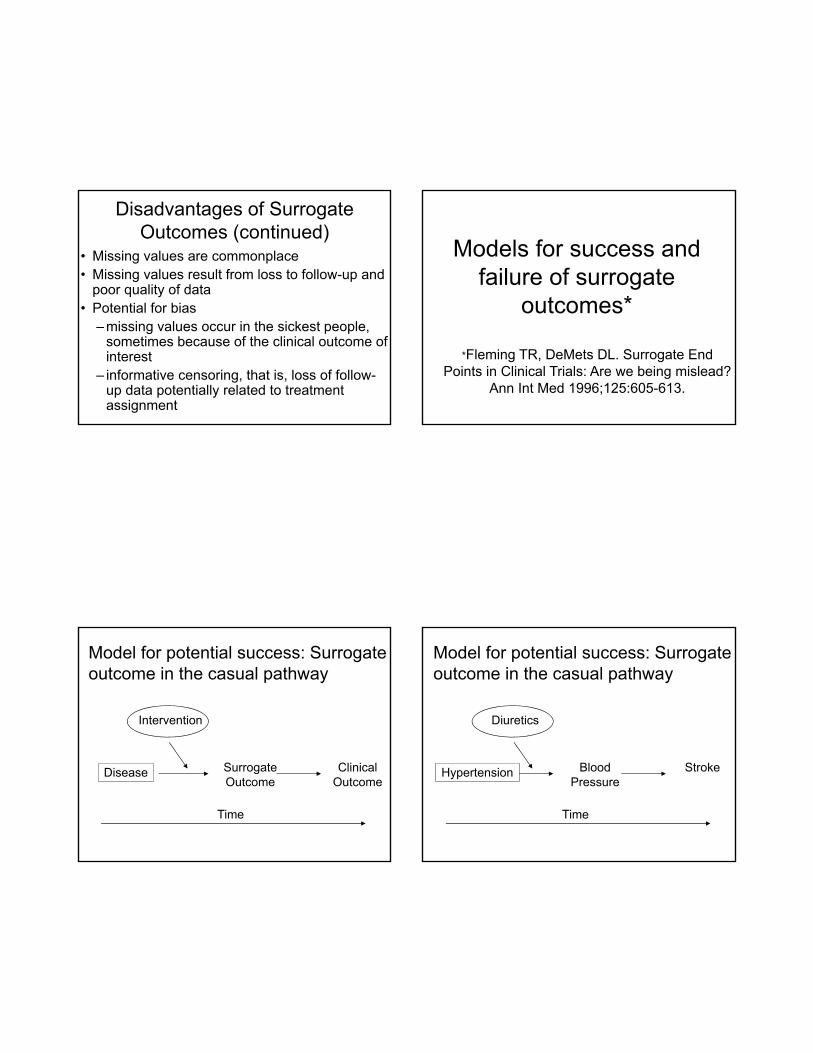
Disadvantages of Surrogate Outcomes (continued)
• Missing values are commonplace• Missing values result from loss to follow-up and
poor quality of data• Potential for bias
– missing values occur in the sickest people, sometimes because of the clinical outcome of interest
– informative censoring, that is, loss of follow-up data potentially related to treatment assignment
Models for success and failure of surrogate
outcomes*
*Fleming TR, DeMets DL. Surrogate End Points in Clinical Trials: Are we being mislead?
Ann Int Med 1996;125:605-613.
Model for potential success: Surrogate outcome in the casual pathway
Disease Surrogate Outcome
Clinical Outcome
Intervention
Time
Model for potential success: Surrogate outcome in the casual pathway
Hypertension Blood Pressure
Stroke
Diuretics
Time
Model for failure: the surrogate is not in the causal pathway of the disease process
Surrogate Outcome Clinical
OutcomeDisease
Intervention
Model for failure: the surrogate is not in the causal pathway of the disease process
Bone Density
fracturesOsteoporosis
Fluoride
Disease
Surrogate Outcome
Clinical Outcome
Intervention
Model for failure: the intervention affects only the pathway mediated through the surrogate
Kidney Damage
ProteinuriaKidney Failure
Protein Restriction
Model for failure: the intervention affects only the pathway mediated through the surrogate
Model for failure: The intervention has several mechanisms of action
Surrogate Outcome
Clinical Outcome
Intervention
Disease
Example: Dihydropyridine calcium channel blockers
Blood Pressure
Myocardial Infarction
Calcium Channel Blockers
ASCVD
+_
The Cardiac Arrhythmia Suppression Trial (CAST*): Background
• Ventricular arrhythmias are a risk factor for sudden death after MI
• Four fold higher risk of cardiac mortality among persons with frequent premature ventricular contractions (PVCs)
• In the CAST pilot study, the antiarrhythmic drugs (encainide, flecainide) suppressed PVCs
*Echt DS et al. Mortality and morbidity in patients receiving encainide, flecainide, or placebo. NEJM 1991: 324(12): 781-8.
CAST Research Question
Does suppression of ventricular ectopy after a MI reduce the incidence of sudden death?
CAST Design
• Design: randomized trials of– encainide vs placebo– flecainide vs placebo
• Participants (n=1498)– recent MI (6 days to 2 years ago)– ventricular ectopy (6 or more PVCs /hr)– at least 80% suppression of PVCs by
active drug during open label titration period prior to randomization
Source: Echt DS, Liebson PR, Mitchell B, et al. Mortality and morbidity in patients receiving encainide, flecainide, or placebo. The Cardiac Arrhythmia Suppression
Trial. NEJM 1991: 324(12): 781-8.
CAST results: number of deaths and cardiac arrests by group
• Participants: 121,700 female nurses free of diagnosed cardiovascular disease
• Exposure Dietary questionnaire at baseline
Assessment Vitamin E and Multivitamin Use
• Follow-up: 8 years
• End Points: 1) Major Coronary Disease
2) Non-fatal MI
3) Deaths Due to Coronary Disease
N Engl J Med 1993;328:1444-1449
N Engl J Med 1993;328:1444-1449Adapted from: Jha, P. et. al. Ann Intern Med 1995;123:860-872
Prospective observational studies of vitamin E: Effects on cardiovascular end points
Summary of Biological Evidence
• Antioxidants are necessary
• Oxidized lipids are associated with CVD
• Oxidation of lipids is reduced by antioxidant supplementation
• Does supplementation lower risk of CVD?– Observational studies– trials
Do Vitamin E supplements reduce risk?
• Observational studies are confounded –vitamin E takers exercise more, have a lower BMI, eat healthier diets and smoke less often that non-vitamin users
• Observational studies are hypothesis generating
• Surrogate markers are only indirectly related to clinical events
• Benefits can only be assessed in randomized controlled clinical trials