Page 1
Wayne State University
Wayne State University Theses
1-1-2014
An Investigation Of Kinetic Effects Of SplitInjection Timing On Low TemperatureCombustionTejaswini A. KambleWayne State University,
Follow this and additional works at: http://digitalcommons.wayne.edu/oa_theses
Part of the Other Mechanical Engineering Commons
This Open Access Thesis is brought to you for free and open access by DigitalCommons@WayneState. It has been accepted for inclusion in WayneState University Theses by an authorized administrator of DigitalCommons@WayneState.
Recommended CitationKamble, Tejaswini A., "An Investigation Of Kinetic Effects Of Split Injection Timing On Low Temperature Combustion" (2014).Wayne State University Theses. Paper 305.
Page 2
AN INVESTIGATION OF KINETIC EFFECTS OF SPLIT INJECTION TIMING ON LOW
TEMPERATURE COMBUSTION
by
TEJASWINI A. KAMBLE
THESIS
Submitted to the Graduate School
of Wayne State University,
Detroit, Michigan
in partial fulfillment of the requirements
for the degree of
MASTER OF SCIENCE
2014
MAJOR: MECHANICAL ENGINEERING
Approved by:
Advisor Date
Page 3
© COPYRIGHT BY
TEJASWINI A. KAMBLE
2014
All Rights Reserved
Page 4
ii
DEDICATION
I dedicate this work to my beloved parents, Snehalata A. Kamble and A. S. Kamble.
Page 5
iii
ACKNOWLEDGEMENTS
I would like to express my special appreciation and thanks to my advisor Professor Dr.
Marcis Jansons for giving me the opportunity to work in his Low Temperature Combustion
Laboratory and also as Graduate Teaching Assistant for the course Fluid Mechanics. His constant
support, patience and encouragement have always motivated me throughout my master thesis and
graduate studies at Wayne State University. I greatly appreciate the time and effort he spent with
me to analyze the data and sharing his profound knowledge during my thesis.
I am grateful to Dr. Naeim Henein and Dr. Dinu Taraza for letting me to be the part of their
Center for Automotive Research during my graduate studies. I am obliged to Dr. Henein for sharing
his wealth of knowledge related to internal combustion engines. I am also thankful to Mechanical
Engineering Department Chair Dr. Walter Bryzik and Graduate Advisor Dr. Trilochan Singh for
giving me an opportunity to be the part of this friendly and exciting academic environment.
I thank my lab mates- Kan Zha, Xin Yu, Jinqiao Wang, Alex Davidson and Xi Luo. It was a
great learning experience for me to work with them in the LTC lab. I am also grateful to my friends
for their support and motivation throughout my master’s degree.
Finally, I want to thank my family for their relentless support and encouragement on every
step towards completion of my studies and helping me to be where I am today.
Page 6
iv
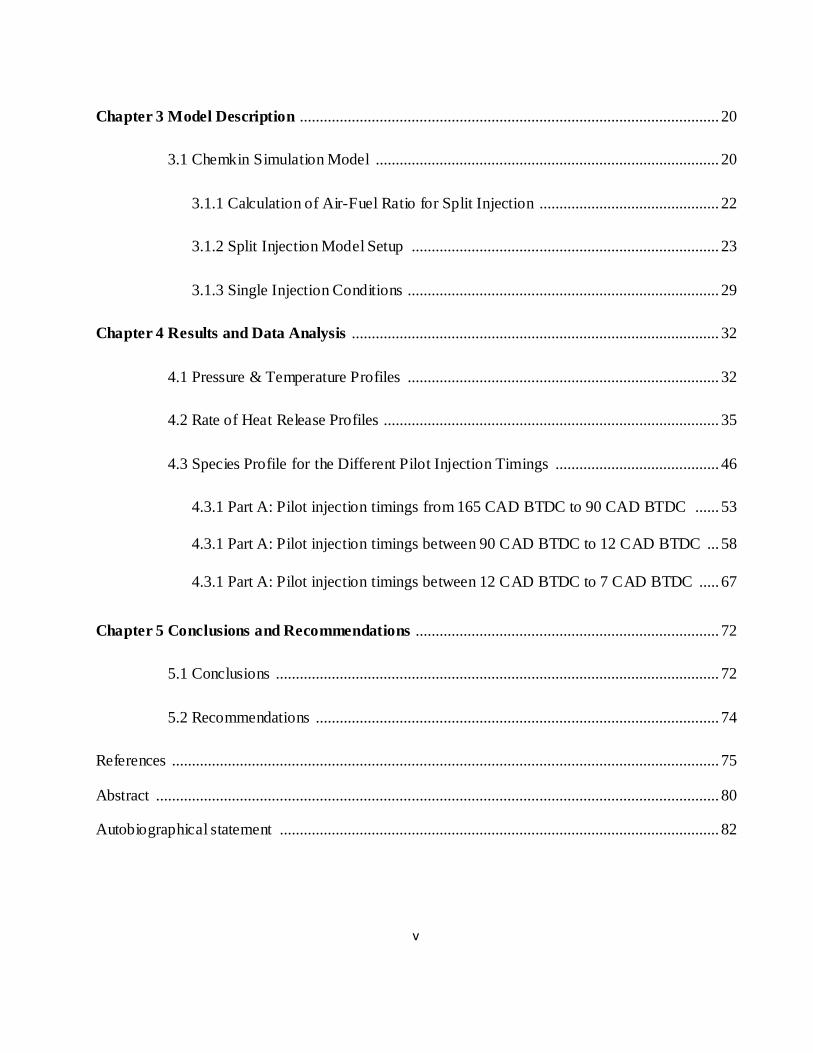
TABLE OF CONTENTS
Dedication .............................................................................................................................................ii
Acknowledgements .............................................................................................................................. iii
List of tables.........................................................................................................................................vi
List of figures ...................................................................................................................................... vii
List of symbols & abbreviations .......................................................................................................... x
Chapter 1 INTRODUCTION ........................................................................................................... 1
1.1 Overview ...................................................................................................................... 1
1.2 Advanced Combustion Strategies ............................................................................... 2
1.3 Objective of present research ...................................................................................... 4
Chapter 2 Literature Review ............................................................................................................ 5
2.1 Low Temperature Combustion .................................................................................... 5
2.2 Conceptual LTC combustion model ........................................................................... 7
2.3 LTC in Φ-T space ....................................................................................................... 8
2.4 Fuel Considerations .................................................................................................. 10
2.5 Autoignition in LTC ................................................................................................. 11
2.6 Effect of Initial Temperature & Pressure .................................................................. 14
2.7 Effect of Injection Timing and Multiple Injections .................................................. 15
2.8 Effect of Chemical Species ....................................................................................... 17
Page 7
v
Chapter 3 Model Description ......................................................................................................... 20
3.1 Chemkin Simulation Model ...................................................................................... 20
3.1.1 Calculation of Air-Fuel Ratio for Split Injection ............................................. 22
3.1.2 Split Injection Model Setup ............................................................................. 23
3.1.3 Single Injection Conditions .............................................................................. 29
Chapter 4 Results and Data Analysis ............................................................................................ 32
4.1 Pressure & Temperature Profiles .............................................................................. 32
4.2 Rate of Heat Release Profiles .................................................................................... 35
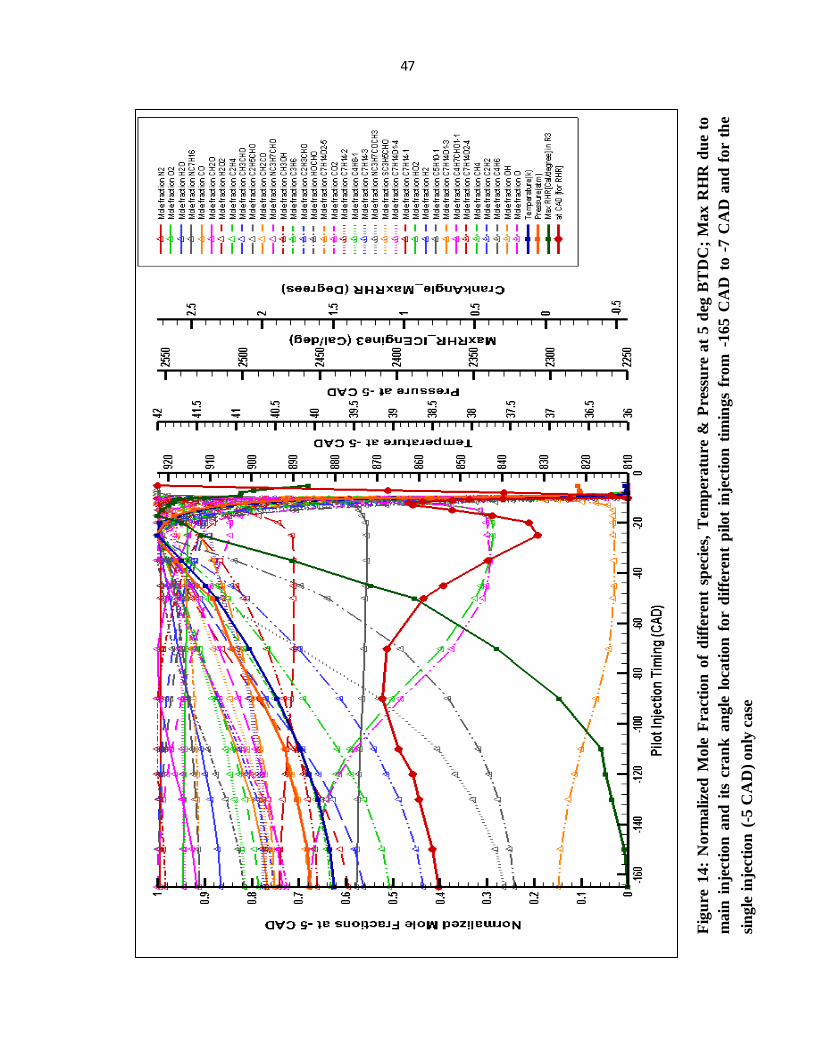
4.3 Species Profile for the Different Pilot Injection Timings ......................................... 46
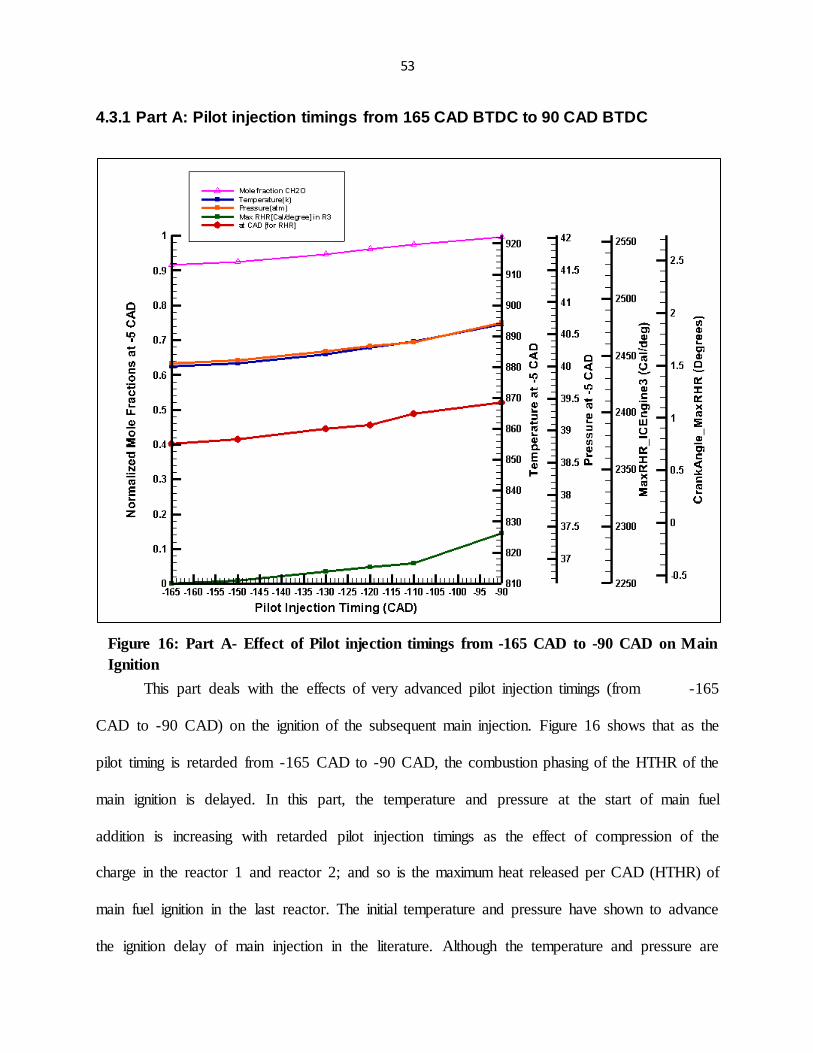
4.3.1 Part A: Pilot injection timings from 165 CAD BTDC to 90 CAD BTDC ...... 53
4.3.1 Part A: Pilot injection timings between 90 CAD BTDC to 12 CAD BTDC ... 58
4.3.1 Part A: Pilot injection timings between 12 CAD BTDC to 7 CAD BTDC ..... 67
Chapter 5 Conclusions and Recommendations ............................................................................ 72
5.1 Conclusions ............................................................................................................... 72
5.2 Recommendations ..................................................................................................... 74
References ......................................................................................................................................... 75
Abstract ............................................................................................................................................. 80
Autobiographical statement .............................................................................................................. 82
Page 8
vi
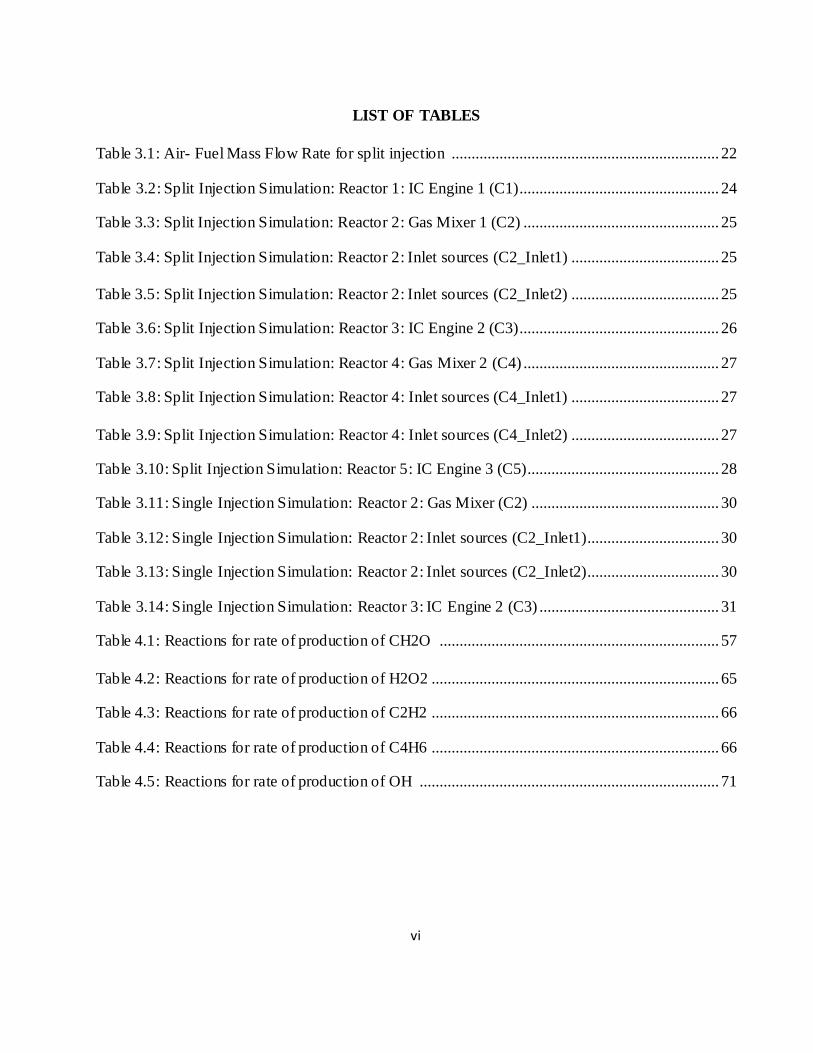
LIST OF TABLES
Table 3.1: Air- Fuel Mass Flow Rate for split injection ................................................................... 22
Table 3.2: Split Injection Simulation: Reactor 1: IC Engine 1 (C1).................................................. 24
Table 3.3: Split Injection Simulation: Reactor 2: Gas Mixer 1 (C2) ................................................. 25
Table 3.4: Split Injection Simulation: Reactor 2: Inlet sources (C2_Inlet1) ..................................... 25
Table 3.5: Split Injection Simulation: Reactor 2: Inlet sources (C2_Inlet2) ..................................... 25
Table 3.6: Split Injection Simulation: Reactor 3: IC Engine 2 (C3).................................................. 26
Table 3.7: Split Injection Simulation: Reactor 4: Gas Mixer 2 (C4) ................................................. 27
Table 3.8: Split Injection Simulation: Reactor 4: Inlet sources (C4_Inlet1) ..................................... 27
Table 3.9: Split Injection Simulation: Reactor 4: Inlet sources (C4_Inlet2) ..................................... 27
Table 3.10: Split Injection Simulation: Reactor 5: IC Engine 3 (C5)................................................ 28
Table 3.11: Single Injection Simulation: Reactor 2: Gas Mixer (C2) ............................................... 30
Table 3.12: Single Injection Simulation: Reactor 2: Inlet sources (C2_Inlet1)................................. 30
Table 3.13: Single Injection Simulation: Reactor 2: Inlet sources (C2_Inlet2)................................. 30
Table 3.14: Single Injection Simulation: Reactor 3: IC Engine 2 (C3) ............................................. 31
Table 4.1: Reactions for rate of production of CH2O ...................................................................... 57
Table 4.2: Reactions for rate of production of H2O2 ........................................................................ 65
Table 4.3: Reactions for rate of production of C2H2 ........................................................................ 66
Table 4.4: Reactions for rate of production of C4H6 ........................................................................ 66
Table 4.5: Reactions for rate of production of OH ........................................................................... 71
Page 9
vii
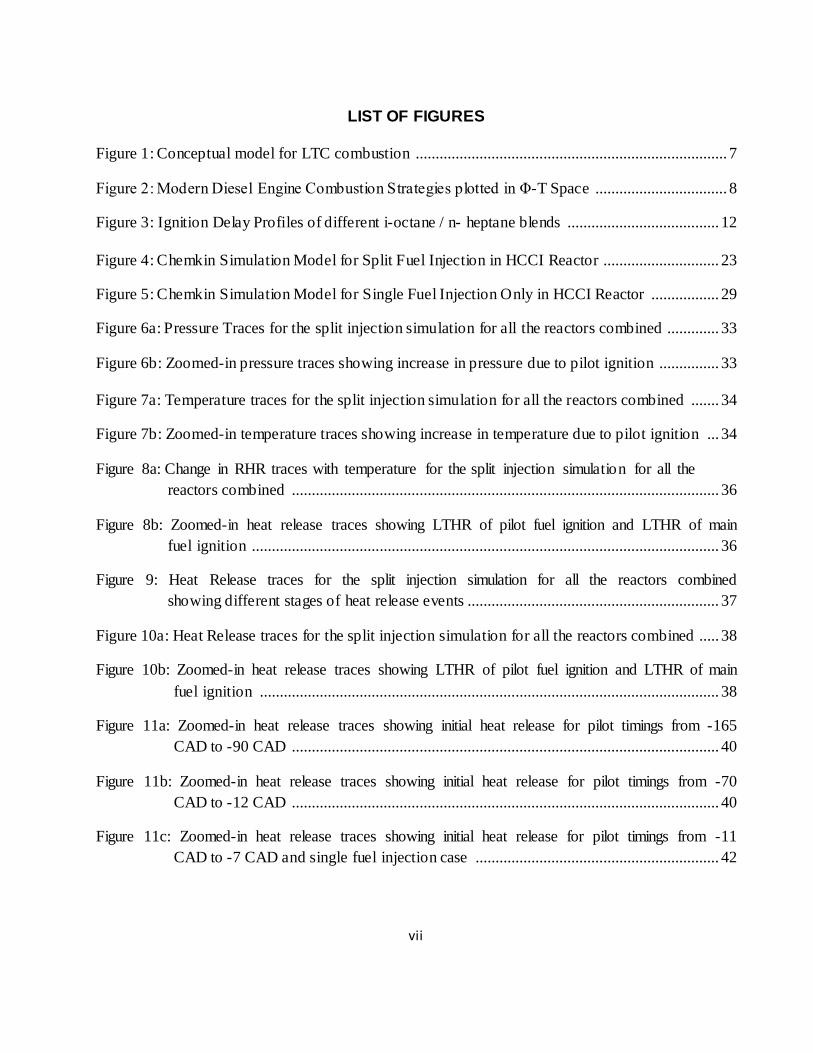
LIST OF FIGURES
Figure 1: Conceptual model for LTC combustion .............................................................................. 7
Figure 2: Modern Diesel Engine Combustion Strategies plotted in Φ-T Space ................................. 8
Figure 3: Ignition Delay Profiles of different i-octane / n- heptane blends ...................................... 12
Figure 4: Chemkin Simulation Model for Split Fuel Injection in HCCI Reactor ............................. 23
Figure 5: Chemkin Simulation Model for Single Fuel Injection Only in HCCI Reactor ................. 29
Figure 6a: Pressure Traces for the split injection simulation for all the reactors combined ............. 33
Figure 6b: Zoomed-in pressure traces showing increase in pressure due to pilot ignition ............... 33
Figure 7a: Temperature traces for the split injection simulation for all the reactors combined ....... 34
Figure 7b: Zoomed-in temperature traces showing increase in temperature due to pilot ignition ... 34
Figure 8a: Change in RHR traces with temperature for the split injection simulation for all the
reactors combined ........................................................................................................... 36
Figure 8b: Zoomed-in heat release traces showing LTHR of pilot fuel ignition and LTHR of main
fuel ignition ..................................................................................................................... 36
Figure 9: Heat Release traces for the split injection simulation for all the reactors combined
showing different stages of heat release events ............................................................... 37
Figure 10a: Heat Release traces for the split injection simulation for all the reactors combined ..... 38
Figure 10b: Zoomed-in heat release traces showing LTHR of pilot fuel ignition and LTHR of main
fuel ignition ................................................................................................................... 38
Figure 11a: Zoomed-in heat release traces showing initial heat release for pilot timings from -165
CAD to -90 CAD ........................................................................................................... 40
Figure 11b: Zoomed-in heat release traces showing initial heat release for pilot timings from -70
CAD to -12 CAD ........................................................................................................... 40
Figure 11c: Zoomed-in heat release traces showing initial heat release for pilot timings from -11
CAD to -7 CAD and single fuel injection case ............................................................. 42
Page 10
viii
Figure 12: Relation between net heat release rate per CAD and HO2 mole fraction for pilot injection
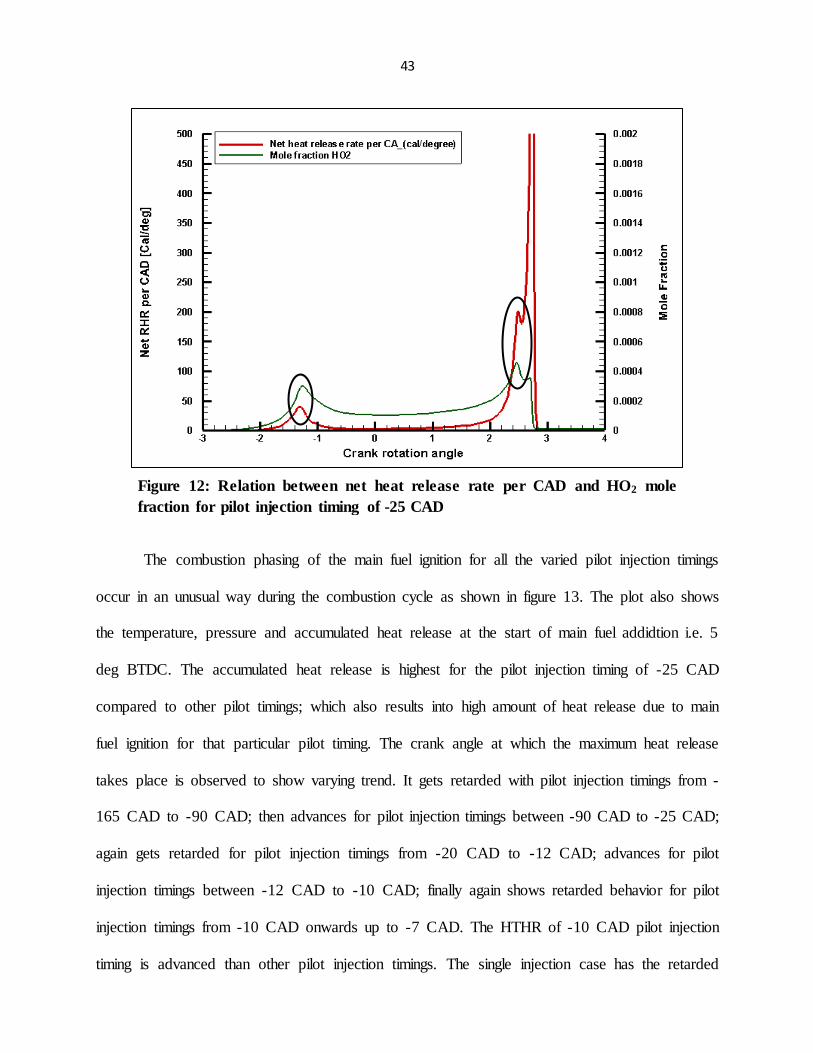
timing of -25 CAD .......................................................................................................... 43
Figure 13: Temperature, Pressure and accumulated heat release at 5 deg BTDC; Max RHR due to main fuel ignition and its crank angle location for different pilot injection timings from -165 CAD to -7 CAD and for the single injection (-5 CAD) only case........................... 45
Figure 14: Normalized Mole Fraction of different species, Temperature & Pressure at 5 deg BTDC;
Max RHR due to main injection and its crank angle location for different pilot injection timings from -165 CAD to -7 CAD and for the single injection (-5 CAD) only case ..... 47
Figure 14a: Change in Normalized Mole Fraction of N2, O2, H2O, NC7H16 and CO2 for different pilot injection timings and single fuel injection case ................................................... 48
Figure 14b: Change in Normalized Mole Fraction of CO, CH2O, H2O2, C2H4, CH3CHO and C2H5CHO for different pilot injection timings and single fuel injection case ............. 48
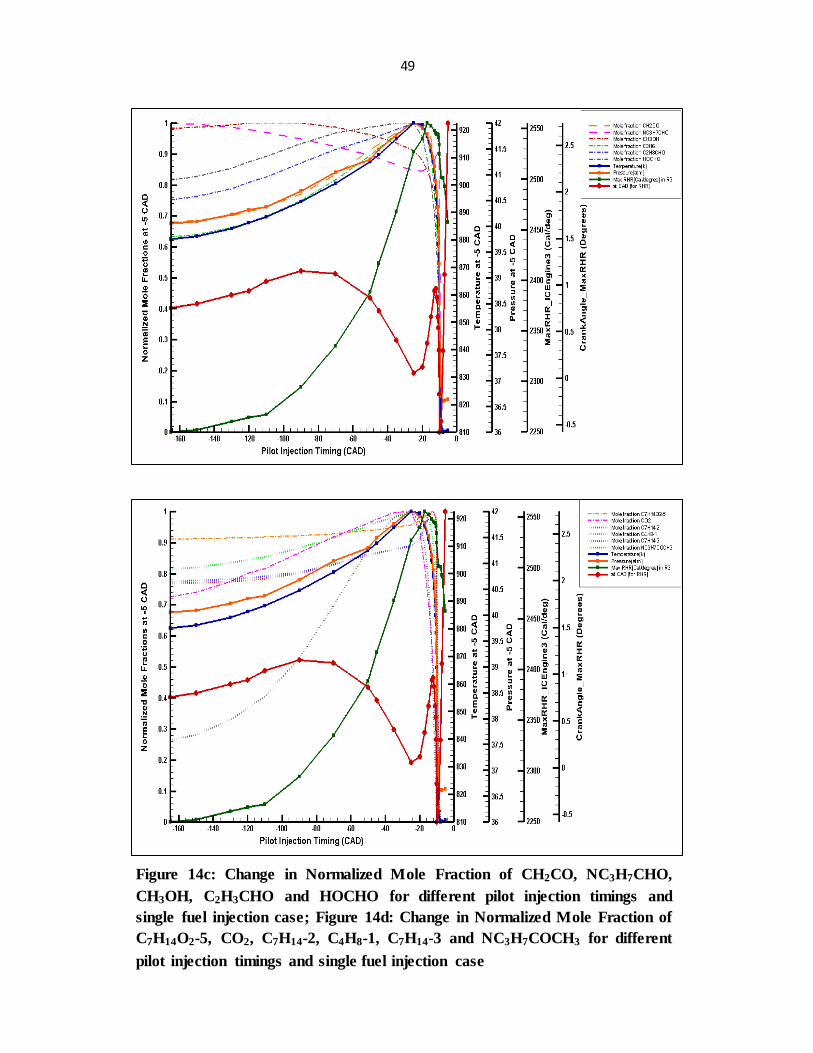
Figure 14c: Change in Normalized Mole Fraction of CH2CO, NC3H7CHO, CH3OH, C2H3CHO and HOCHO for different pilot injection timings and single fuel injection case ................. 49
Figure 14d: Change in Normalized Mole Fraction of C7H14O2-5, CO2, C7H14-2, C4H8-1, C7H14-3 and NC3H7COCH3 for different pilot injection timings and single fuel injection
case ............................................................................................................................... 49
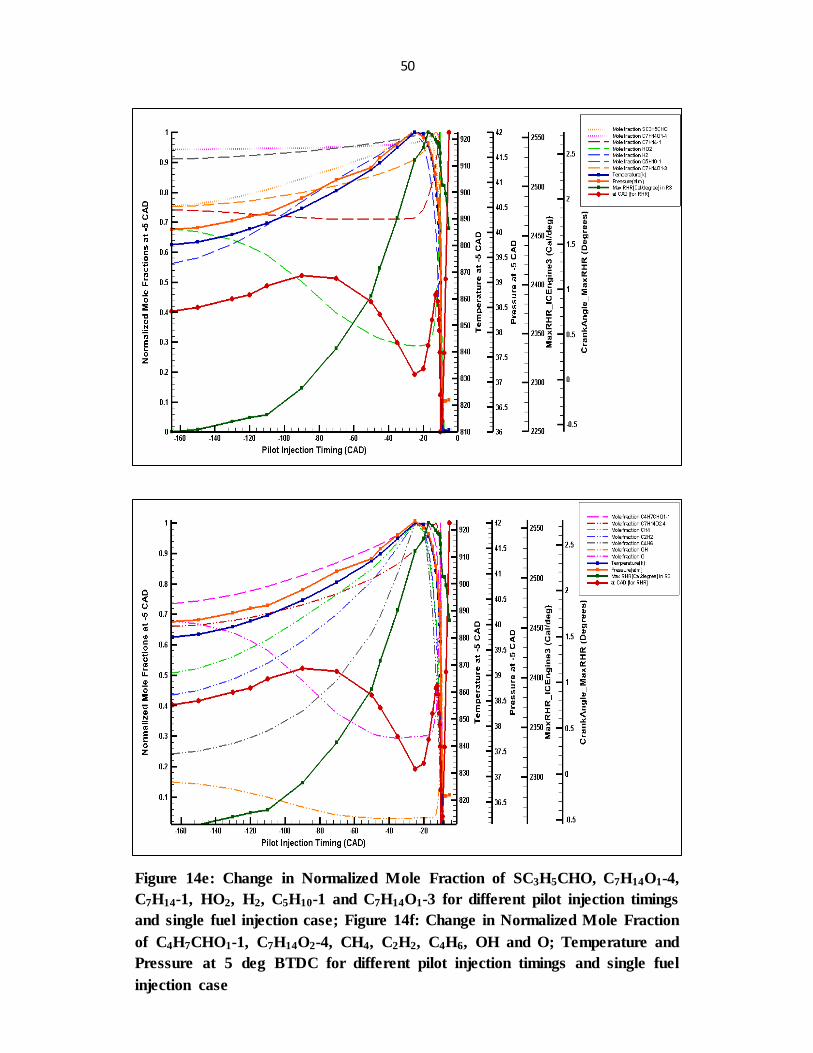
Figure 14e: Change in Normalized Mole Fraction of SC3H5CHO, C7H14O1-4, C7H14-1, HO2, H2, C5H10-1 and C7H14O1-3 for different pilot injection timings and single fuel injection case................................................................................................................................ 50
Figure 14f: Change in Normalized Mole Fraction of C4H7CHO1-1, C7H14O2-4, CH4, C2H2, C4H6,
OH and O; Temperature and Pressure at 5 deg BTDC for different pilot injection timings and single fuel injection case............................................................................. 50
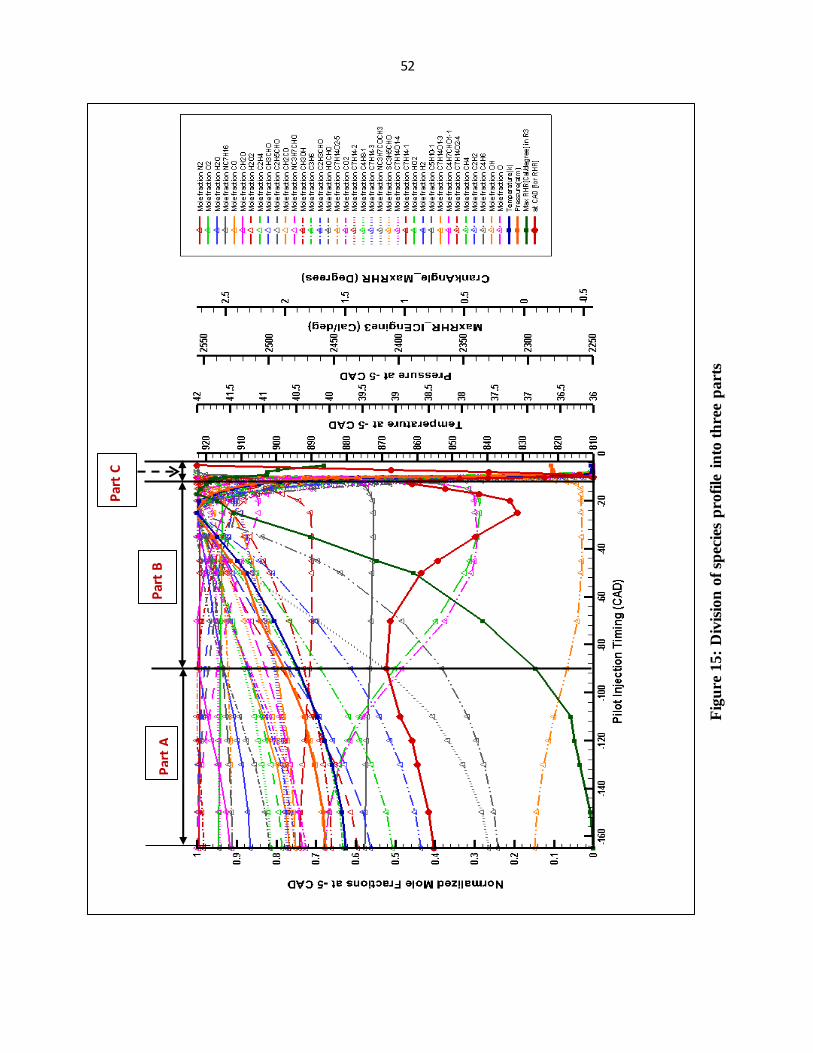
Figure 15: Division of species profile into three parts ...................................................................... 52
Figure 16: Part A- Effect of Pilot injection timings from -165 CAD to -90 CAD on Main Ignition 53
Figure 17: Chemkin Model to Study the Effect of formaldehyde (CH2O) on Ignition Delay of Main
Fuel Ignition .................................................................................................................... 55
Figure 18: Effect of formaldehyde (CH2O) on ignition delay of main ignition ............................... 55
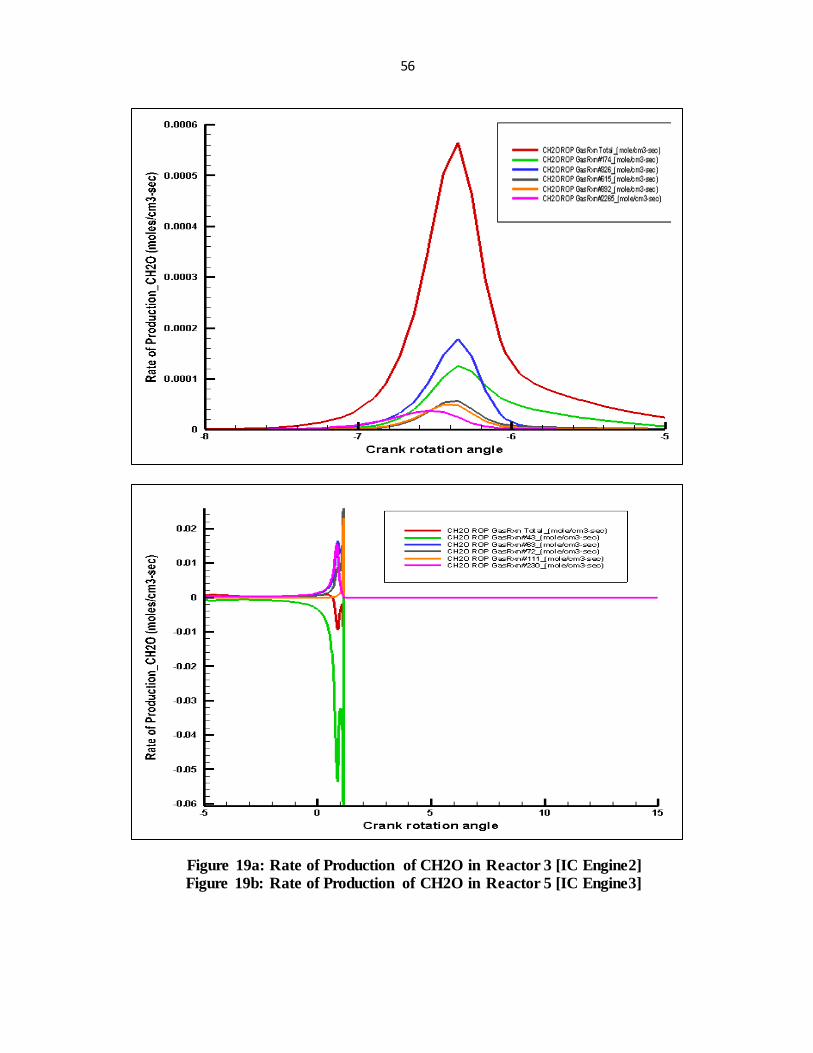
Figure 19a: Rate of Production of CH2O in Reactor 3 [IC Engine2]................................................ 56
Figure 19b: Rate of Production of CH2O in Reactor 5 [IC Engine3] ............................................... 56
Page 11
ix
Figure 20: Part B- Effect of Pilot injection timings between -90 CAD to -12 CAD on Main Ignition
.......................................................................................................................................... 59
Figure 20a: Effect of H2O2 on ignition delay of main ignition ......................................................... 60
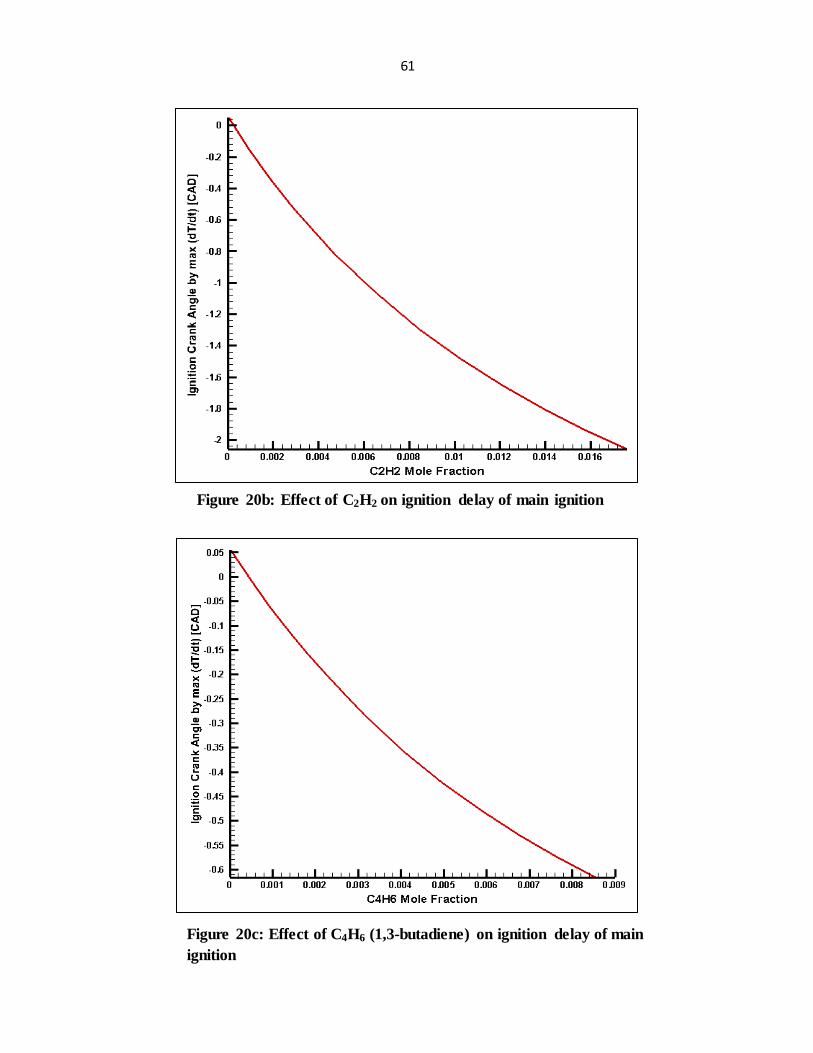
Figure 20b: Effect of C2H2 on ignition delay of main ignition ......................................................... 61
Figure 20c: Effect of C4H6 (1,3-butadiene) on ignition delay of main ignition ............................... 61
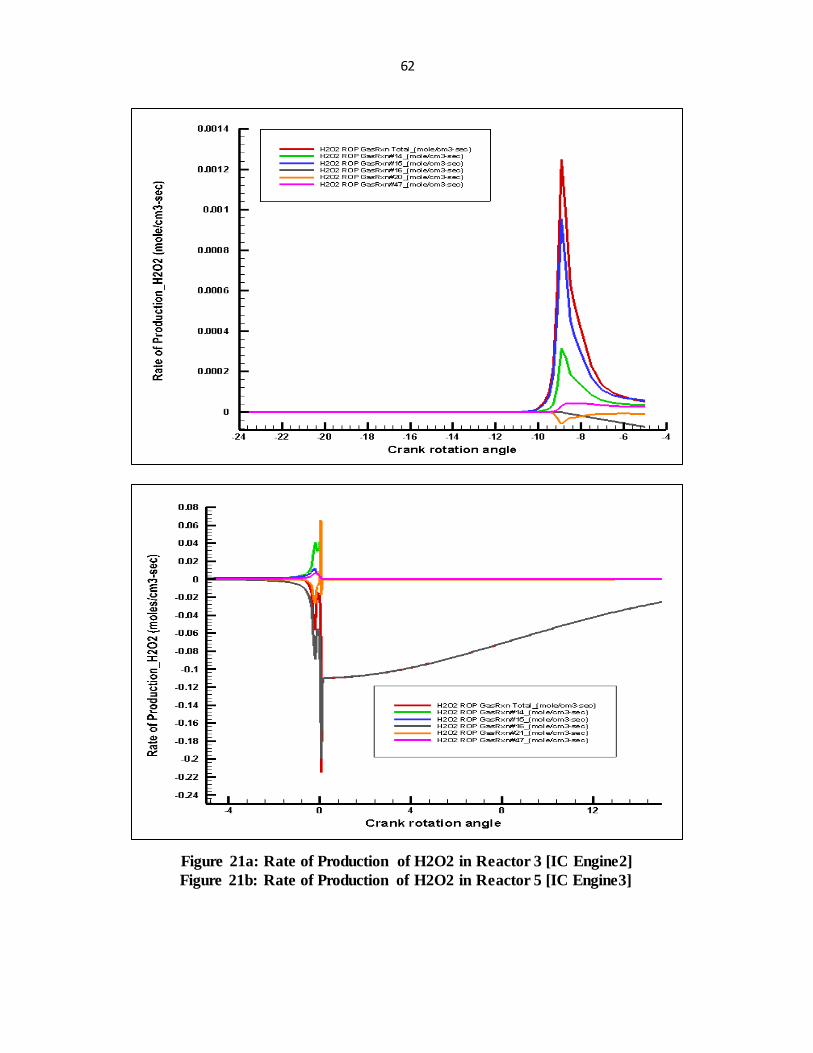
Figure 21a: Rate of Production of H2O2 in Reactor 3 [IC Engine2] ................................................ 62
Figure 21b: Rate of Production of H2O2 in Reactor 5 [IC Engine3] ................................................ 62
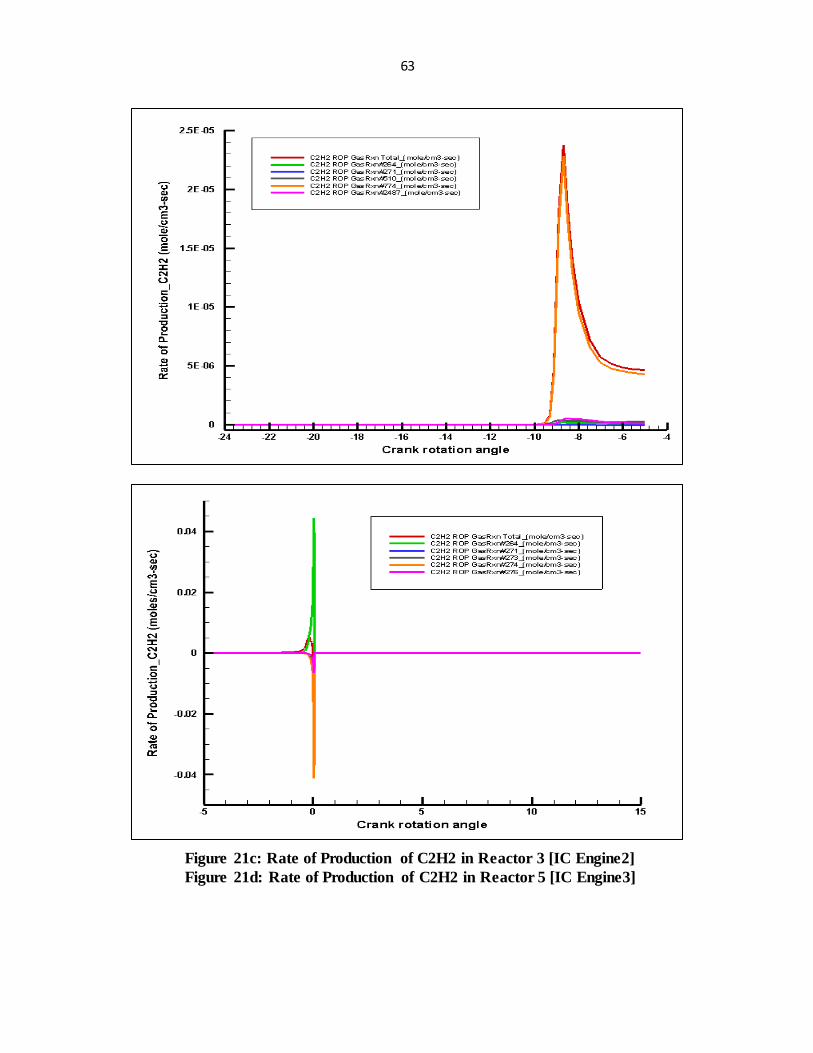
Figure 21c: Rate of Production of C2H2 in Reactor 3 [IC Engine2]................................................. 63
Figure 21d: Rate of Production of C2H2 in Reactor 5 [IC Engine3] ................................................ 63
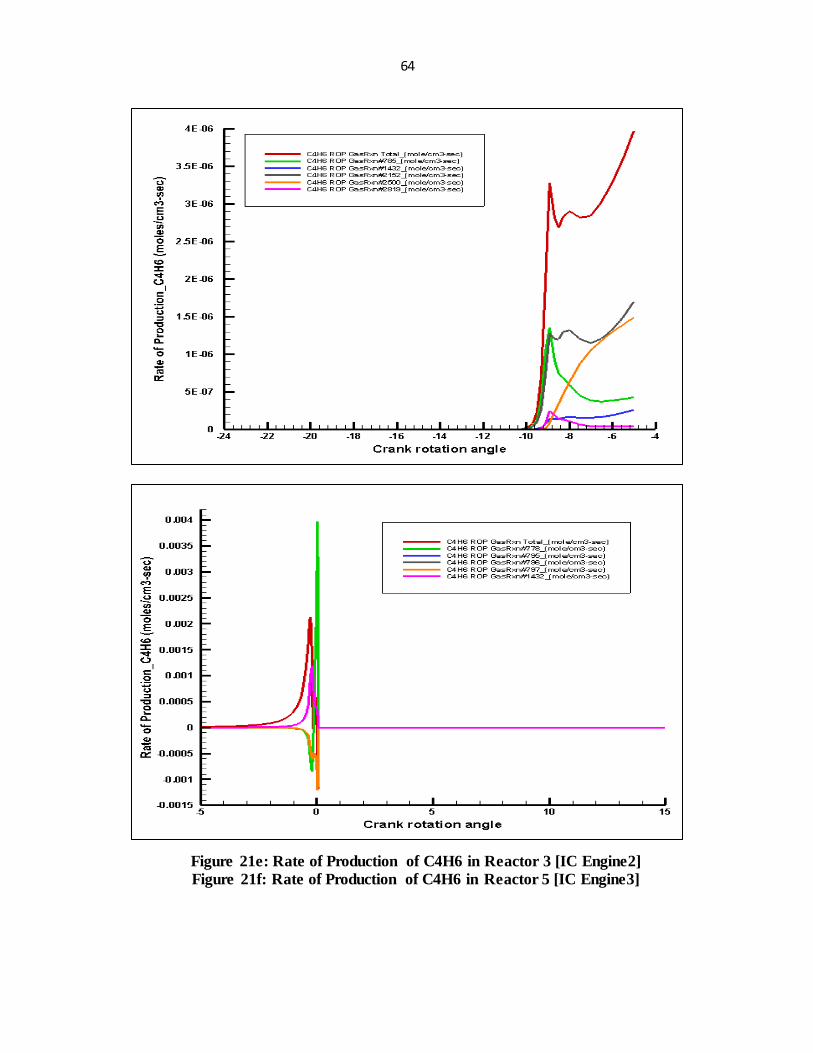
Figure 21e: Rate of Production of C4H6 in Reactor 3 [IC Engine2]................................................. 64
Figure 21f: Rate of Production of C4H6 in Reactor 5 [IC Engine3] ................................................. 64
Figure 22: Part C- Effect of Pilot injection timings from -12 CAD to -5 CAD on Main Ignition ... 68
Figure 23: Temperature parameter study in CVC ............................................................................. 69
Figure 24a: Rate of Production of OH in Reactor 3 [IC Engine2] .................................................... 70
Figure 24b: Rate of Production of OH in Reactor 5 [IC Engine3] .................................................... 70
Page 12
x
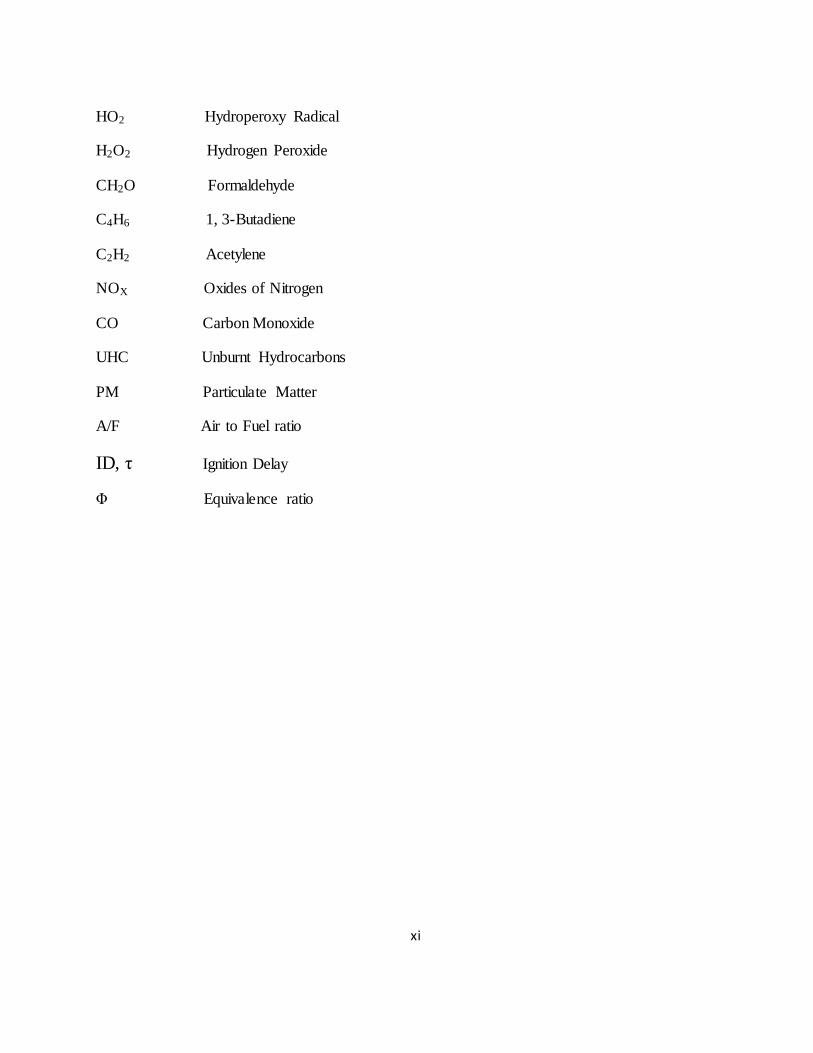
LIST OF SYMBOLS AND ABBREVIATIONS
ATDC After top dead center
BTDC Before top dead center
CAD Crank angle degree, degrees
EGR Exhaust gas recirculation
IMEP Indicated mean effective pressure, bar
LTC Low temperature combustion
NTC Negative Temperature Coefficient Regime
RHR Rate of Heat Release
LTHR Low Temperature Heat Release
ITHR Intermediate Temperature Heat Release
HTHR High Temperature Heat Release
RPM Revolutions per minute
TDC Top dead center
HCCI Homogeneous Charge Compression Ignition
RCCI Reactivity-Controlled Compression Ignition
PCCI Premixed Charge Compression Ignition
NC7H16 N-Heptane
O2 Oxygen
N2 Nitrogen
CO2 Carbon Dioxide
H2O Water
OH Hydroxy Radical
Page 13
xi
HO2 Hydroperoxy Radical
H2O2 Hydrogen Peroxide
CH2O Formaldehyde
C4H6 1, 3-Butadiene
C2H2 Acetylene
NOX Oxides of Nitrogen
CO Carbon Monoxide
UHC Unburnt Hydrocarbons
PM Particulate Matter
A/F Air to Fuel ratio
ID, τ Ignition Delay
Φ Equivalence ratio
Page 14
1
CHAPTER 1
INTRODUCTION
1.1 Overview:
The diesel engine, invented in the late 19th century by Dr. Rudolf Diesel, is one of the
most widely used engines among other types of internal combustion engines in use today. This
energy efficient engine delivers good fuel economy and low greenhouse gas emissions. It is also
well known for its reliability and durability characteristics. Since its beginning, the diesel engine
has been used in a wide variety of sectors from transportation to energy generation. It is the most
popular propulsion source for trucks, buses, ships, off road vehicles and other heavy duty
applications. They are also used in electric generating plants for power generation. Recently, it
has started gaining popularity among light duty applications too due to its various benefits.
Despite the advantages offered by a diesel engine, they have certain shortcomings like
high nitric oxides (NOX) and particulate matter (PM) emissions followed by increased noise and
finally high cost. The current focus is to achieve the stringent emission levels set by the
government and to minimize the disadvantages of the diesel engine.
As a result of the introduction of the stringent diesel emission standards, a lot of different
technologies are being used to control the harmful pollutants emitted by a diesel engine. This has
led to the use of after treatment systems such as catalytic converter and diesel particulate filter.
Although it has helped to cut emissions to a certain extent, it has also increased the total cost of
the diesel engine. Since the combustion of the fuel plays a major role in the engine performance,
fuel consumption as well as emission of pollutants, a lot of effort is being made to understand the
diesel combustion process.
Page 15
2
1.2 Advanced Combustion Strategies:
In an effort to improve the diesel engine performance and emissions, advanced
combustion strategies are being researched which could help us to meet the tough emission
regulations, minimize the need of the after treatment systems and decrease their cost and
complexity. The advanced combustion strategies being explored are pre-, post- and in-cylinder
combustion approaches [1] as follows:
The pre-combustion approach includes the use of alternative fuels. The primary concern
of this approach is the modification of the molecular composition of the fuel, its aromatic
content, the cetane number or the oxygen content in order to reduce the NOX and PM emissions.
On the other hand, post-combustion strategies include the improvement of after treatment
technologies for emission reduction. The after treatment systems in use today are Three Way
Catalyst (TWC) for NOX, CO and unburned hydrocarbons (UHC) reduction; Selective Catalytic
Reduction (SCR) for the NOX reduction; and the Diesel Particulate Filter for the PM emission
reductions of the engine exhaust. However, these systems depend on various parameters like
exhaust gas temperature, total pollutant concentration, exhaust flow rate and the volume of the
filters etc., which can affect their performance.
The in-cylinder approach deals with the improvement of the combustion process in the
engine itself by using different methods such as Exhaust Gas Recirculation (EGR), split-
injection, varying swirl ratio, charge air cooling, controlling injection timings and combustion
chamber design. Since there are no additional systems being added to the engine assembly, this
strategy makes the overall system less complex and cost effective compared to other strategies.
The main goal here is to modify the in-cylinder combustion process in order to make the engine
user and environment friendly. This in-cylinder approach, though very promising demands
meaningful understanding of the combustion mechanism. The in depth study of the underlying
Page 16
3
chemical kinetics and its interaction with the fluid flow might contribute towards the
development of this strategy.
The in-cylinder advanced combustion strategy that has been the subject of considerable
research recently is the Low Temperature Combustion concept [2]. This is a general term used to
address a number of advanced combustion strategies like Homogeneous Charge Compression
Ignition (HCCI), Premixed Charge Compression Ignition and reactivity controlled compression
ignition (RCCI). This concept has great potential of achieving high thermal efficiencies along
with reducing NOX and PM emissions simultaneously, but it often results in increased carbon
monoxide (CO) and hydrocarbon (HC) emissions. Since these emissions as well as the
performance of engines utilizing the LTC approach greatly depend on the combustion of fuel, it
is very important to study the combustion mechanism of the LTC concept in order to meet the
challenges posed by the Low Temperature Combustion strategy.
The biggest challenge faced by the Low Temperature Combustion concept is the control
of kinetically driven autoignition of the fuel air mixture in the engine over appreciable load
ranges. The high temperature heat release stage of autoignition process is preceded by
comparatively slow chemical reactions of low temperature heat release stage of autoignition.
These chemical changes taking place before high temperature heat release is the main area of
interest as this could help in controlling the autoignition in LTC.
Page 17
4
1.3 Objective of present research:
This work focused on the LTC concept, examines the chemical kinetics of split-injection
timing and the effect of this parameter on combustion phasing and pressure rise rate. Detailed
reaction mechanisms are applied in CHEMKIN-based kinetic simulations to model the
production and composition of combustion intermediates produced by a pilot injection through
different pressure-temperature histories. The influence of these intermediates on the following
main injection is studied. The results will provide insight to the role of pilot injection timing on
LTC control.
Page 18
5
CHAPTER 2
LITERATURE REVIEW
2.1 Low Temperature Combustion
Recent development in the field of diesel technology has been significant. The various
technologies being developed in the pre-, post- and in-cylinder combustion areas have great
potential to improve the diesel performance and emissions. The Low Temperature Combustion
(LTC) concept is one such advanced in-cylinder combustion strategy which is undergoing
considerable research. LTC is being considered as the future technology for diesel engines. This
high efficiency combustion approach has the ability to lower the NOX and PM emissions
simultaneously.
The aim of Low Temperature Combustion is to attain high levels of fuel efficiency with
almost no regulated harmful emissions. As the name implies, this approach works at low
combustion temperature with the intention of favorably altering the NOX and soot formation
chemistry. They burn cool enough and lean enough to stay out of the NOX and soot formation
zones without compromising the thermal efficiency. This concept has many variants such as
Homogeneous Charge Compression Ignition (HCCI), Premixed Charge Compression Ignition
(PCCI), and Reactivity-Controlled Compression Ignition (RCCI) [3].
Homogeneous Charge Compression Ignition (HCCI) is a fusion of traditional diesel
(stratified charge compression ignition) and gasoline (homogeneous charge spark ignition)
engines. In HCCI, the goal is to attain a homogeneous mixture of fuel and air well before the
combustion process, as in SI engines. This can be made possible by early injection of the fuel in
the intake port or directly into the combustion chamber and allowing sufficient time between the
injection and ignition event to allow complete mixing of air and fuel. This mixture undergoes
Page 19
6
compression and thus auto ignites as in CI engines. Thus it burns instantaneously throughout,
without the hot flame front of SI combustion or the locally rich flame front of CI combustion.
There is no explicit control over the combustion event in an HCCI engine; therefore various
conditions like temperature, compression ratio, residual exhaust gas, and air/fuel ratio that induce
combustion can be adjusted throughout the engine cycle to attain desired combustion behavior.
However, the difficulty in controlling combustion phasing still remains.
Premixed Charge Compression Ignition (PCCI), also called as partially premixed charge
compression ignition (PPCI), is a variant of HCCI that focuses on controlling the combustion
event by injecting a late fuel pulse in the compression stroke that commands the start of ignition.
The intake air is partially premixed with early fuel pulse to create HCCI like conditions in which
then the late fuel pulse is injected at or near TDC in an attempt to control the combustion phasing
by letting the combustion occur over an extended period of time compared to the instantaneous
HCCI combustion.
Reactivity-Controlled Compression Ignition (RCCI) aims to gain more control over
combustion phasing by using multiple injections of various fuels at scheduled intervals. This
provides control over the reactivity of the charge in the cylinder for optimal combustion duration
and magnitude. A relatively low reactivity fuel is injected early in the engine cycle and mixes
homogeneously with the air, which is followed by injection of a higher reactivity fuel later into
the cylinder. This leads to pockets of differing A/F ratios and reactivity causing the combustion
to occur at different points at varying rates.
Page 20
7
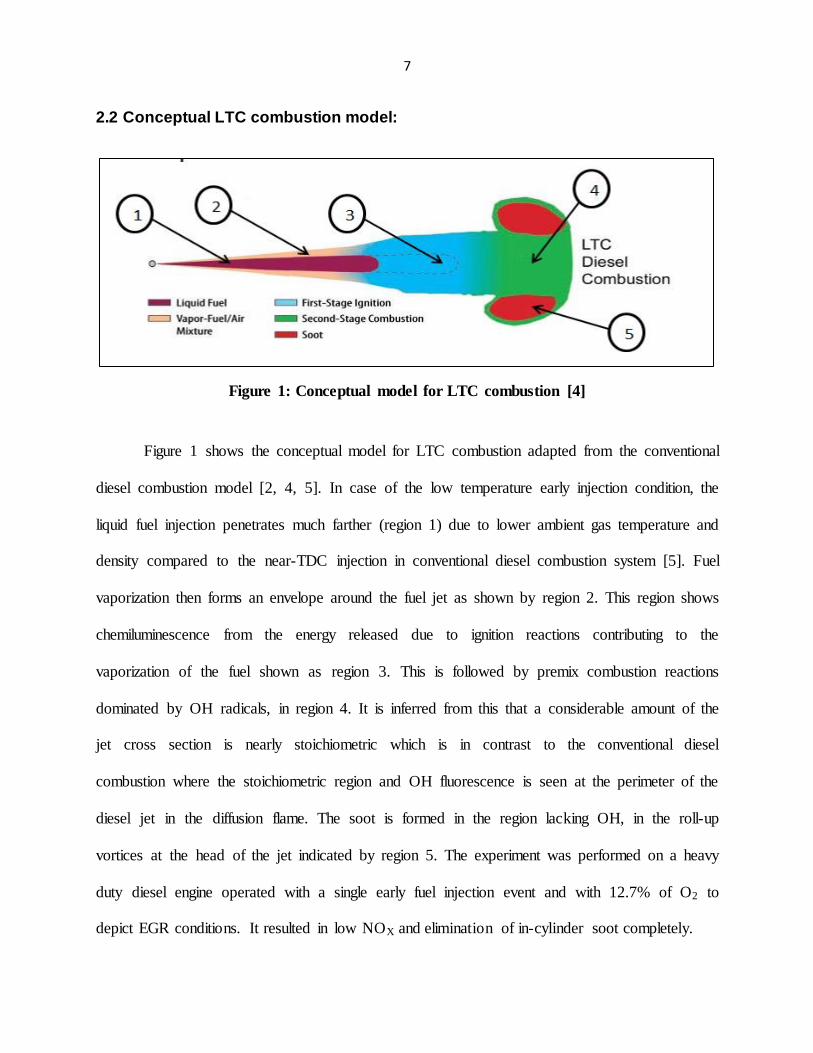
2.2 Conceptual LTC combustion model:
Figure 1 shows the conceptual model for LTC combustion adapted from the conventional
diesel combustion model [2, 4, 5]. In case of the low temperature early injection condition, the
liquid fuel injection penetrates much farther (region 1) due to lower ambient gas temperature and
density compared to the near-TDC injection in conventional diesel combustion system [5]. Fuel
vaporization then forms an envelope around the fuel jet as shown by region 2. This region shows
chemiluminescence from the energy released due to ignition reactions contributing to the
vaporization of the fuel shown as region 3. This is followed by premix combustion reactions
dominated by OH radicals, in region 4. It is inferred from this that a considerable amount of the
jet cross section is nearly stoichiometric which is in contrast to the conventional diesel
combustion where the stoichiometric region and OH fluorescence is seen at the perimeter of the
diesel jet in the diffusion flame. The soot is formed in the region lacking OH, in the roll-up
vortices at the head of the jet indicated by region 5. The experiment was performed on a heavy
duty diesel engine operated with a single early fuel injection event and with 12.7% of O2 to
depict EGR conditions. It resulted in low NOX and elimination of in-cylinder soot completely.
Figure 1: Conceptual model for LTC combustion [4]
Page 21
8
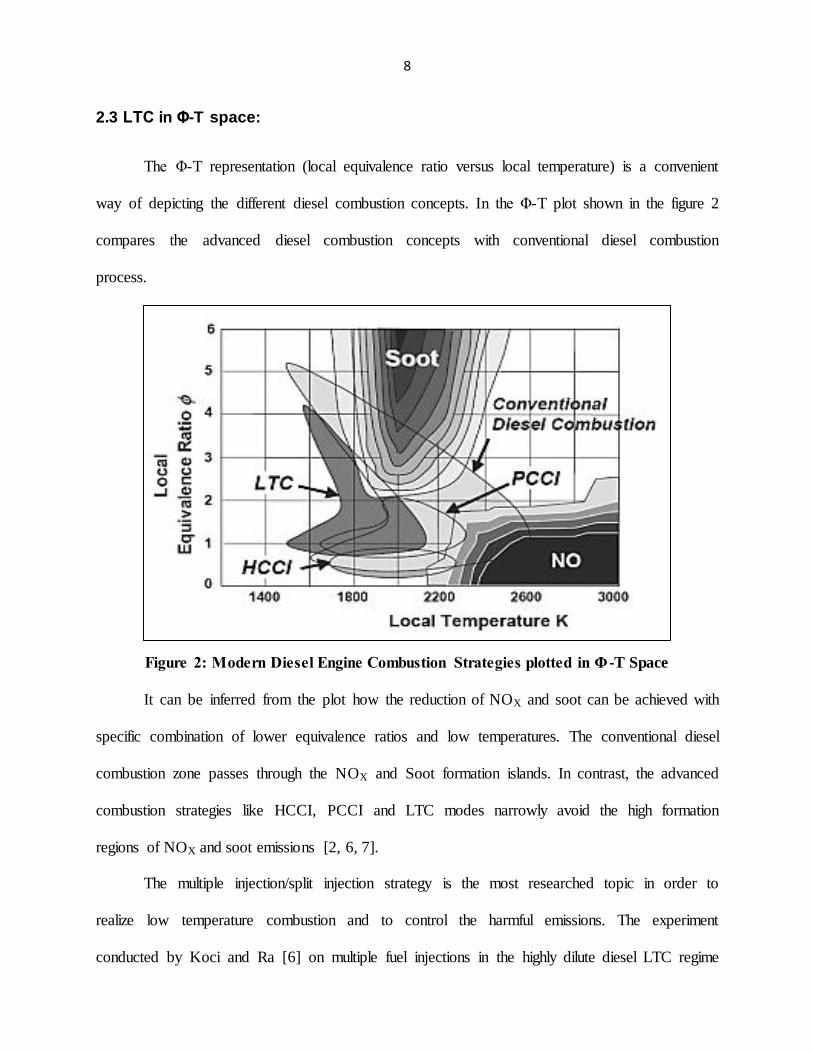
2.3 LTC in Φ-T space:
The Φ-T representation (local equivalence ratio versus local temperature) is a convenient
way of depicting the different diesel combustion concepts. In the Φ-T plot shown in the figure 2
compares the advanced diesel combustion concepts with conventional diesel combustion
process.
It can be inferred from the plot how the reduction of NOX and soot can be achieved with
specific combination of lower equivalence ratios and low temperatures. The conventional diesel
combustion zone passes through the NOX and Soot formation islands. In contrast, the advanced
combustion strategies like HCCI, PCCI and LTC modes narrowly avoid the high formation
regions of NOX and soot emissions [2, 6, 7].
The multiple injection/split injection strategy is the most researched topic in order to
realize low temperature combustion and to control the harmful emissions. The experiment
conducted by Koci and Ra [6] on multiple fuel injections in the highly dilute diesel LTC regime
Figure 2: Modern Diesel Engine Combustion Strategies plotted in Φ -T Space
Page 22
9
showed that optimal split injections are beneficial in reducing the UHC, CO and PM emissions,
and achieved by altering the fuel distribution in the cylinder. In a study at IFP [8], it was found
that a close spaced double injection strategy affects the ignition delay either directly or indirectly
by increasing it which results in improved air-fuel mixture. This helps in optimizing HC and CO
emissions and thus the EGR rate could be reduced at low load points which otherwise require
high EGR ratios.
The study performed by Mendez and Thirouard at IFP [7] on multiple injection strategies
in diesel combustion presented the advantages of using multiple injections (double injection) to
achieve stringent emissions by increasing the ignition delay. They indicated that the increase in
ignition delay leads to longer mixing period thereby resulting in more homogeneous fuel-air
mixture. This results in decrease in equivalence ratio and subsequent soot formation.
In another investigation [9], it was shown that the ignition delay increases with delayed
or retarded second injection timing in the case of double injection leading to low gas temperature
in the chamber. When the fuel is injected into this low temperature region, the high temperature
thermal cracking of diesel fuel is inhibited resulting in low soot. It was also presented in this
study that injection pressure greatly affects emissions in multiple injection strategies. High
injection pressure helps in soot oxidation which is good for its reduction in the late cycle whereas
low injection pressure gives rise to more heterogeneity in the mixture and thus decreases the in-
cylinder bulk temperature thereby reducing the NOX production. The split injection also resulted
in reduction in noise due to distribution of the heat releases of combustion [6-8].
Page 23
10
2.4 Fuel Considerations:
The LTC concept (premixed approach) has been studied using different types of fuels
which include diesel, gasoline, natural gas and other alternative fuels. Although the ideal fuel
depends on various factors like engine design, engine operating conditions and the way LTC is
being implemented [2], the fuel properties such as fuel ignitability or fuel volatility [2, 10] can
have a large impact on the performance and emissions of the LTC engine. In the largely
premixed mode, the combustion takes place only if air and fuel are sufficiently well mixed to
cause the ignition. Thus, how well the fuel and air mix and how easily it ignites are two
important deciding parameters for good & clean engine performance. The thorough mixing of air
and fuel depends on the temperature and fluid flow inside the engine. The ignitability of the fuel
is also important as it uncovers the underlying chemical kinetic characteristics of that fuel when
mixed with air. The fuel structure has important role to play in the control of ignition delay [11].
The presence of the –CH2-CH2-CH2- chain allows the formation of 6-member low strain C-C-C-
O-O-H rings, which exhibits two-stage ignition with reduced ignition delay, which is in
agreement with previous findings. It was seen that these two stage ignition is associated with
isomerization reactions in peroxy radicals. Different fuels were tested in this study which
exhibited two stage ignition with ignition delay increasing in the order: n-heptane < 1-heptene <
methylcyclohexane = 2-heptene < 1,3-cyclohexadiene < 3-heptene < cyclohexane <
cyclohexene < iso-octane < toluene (not ignited).
The fuel ignition characteristics can be modified to control the ignition delay. For
example- the control of ignition timing of n-heptane using port injection of additives acting as
reaction inhibitors was studied in a single cylinder engine under HCCI conditions [12]. The
additives used for suppression of ignition were methanol, ethanol, isopropanol and methyl tert-
Page 24
11
butyl ether (MTBE). The experiment showed that the suppression effectiveness increased in the
order of MTBE < isopropanol < ethanol < methanol. However, ethanol was known to be the best
additive for retarding the ignition timing considering thermal efficiency and emissions at applied
operating ranges.
2.5 Autoignition in LTC:
Autoignition of the fuel plays a major role in the process of combustion in diesel engine
[2, 13]. The LTC concept is one where fuel is premixed with air, and the autoignition occurs
when the fuel-air has formed an optimal homogeneous mixture for the combustion to happen.
This takes relatively long time when compared to conventional diesel combustion. The period
between the start of fuel injection and the start of combustion determined from the rapid pressure
rise in the combustion chamber is known as ignition delay [14, 15]. Once this ignition delay
period is over and the ideal temperature is reached, the mixture autoignites and the subsequent
chemical reactions become very fast and are accompanied by rapid heat release due to the
conversion of reactants to products. Therefore, the ignition delay period is used not only to attain
the homogeneous mixture of air and fuel but also to control the combustion phasing. In general,
the ignition delay time is given by the following Arrhenius expression [2]:
The above expression shows the dependence of ignition delay (τ) on temperature (T). The
values of constants A, n and B depends on the fuel used. This equation can be used to express the
ignition delay at some temperature points but in the intermediate temperature zone, the ignition
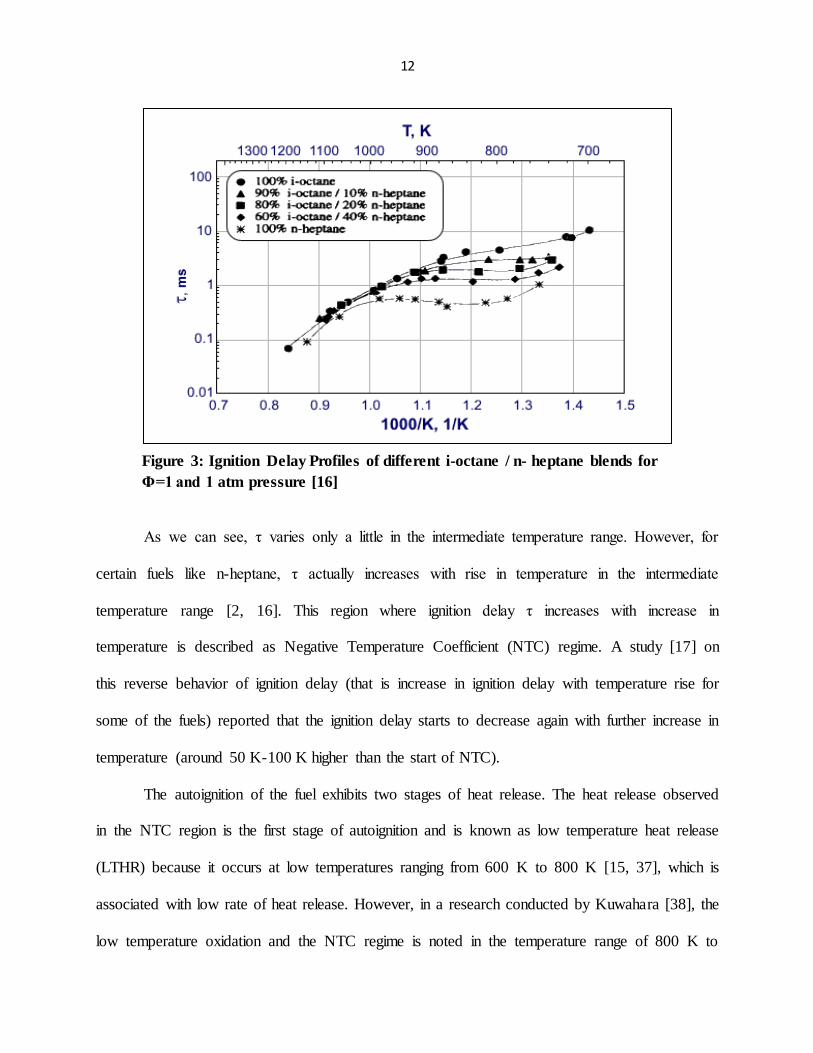
delay varies very little with temperature. Figure 3 shows the plot of ignition delay versus
Temperature for various blends of i-octane and n-heptane [2, 16]:
(1)
Page 25
12
As we can see, τ varies only a little in the intermediate temperature range. However, for
certain fuels like n-heptane, τ actually increases with rise in temperature in the intermediate
temperature range [2, 16]. This region where ignition delay τ increases with increase in
temperature is described as Negative Temperature Coefficient (NTC) regime. A study [17] on
this reverse behavior of ignition delay (that is increase in ignition delay with temperature rise for
some of the fuels) reported that the ignition delay starts to decrease again with further increase in
temperature (around 50 K-100 K higher than the start of NTC).
The autoignition of the fuel exhibits two stages of heat release. The heat release observed
in the NTC region is the first stage of autoignition and is known as low temperature heat release
(LTHR) because it occurs at low temperatures ranging from 600 K to 800 K [15, 37], which is
associated with low rate of heat release. However, in a research conducted by Kuwahara [38], the
low temperature oxidation and the NTC regime is noted in the temperature range of 800 K to
Figure 3: Ignition Delay Profiles of different i-octane / n- heptane blends for
Φ=1 and 1 atm pressure [16]
Page 26
13
1000 K. It is followed by the main heat release or high temperature heat release (HTHR) which
is the second and final stage of autoignition of the fuel. In some preceding studies [36, 37], an
intermediate temperature heat release (ITHR) was also observed between the LTHR and HTHR
of main fuel ignition. It appears as a small peak on the main HTHR trace unlike LTHR which
appears as a separate peak before HTHR. It was also mentioned that ITHR shows to happen only
at higher in-cylinder temperatures [850 K – 1050 K] and appears as a “shoulder” on the main
heat release event. The chemistry associated with the NTC regime is most commonly described
as “low temperature chemistry” as it is known to be different than the chemistry related to high
temperature heat release. The LTHR can have a significant effect on HTHR. An optimum
combustion phasing could be realized due to the low initial mixture temperature of LTHR which
could also lower the HTHR rate and thus help to control the combustion noise and the maximum
load achieved by the engine [2].
2.6 Effect of Initial Temperature & Pressure:
CFD simulations [18] have been carried out to understand the effects of intake gas
temperature on auto-ignition of n-heptane, and indicated that the oxidation reactions got slowed
down with drop in gas temperature at the beginning of LTC regime, and resulted in increased
RHR in LTC regime. The low gas temperature also led to delay in the occurrence of NTC regime
and displayed drop in RHR.
Furthermore, the decrease in intake temperature has shown to shift the start of
combustion close to TDC [19]. It was also established [20- 23] that the ignition delay decreases
with increase in initial temperature, which also results in a decrease in maximum heat released
during combustion and that it can be used as a means to control the combustion phasing. In one
investigation [23], it was found that inlet temperature could be varied to influence the
Page 27
14
autoignition process without altering the overall energy content of the mixture since the heat
release did not seem to change with inlet temperature.
Multi-timescale modelling of ignition and flame regimes of an n-heptane/ air mixture in a
1D spark assisted HCCI reactor [24] revealed that the initial mixture temperature and pressure
plays an important role in flame dynamics. It was indicated that based on initial temperature,
there exists at least six different combustion regimes- initial single flame front propagation
regime, a coupled low temperature double flame regime, a coupled high temperature double
flame regime, a decoupled low and high temperature double flame regime followed by low
temperature ignition regime, a single high temperature flame regime and finally a hot ignition
regime. The low and high temperature flames have distinct kinetic properties and are highly
influenced by the low temperature chemistry. It was also proved that the ID reduces with
increase in temperature and pressure of the charge. Also, the NTC regime shifts to higher
temperatures with increase in pressure. The low temperature flame front showed rapid
decomposition of n-heptane and associated increase in HO2, H2O2, aldehydes (CH2O, CH3CHO,
and C2H5CHO). It was seen in flux analysis that small olefins like C2H4, C3H6 are formed from
the decomposition of alkyl radicals, C7H14O2-5 and nC7ket24 after isomerization and breakdown
of C7H14OOH and O2C7H14OOH. The onset of HTF front was defined by the reduction of H2O2,
HO2, CO resulting in formation of H2O and CO2.
A constant volume vessel was used to study the ignition of n-heptane sprays [25]. It was
found that the ignition delay was sensitive to initial temperature and pressure. The ignition delay
was longer for temperature less than 850 K at pressure range from 2 MPa to 4 MPa. However, it
showed little sensitivity to temperature greater than 850 K at pressure equal to 4 MPa. This was
explained using mixture homogeneity at ignition as follows- at temperature less than 850 K, the
chemical reactions do not accelerate until the homogeneous mixture is formed but when the
Page 28
15
temperature is high, chemical reactions are very fast and heterogeneous combustion occurs over
a wide range of equivalence ratio. Also, each spray would exhibit two stage ignition with a NTC
regime characterized by two stage pressure rises at low ambient pressures. Moreover, a further
study revealed that ignition delay depends on the pressure rise of the first stage [11]. The ignition
delay decreases with increase in pressure [11, 21, 26] and becomes approximately zero as
pressure increase beyond 1 MPa, the point at which main combustion starts.
2.7 Effect of Injection Timing and Multiple Injections:
Combustion phasing can have a significant effect on performance and emissions of an
engine. It was proposed by Koci and Ra [6] that appropriate injection timing can be used to attain
optimal ignition delay and phasing. A study on the effects of charge dilution and injection timing
in an LTC diesel engine [21] concluded that advancing the injection timing will lead to increase
in peak in-cylinder pressure. However, when the injection timing was fixed, the charge dilution
decreased the peak in-cylinder pressure due to high heat capacity of diluent gases and slow
premixed combustion reactions.
Early injection PCCI regime tests were carried out using a single cylinder DI diesel
engine [27], in which it was shown that the ignition delay and ignition dwell are prolonged with
injection timing advance due to lower ambient temperature, pressure and density of the mixture.
The ignition dwell is also increased with injection pressure. This enhances the fuel-air mixing
leading to low emissions of CO, HC and soot.
One of the promising strategies to control the ignition timing and combustion phasing of
the main heat release in HCCI is NVO strategy [10, 26]. NVO strategy incorporates early EVC
and late IVO in which the first fuel injection is made during the NVO period, followed by main
injection at the end of NVO. Research has shown that NVO injection advances combustion by
both chemical and thermal effects [10]. It was reported [26] that retarding the NVO fuel injection
Page 29
16
advances the main combustion phasing (Main CA50) and also the ARHR. However, the
occurrence of NVO CA50 (CAD at which 50% of NVO apparent heat release occurs) showed a
clear retard with delayed NVO injection timing. Even the increase in the injected fuel mass had a
retarding effect on NVO CA50 event but an advancing effect on main combustion event. As the
NVO injection is delayed, the temperature at IVO increases but it was seen to decrease after 45
CAD BTDC. This was attributed to the decrease in NVO heat release. The temperature at IVO
decreased with advanced injection timings because of the high heat loss from the cylinder.
A study conducted at Sandia National Laboratories [28] regarding pilot injection ignition
under LTC conditions put forth some important observations. It stated that pilot ignition gets
impeded in a dilute low temperature mixture characterized by extended ignition delay due to the
formation of overly lean mixture. Also, the ignition delay may increase further even if a small
quantity of pilot fuel is injected into this overly formed lean mixture or if the injection pressure is
increased under these conditions. Furthermore, if a highly rich mixture is formed in a relatively
short period of time, it will prolong the ignition delay as well.
Mueller [29] examined the dual-injection case where he analyzed the mixing and
combustion of the early and main injected fuel. It was pointed out using the heat release data that
the early injected fuel burns in HCCI like mode with cool flame followed by premixed, high
temperature combustion whereas the main fuel burns in a conventional manner in which a short
premixed burn phase is followed by a longer mixing controlled combustion.
Page 30
17
2.8 Effect of chemical species:
The role played by certain chemical species is very significant in combustion. In an
investigation of effects of ethanol on ignition delay of n-heptane [30], it was found that increase
in ethanol addition to n-heptane/air mixtures increases the ignition delay, and increases the initial
temperature corresponding to the low temperature heat release. Also, the peak of low
temperature heat release decreases with increase in ethanol volume, and results in an increase in
engine IMEP. The most well-known chemical species for inhibition of ignition delay is
formaldehyde (HCHO) [15, 18, 30]. It increases the ignition delay, retards the LTHR and also
decreases the peak magnitude of the apparent heat release rate (ARHR) in a diesel engine. It was
also clarified that the NTC regime is characterized by high concentration of formaldehyde and
that the oxidation reactions take pace once it starts to drop [18].
A kinetic examination of autoignition of alkanes revealed that HO2-H2O2 chemistry can
have a significant effect on ignition delay in the temperature range of 600 K to 1100 K,
particularly at pressures higher than 1 atm [32]. Outside this temperature range, the HO2
reactions are unlikely to be having significant impact on auto ignition. One research [33]
suggested that the thermal decomposition of H2O2 and consumption of HCHO which results in
hot ignition flame can be used as an important perspective for controlling HCCI ignition timing.
Kinetic analysis conducted by Wong and Karim [34] to study the effects of recirculated
exhaust gases on auto ignition of homogeneous n-heptane/ air mixture in engines showed that the
peroxy radical, the hydroperoxy-alkyloxy radical, and hydroperoxides, as well as H2O2,
promoted auto ignition whereas ethylene, epoxy cycloheptane and formaldehyde were
responsible for inhibiting auto ignition. They found that the auto ignition promoters did not show
gradual accumulation during cool flame reactions due to their consumption as soon as it was
produced in the pre-combustion reactions. It was also proved that there exist two sets of cool
Page 31
18
flame reactions- the first set is defined by the production of auto ignition promoters with little
heat release and the second set of reactions show consumption of these species occurring at high
temperature with high heat release and formation of complete combustion products like H2O.
They reported that the autoignition tendency of an n-heptane/air mixture will increase if the
mixture has undergone the first set of reactions only, and that the autoignition will be dominated
by kinetic effects and not the thermal effects. But if it has attained second set of reactions, then,
the auto ignition tendency will be less. As the oxidation proceeds further, the kinetic effects will
lessen whereas thermal effects will intensify with negligible change in auto ignition tendency.
Some researchers [28] presented the effect of exhaust gas CO and H2O on the ignition
delay at near TDC temperatures. They reported that CO addition (5000 ppm) extended the
ignition delay by 0.5-1.0 CAD at 880 K near TDC temperature. This effect was counter balanced
by H2O which showed to decrease the ignition delay by 1 CAD. It was also shown that even NO
(in small quantities as few ppm) has significant effect on ignition delay where it results in
shortening of ignition delay.
The effect of acetylene on iso-octane was studied in HCCI combustion [35] employing a
negative valve overlap (NVO) strategy. It was found that acetylene at part-per-thousand levels
advances combustion phasing. If combustion phasing is held constant, then it increases peak heat
release rate. It was also discovered that if acetylene is produced and not consumed during NVO
then it will be carried over to the main combustion event where it will advance the ignition and
enhance combustion.
All these advances in the low temperature combustion area attest that it is going to be a
promising technology for future diesel engines as well as other engines. LTC concept uses a low
equivalence ratio and low temperature which helps in avoiding the NOX and soot formation
zones in Φ-T space. Various parameters were varied and analyzed in the literature to understand
Page 32
19
its effects on LTC in order to control the autoignition in LTC. The fuel structure, its volatility
and ignitability along with other design factors play important role in realizing the formation of
perfectly homogeneous mixture for LTC. It was seen that the ignition delay decreases with
increase in temperature and pressure. However, for n-heptane, the ignition delay increased in the
intermediate temperature range and decreased when the temperature was further increased. The
multiple injections and varying injection timings have shown to have a substantial effect on the
in-cylinder conditions and the ignition delay. It was found that the ignition delay of pilot fuel
combustion gets impeded in low temperature mixture and also when extra small quantity of fuel
is added to this mixture. The ignition delay might prolong even if a highly rich mixture is formed
in relatively short period of time. The chemical species such as ethanol, formaldehyde posed
inhibiting effect on ignition delay whereas other species such as acetylene, peroxy radical, the
hydroperoxy-alkyloxy radical, and hydroperoxides, as well as H2O2, had advancing effect on
ignition delay.
The work done in this research examines the effect of the intermediate species
formed due to combustion of pilot fuel at varying pilot injection timings on combustion phasing
of the main fuel ignition. This would help in understanding the role played by chemical kinetics
of charge towards controlling the autoignition/combustion phasing of mixture through different
pressure, temperature and heat release profiles.
Page 33
20
CHAPTER 3
MODEL DESCRIPTION
Split injection of fuel is one of the in-cylinder strategies being studied in HCCI engines
with LTC conditions due to its numerous benefits. As we have seen in the literature, a common
challenge in the implementation of HCCI is the control of ignition timing. The auto ignition of
fuel is preceded by relatively small chemical changes in fuel/air mixtures. In HCCI, a greater
control of autoignition will be achieved through a better understanding of these chemical
reactions of this process. This work examines the chemical kinetics of split-injection timing and
the effect of this parameter on combustion phasing and pressure rise rate. Detailed reaction
mechanisms are applied in CHEMKIN-based kinetic simulations to model the production and
composition of combustion intermediates produced by a pilot injection through different
pressure-temperature histories.
3.1 Chemkin Simulation Model
A zero-dimensional closed internal combustion engine simulator model was employed in
Chemkin-Pro to simulate the HCCI system. The assumptions that were considered in this
simulation were: the engine model is adiabatic, homogeneous and single zone to depict only the
kinetics of LTC and not the entire actual engine conditions. The combustion was modelled using
n-heptane fuel and detailed mechanism of n-heptane, version 3.1 from Lawrence Livermore
National Laboratory. N-Heptane was chosen in this study for the following reasons [34]:
N-heptane displays the characteristics of more complex hydrocarbon fuels specially the cool
flame and the different stages of ignition.
It is used as a reference fuel to determine the knock rating of different fuels.
Page 34
21
The cetane number of n-heptane is around 60 which is close to a good quality diesel fuel;
therefore it can be used successfully to represent the diesel ignition phenomena.
3.1.1 Calculation of Air-Fuel Ratio for Split Injection:
The ideal HCCI combustion is illustrated by a lean, perfectly homogeneous mixture
where the equivalence ratio at any point in the mixture is approximately equal to the average
equivalence ratio. In this work, the fuel mass is distributed equally (1:1 ratio) between the pilot
and main fuel addition; and the equivalence ratio is set at 0.5 depicting ideal HCCI process. In
order to maintain the total equivalence ratio equal to 0.5 in the system, the appropriate mass flow
rate of air was calculated for 1 g/s of fuel flow rate in each of the split injection as follows:
Stoichiometric Combustion Reaction:
( )
Using this reaction, we get the stoichiometric ⁄ = 15.18
Since, equivalence ratio Φ = ( ) ( )
Therefore, for Φ= 0.5, we get the Actual ⁄ = 30.4
The fuel is being split equally in the pilot and main injections.
Air Pilot Injection Main Injection
x y y
Thus, for 1:1 split injection of fuel, we have
Pilot ⁄ = ⁄ = Actual ⁄ = 30.4
Therefore, Pilot ⁄ = 60.8
For main injection,
Page 35
22
Main ⁄ = ( ) = 60.8 + 1 = 61.8
Thus, during main combustion, the equivalence ratio was maintained approximately as 0.5.
Therefore, the air and fuel mass flow rate employed in the simulation is:
Pilot Injection Main Injection
g/sec g/sec
Air 60.8 61.8
Fuel 1 1
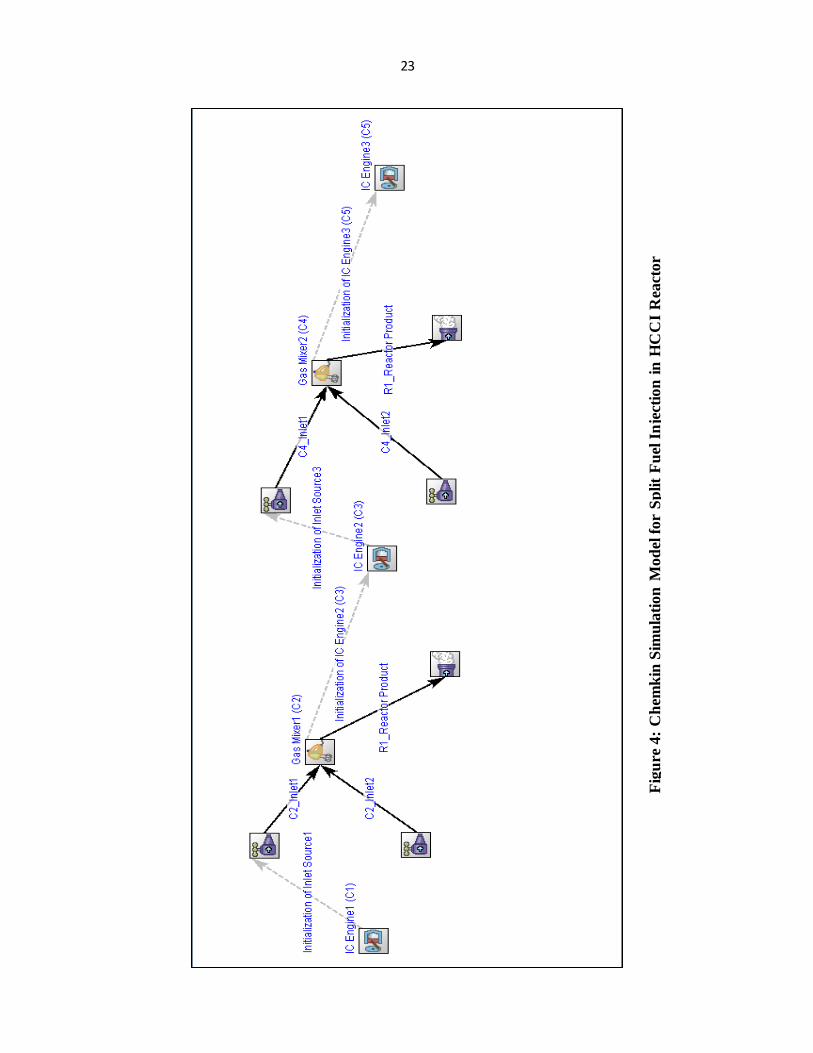
3.1.2 Split Injection Model Setup:
The split injection model was built using a network of reactor models as a cluster shown
in figure 4. The simulation model is run for pilot injection timing sweep from 165 deg BTDC to
7 deg BTDC followed by the main injection at 5 deg BTDC. The steps involved in this
simulation are as follows:
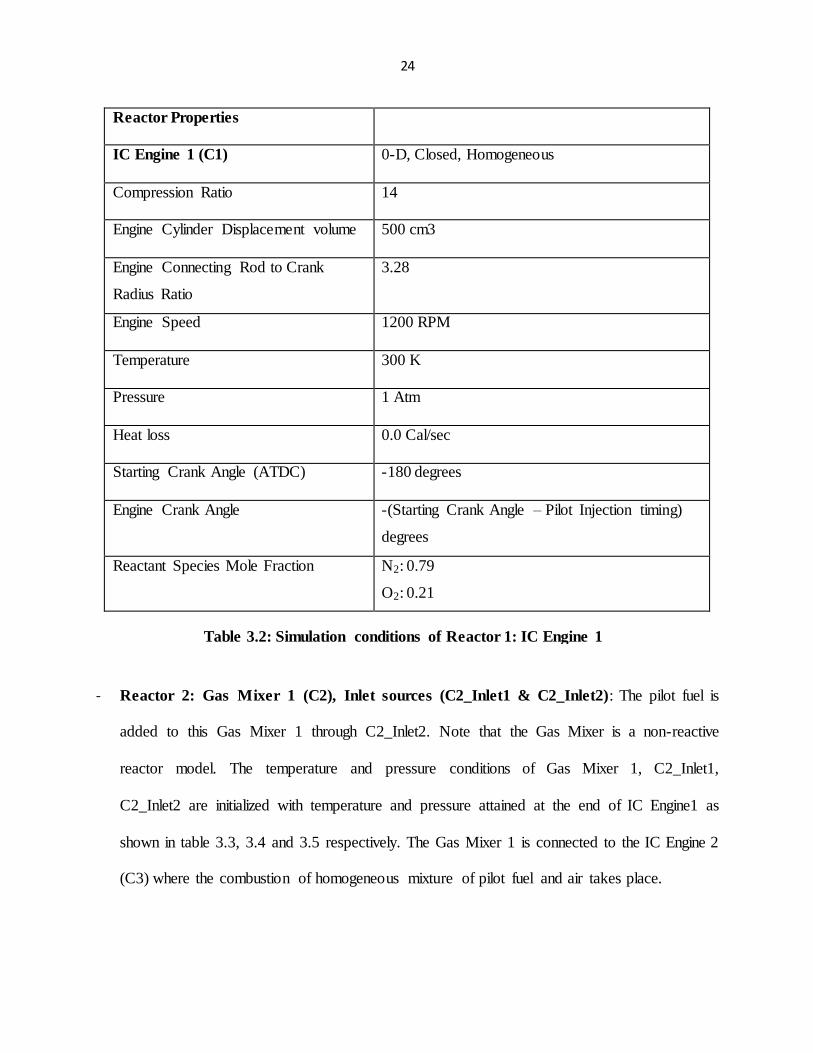
- Reactor 1: IC Engine 1 (C1): The simulation starts with first reactor that is IC Engine 1
(C1) in which only air is compressed from the starting crank angle 180 deg BTDC for the
required crank angle duration. The simulation conditions for reactor 1 are shown in table 3.2.
During this step, the compression of air leads to increase in temperature and pressure. The
output of IC Engine1 is used to initialize the inlet source 1 (C2_Inlet1) which connects to the
Gas Mixer 1 (C2).
Table 3.1: Air and Fuel mass flow rate for split injection
Page 36
23
Fig
ure
4:
Ch
emk
in S
imu
lati
on
Mod
el f
or
Sp
lit
Fu
el I
nje
ctio
n i
n H
CC
I R
eact
or
Page 37
24
Reactor Properties
IC Engine 1 (C1) 0-D, Closed, Homogeneous
Compression Ratio 14
Engine Cylinder Displacement volume 500 cm3
Engine Connecting Rod to Crank
Radius Ratio
3.28
Engine Speed 1200 RPM
Temperature 300 K
Pressure 1 Atm
Heat loss 0.0 Cal/sec
Starting Crank Angle (ATDC) -180 degrees
Engine Crank Angle -(Starting Crank Angle – Pilot Injection timing)
degrees
Reactant Species Mole Fraction N2: 0.79
O2: 0.21
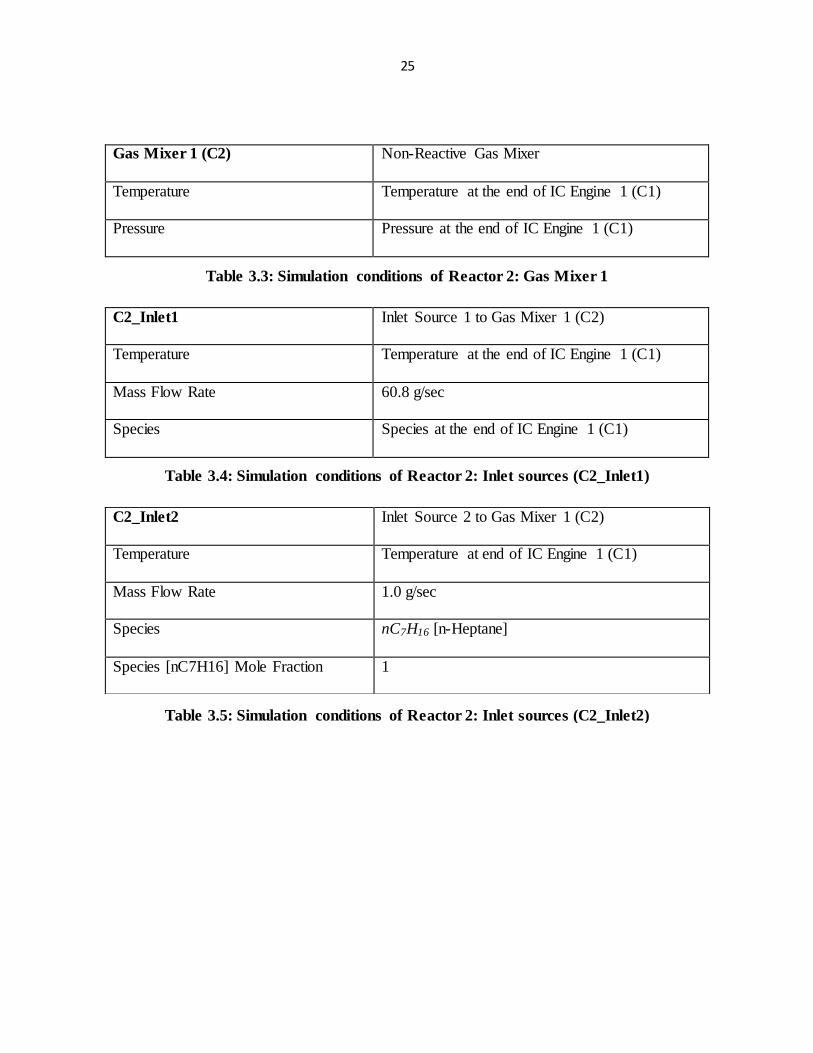
- Reactor 2: Gas Mixer 1 (C2), Inlet sources (C2_Inlet1 & C2_Inlet2): The pilot fuel is
added to this Gas Mixer 1 through C2_Inlet2. Note that the Gas Mixer is a non-reactive
reactor model. The temperature and pressure conditions of Gas Mixer 1, C2_Inlet1,
C2_Inlet2 are initialized with temperature and pressure attained at the end of IC Engine1 as
shown in table 3.3, 3.4 and 3.5 respectively. The Gas Mixer 1 is connected to the IC Engine 2
(C3) where the combustion of homogeneous mixture of pilot fuel and air takes place.
Table 3.2: Simulation conditions of Reactor 1: IC Engine 1
(C1)
Page 38
25
Gas Mixer 1 (C2) Non-Reactive Gas Mixer
Temperature Temperature at the end of IC Engine 1 (C1)
Pressure Pressure at the end of IC Engine 1 (C1)
C2_Inlet1 Inlet Source 1 to Gas Mixer 1 (C2)
Temperature Temperature at the end of IC Engine 1 (C1)
Mass Flow Rate 60.8 g/sec
Species Species at the end of IC Engine 1 (C1)
C2_Inlet2 Inlet Source 2 to Gas Mixer 1 (C2)
Temperature Temperature at end of IC Engine 1 (C1)
Mass Flow Rate 1.0 g/sec
Species nC7H16 [n-Heptane]
Species [nC7H16] Mole Fraction 1
Table 3.3: Simulation conditions of Reactor 2: Gas Mixer 1
(C2)
Table 3.4: Simulation conditions of Reactor 2: Inlet sources (C2_Inlet1)
Table 3.5: Simulation conditions of Reactor 2: Inlet sources (C2_Inlet2)
Page 39
26
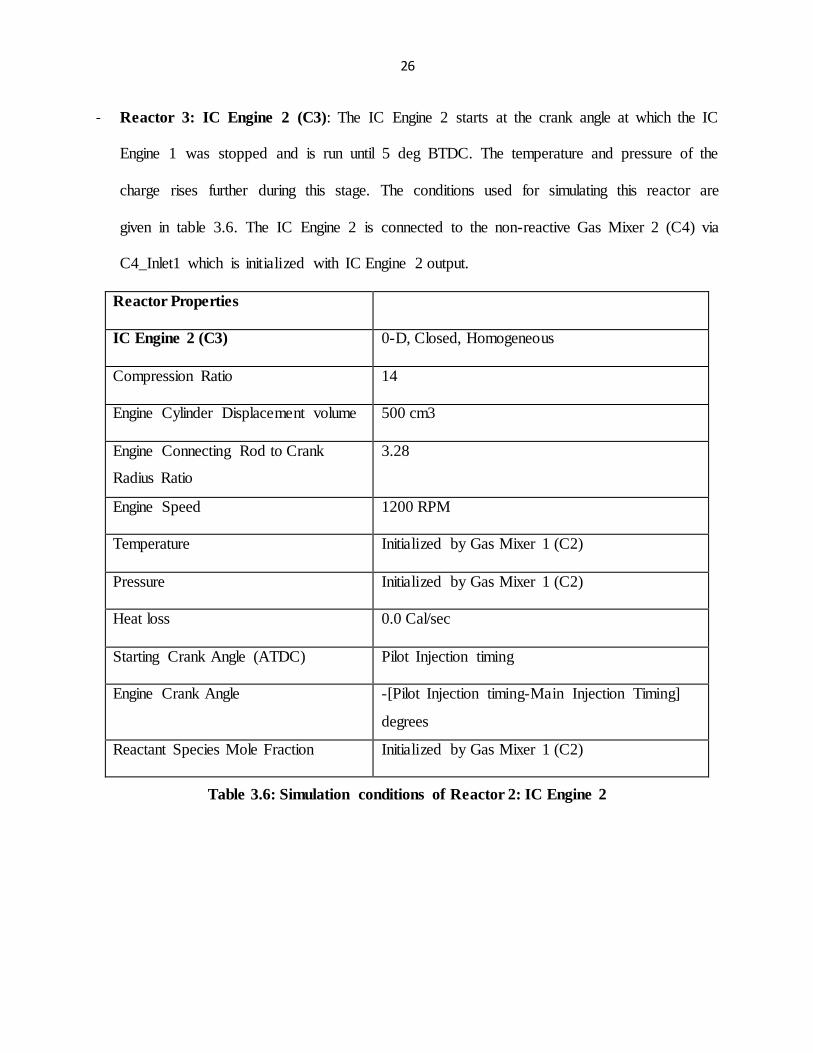
- Reactor 3: IC Engine 2 (C3): The IC Engine 2 starts at the crank angle at which the IC
Engine 1 was stopped and is run until 5 deg BTDC. The temperature and pressure of the
charge rises further during this stage. The conditions used for simulating this reactor are
given in table 3.6. The IC Engine 2 is connected to the non-reactive Gas Mixer 2 (C4) via
C4_Inlet1 which is initialized with IC Engine 2 output.
Reactor Properties
IC Engine 2 (C3) 0-D, Closed, Homogeneous
Compression Ratio 14
Engine Cylinder Displacement volume 500 cm3
Engine Connecting Rod to Crank
Radius Ratio
3.28
Engine Speed 1200 RPM
Temperature Initialized by Gas Mixer 1 (C2)
Pressure Initialized by Gas Mixer 1 (C2)
Heat loss 0.0 Cal/sec
Starting Crank Angle (ATDC) Pilot Injection timing
Engine Crank Angle -[Pilot Injection timing-Main Injection Timing]
degrees
Reactant Species Mole Fraction Initialized by Gas Mixer 1 (C2)
Table 3.6: Simulation conditions of Reactor 2: IC Engine 2
(C3)
Page 40
27
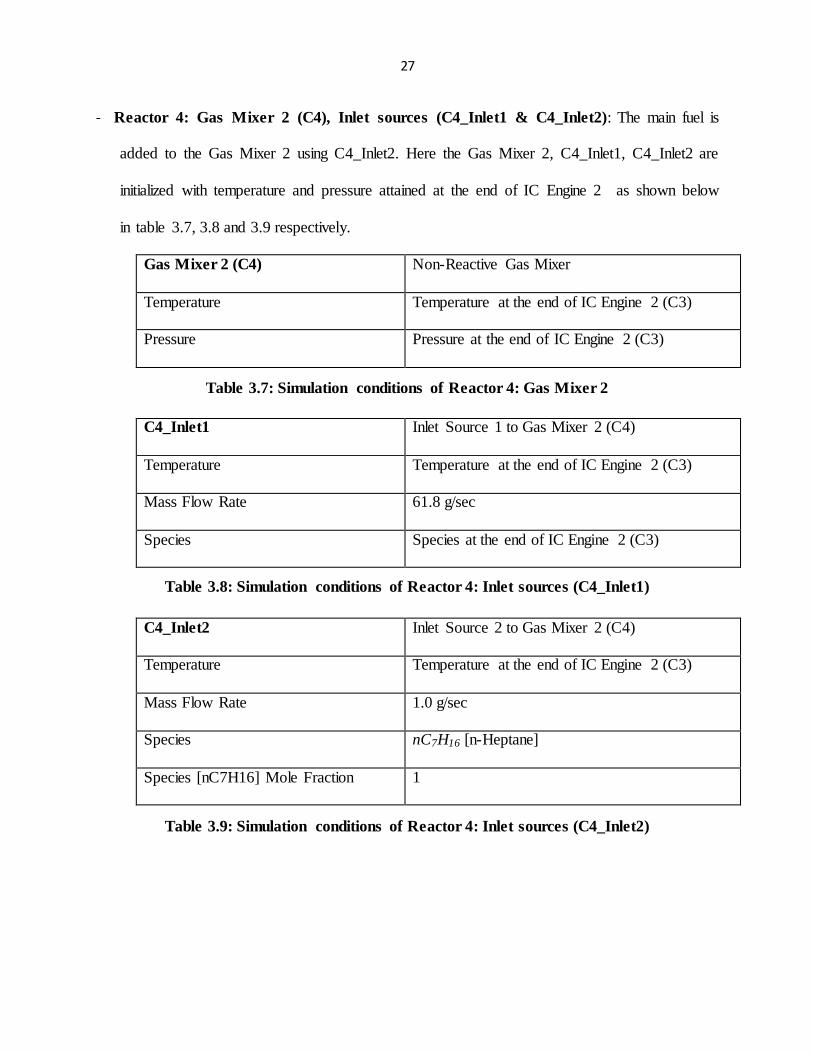
- Reactor 4: Gas Mixer 2 (C4), Inlet sources (C4_Inlet1 & C4_Inlet2): The main fuel is
added to the Gas Mixer 2 using C4_Inlet2. Here the Gas Mixer 2, C4_Inlet1, C4_Inlet2 are
initialized with temperature and pressure attained at the end of IC Engine 2 as shown below
in table 3.7, 3.8 and 3.9 respectively.
Gas Mixer 2 (C4) Non-Reactive Gas Mixer
Temperature Temperature at the end of IC Engine 2 (C3)
Pressure Pressure at the end of IC Engine 2 (C3)
C4_Inlet1 Inlet Source 1 to Gas Mixer 2 (C4)
Temperature Temperature at the end of IC Engine 2 (C3)
Mass Flow Rate 61.8 g/sec
Species Species at the end of IC Engine 2 (C3)
C4_Inlet2 Inlet Source 2 to Gas Mixer 2 (C4)
Temperature Temperature at the end of IC Engine 2 (C3)
Mass Flow Rate 1.0 g/sec
Species nC7H16 [n-Heptane]
Species [nC7H16] Mole Fraction 1
Table 3.7: Simulation conditions of Reactor 4: Gas Mixer 2
(C4)
Table 3.8: Simulation conditions of Reactor 4: Inlet sources (C4_Inlet1)
Table 3.9: Simulation conditions of Reactor 4: Inlet sources (C4_Inlet2)
Page 41
28
- Reactor 5: IC Engine 3 (C5): Finally, the main combustion takes place in the last reactor
that is IC Engine 3 (C5) which is fed by Gas Mixer 2. The simulation conditions are shown
in table 3.10. The combustion of main fuel results in rapid increase of temperature and
pressure of the mixture, thus leading to high temperature heat release. The IC Engine 3 starts
at 5 deg BTDC and was run for 20 CAD. The temperature and pressure at the start of IC
Engine 2 and IC Engine 3 is the temperature and pressure attained at the end of IC Engine 1
and IC Engine 2 respectively.
Reactor Properties
IC Engine 3 (C5) 0-D, Closed, Homogeneous
Compression Ratio 14
Engine Cylinder Displacement volume 500 cm3
Engine Connecting Rod to Crank
Radius Ratio
3.28
Engine Speed 1200 RPM
Temperature Initialized by Gas Mixer 2 (C4)
Pressure Initialized by Gas Mixer 2 (C4)
Heat loss 0.0 Cal/sec
Starting Crank Angle (ATDC) -5 degrees
Engine Crank Angle 20 degrees
Reactant Species Mole Fraction Initialized by Gas Mixer 2 (C4)
Table 3.10: Simulation conditions of Reactor 4: IC Engine 3
(C5)
Page 42
29
The output resolution on crank angle basis is set by selecting time interval used for printing
and saving the data in the output control panel of IC Engine 1, IC Engine 2 and IC Engine 3.
It was calculated and set according to the following relation:
Where is in CA degrees and speed is in RPM.
Therefore, at 1200 RPM, for IC Engine 1, t = 140 µsec for
For IC Engine 2, t = 69 µsec for
For IC Engine 3, t = 14 µsec for s
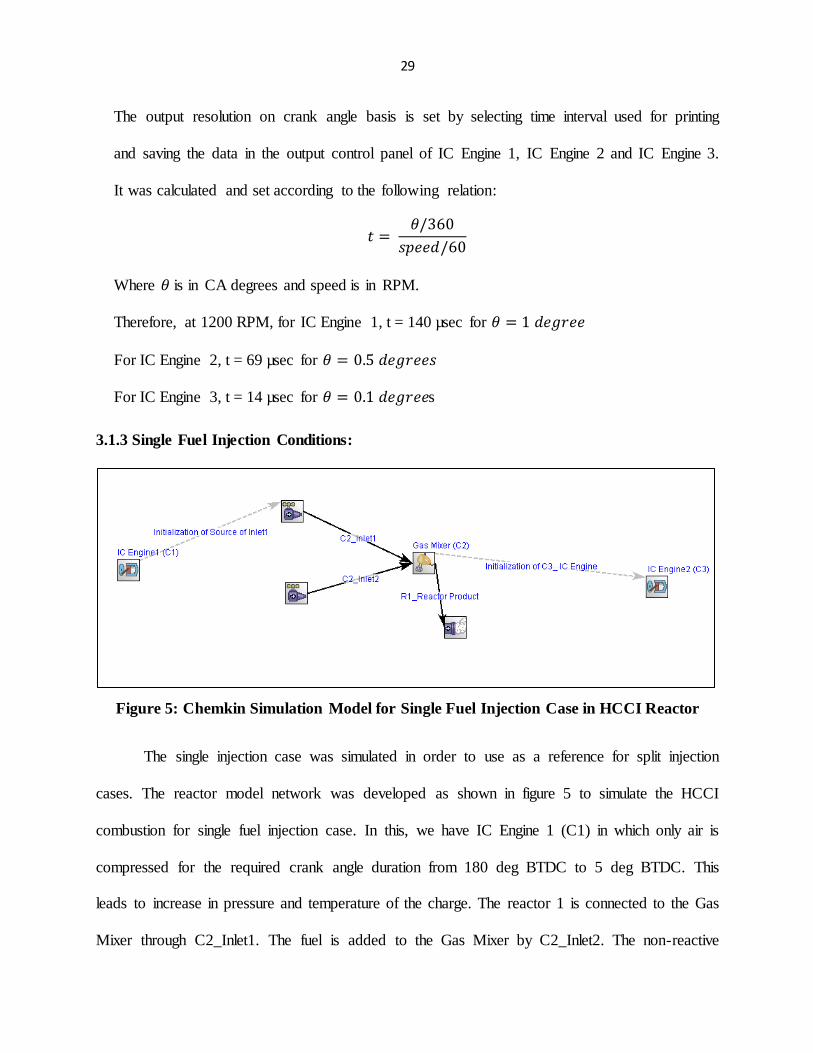
3.1.3 Single Fuel Injection Conditions:
The single injection case was simulated in order to use as a reference for split injection
cases. The reactor model network was developed as shown in figure 5 to simulate the HCCI
combustion for single fuel injection case. In this, we have IC Engine 1 (C1) in which only air is
compressed for the required crank angle duration from 180 deg BTDC to 5 deg BTDC. This
leads to increase in pressure and temperature of the charge. The reactor 1 is connected to the Gas
Mixer through C2_Inlet1. The fuel is added to the Gas Mixer by C2_Inlet2. The non-reactive
Figure 5: Chemkin Simulation Model for Single Fuel Injection Case in HCCI Reactor
Page 43
30
Gas mixer is used to initialize the last reactor that is IC Engine 2 (C3) which has the starting
crank angle of single fuel addition at 5 deg BTDC.
The conditions used in the first reactor (IC Engine 1) are the same as those used in the
split injection model (table 3.2). The conditions for Gas Mixer and IC Engine 2 are as follows:
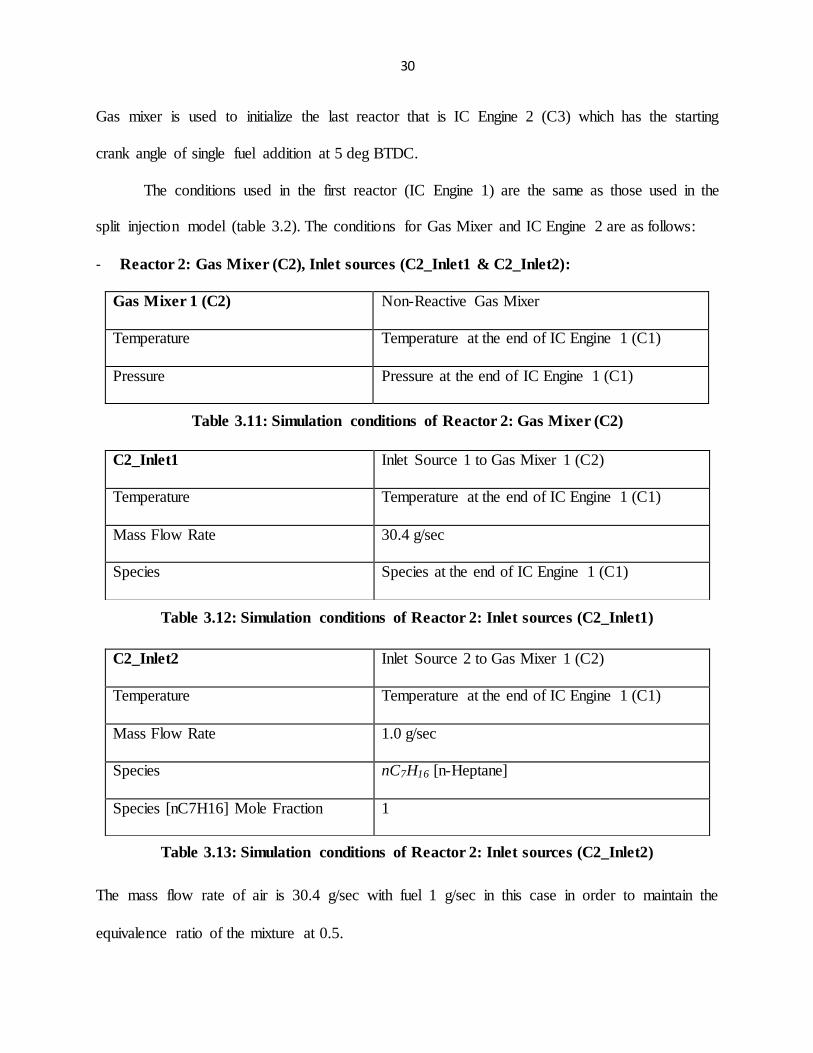
- Reactor 2: Gas Mixer (C2), Inlet sources (C2_Inlet1 & C2_Inlet2):
Gas Mixer 1 (C2) Non-Reactive Gas Mixer
Temperature Temperature at the end of IC Engine 1 (C1)
Pressure Pressure at the end of IC Engine 1 (C1)
The mass flow rate of air is 30.4 g/sec with fuel 1 g/sec in this case in order to maintain the
equivalence ratio of the mixture at 0.5.
C2_Inlet1 Inlet Source 1 to Gas Mixer 1 (C2)
Temperature Temperature at the end of IC Engine 1 (C1)
Mass Flow Rate 30.4 g/sec
Species Species at the end of IC Engine 1 (C1)
C2_Inlet2 Inlet Source 2 to Gas Mixer 1 (C2)
Temperature Temperature at the end of IC Engine 1 (C1)
Mass Flow Rate 1.0 g/sec
Species nC7H16 [n-Heptane]
Species [nC7H16] Mole Fraction 1
Table 3.11: Simulation conditions of Reactor 2: Gas Mixer (C2)
Table 3.12: Simulation conditions of Reactor 2: Inlet sources (C2_Inlet1)
Table 3.13: Simulation conditions of Reactor 2: Inlet sources (C2_Inlet2)
Page 44
31
- Reactor 3: IC Engine 2 (C3):
Reactor Properties
IC Engine 2 (C3) 0-D, Closed, Homogeneous
Compression Ratio 14
Engine Cylinder Displacement volume 500 cm3
Engine Connecting Rod to Crank
Radius Ratio
3.28
Engine Speed 1200 RPM
Temperature Initialized by Gas Mixer (C2)
Pressure Initialized by Gas Mixer (C2)
Heat loss 0.0 Cal/sec
Starting Crank Angle (ATDC) Main Injection timing =-5 degrees
Engine Crank Angle 20 degrees
Reactant Species Mole Fraction Initialized by Gas Mixer (C2)
Table 3.14: Simulation conditions of Reactor 3: IC Engine 2
(C3)
Page 45
32
CHAPTER 4
RESULTS AND DATA ANALYSIS
This section shows the results obtained for different pilot injection sweep from 165 deg
BTDC to 7 deg BTDC followed by a main injection at 5 deg BTDC in Chemkin based
simulation of split injection in HCCI Engine. The effect of split injection on important
parameters of the engine such as pressure, temperature, and rate of heat release during the entire
cycle is analyzed. Moreover, the chemical kinetic changes taking place during pilot combustion
and its impact on the main combustion is also examined.
4.1 Pressure and Temperature Profiles:
The pressure and temperature traces were plotted using the results obtained from the
Chemkin simulation of split injections as shown in figure 6a and figure 7a, respectively. They
show the pressure and temperature profiles obtained from the HCCI engine simulation for the
pilot injection timing sweep from 165 deg BTDC to 7 deg BTDC. The pressure and temperature
trace of a single fuel injection (5 deg BTDC) case is also shown in the figure. The change in
pressure and temperature is clearly visible in the shown figure which is the result of ignition of
the pilot fuel followed by ignition of main fuel.
For the different pilot injection timings from -165 CAD to -7 CAD, the pressure is rising
gradually but the ignition takes place only later in the cycle that is from -10 CAD onwards as
seen in figure 6a and figure 6b. Once the ignition of pilot fuel occurs, there is further rise in
pressure and temperature of the mixture due to the associated heat release.
Page 46
33
Figure 6a: Pressure Traces for the split injection simulation for all the
reactors combined; Figure 6b: Zoomed-in pressure traces showing
increase in pressure due to pilot ignition
Page 47
34
Figure 7a: Temperature traces for the split injection simulation for all the
reactors combined; Figure 7b: Zoomed-in temperature traces showing
increase in temperature due to pilot ignition
Page 48
35
The pilot fuel ignition followed by ignition of main fuel at -5 CAD results in rapid
increase in pressure and temperature. The pressure and temperature reach their peak values near
TDC. It can be inferred from the plots that the ignition of the pilot fuel takes place only when a
certain temperature (>750 K) is reached as shown in figure 7b which also shows that the start of
combustion of pilot fuel does not depend on the pilot injection timing.
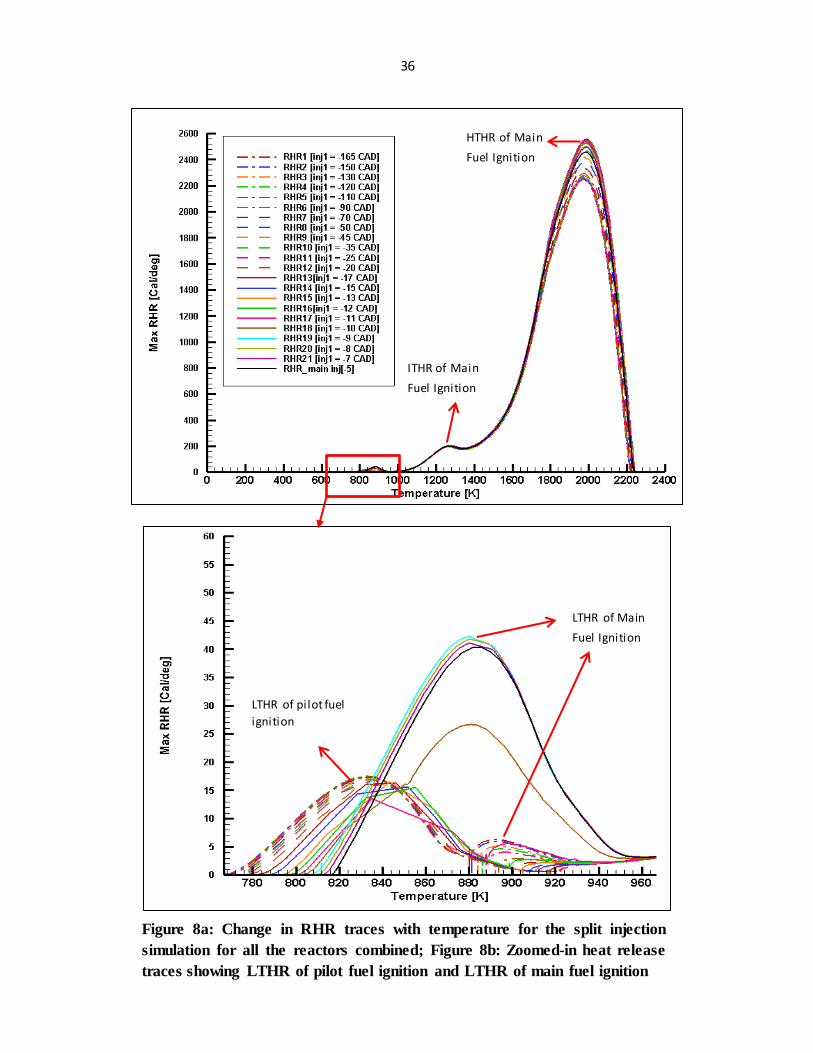
4.2 Rate of Heat Release Profiles:
The heat released per crank angle degree (RHR) was plotted with respect to temperature
using the simulation results as illustrated in figure 8a. The maximum RHR reached in the entire
cycle (after main fuel addition) is approximately equal to 2600 Cal/deg for the entire pilot
injection timing sweep. The heat release plots show the different stages of heat released during
the entire cycle. Four stages of heat release was observed in the entire cycle (figure 8a and figure
9) -
i. LTHR of the pilot fuel ignition
which is followed by three stage ignition of main fuel-
ii. LTHR of the main fuel ignition,
iii. ITHR of the main fuel ignition,
iv. HTHR of the main fuel ignition.
The change in RHR with temperature as shown in figure 8a displays the temperature of
the mixture during LTHR of the pilot fuel ignition, LTHR and HTHR of main fuel ignition. The
low temperature heat release of the pilot fuel ignition and LTHR of the main fuel ignition can be
clearly seen in figure 8b. The main fuel ignition shows an intermediate temperature heat release
(ITHR) between the LTHR and HTHR of main fuel ignition. It appeared as a small peak or
shoulder on the main HTHR trace (as seen in figure 8a and 9) unlike
Page 49
36
Figure 8a: Change in RHR traces with temperature for the split injection
simulation for all the reactors combined; Figure 8b: Zoomed-in heat release
traces showing LTHR of pilot fuel ignition and LTHR of main fuel ignition
LTHR of pilot fuel
ignition
LTHR of Main
Fuel Ignition
HTHR of Main
Fuel Ignition
ITHR of Main
Fuel Ignition
Page 50
37
Fig
ure
9:
Heat
Rele
ase
tra
ces
for
the s
plit
inje
ctio
n si
mula
tion fo
r all t
he r
eact
ors
com
bin
ed
sh
ow
ing d
iffe
rent
stages
of
heat
rele
ase
events
LTH
R o
f pil
ot f
ue
l ign
itio
n a
nd
LTH
R o
f
mai
n fu
el i
gnit
ion
ITH
R o
f M
ain
Fuel
Ign
itio
n
HTH
R o
f M
ain
Fuel
Ign
itio
n
Page 51
38
LTHR which appears as a separate peak before HTHR. The ignition of pilot fuel starts after 750
K. The peak magnitude of low temperature heat release due to pilot ignition takes place when the
temperature reaches around 820 K to 860 K. The addition of main fuel to this mixture formed by
pilot ignition at this temperature adds more chemical energy and is followed by LTHR peak of
main fuel ignition occurring when temperature is in between 860 K to 920 K. The ITHR peak
occurs at temperature approximately equal to 1250 K. The HTHR peak of main fuel ignition
occurs when the temperature is very high (approximately between 1900K- 2000 K).
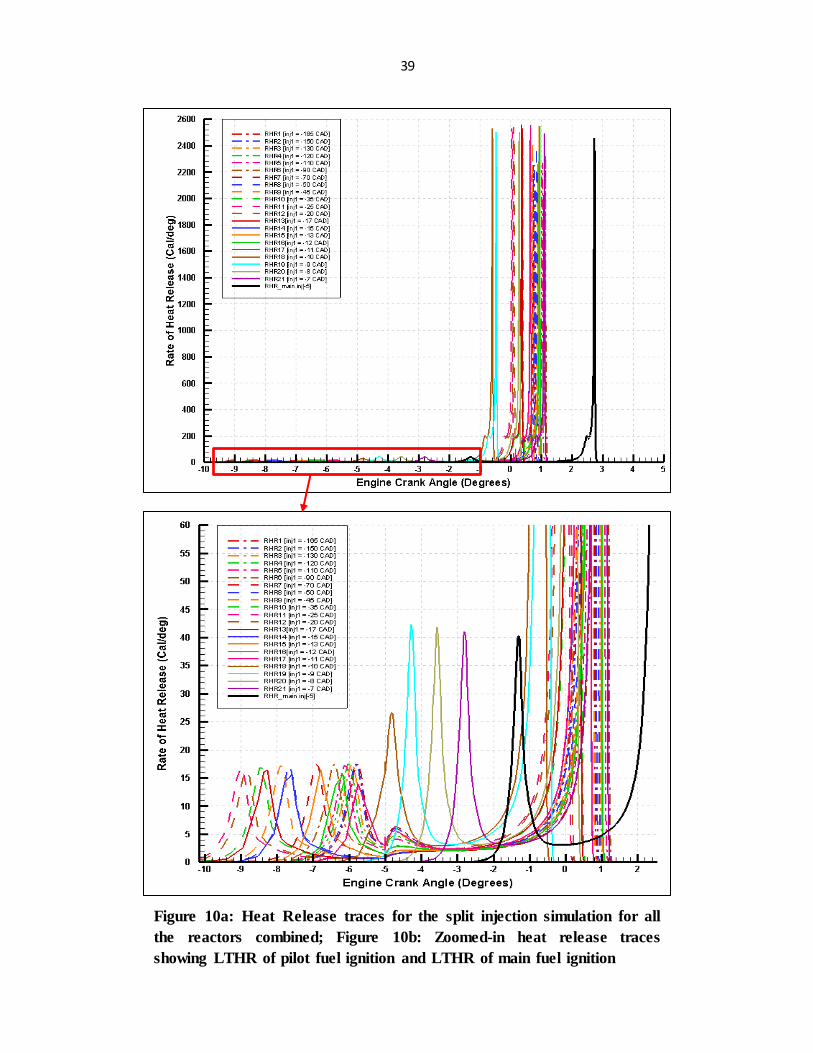
The heat released per crank angle degree (RHR) was plotted with respect to CAD using
the simulation results as illustrated in figure 10a. Figure 10b shows the first stage heat release in
split injection due to the combustion of pilot fuel as well as the LTHR of the main fuel ignition.
The ignition of pilot fuel takes place after -10 CAD in the cycle. This can be due to the
temperature required for the initiation of successful combustion of the pilot fuel. It was observed
from temperature profile that the minimum temperature required for ignition of pilot fuel is
approximately equal to 750 K as seen in figure 7b and figure 8b. Therefore, although the mixture
is homogeneous, the ignition starts only when the required conditions are met. The chemistry of
the pilot fuel combustion plays an important role in the combustion and combustion phasing of
the main fuel.
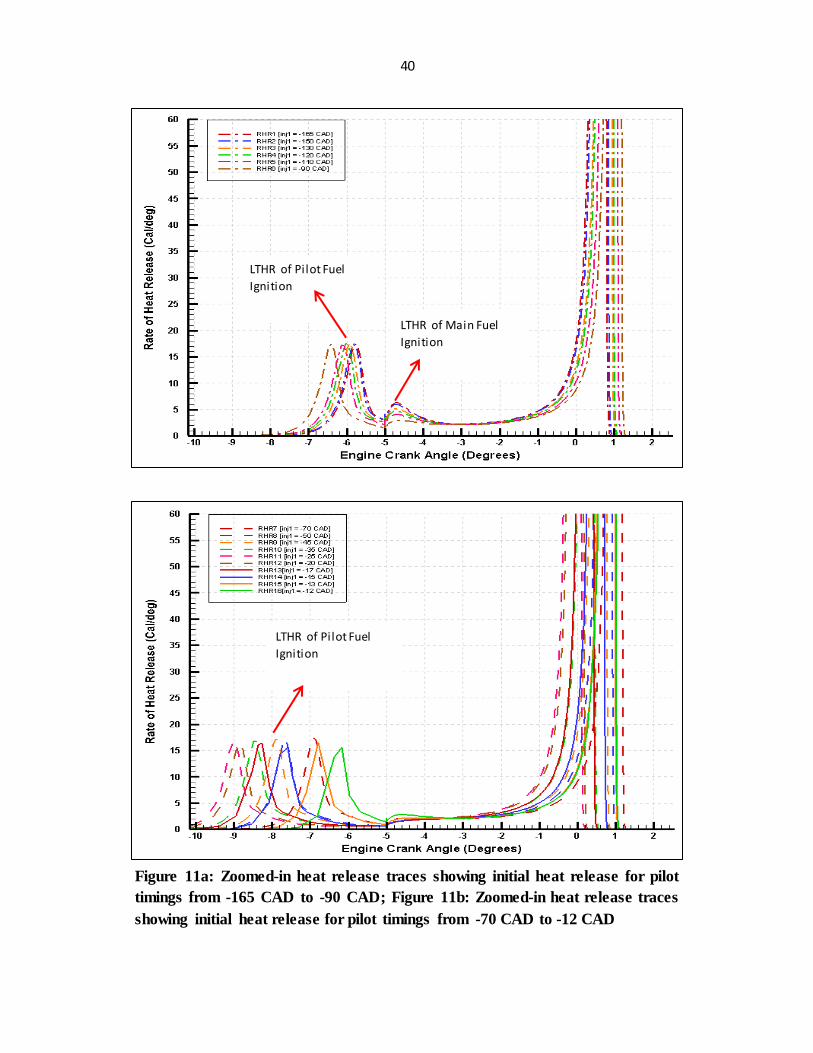
For advanced pilot injection timings (-165 CAD to -90 CAD), the heat release of the pilot
fuel ignition is followed by three stage ignition of the main fuel (figure 11a). When the main fuel
is added at -5 CAD into the ignited mixture of pilot fuel and air, a low temperature regime
characterized by LTHR of the main fuel can be clearly seen in the shown figure. This LTHR is
Page 52
39
Figure 10a: Heat Release traces for the split injection simulation for all
the reactors combined; Figure 10b: Zoomed-in heat release traces
showing LTHR of pilot fuel ignition and LTHR of main fuel ignition
Page 53
40
Figure 11a: Zoomed-in heat release traces showing initial heat release for pilot
timings from -165 CAD to -90 CAD; Figure 11b: Zoomed-in heat release traces
showing initial heat release for pilot timings from -70 CAD to -12 CAD
LTHR of Pilot Fuel
Ignition
LTHR of Main Fuel
Ignition
LTHR of Pilot Fuel
Ignition
Page 54
41
followed by NTC regime which is shown by the drop in heat release rate. The start of ITHR
followed by HTHR of the main fuel takes place after a few crank angle degrees (~4 CAD) as
seen in figure 9 or 10a. The pilot injection timings from -165 CAD to -90 CAD exhibit all the
four stages of heat release- first stage of heat release due to the pilot fuel ignition, second stage is
LTHR of the main fuel ignition, and third stage is ITHR of the main fuel ignition and fourth
stage as HTHR of the main fuel ignition.
On the other hand, the pilot injections timings from -70 CAD to -12 CAD do not exhibit
the all the stages of ignition of the main fuel as shown in figure 11b. In these cases, the LTHR
together with NTC regime of the main ignition is very low that it can be considered negligible.
Therefore, these pilot timings have the first stage of heat release due to pilot ignition which is
directly followed by the main fuel ITHR and HTHR.
For the pilot injection at -11 CAD, all the four stages of heat release appear in the
combustion cycle (figure 11c) - the first stage of heat release due to pilot fuel ignition seen at
~-6.5 CAD which is then followed by the second stage heat release due to the main fuel ignition
i.e. LTHR at -5 CAD with the third and fourth stage of heat release of the main fuel ignition
happening later in the cycle around TDC.
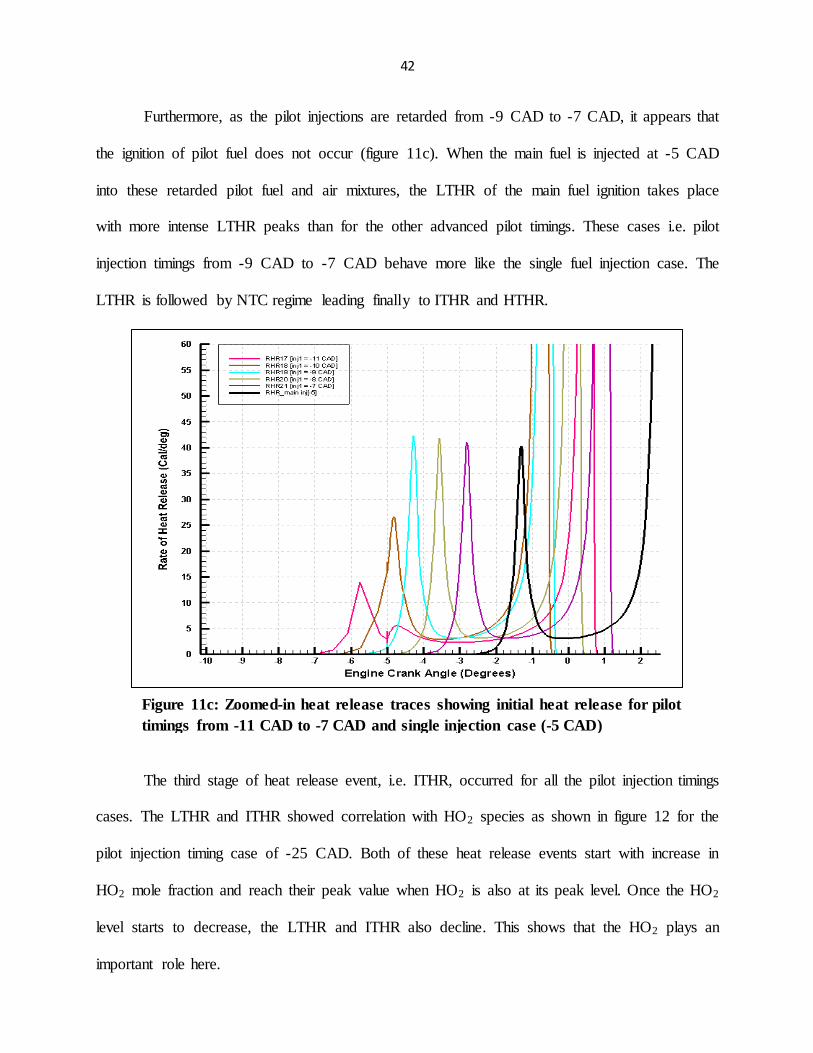
For pilot injection timing -10 CAD, it can be seen from figure 11c that the first stage heat
release due to the ignition of the pilot fuel starts before the main fuel is added at -5 CAD but as
soon as the main fuel is added to the pilot mixture, heat release rates increase starting at -5 CAD
as seen in figure 11c. It seems that the heat released here is due to the oxidation of both, pilot as
well as the main fuel; this could be the reason because the magnitude of the heat release here is
relatively greater than that for the advanced pilot injection timings from -165 CAD to -11 CAD.
Also, the ITHR and HTHR of the main fuel ignition for the pilot timing at -10 CAD is advanced
than other pilot injection cases.
Page 55
42
Furthermore, as the pilot injections are retarded from -9 CAD to -7 CAD, it appears that
the ignition of pilot fuel does not occur (figure 11c). When the main fuel is injected at -5 CAD
into these retarded pilot fuel and air mixtures, the LTHR of the main fuel ignition takes place
with more intense LTHR peaks than for the other advanced pilot timings. These cases i.e. pilot
injection timings from -9 CAD to -7 CAD behave more like the single fuel injection case. The
LTHR is followed by NTC regime leading finally to ITHR and HTHR.
The third stage of heat release event, i.e. ITHR, occurred for all the pilot injection timings
cases. The LTHR and ITHR showed correlation with HO2 species as shown in figure 12 for the
pilot injection timing case of -25 CAD. Both of these heat release events start with increase in
HO2 mole fraction and reach their peak value when HO2 is also at its peak level. Once the HO2
level starts to decrease, the LTHR and ITHR also decline. This shows that the HO2 plays an
important role here.
Figure 11c: Zoomed-in heat release traces showing initial heat release for pilot
timings from -11 CAD to -7 CAD and single injection case (-5 CAD)
Page 56
43
The combustion phasing of the main fuel ignition for all the varied pilot injection timings
occur in an unusual way during the combustion cycle as shown in figure 13. The plot also shows
the temperature, pressure and accumulated heat release at the start of main fuel addidtion i.e. 5
deg BTDC. The accumulated heat release is highest for the pilot injection timing of -25 CAD
compared to other pilot timings; which also results into high amount of heat release due to main
fuel ignition for that particular pilot timing. The crank angle at which the maximum heat release
takes place is observed to show varying trend. It gets retarded with pilot injection timings from -
165 CAD to -90 CAD; then advances for pilot injection timings between -90 CAD to -25 CAD;
again gets retarded for pilot injection timings from -20 CAD to -12 CAD; advances for pilot
injection timings between -12 CAD to -10 CAD; finally again shows retarded behavior for pilot
injection timings from -10 CAD onwards up to -7 CAD. The HTHR of -10 CAD pilot injection
timing is advanced than other pilot injection timings. The single injection case has the retarded
Figure 12: Relation between net heat release rate per CAD and HO2 mole
fraction for pilot injection timing of -25 CAD
Page 57
44
combustion phasing compared to all the split injection cases. The single injection case has the
LTHR at around 1.5 CAD BTDC with HTHR peak event at 2.8 CAD ATDC.
This combustion phasing due to different pilot injection timings could be the result of
substantial chemical changes happening before the main fuel addition. This is explained in the
next section.
Page 58
45
Fig
ure
13:
Tem
pera
ture
, P
ress
ure
an
d A
ccu
mu
late
d h
eat
rele
ase
at
5 d
eg B
TD
C;,
Max R
HR
due t
o m
ain
fuel
ignit
ion
and i
ts c
rank
angle
loca
tion f
or
dif
fere
nt
pilot
inje
ctio
n t
imin
gs
from
-165 C
AD
to -
7 C
AD
and f
or
the s
ingle
inje
ctio
n (
-
5 C
AD
) only
case
Page 59
46
4.3 Species Profile for the different pilot injection timings:
The chemical species formed due to the reactions during the combustion of the pilot
fuel/air mixture plays a significant role in the combustion of the main fuel/air mixture and its
phasing during the combustion cycle. The mole fractions of species obtained in the cycle were
normalized by their maximum value for their particular case. The normalized mole fraction of
species present at the beginning of main fuel injection i.e. at -5 CAD is plotted with respect to
the pilot injection sweep from -165 CAD to -5 CAD as shown in figure 14. The pressure and
temperature of the mixture at the start of main injection is also shown. The maximum net heat
release rate occurring in the last reactor due to the main injection is plotted along with the crank
angle location of it for the different pilot injection timings. The time taken by the main fuel to
achieve high temperature heat release or maximum net heat release rate after it is added at -5
CAD indicates the combustion phasing of the main fuel ignition. In order to analyze the kinetic
effect of the different species formed in the second reactor (I C Engine 2) on the ignition of the
main fuel in the last reactor (I C Engine 3), top 40 species according to their mole fractions were
considered at -5 CAD. Although top 40 species were considered, the plot shows the traces of 36
species which were common to all the cases of pilot timings. The 4 species which were not
common in all did not seem to be significant enough to have an impact on the combustion
phasing and are not shown in this plot. The plot shown in figure 14 is simplified in figures 14a,
14b, 14c, 14d, 14e and 14f; by plotting only few species in each of the figure.
Page 60
47
Fig
ure
14
: N
orm
alize
d M
ole
Fra
ctio
n o
f d
iffe
ren
t sp
ecie
s, T
emp
eratu
re &
Pre
ssu
re a
t 5 d
eg B
TD
C;
Max R
HR
du
e to
main
in
ject
ion
an
d i
ts c
ran
k a
ng
le l
oca
tion
for
dif
fere
nt
pilot
inje
ctio
n t
imin
gs
from
-165 C
AD
to -
7 C
AD
an
d f
or
the
sin
gle
in
ject
ion
(-5
CA
D)
on
ly c
ase
Page 61
48
Figure 14a: Change in Normalized Mole Fraction of N2, O2, H2O, NC7H16 and
CO2 for different pilot injection timings and single fuel injection case; Figure
14b: Change in Normalized Mole Fraction of CO, CH2O, H2O2, C2H4,
CH3CHO and C2H5CHO for different pilot injection timings and single fuel
injection case
Page 62
49
Figure 14c: Change in Normalized Mole Fraction of CH2CO, NC3H7CHO,
CH3OH, C2H3CHO and HOCHO for different pilot injection timings and
single fuel injection case; Figure 14d: Change in Normalized Mole Fraction of
C7H14O2-5, CO2, C7H14-2, C4H8-1, C7H14-3 and NC3H7COCH3 for different
pilot injection timings and single fuel injection case
Page 63
50
Figure 14e: Change in Normalized Mole Fraction of SC3H5CHO, C7H14O1-4,
C7H14-1, HO2, H2, C5H10-1 and C7H14O1-3 for different pilot injection timings
and single fuel injection case; Figure 14f: Change in Normalized Mole Fraction
of C4H7CHO1-1, C7H14O2-4, CH4, C2H2, C4H6, OH and O; Temperature and
Pressure at 5 deg BTDC for different pilot injection timings and single fuel
injection case
Page 64
51
In order to explain the effect of species on ignition delay shown in figure 14, it is being
divided into three parts- Part A, Part B and Part C as presented in figure 15. The following is the
division of pilot injection timings by taking into consideration their effect on the ignition delay
of the main fuel ignition:
1. Part A – Pilot injection timings from 165 CAD BTDC to 90 CAD BTDC
2. Part B – Pilot injection timings between 90 CAD BTDC to 12 CAD BTDC
3. Part C – Pilot injection timings between 12 CAD BTDC to 7 CAD BTDC; & Single injection
case at 5 CAD BTDC
The pilot injection timings were divided into three parts because each part shows a
specific behavior which is due to a particular reason playing an important role in that respective
part. This is explained in the following sections as follows:
Page 65
52
Fig
ure
15:
Div
isio
n o
f sp
ecie
s p
rofi
le i
nto
th
ree
part
s
Par
t A
Par
t C
Par
t B
Page 66
53
4.3.1 Part A: Pilot injection timings from 165 CAD BTDC to 90 CAD BTDC
This part deals with the effects of very advanced pilot injection timings (from -165
CAD to -90 CAD) on the ignition of the subsequent main injection. Figure 16 shows that as the
pilot timing is retarded from -165 CAD to -90 CAD, the combustion phasing of the HTHR of the
main ignition is delayed. In this part, the temperature and pressure at the start of main fuel
addition is increasing with retarded pilot injection timings as the effect of compression of the
charge in the reactor 1 and reactor 2; and so is the maximum heat released per CAD (HTHR) of
main fuel ignition in the last reactor. The initial temperature and pressure have shown to advance
the ignition delay of main injection in the literature. Although the temperature and pressure are
Figure 16: Part A- Effect of Pilot injection timings from -165 CAD to -90 CAD on Main
Ignition
Page 67
54
rising in this range of pilot injection timings (-165 CAD to -90 CAD), but the crank angle at
which this HTHR occurs is getting delayed. As mentioned earlier , this range of pilot injection
timings also exhibit all the stages of heat release due to ignition of main fuel- LTHR with NTC
regime followed by ITHR and HTHR during main ignition as displayed in figure 9 and 11a. The
specie that seem to have an effect on ignition delay of pilot injection timings in the part A is
formaldehyde (CH2O). The normalized mole fraction of CH2O taken at start of main fuel
addition i.e. at -5 CAD is increasing as the timing is retarded from -165 CAD to -90 CAD. This
shows that increase in CH2O has a retarding effect on the combustion phasing of main fuel
ignition even when the temperature and pressure are rising.
To examine further the effect of CH2O on the ignition delay of the main fuel, it was
added to the main fuel in varying amounts keeping the pilot injection timing constant (-90 CAD).
For this purpose, an additional inlet source (C4_Inlet3) was connected to Gas Mixer 2 (as shown
in figure 17) and Chemkin’s parameter study facility was used to run multiple runs of varying
CH2O flow rate. In the parameter study, the mass flow rate of CH2O was varied from 0.02 g/sec
to 0.1 g/sec. The temperature and pressure were initialized with the end temperature and pressure
of IC Engine 2.
Figure 18 shows the ignition delay of the main ignition in IC Engine 3 calculated by max
(dT/dt) plotted against the added mole fraction of CH2O. By running this parameter study of
CH2O, it was verified that CH2O can increase the ignition delay of the main injection by
approximately 0.15 degrees per 1000 ppm in the last reactor as shown in figure 18.
Page 68
55
Figure 18: Effect of formaldehyde (CH2O) on ignition delay of main
ignition
Figure 17: Chemkin Model to Study the Effect of formaldehyde (CH2O) on Ignition Delay of
Main ignition
Page 69
56
Figure 19a: Rate of Production of CH2O in Reactor 3 [IC Engine2]
Figure 19b: Rate of Production of CH2O in Reactor 5 [IC Engine3]
Page 70
57
Figure 19a and 19b shows the top five reactions playing important roles in the rate of
production of CH2O species in each of reactors 3 and 5 for pilot injection timing at -90 CAD.
All the reactions, i.e. Rxn# 174, 326, 615, 892 and 2265 from reactor 3 lead to CH2O formation
in reactor 3. In Rxn# 43, the reaction of CH2O with OH results in a rapid decrease in its level
during main combustion in reactor 5. The reactions with their respective Arrhenius constants for
forward and reverse reactions are given in Table 4.1.
Reaction # Reactions
Arrhenius Coefificients
Forward Reaction Reverse Reaction
A n Ea A n Ea
Reactor 3 [IC Engine 2]
174 C2H5O=CH3+CH2O 1.32E+20 -2.018 2.08E+04 3.00E+11 0.00E+00 6.34E+03
326 CH3COCH2O=CH3CO+CH2O 3.73E+20 -2.176 1.73E+04 1.00E+11 0.00E+00 1.19E+04
615 NC3H7O=C2H5+CH2O 2.72E+21 -2.45 1.57E+04 1.00E+11 0.00E+00 3.50E+03
892 PC4H9O=NC3H7+CH2O 1.56E+21 -2.44 1.52E+04 5.00E+10 0.00E+00 3.46E+03
2265 C7H15O-1=CH2O+C6H13-1 6.02E+20 -2.18 2.48E+04 1.00E+11 0.00E+00 1.19E+04
Reactor 5 [IC Engine 3]
43 CH2O+OH=HCO+H2O 7.82E+07 1.63 -1055 4.89E+06 1.811 2.90E+04
63 CH3O (+M)=CH2O+H(+M) 6.80E+13 0 2.62E+04
72 CH2OH+O2=CH2O+HO2 2.41E+14 0 5017 3.15E+13 0.42 2.51E+04
111 CH3+O=CH2O+H 5.54E+13 0.05 -136 3.83E+15 -0.147 6.84E+04
230 CH2CHO+O2=>CH2O+CO+OH 8.95E+13 -0.6 1.01E+04
Table 4.1: Reactions for rate of production of CH2O
Page 71
58
4.3.2 Part B: Pilot injection timings between 90 CAD BTDC to 12 CAD BTDC
The effect of pilot injection timings between -90 CAD to -12 CAD on main injection at -
5 CAD is explained in this part. As the pilot injection timing is swept from -90 CAD to -25
CAD, the combustion phasing at first advances but after -25 CAD and up to -12 CAD, it is seen
that the combustion phasing is delayed. This is elucidated using the chemistry of important
intermediate species formed during pilot combustion (figure 19).
The species that play an important role here are formaldehyde (CH2O), hydrogen
peroxide (H2O2), acetylene (C2H2) and 1,3-butadiene (C4H6). It was seen that an increase in H2O2
and C2H2 mole fraction has an advancing effect on main injection combustion. It is also shown in
other research [34, 35] that these species, even when present in small amounts, can promote the
autoignition of the mixture. Also, CH2O is known to be a autoignition inhibitor. In this part, the
CH2O mole fraction leaving Reactor 2 is decreasing as the pilot injection timings are retarded.
Although the CH2O is not decreasing by a substantial amount, it may be the reason for the
advancing of ignition here; this holds true only for pilot timings until -25 CAD because after that
the CH2O shows no effect on combustion phasing as seen in figure 19. The C4H6 (1,3-butadiene)
is another specie whose mole fractions correlate with a reduction in ignition delay time. The
mole fraction of these three species is at its peak for a pilot injection timing of -25 CAD for
which the combustion phasing is advanced compared to others. When the mole fraction starts to
drop, from -25 CAD onwards, the heat release event is retarded.
Page 72
59
To prove the effect of H2O2, C2H2 and C4H6 on the ignition delay of the main injection,
the parameter study was set up in the same manner as shown in figure 17 for the CH2O study.
The species were added externally to the last reactor (one specie at a time) in varying amounts
while keeping the pilot injection timing constant (-25 CAD). The temperature and pressure were
initialized with the end temperature and pressure of IC Engine 2. Figure 20a, 20b and 20c show
the ignition delay of the main ignition in IC Engine 3 calculated by max (dT/dt) plotted against
the mole fraction of H2O2, C2H2 and C4H6 added to the main fuel. As seen from the figure, H2O2
advances the ignition by 0.6 degrees; C2H2 is advancing it by 0.2 degrees; and C4H6 by 0.1
Figure 19: Part B- Effect of Pilot injection timings between -90 CAD to -12 CAD on Main
Ignition
Page 73
60
degrees per 1000 ppm mole fraction of respective specie. By running this parameter study, it was
verified that these species have an advancing effect on the ignition delay of the main injection in
the IC Engine 3, with H2O2 having a greater effect than C2H2, followed by C4H6.
Figure 20a: Effect of H2O2 on ignition delay of main ignition
Page 74
61
Figure 20c: Effect of C4H6 (1,3-butadiene) on ignition delay of main
ignition
Figure 20b: Effect of C2H2 on ignition delay of main ignition
Page 75
62
Figure 21a: Rate of Production of H2O2 in Reactor 3 [IC Engine2]
Figure 21b: Rate of Production of H2O2 in Reactor 5 [IC Engine3]
Page 76
63
Figure 21c: Rate of Production of C2H2 in Reactor 3 [IC Engine2]
Figure 21d: Rate of Production of C2H2 in Reactor 5 [IC Engine3]
Page 77
64
Figure 21e: Rate of Production of C4H6 in Reactor 3 [IC Engine2]
Figure 21f: Rate of Production of C4H6 in Reactor 5 [IC Engine3]
Page 78
65
Figures from 21a to 21f show the top five reactions leading to rate of production of
H2O2, C2H2 and C4H6 species in each of reactor 3 and reactor 5, having pilot injection timing
at -25 CAD. The major reaction contributing to H2O2 production is Rxn# 15 compared to the
other three reactions. Rxn# 16 starts to consume the H2O2 radicals with the start of LTHR of
pilot ignition. The reaction rate of Rxn# 16 is slow initially but gains momentum during the main
combustion in the last reactor; thus, the rate of production of H2O2 goes negative due to the
formation of OH radicals by Rxn# 16 which is associated with the HTHR. In case of C2H2
formation in reactor 2, Rxn# 774 is the main contributor compared to other reactions. The C4H6
is being formed during LTHR of pilot fuel ignition by all the reactions given in table 4.4 for
reactor 3. The C4H6 is produced in the last reactor by Rxn# 778 and 1432 only. The forward
and reverse reactions with their respective Arrhenius constants controlling H2O2, C2H2 and
C4H6 species fractions are given in Table 4.2, 4.3 and 4.4 respectively. Thus, the intermediate
species formed during pilot combustion play an important role in heat release of the main fuel
ignition and its combustion phasing in this range of pilot injection timings.
Reaction # Reactions
Arrhenius Coefificients
Forward Reaction Reverse Reaction
A n Ea A n Ea
14 H2O2+O2=2HO2 1.14E+16 -0.347 4.97E+04 1.03E+14 0.00E+00 1.10E+04
15 H2O2+O2=2HO2 2.14E+13 -0.347 3.73E+04 1.94E+11 0.00E+00 -1.41E+03
16 H2O2(+M)=2OH(+M) 2.95E+14 0 4.84E+04
20 H2O2+OH=H2O+HO2 2.00E+12 0 4.27E+02 3.66E+10 5.89E-01 3.13E+04
47 CH2O+HO2=HCO+H2O2 7.10E-03 4.517 6.58E+03 2.43E-02 4.11E+00 5.77E+03
Reactor 5 [IC Engine 3]
14, 15, 16, 47 Same as above
21 H2O2+OH=H2O+HO2 1.70E+18 0 2.94E+04 3.12E+16 5.89E-01 6.03E+04
Table 4.2: Reactions for rate of production of H2O2
Page 79
66
Reaction # Reactions
Arrhenius Coefificients
Forward Reaction Reverse Reaction
A n Ea A n Ea
Reactor 3 [IC Engine 2]
264 C2H3+O2=C2H2+HO2 2.12E-06 6 9.48E+03 1.09E-05 5.91E+00 2.40E+04
271 C2H2+O2=HCCO+OH 2.00E+08 1.5 3.01E+04 2.04E+06 1.50E+00 3.22E+04
510 C3H5-A+O2=C2H2+CH2O+OH 9.72E+29 -5.71 2.14E+04
774 C4H71-1=C2H2+C2H5 1.07E+15 -0.56 3.03E+04 2.00E+11 0.00E+00 7.80E+03
2487 C5H91-1=C2H2+NC3H7 2.76E+15 -0.67 3.08E+04 2.00E+11 0.00E+00 7.80E+03
Reactor 5 [IC Engine 3]
264, 271 Same as above
273 C2H2+O=CH2+CO 6.94E+06 2 1.90E+03 4.05E+01 3.20E+00 4.84E+04
274 C2H2+O=HCCO+H 1.35E+07 2 1.90E+03 4.76E+07 1.65E+00 2.08E+04
276 C2H2+OH=CH2CO+H 3.24E+13 0 1.20E+04 3.06E+17 -8.02E-01 3.60E+04
Reaction
#
Reactions Arrhenius Coefificients
Forward Reaction Reverse Reaction
A n Ea A n Ea
Reactor 3 [IC Engine 2]
785 C4H71-3+O2=C4H6+HO2 1.00E+09 0 0.00E+00 1.00E+11 0 1.70E+0
4
1432 C5H91-3=C4H6+CH3 7.55E+14 -0.52 3.85E+04 1.00E+11 0 7.80E+0
3
2152 C7131-3=C4H6+NC3H7 1.11E+19 -1.53 4.07E+04 8.50E+10 0 8.30E+0
3
2500 C4H6CHO1-13=C4H6+HCO 8.95E+17 -1.28 4.62E+04 8.00E+10 0 1.14E+0
4
2819 C6H101-3+OH=C2H3+C4H6+H2O 2.76E+04 2.64 -1.92E+03
Reactor 5 [IC Engine 3]
778 C4H71-3=C4H6+H 1.20E+14 0 4.93E+04 4.00E+13 0 1.30E+0
3
795 C4H6+OH=C2H5+CH2CO 1.00E+12 0 0.00E+00 3.73E+12 0 3.00E+0
4
796 C4H6+OH=CH2O+C3H5-A 1.00E+12 0 0.00E+00 3.50E+06 0 7.11E+0
4
797 C4H6+OH=C2H3+CH3CHO 1.00E+12 0 0.00E+00 5.44E+11 0 1.86E+0
4
1432 Same as above
Table 4.3: Reactions for rate of production of C2H2
Table 4.4: Reactions for rate of production of C4H6
Page 80
67
4.3.2 Part C: Pilot injection timings between 12 CAD BTDC to 7 CAD BTDC & Main
Injection only at 5 CAD BTDC
Part C shows the effect of very retarded pilot injection timings (between -12 CAD to -7
CAD) on the succeeding main ignition. As a benchmark, for reference, it also shows the kinetic
behavior of single main injection case. Figure 22 shows only the important parameters and
species for pilot timings of Part C. As the pilot injection is retarded to occur near the main
injection, the HTHR of pilot timings advances from -12 CAD to -10 CAD, but for pilot injection
after -9 CAD to -7 CAD as well as single injection case, the crank angle location of the HTHR of
the main fuel is retarded. The combustion taking place here seems to be behaving like the
combustion in constant volume combustion chamber (CVC) showing its dependence on the
temperature of the mixture.
Therefore, to explain the behavior of the pilot injection timings in this part on main
ignition, a constant volume combustion chamber (CVC) was employed in Chemkin with n-
heptane/air mixture. A temperature parameter study was set up to investigate the effect of initial
temperature on the ignition delay of the mixture. The initial temperature from 800 K to 1000 K
was tested with an initial pressure as 40 Atm and considering an adiabatic process. The data
obtained using this simulation gave very interesting result as shown in figure 23.
Page 81
68
As can be seen in figure 23, the ignition delay (ID) is advanced as the temperature is
increased from 800 K to 840 K. When the temperature is increased further till 940 K, the ID is
delayed. Any further increase in initial temperature again advances the ID. In the simulation
result of split injection model for Part C (figure 22), the occurrence of max HTHR of main
ignition for pilot injection timing of -10 CAD is more advanced than other pilot timings in this
part. The initial temperature at the start of main fuel addition for pilot timing of -10 CAD is ~850
K. As the pilot injection timing is advanced compared to -10 CAD, the temperature is increasing
(>850 K) and the combustion phasing of the HTHR of main ignition is also getting delayed
Figure 22: Part C- Effect of Pilot injection timings between -12 CAD to -7 CAD and single
fuel injection case at -5 CAD on Main Ignition
Page 82
69
which is similar to the results obtained from CVC simulation. Moreover, when the pilot injection
timing is retarded (after -10 CAD), the initial temperature is reduced (< 840 K) which results in
increase in combustion phasing of main. The single fuel injection case also shows the retarded
combustion phasing due to the initial temperature being < 840 K. Thus, the main fuel ignition for
the pilot injection timings from -12 CAD to -5 CAD proceed as constant volume combustion
with the dependence of combustion phasing on initial temperature of the mixture.
Figure 22 also shows the changes in the mole fraction of few selected species. The
normalized mole fraction of OH and O is increasing for pilot timings between -12 CAD to -10
CAD which implies that the exothermic reactions leading to combustion of main fuel are very
active in this region of pilot timings. Thus, there is rapid combustion of the main fuel with
reduced ignition delay. As the OH level drops (figure 22) for pilot timings later than -10 CAD,
the combustion phasing is also delayed.
Figure 23: Temperature parameter study in CVC
Page 83
70
Figure 24a: Rate of Production of OH in Reactor 3 [IC Engine2]
Figure 24b: Rate of Production of OH in Reactor 5 [IC Engine3]
Page 84
71
Figures 24a and 24b show the top five reactions leading to rate of production of the OH
specie in each of reactor 3 and reactor 5 for the pilot timing of -10 CAD. The reactions with
Arrhenius constants for forward and reverse reactions for OH species are given in Table 4.5. The
OH is getting consumed by n-heptane in the Rxn# 1980, 1981, 1982 and 1983 as soon as it is
getting produced by Rxn# 230 in reactor 3, i.e. I C Engine2. In the last reactor, Rxn# 1, 4 and 16
are producing OH radicals and Rxn# 13 and 24 are consuming it.
Reaction
# Reactions
Arrhenius Coefificients
Forward Reaction Reverse Reaction
A n Ea A n Ea
Reactor 3 [IC Engine 2]
230 CH2CHO+O2=CH2O+CO+OH 8.95E+13 -0.6 1.01E+04
1980 NC7H16+OH=C7H15-1+H2O 2.57E+07 1.80 9.54E+02 2.95E+04 2.33 1.82E+04
1981 NC7H16+OH=C7H15-2+H2O 4.90E+06 2 -5.96E+02 3.62E+02 2.87 1.91E+04
1982 NC7H16+OH=C7H15-3+H2O 4.90E+06 2 -5.96E+02 3.62E+02 2.87 1.91E+04
1983 NC7H16+OH=C7H15-4+H2O 4.90E+06 2 -5.96E+02 3.62E+02 2.87 1.91E+04
Reactor 5 [IC Engine 3]
1 H+O2=O+OH 3.55E+15 -0.406 1.66E+04 1.03E+13 -1.50E2 -1.33E+02
4 O+H2O=2OH 2.97E+06 2.02 1.34E+04 1.45E+05 2.11 -2.90E+03
13 HO2+OH=H2O+O2 1.97E+10 0.962 -3.28E+02 3.99E+10 1.20 6.93E+04
16 H2O2(+M)=2OH(+M) 2.95E+14 0 4.84E+04
24 CO+OH=CO2+H 2.23E+05 1.89 -1.16E+03 5.90E+11 6.99E01 2.43E+04
Table 4.5: Reactions for rate of production of OH
Page 85
72
CHAPTER 5
CONCLUSIONS AND RECOMMENDATIONS
5.1 Conclusions:
The kinetics of a split injection model was simulated in Chemkin-Pro to study the effects
of ignition of pilot injection on the combustion phasing of the following main injection. The
HCCI model was studied for the pilot injections timing sweep from 165 deg BTDC to 7 deg
BTDC with constant main injection timing of 5 deg BTDC. Also, the single fuel injection case
was used as reference to study the split injection results. The following are the conclusions for
the split injection simulation:
1. The split injection showed four stages of heat release- first stage is low temperature heat
release due to ignition of the pilot fuel; followed by second stage as LTHR of ignition of
main fuel, third stage as ITHR of main fuel ignition and finally, fourth stage as HTHR of
main ignition. These four stages were exhibited by the pilot injection timings from -165 CAD
to -90 CAD and for pilot timing of -11 CAD but the pilot timings from -70 CAD to -12 CAD
showed only first stage, third stage and fourth stage. The pilot timing of -10 CAD had
combined first stage heat release with second stage heat release followed by last two stages
of heat release- ITHR and HTHR; whereas pilot injection timings from -9 CAD onwards up
to -7 behaved like the single injection case exhibiting all the stages of main fuel ignition only
with LTHR being higher than that for other pilot timings.
2. It was observed that the phasing of the main fuel combustion is retarded when the pilot fuel
is introduced at crank angle location from 165 deg BTDC to 90 deg BTDC. The reason for
this behavior of main ignition was the increasing level of formaldehyde (CH2O) mole
Page 86
73
fraction at the start of main fuel addition. Thus, CH2O acted as auto ignition inhibitor of the
main fuel for pilot injection timings: 165 deg BTDC to 90 deg BTDC.
3. For the pilot injection events between 90 deg BTDC to 12 deg BTDC, it was detected that the
intermediate species- hydrogen peroxide (H2O2), acetylene (C2H2) and 1,3-butadiene (C4H6)
have a noteworthy impact on the heat release and combustion phasing of main injection. All
three were shown to promote the autoignition of the main fuel and thus advance the
combustion phasing. The most significant of all three was H2O2 followed by C2H2 and then
C4H6. These three species reached a peak value at 25 deg BTDC. Therefore, the pilot
injection timing 25 deg BTDC showed advanced phasing of main combustion. When the
levels of these species started to drop after -25 CAD, the combustion phasing also started to
retard.
4. The main fuel ignition for pilot injection cases between 12 deg BTDC to 7 deg BTDC as well
as single main injection case was noted to be dependent on the initial temperature of the
mixture at the start of main fuel injection. This effect was also seen in constant volume
combustion chamber study of initial temperature variation. The combustion phasing was
advanced for pilot timing 10 deg BTDC which had initial temperature ~850 K. As the
temperature was increased (850 K < T < 940 K), the combustion phasing was retarded as
seen for pilot timings earlier than 10 deg BTDC up to 12 deg BTDC. This was also observed
when the temperature was < 850 K for pilot events from 10 deg BTDC onwards and the
single fuel injection case.
5. The oxidation reactions were very fast for the main combustion for the pilot injection cases
between 12 deg BTDC to 10 deg BTDC which showed the presence of increasing levels of
OH and O.
Page 87
74
5.2 Recommendations:
1. The above results are based on simulation of pilot injection sweep in HCCI model in
Chemkin-Pro; it would be interesting to validate these results by carrying out the experiment
on a real time engine.
2. The simulation was run for pilot injection sweep by keeping the speed, compression ratio,
main injection timing constant. The future work could be to run this split injection model by
varying these parameters.
3. Moreover, the simulation was run with equal quantities of split injection, it would give some
interesting results if carried out with varying amount of pilot injection and main injection fuel
quantities.
Page 88
75
REFERENCES
1. Singh, J., “An investigation of low temperature combustion concept in a small bore high
speed direct injection diesel engine”, Master’s thesis report, Wayne State University,
2006
2. Jaaskelainen, H., “Low temperature combustion”, DieselNet Technology Guide on
(http://www.dieselnet.com/tech/engine_ltc.php)
3. “Subsystems required to control low temperature combustion engines”, an article
published in 2013 on National Instruments website, (http://www.ni.com/white-
paper/13516/en/)
4. Sandia, 2005. “CFR Newsletter: Imaging of advanced low-temperature diesel
combustion”, Combustion Research Facility News, Sandia National Laboratories,
Livermore, CA, USA, 25(5), 2
5. Musculus, M., "Multiple Simultaneous Optical Diagnostic Imaging of Early-Injection
Low-Temperature Combustion in a Heavy-Duty Diesel Engine," SAE Technical Paper
2006-01-0079, 2006, doi:10.4271/2006-01-0079
6. Koci, C. P., Ra, Y., Krieger, R., Andrie, M., Foster, D. E., Siewert, R. M., Durett, R. P.,
“Multiple event fuel injection investigations in a highly dilute diesel low temperature
combustion regime”, SAE paper 2009-01-0925
7. Thirouard, B., Mendez, S., “Using multiple injection strategies in diesel combustion:
potential to improve emissions, noise, and fuel economy trade-off in low CR engines”,
SAE paper 2008-01-1329
Page 89
76
8. Anselmi, P., Kashdan, J., Bression, G., Ferrero-Lesur, E., Thirouard, B., Walter, B.,
“Improving emissions, noise and fuel economy trade-off by using multiple injection
strategies in diesel low temperature combustion (LTC) mode”, SAE paper 2010-01-2162
9. Fang, T., Coverdill, R. E., Lee, C. F., White, R. A., “Combustion and soot visualization
of low temperature combustion within an HSDI diesel engine using multiple injection
strategy”, SAE paper 2006-01-0078
10. Zuehl, J. R., Ghandhi, J., Hagen, C., Cannella, W., “Fuel effects on HCCI combustion
using negative valve overlap”, SAE International 2010-01-0161
11. Tanaka, S., Ayala, F., Keck, J. C., Heywood, J. B., “Two-stage ignition in HCCI
combustion and HCCI control by fuels and additives”, Combustion and Flame, 132: 219-
239, 2003
12. Lu, X., Ji, L., Zu, L., Hou, Y., Huang, C., Huang, Z., “Experimental study and chemical
analysis of n-heptane homogeneous charge compression ignition combustion with port
injection of reaction inhibitors”, Combustion and Flame, 149: 261-270, 2007
13. Takada, K., Yoshimura, F., Ohga, Y., Kusaka, J. et al., "Experimental study on
unregulated emission characteristics of turbocharged DI diesel engine with common rail
fuel injection system," SAE Technical Paper 2003-01-3158
14. Heywood, J. B., Internal Combustion Engine Fundamentals, McGraw-Hill New York,
ISBN 0-13-978-0070286375, 1988
15. Jansons, M., Brar, A., Estefanous, F., Florea, R. et al., "Experimental investigation of
single and two-stage ignition in a diesel engine," SAE Technical Paper 2008-01-1071
16. Fieweger, F., et al., 1997. “Self-ignition of S.I. engine model fuels: a shock tube
investigation at high pressure”, Combust. Flame, 109, 599-619
Page 90
77
17. Barckholtz, T. A., ”Modelling the negative temperature coefficient in the low
temperature oxidation of light alkanes”, American Chemical Society, Division Fuel, 2003
18. Jayakumar, C., Zheng, Z., Joshi, U. M., Bryzik, W., Henein, N. A., Sattler, E., “Effect of
inlet air temperature on auto ignition of fuels with different cetane number and
volatility”, ASME, ICEF 2011-60141
19. Juttu, S., Thipse, S. S., Marathe, N. V., Gajendra Babu, M. K., “Diesel HCCI combustion
control parameters study using n-heptane reduced chemical kinetic mechanism”, SAE
paper 2008-28- 0036
20. Barckholtz, T. A., ”Modelling the negative temperature coefficient in the low
temperature oxidation of light alkanes”, 2003
21. Kook, S., Bae, C., Miles, P., Choi, D. et al., "The influence of charge dilution and
injection timing on low-temperature diesel combustion and emissions," SAE Technical
Paper 2005-01-3837
22. Suh, H. K., “Investigation of multiple injection strategies for the improvement of
combustion and exhaust emission characteristics in a low compression ratio (CR)
engine”, Applied Energy, 88: 5013-5019, 2011
23. Machrafi, H., Cavadiasa, S., “An experimental and numerical analysis of the influence of
the inlet temperature, equivalence ratio and compression ratio on HCCI autoignition
process of primary reference fuels in an engine”, Fuel Processing Technology, 89: 1218-
1226, 2008
24. Ju. Y., Sun, W., Burke, M. P., Gou, X., Chen, Z., “Multi-timescale modeling of ignition
and flame regimes of n-heptane-air mixtures near spark assisted homogeneous charge
compression ignition conditions”, Proceedings of Combustion Institute, 33: 1245-1251,
2011
Page 91
78
25. Ishiyama, T., Shioji, M., Ihara, T., Katsuura, A., “Modelling and experiments on ignition
of fuel sprays considering the interaction between fuel-air mixing and chemical
reactions”, SAE paper 2003-01-1071
26. Fitzgerald, R. and Steeper, R., "Thermal and chemical effects of NVO fuel injection on
HCCI combustion," SAE Int. J. Engines 3(1):46-64, 2010, doi:10.4271/2010-01-0164
27. Choi, S., Min, K., “Analysis of the combustion and emissions of a diesel engine in early-
injection, partially premixed charge compression ignition regimes”, Proceeding of
IMechE, Part D: Journal of Automobile Engineering, 227:939, 2013
28. Miles, P. C., Sahoo, D., Busch, S., Trost, J., Leipertz, A., “Pilot injection ignition
properties under low-temperature dilute in-cylinder conditions”, SAE Int. J. Engines,
2013-01-2531
29. Mueller, C. J., Martin, G. C., Briggs, T. E., Duffy, K. P., “An experimental investigation
of in-cylinder processes under dual-injection conditions in a DI diesel engine”, SAE
paper 2004-01-1843
30. Xingcai, L., Yuchun, H., Linlin, Z., Zhen, H., “Experimental study on the auto ignition
and combustion in the homogeneous charge compression ignition (HCCI) combustion
operation with ethanol/n-heptane blend fuels by port injection”, Fuel, 85: 2622-2631,
2006
31. Jansons, M., Florea, R., Zha, K., and Florea, E., "The combined effect of HCHO and
C2H4 addition on combustion in an optically accessible diesel engine fueled with JP-8,"
SAE Int. J. Engines 4(1):2048-2064, 2011, doi:10.4271/2011-01-1392
32. Walker, R. W., “Reactions of HO2 radicals in combustion chemistry”, Twenty Second
Symposium (International) On Combustion, The Combustion Institute, p. 883-892, 1988
Page 92
79
33. Goto, K., Iijima, A., Yoshida, K., and Shoji, H., "Analysis of the characteristics of HCCI
combustion and ATAC combustion using the same test engine," SAE Technical Paper
2004-32-0097
34. Wong, Y. K., Karim, G. A., “A kinetic examination of the effects of recycled exhaust
gases on the autoignition of homogeneous n-heptane-air mixtures in engines”, SAE paper
2000-01-2037
35. Puranam, S., Steeper, R., "The Effect of Acetylene on iso-octane Combustion in an HCCI
Engine with NVO", SAE Int. J. Engines 5(4):1551-1560, 2012, doi:10.4271/2012-01-
1574
36. Mehl, M., Pitz, W., Sarathy, M., Yang, Y., Dec, J., “Detailed Kinetic Modeling of
Conventional Gasoline at Highly Boosted Conditions and the Associated Intermediate
Temperature Heat Release”, SAE paper 2012-01-1109
37. Vuilleumier, D., Selim, H., Dibble, R., and Sarathy, M., "Exploration of Heat Release in
a Homogeneous Charge Compression Ignition Engine with Primary Reference Fuels,"
SAE Technical Paper 2013-01-2622, 2013
38. Ando, H., Sakai, Y., and Kuwahara, K., "Universal Rule of Hydrocarbon Oxidation,"
SAE Technical Paper 2009-01-0948, 2009
Page 93
80
ABSTRACT
AN INVESTIGATION OF KINETIC EFFECTS OF SPLIT INJECTION TIMING ON LOW
TEMPERATURE COMBUSTION
by
TEJASWINI A. KAMBLE
May 2014
Advisor: Dr. Marcis Jansons
Major: Mechanical Engineering
Degree: Master of Science
Low temperature combustion (LTC) modes of operating internal combustion
engines are of great interest for their potential to achieve high thermal efficiencies while
maintaining low nitrogen oxide (NOX) and particulate matter emissions below levels requiring
costly after-treatment systems. While various strategies for realizing LTC have been developed,
including homogeneous charge compression ignition (HCCI), reactivity controlled compression
ignition (RCCI) and premixed charge compression ignition (PCCI), a common challenge is the
control of the kinetically-driven auto-ignition processes over appreciable load ranges.
This study examines the chemical kinetics of split-injection timing and the kinetic
effect of this parameter on combustion phasing and pressure rise rate. Detailed reaction
mechanisms are applied in CHEMKIN-based kinetic simulations to model the production and
composition of combustion intermediates produced by a pilot injection through different
pressure-temperature histories. The influence of these intermediates on the combustion phasing
of the following main fuel ignition is examined. Different pilot injection timings were tried
keeping the main fuel addition timing constant. The temperature, pressure and rate of heat
Page 94
81
release profiles during the combustion cycle for varied pilot fuel injection timings were
compared along with the species composition at the start of main fuel addition. The results will
provide insight to the role of pilot injection timing on LTC control.
Page 95
82
AUTOBIOGRAPHICAL STATEMENT
Tejaswini A. Kamble
1987 Born in Kolhapur, Maharashtra, India
2006-2010 Studied Mechanical Engineering in University of Mumbai, India
June, 2010 Bachelor of Engineering (Mechanical Engineering), University of Mumbai,
India
2011-2014 Graduate Student, Mechanical Engineering Department, Wayne State
University, Detroit, MI, U.S.A
2011-2012 Student Assistant, Mechanical Engineering Department, Wayne State
University, Detroit, MI, U.S.A
2012-2013 Graduate Teaching Assistant & Research Assistant, Mechanical Engineering
Department, Wayne State University, Detroit, MI, U.S.A
2013- Present Engineering Assistant, Commercial Engines, FEV North America, Inc.,
Auburn Hills, MI, U.S.A