Page 1
An investigation on consumer behavior and preferences
towards apparel, purchase by Indian consumers age 15 – 25
Submitted by Karthikeyan Sundarraj S105650
MASTER OF SCIENCE
Branch: Applied Textile Management
Swedish School of Textiles, Högskolan i Borås, S-501 90 Borås
Revised 6 August 2011
The Swedish School of Textiles
Högskolan i Borås, S-501 90 Borås
Page 2
Consumer behavior ii 6 August 2011
An investigation on consumer behavior and preferences towards apparel,
purchase by Indian consumers age 15 – 25
Bonafide record of work done by
Karthikeyan Sundarraj S105650
Dissertation submitted in partial fulfillment of the requirements for the degree of
MASTER OF SCIENCE
Branch: Applied Textile Management
of Swedish school of textiles, University of Borås, Sweden
August 2011
Mr. David Goldsmith, Faculty guide Prof. Håkan Torstensson Programme Co-ordinator Certified that the candidate was examined in the viva-voce examination held on May
25th 2011
Jonas Larson Daniel Ekwall, Heikki Mattila, Examiners
Page 3
Consumer behavior iii 6 August 2011
Table of Contents
Executive Summary ...................................................................................................... 1
1.0 Indian Retail Market ................................................................................................ 2
1.1 Organised Retailing ................................................................................................ 3
1.2 Indian Scenario on Apparel Retailing ..................................................................... 3
1.3 Apparel Fashion ..................................................................................................... 4
1.4 Malls in India—A Look into the Future .................................................................... 4
1.5 Fashion Trends in India .......................................................................................... 5
1.6 Apparel Market-Value Growth ................................................................................ 5
1.7 RNCOS‘ Market Research Report .......................................................................... 6
1.8 The Long Road Ahead............................................................................................ 7
2.0 Problem Focus ....................................................................................................... 8
2.1 Objectives of the Study ........................................................................................... 8
2.2 Limitations of the Study .......................................................................................... 8
2.3 Research Methodology ........................................................................................... 9
2.3.1Selection of the Study Area .................................................................................. 9
2.3.2 Sampling Design ................................................................................................. 9
2.3.3 Type of Data Collected ........................................................................................ 9
2.3.4 Method of Data Collection ................................................................................. 10
3.0 Review of Literature .............................................................................................. 11
3.1 Retailing ................................................................................................................ 11
3.2 Retailer ................................................................................................................. 12
3.2.1 Top retailers in India .......................................................................................... 13
3.2.1.1 Pantaloon retail ............................................................................................... 13
3.2.1.2 K Raheja group ............................................................................................... 13
3.2.1.3 Tata group ...................................................................................................... 13
3.2.1.4 RPG group ...................................................................................................... 13
3.2.1.5 Landmark group ............................................................................................. 13
3.2.1.6 Bharathi-Wal-Mart........................................................................................... 13
3.2.1.7 Reliance .......................................................................................................... 14
3.2.1.8 A V Birla groups .............................................................................................. 14
3.2.1.9 Metro .............................................................................................................. 14
Page 4
Consumer behavior iv 6 August 2011
3.2.1.10 Viveks Ltd ..................................................................................................... 14
3.3 Promotion ............................................................................................................. 14
3.4 Sales Promotion ................................................................................................... 15
3.5 Consumer ............................................................................................................. 16
3.6 Consumer Behaviour ............................................................................................ 17
3.7 Awareness ............................................................................................................ 18
3.8 Consumer Service ................................................................................................ 18
3.9 Consumer Preference........................................................................................... 19
3.10 Consumer Satisfaction ........................................................................................ 20
4.0 Results and Discussion ........................................................................................ 21
4.1 General data ......................................................................................................... 21
4.2 Income group ........................................................................................................ 21
4.3 Nature of family .................................................................................................... 22
4.4 Frequency of purchase by consumers .................................................................. 22
4.5 Reasons for not buying apparel regularly (once in a month) ................................ 24
4.6 Type of brand ....................................................................................................... 25
4.7 Source of information about the products ............................................................. 26
4.8 Brand features considered for purchasing ............................................................ 28
4.9 Understanding the term ethical fashion ................................................................ 29
4.10 Price of Ethical fashion ....................................................................................... 31
4.11 Purchase of ethical products .............................................................................. 33
4.12 Dressing style vs. latest trend ............................................................................. 34
4.13 Ethical fashion as an option during purchase ..................................................... 36
4.14 Clothing type ....................................................................................................... 37
4.15 Buying behavior based on clothing attributes ..................................................... 38
4.16 Trend .................................................................................................................. 40
4.17 Spending on apparel .......................................................................................... 41
4.18 Following the fashion/style .................................................................................. 42
4.19 Product features priority ...................................................................................... 44
4.20 Sensory feelings ................................................................................................. 45
4.21 Sensory feeling and brand .................................................................................. 46
4.22 Why consumers dislike fashion .......................................................................... 47
4.23 Awareness about Ethical fashion ........................................................................ 48
Conclusion .................................................................................................................. 49
List of Sources ............................................................................................................ 55
Page 5
Consumer behavior v 6 August 2011
List of Tables
Table 1 Per capita purchase of all textiles at all india level ............................................. 6
Table 2 Respondents age group wise ........................................................................... 21
Table 3 Income group in all age group .......................................................................... 22
Table 4 Family type ....................................................................................................... 22
Table 5 Frequency of purchase ..................................................................................... 22
Table 6 Reason for not buying vs. age group ................................................................ 24
Table 7 Brand type vs. age group ................................................................................. 25
Table 8 Information source ............................................................................................ 27
Table 9 Perception towards a brand ............................................................................. 28
Table11 Understanding of ethical fashion term ............................................................. 30
Table10 Ethical fashion vs. price ................................................................................... 32
Table12 Buying decision for ethical fashion products.................................................... 33
Table13 Dressing style and trend .................................................................................. 35
Table14 Ethical fashion as an option............................................................................. 36
Table15 Clothing type ................................................................................................... 37
Table16 Buying behavior on clothing attributes ............................................................. 38
Table17 Trend vs. age group ........................................................................................ 40
Table18 Spending vs. age group .................................................................................. 41
Table19 Gender wise fashion/style ............................................................................... 43
Table 20 Product feature ranking .................................................................................. 44
Table 21Sensory feeling ................................................................................................ 45
Table 22 Sensory feeling vs. brand ............................................................................... 46
Page 6
Consumer behavior vi 6 August 2011
List of Figures
Figure 1 Age group sample size ................................................................................................21
Figure 2 Age group 15 - 20, frequency of purchase ..................................................................23
Figure 3 Age group 21 - 25, frequency of purchase ..................................................................23
Figure 4 Age group 15 – 20, reason for not buying apparel .......................................................24
Figure 5 Age group 21 - 25, reason for not buying apparels ......................................................25
Figure 6 Age group 15 - 20, brand type .....................................................................................26
Figure 7 Age group 21 - 25, brand type .....................................................................................26
Figure 8 Age group 15 - 20, information source ........................................................................27
Figure 9 Age group 21 - 25, information source ........................................................................28
Figure 10 Age group 15 - 20, brand features .............................................................................29
Figure 11 Age group 21 - 25, brand features .............................................................................29
Figure 14 Age goup 15 - 20, ethical fashion term ......................................................................31
Figure 15 Age goup21 - 25, ethical fashion term .......................................................................31
Figure 12 Age group 15 - 20, ethical fashion vs. price ...............................................................32
Figure 13 Age group 21 - 25, ethical fashion vs. price ...............................................................33
Figure 16 Age group 15 - 20, buying decision for ethical fashion ..............................................34
Figure 17 Age group 21 - 25, buying decision for ethical fashion ..............................................34
Figure 18 Age group 15 - 20, dressing style and trend ..............................................................35
Figure 19 Age group 21 - 25, dressing style and trend ..............................................................35
Figure 20 Age group 15 - 20, ethical fashion as an option .........................................................36
Figure 21 Age group21 - 25, ethical fashion as an option ..........................................................37
Figure 22 Age group 15 - 20, clothing type………….………………………………………….……38
Figure 23 Age group 21 - 25, clothing type………………… .......................................................38
Figure 24 Age group 15 – 20, buying behavior on clothing attributes ........................................39
Figure 25 Age group 21 – 25, buying behavior on clothing attributes ........................................39
Figure 26 Age group 15 - 20, trend ...........................................................................................41
Figure 27 Age group 21 - 25, trend ...........................................................................................41
Figure 28 Age group 15 - 20 monthly spending .........................................................................42
Figure 29 Age group 21 - 25, monthly spending ........................................................................42
Figure 30 Age group - 15 - 20, fashion/style ..............................................................................43
Figure 31 Age group - 21 - 25, fashion/style ..............................................................................43
Figure 32 Age group 15 - 20, rank of product features ..............................................................44
Figure 33 Age group21 - 25, rank of product features ...............................................................45
Figure 34 Age group 15 - 20, sensory feeling ............................................................................46
Page 7
Consumer behavior vii 6 August 2011
Figure 35 Age group 21 - 25, sensory feeling ............................................................................46
Figure 36 Age group 15 - 20, sensory feeling on brands ...........................................................47
Figure 37 Age group20 – 25, sensory feeling on brands ...........................................................47
Page 8
Consumer behavior viii 6 August 2011
ACKNOWLEDGMENTS
I am deeply obliged to our Programme Co-ordinator Prof. Håkan Torstensson, for his continual
support and encouragement throughout the course. With deep sense of gratitude and pleasure,
I express my heartfelt thanks to him.
I take this opportunity to express my sincere gratitude to Mr. David Goldsmith, Ph.D candidate,
Masters Students‘ Advisor, Swedish School of Textiles, University of Boras, who has been
instrumental in the successful completion of this project.
I sincerely thank our beloved Principal Dr. R. Rudramoorthy, Principal, PSG College of
Technology, Coimbatore, India for giving me permission to undergo my project and to conduct
the survey.
I sincerely thank Dr. G. Thilagavathi, Head of the department – Textile & Fashion Technology,
PSG College of Technology I can‘t say thank you enough for her tremendous support and help.
I sincerely thank Dr. S. Neelakrishnan, Head of the department – Automobile Engineering,
PSG College of Technology, Coimbatore, I am grateful for his constant support and help.
I express my special thanks to Mr. R. Surjit, Assistant Professor – Fashion technology, PSG
College of Technology, Coimbatore, for his valuable guidance and support.
I deeply express my thanks to Students – PSG College of Technology, Coimbatore for their
valuable time for participating in my survey.
I express my special thanks to my parents & friends, for their valuable co-operation and for
supporting me.
I thank Prof. Heikki Mattila, Tampere University, Finland for his review and suggestions.
My special thanks to all the faculty and supporting staff of the Department of Fashion
Technology, PSG College of Technology, Coimbatore, for their co-operation and assistance in
successful completion of this project work.
I am very much indebted to all those who contributed directly or indirectly to make this project a
success without whom this dissertation work would not have been fructified.
Page 9
Consumer behavior 1 6 August 2011
Executive Summary
The Indian economy has grown over the last 10 years with new jobs created in the ITES sector,
Biomedical, Automotive engineering, Apparel manufacturing and Civil engineering. The growth
is strongly led by Information Technology Enabled Services (ITES); this is supported by the
education sector with increase in the number of students enrolling for higher education and
large numbers of students graduating every year thus creating a large pool of technical and
managerial manpower. The working class people segment has grown since the economic
growth and it has benefited middle class and upper middle class people. Due to the increase in
the number of working people and substantial raise in income, spending power has increased
over the years, and particularly the young Indians in the age of 15 – 25 like to shop more.
The Government of India has laid down strict rules to protect the environment and avoiding child
labor but there is no legality followed by companies in providing an ethical environment in
means of working time and salary.
The increase in food, energy and real estate costs makes people‘s lives more difficult at this
time. Are we going to follow the western countries and repeat the same mistake leading to a
standstill? As resources are getting to near exhaustion, now is the time to think and ask
ourselves question of what we are doing and justify ensuring that we buy only for our needs.
This study focuses on the consumer behavior of young Indians in the age of 15 – 25 to
understand and know their perception towards spending and to show a new path for the society
and the industry for a sustainable environment.
Page 10
Consumer behavior 2 6 August 2011
Chapter I
1.0 Indian Retail Market
Globally, the Indian retail market is the fifth largest in the world. Further proof of its growth has
been indicated by various indicators of development. For example, AT Kearney's seventh
annual Global Retail Development Index (GRDI) has ranked Indian market as the second most
attractive emerging market for investment after Vietnam in the retail sector in 2008. The share of
retail trade in the country's gross domestic product (GDP) was a highly healthy 8–10 percent in
2007. Going by market estimates, it is currently around 12 percent.(Retail)
The future expansion of the Indian market is elucidated in a McKinsey report named 'The rise of
Indian Consumer Market' which estimates that the Indian consumer market is likely to grow four
times by 2025. Sectors like Banks, capital goods, engineering, fast moving consumer goods
(FMCG), software services, oil marketing, power, two-wheelers and telecom companies were
leading the sales and profit growth of India Inc in the fourth quarter of 2008-09.(Global)
India continues to be among the most attractive countries for global retailers. Some numbers
will stand as credible proof to the aforementioned statement. Commercial real estate services
company, CB Richard Ellis' findings state that India's retail market is currently valued at US$
511 billion. India's overall retail sector is expected to rise to US$ 833 billion by 2013 and to US$
1.3 trillion by 2018, at a compound annual growth rate (CAGR) of 10 percent.(Retail)
At US$ 511 billion in 2008, India‘s retail market is growing faster and larger than ever and
drawing both global and local retailers. According to the Department of Industrial Policy and
Promotion (DIPP), foreign direct investment (Foreign Direct Investment (FDI)) inflows as on
January 2009, in single-brand retail trading, stood at approx. US$ 25.18 million. (Retail)
As a democratic country with high growth rates, the consumer spending has risen sharply as the
youth population (33 percent of India‘s population is below the age of 15) has seen a significant
increase in its disposable income. Consumer spending rose an impressive 75 percent in the
past four years alone. Also, the organised retail, which accounts for almost 5 percent of the
market, it is expected to grow at a CAGR of 40 percent from US$ 20 billion in 2007 to US$ 107
billion by 2013. (Retail)
Page 11
Consumer behavior 3 6 August 2011
India‘s retailing business is largely unorganised. It does not have the vision of supply chain
management perspective. According to a survey done recently, an overwhelming proportion of
the US$ 870 billion worth retail markets are unorganised. In fact, only a US$ 435 million worth
segment of the market is organised. As much as 96 percent of the 5 million-plus outlets are
smaller than 500 square feet in area. This means that India per capita retailing space is about 2
square feet (compared to 16 square feet in the United States). Just over 8 percent of India's
population is engaged in retailing (compared to 20 percent in the United States). India's per
capita retailing space is, thus the lowest in the world. (Ganguly)
1.1 Organised Retailing
The organized retailing (Interconnected branded retail shop) in India has an annual growth rate
of 8.5 percent. During 2003-04, it swept past Rs.200 billion marks (US$4.5 billion).This is a
comparatively small figure when considering the extent of the total market. Organized retail, at
present comprises merely 2 percent of the total market in India. This means that the untapped
segment amounts to a whopping Rs.9, 800 billion (approximatelyUS$225 billion). The share of
modern retail is likely to grow from its current 2 percent to 15-20 percent over the next decade.
The above facts clearly shows that in India, though retailing is a developing industry, it is going
to be a very big industry in India and retailing is going to contribute a lot to India's development
.(Retail)
It is predicted that the real GDP is expected to grow at 8 to 10 percent every year in the next
five years. It is also estimated that the consuming class with annual household income of Rs
90,000 and above is expected to rise from 370 million in 2006-2007 to 620 million in 2011-2012.
As a result, the retail business in India is estimated to grow at 13 percent annually from USD
322 billion in 2006-2007 to USD 590 billion in 2011-2012, as reported by the Indian Council for
Research on International Economic Relations (ICRIER).
1.2 Indian Scenario on Apparel Retailing
The apparel market has seen considerable churning with respect to dressing pattern, style,
usage of branded items, and choice of fibres and awareness of latest trends. The Indian textile
industry is a sector which has generated employment in large scale and it stands next only to
agriculture by providing employment to about 15 million people across rural as well as urban
areas. (Retail)
Page 12
Consumer behavior 4 6 August 2011
India has emerged the third most attractive market destination for apparel retailers, according to
a new study by global management consulting firm AT Kearney. It further says that in India,
apparel is the second largest retail category, representing 10 percent of the US$ 37 billion
global retail market. It is expected to grow 12-15 percent per year. Apparel, along with food and
grocery, will lead the organised retailing in India. (Retail)
1.3 Apparel Fashion
The apparel fashion plays a paramount role in shaping apparel consumerism. As lifestyles
change, fashion in India is becoming more diversified, as in the Western countries. Technology,
ideas and lifestyles are moving concurrently and quickly. Companies and brands that offered
monotonous and mundane products for years, have now multiplied their product ranges and
new appealing styles, shapes and forms are being launched each season by them.
1.4 Malls in India—A Look into the Future
A report by Images Retail estimated the number of operational malls to grow more than two-fold
to cross 412 by 2010 which has happened. It also has predicted a further 715 malls to be added
by 2015, with major retail developments even in tier-II and tier-III cities in India.
Marks & Spencer Reliance India is planning to open 35 more stores over the next five years,
according to Mark Ashman, CEO of the company. The 51:49 joint ventures between UK‘s
Marks and Spencer and Reliance Retail Ltd already have 15 stores in India.
Future Group plans to bring in up to US$ 148.7 million in foreign investment. Although Foreign
Direct Investment (FDI) is permitted only in single-brand retail and not permitted in multi-brand
retail businesses like Future Group's. The conglomerate has created two layers of operations
to take advantage of incentives given by the government which allow Foreign Direct
Investment (FDI) up to 49 percent in operating-cum-investment companies as long as they are
owned and controlled by Indians.
Jewellery manufacturer and retailer, Gitanjali Group and MMTC are jointly setting up a chain
of exclusive retail outlets called Shuddi–SampurnaVishwas. The joint venture, which plans to
open around 60 stores across India by end of this year, will retail hallmarked gold and
diamond jewellery.(IMaCS VIRTUS)
Page 13
Consumer behavior 5 6 August 2011
In the modernized and well cultured world, some retailers would have a storefront where people
could browse and new pieces being sewn or customized in the back rooms. Among the few
players who have been catering to the branded market are Park Avenue, Charagh Din, Liberty,
Double Bull, Proline and Snowhite. It took a quite long time for brands such as Allen Solly and
Van Heusen to create a respectable market share in the ready-to-wear market. Big players like
Tata, Raheja and Biyani have intensified the competition with their professional retail chains like
Westside, Shopper‘s Stop and Pantaloons.
1.5 Fashion Trends in India
Recently, India is increasingly being looked upon as a major supplier of high quality fashion
apparels and Indian apparels have come to be appreciated in major markets internationally.
Although the apparel industry seems to be in the maturity stage and growth is slow, fashion
trend cycles are accelerating – it is generally observed that nowadays the average successful
clothing trend lasts only six to twelve weeks. The presence of more and more brands has
created a competitive environment unheard of in the past.
The apparel products are identified by myriad physical characteristics which are perceived
differently by various consumers. When considering a product purchase, consumers tend to
compare and contrast alternative products made up of different attributes. The preference for
items of apparel may depend on the joint influence of price and product attributes such as
quality, style and brand. Branded apparels have not started to appeal the rural India to a large
extent. In 2004, ITC‘s Chaupal Sagar became the first hypermarket to hit rural Madhya Pradesh.
ITC has come up with a special low-cost apparel range called Springfield which has debuted at
this Mall.
1.6 Apparel Market-Value Growth
Considering value growth into our study, the apparel market has decreased from a robust 15.9
percent in 2007 over 2006 to 9.3 percent in 2008. The steepest fall was seen in the women‘s
wear and unisex apparel segments, where growth fell from 16 percent in 2007 to 8.3 percent
and 7.1 percent in 2008. The Images Year book analysis interestingly stated that the industry is
likely to experience the most stable and decent growth in these two sectors in 2009 which
happened almost as predicted.
Page 14
Consumer behavior 6 6 August 2011
Among the different segments, the men‘s wear segment enjoys 38.8 percent market share and
is expected to grow between 6.2 percent and 7.8 percent in depending upon the economic
scenario at that point of time. The women‘s wear segment with 34.9 percent market share is
likely to grow in the range of 8.4 percent to 8.5 percent and will continue to be dominated by
ethnic wear. The unisex apparel segment comprising jeans wear, active sportswear, casual
jacket and blazers, is also expected to grow between 9.4 percent and 10.2 percent in the
current year. One promising segment is that of wedding wear, which the report estimates at
around Rs 38.4 billion, and likely to grow at an annual rate of 13.5 percent over the next four
years.(India retailing)
The table below clearly gives an overview of per capita purchase of garments and home textiles
across India.
Year Urban Rural
Quantity
(sq.meters)
Growth
(%)
Value
(Rs)
Quantity
(sq.meters)
Growth
(%)
Value
(Rs)
2002 24.86 - 2007.71 - - 820.11
2003 25.20 1.36 2042.02 16.74 5.13 891.47
2004 25.56 1.42 2113.80 17.60 2.03 899.78
2005 26.36 3.12 2246.16 18.06 3.32 942.52
2006 27.23 3.30 2380.38 18.64 3.37 1010.17
Average 25.84 2.30 2158.01 17.76 3.46 912.81
(Source: National Household Survey 2002-2006, Textile Committee)
Table 1 Per capita purchase of all textiles at all India level
From the table, it is clearly inferred that the per capita purchases in term of quantity and value
have increased from 2002 to 2006 with an average growth rate of 2.30 percent per annum in the
case of urban areas while it was 3.46 percent in rural areas.
1.7 RNCOS’ Market Research Report
From the new market research report by RNCOS titled, "Booming Retail Sector in India", the
following conclusions can be derived:
Page 15
Consumer behavior 7 6 August 2011
Number of shopping malls is expected to increase at a CAGR of more than 18.9 percent from
2007 to 2015.
Organised retail market in India is expected to reach US$ 50 billion by the end of 2011.
The rural market is projected to dominate the retail industry landscape in India by 2012 with
total market share of above 50 percent.
The third party logistic market (driven by the expanding retail market) is forecasted to reach
US$ 20 billion by the end of 2011.(Retail)
1.8 The Long Road Ahead
According to the experts from industry, the next phase of growth is expected to be contributed
by rural markets. Rural India will account for almost half of the domestic retail market, valued
over US$ 300 billion. It is set to witness an economic boom, with per capita income having
grown by 50 percent over the last 10 years, on account of rising commodity prices and improved
productivity.
According to retail and consumer products division of E&Y India, basic infrastructure, generation
of employment guarantee schemes by the government, better information services, improved
connectivity and access to funding are also bringing prosperity to rural households. According to
Ramesh Srinivas, national industry director (consumer markets), KPMG India, the rural market,
product design will need to go beyond ideas like smaller sizes (such as single use small
packets) to create genuinely new products.(Rural Retail in India)
Page 16
Consumer behavior 8 6 August 2011
Chapter II
2.0 Problem Focus
While the fastest growth and development of retailing environment, understanding the psyche of
customer is critical for today‘s business and environment. Aggregate or macro level information
may mislead, so understanding at individual customer level is desirable. It is generally observed
that customers have a wide range of choices for purchasing apparels and they have no clear
vision to what they buy. Today‘s consumption in young Indian consumer has no limits - they
work hard and spend money for more non-essential products and it is been a driving factor and
evolution in the Indian Apparel Retail sector.
2.1 Objectives of the Study
Fashion changes rapidly from time to time. The consumer demand varies from demographic,
geographic and social cues. The aim is to understand consumer behavior of Indian consumer‘s
in the age of 15 – 25. It is divided into two sub groups, 15 – 20 College going consumers and
the second one is 21 – 25 young and employed consumers. This study brings the difference
between the two groups of consumers and to understand their preference. The study also aims
to determine the awareness of social responsibility and green fashion among Indian consumers.
The aims of this study are:
To understand some of the driving factors of consumerism in India.
To understand the buying decision by individual in the groups (a. 15 -20 b. 21 – 25).
To study the attributes or sensory feelings of consumers towards Indian and western apparel.
To know whether and how some demographic variable of the respondents have influence in
buying brand or non-branded apparel products.
To know the role of family members, friends and peers in information search about the
apparels.
To understand the lifestyle and consumption pattern of Indian consumers and what the future
might look like.
2.2 Limitations of the Study
The present study was confined to study the behavior and awareness towards ethical fashion
among young Indian generation; hence extrapolation of the results may not be possible since
there is a wide difference in customer preference, behaviour, and the factors like
socioeconomic, demographic and psychographic across regions. The study is limited to
Page 17
Consumer behavior 9 6 August 2011
Tamilnadu State only; it is suggested to carry out research in a larger scale to find out results
across regions. The study was completely consumer oriented and data collection was done by
personal interview method. However, serious attempts have been made to minimize the error at
every facet of the study right from defining the problem and incorporation of exact words in the
interview schedule to final expression in questioning the consumers. The study is limited to the
people who have completed high school education and respondents in middles class and upper
middle class group.
2.3 Research Methodology
A study can be initiated with a proper design and methodology to bring out the suitable findings
which are reliable and applicable to solve the problems and useful to carry out further research
of interest. It needs a careful analysis of the consumer through which the results for the present
study can be crystallized for framing suitable solutions. In this chapter, a brief description of the
research methodology adopted in selection of the area, sampling of customers, method of data
collection and the tools used for data analysis are presented.
2.3.1Selection of the Study Area
This study was conducted in 10 cities across Tamilnadu. Tamilnadu is one of the biggest states
having a wide range of industries from Automobile, Electronics, Information Technology parks,
Textile parks and Engineering product manufacturers. Literacy rate in the state has grown up
and it houses largest number of educational institutions in India.
2.3.2 Sampling Design
The sample population was the consumers, in the age of 15 – 25. The sampling was adopted to
cover a sample size of 200 in each segment (100 male and 100 female). The survey was done
through social networking sites/online link to consumers working in different companies to have
stability of response. The sample was heterogeneous to some extent as it includes male,
female, and people from different distances, educational status, and occupation and income
group of regular and occasional buyers.
2.3.3 Type of Data Collected
The type of data is Primary data which is collected through the questionnaire.
Page 18
Consumer behavior 10 6 August 2011
2.3.4 Method of Data Collection
Well-structured questionnaire was framed and used for collection of data (Appendix). The
consumers were contacted through e-mail and in person. They were given a brief introduction
about the purpose and importance of the study. Enough time was given to them to think over
the answers for the questions to have reliability of response. Details regarding demographic,
economic, social, physiographic and behavioral characteristics of the consumer, consumer‘s
awareness, buying behavior and preferences for buying apparels were taken as part of the
survey.
Page 19
Consumer behavior 11 6 August 2011
CHAPTER III
3.0 Review of Literature
In this chapter, the concepts relevant to the present study are compiled and presented in a
logical order. To support and enrich the theoretical orientation of the present study, an attempt
was made to review similar and relevant past studies and literature available in books, scholarly
journals, magazines, newspapers and other resources. The concepts are related to:
3.1. Retailing
3.2. Retailer
3.3. Promotion
3.4. Sales promotion
3.5. Consumer
3.6. Buying behavior
3.7. Awareness
3.8. Consumer service
3.9. Consumer preference
3.10. Consumer satisfaction
3.1 Retailing
Berman defined retailing as business activities encompassing the sale of goods and services to
the end consumer for personal, family or household usage. (Barry Berman)
Retailing involves the sale of goods/merchandise for personal or household use, may be from a
fixed location such as a division store or kiosk, or away from a fixed location and related sub-
linked services. (Retailing definition)
Retailing is performing business activity which involves in selling goods or services to the final
consumer. (Dale M. Lewison)
Retailing comprises of crucial action and steps required to deliver the final product or services to
the consumer. (Patrick M. Dunne)
It is defined as an established business activity, which adds value to the products and services
sold to the consumer for their private or domestic use. (Michael Levy)
India has family run retail stores, they are small and it did not have interconnected branded
shops until late 1990s in rural and some urban areas sales people would carry all the textile
products in a bicycle and sell it to people at their homes. After 1990s, India witnessed growth in
branded retail shops, which opened up their retail outlet in cities and people started to visit the
Page 20
Consumer behavior 12 6 August 2011
stores to buy clothing and fashion. The branded retail shops are opening up in both cities and
villages creating brand awareness among consumer with their changing lifestyle.
Today Indian retailing sector is worth $353 billion in 2010 and the growth rate is projected at
11.4% by BMI India, a leading retail consultant. The industry is on the road of development by
creating thousands of jobs across the country. The retailing like other sectors is creating a huge
consumer experience which is on parity to International standards. There is a huge opportunity
for multi-brand retailing in India, once it happens the retailing sector will generate additionally
1.2 million jobs across the value chain. (Nimish Tanna)
3.2 Retailer
Some of the interpretations of who a retailer is, are given below -
Swapna defined retailer as a ―dealer or trader who sells goods in small quantities or one who
repeats or relates‖(Pradhan)
Retailer is one who makes first-hand business with the customer. (Vedamani)
One who links the manufacturer and the final consumer is known as retailer. It may be a person,
agent, agency, company or organization which is involved in supplying the goods or services to
the end consumer. Retailer is responsible to arrange the required assortment of products by
understanding the consumer preference with the available market information. (Chetan Bajaj)
Kotler defined, retailer is who involves in selling of goods or service directly to the end consumer
for their domestic and non-business use. (Kotler)
Any business firm that aims in directing its marketing efforts in the direction of final consumer for
the purpose of selling goods or services are called as retailers. (Dale M. Lewison)
Retailers are the final business in the distribution channel which links the manufacturer to
consumer. The distribution channel is a group of firms that assist the movement of products
from the place of production to the point of sale and to the final consumer. They aim to meet the
consumer demand and satisfy it by having the right merchandise, at the right price, at the right
place, when the consumer needs it. (Michael Levy)
In commerce, a retailer buys goods or products in large quantities from manufacturers or
importers, either directly or through a wholesaler, and then sells individual items or small
quantities to the general public or end user customers, usually in a shop, also called store.
Retailers are at the end of the supply chain. (knowledgerush)
The organized retailing is gaining momentum in India with the presence of large International
Page 21
Consumer behavior 13 6 August 2011
players. Unorganized (Small shop run by individual or family own business without any
interconnectivity) retailing had a large presence in Indian market for a long time in both rural and
urban areas. The Government of India has allowed a 51% Foreign Direct Investment in the
single brand retailing sector. The Companies like Wal-Mart, Tesco and Carrefour are asked to
invest in the back end operation of retail in India. The retail industries provide employment to
over 33 million people.(KPMG).
3.2.1 Top retailers in India
3.2.1.1 Pantaloon retail
Founded by Future group, it has over 1000 stores across 73 cities and has 30, 000 employees
across India and with a turnover of US $ 278 million. They operate in different retail segments
such as Food & grocery (Big bazaar, Food bazaar), Home solutions (Hometown, furniture
bazaar, collection-i), consumer electronics (e-zone), shoes (shoe factory), Books : music & gifts
(Depot), Health & Beauty care services (Star, Sitara and Health village – to be launched), e-
tailing (Futurbazzar.com), entertainment (Bowling co.)
3.2.1.2 K Raheja group
The company started its retail operation with Shopper‘s stop, which was India‘s first
departmental store in 2001 with a turnover of US $ 350 million. They have 39 stores in 17 cities
and also signed with Nuance group for airport retailing. The group has launched it new retail
format in the areas like home furnishing, décor and furniture‘s (Homestop), Foods, Homeware,
Home entertainment, Hi-tech appliances, sports, toys & Fashion(HyperCity).
3.2.1.3 Tata group
Introduced India‘s first organised food & grocery retail with Foodworld stores in the year 1996.
Fashion & Home furnishing under the Brand Westside is present across the leading cities.
3.2.1.4 RPG group
RPG started by collaborating with Tata to start Foodworld stores across the country in 1996,
after the disassociation with Tata group now it has Spencer‘s Hyper, Super, Daily and Express
formats and Music World stores across the country.
3.2.1.5 Landmark group
Launched in 1998 in India, it is a 3.8 billion dollar company with 100 stores across various retail
formats.
3.2.1.6 Bharathi-Wal-Mart
Page 22
Consumer behavior 14 6 August 2011
50:50 joint ventures by Bharathi and Wal-Mart, with Wal-Mart taking care of the back end
operation and Bharathi will look after the front end operations of the retail. Both have agreed to
invest $ 7 billion to create one of the largest retail networks in the country by opening 100
hypermarkets and a number of small stores.
3.2.1.7 Reliance
The company is new to retail environment and it has 560 retail fresh stores with a turnover of
US $ 100 million. The company has launched hypermarkets in big cities.
3.2.1.8 A V Birla groups
A leading fashion retailer with brands like Louis Phillipe, Van Heusen, and AllenSolly, Peter
England, Trouser town and Madura garment is a subsidiary of Aditya Birla Nuvo Ltd. The total
turnover of retail operations of the group is about US $ 378 million. The group has recently
brought Trinethra a food & grocery chain stores, it has 400 stores in the country. The group has
its own supermarkets and hypermarkets (‗More‘) with 600 supermarkets and 9 hypermarkets
across India.
3.2.1.9 Metro
The first company to bring in cash and carry business operation in India started in 2003 with
only two distribution centres in Bangalore, Karnataka State. It has more than 18000 product
assortments in food and non-food categories at the best wholesale prices. They operate six
cash & carry centres in Bangalore, Hyderabad, Kolkata and Mumbai.
3.2.1.10 Viveks Ltd
The largest consumer electronic and home appliance retail chain in India, they have 44 stores in
Southern India with a total turnover of US $ 40 million. (Pandey)
International retailers are looking for business in India; the only obstacle for them is to find the
right Indian partner. And many International brands such as Hugo Boss, Calvin Klein and DKNY
Jeans which has Indian partners are looking for new and additional partners. The main reason
of failures is the Indian retail partner promises large expansion plan and good returns to the
international brand in the beginning, and later the commitment is not met over the years. And
the Indian retailers have to invest on the logistics and distribution also with no support from
International retailers. (CNBC)
3.3 Promotion
It is an important component of an organization‘s marketing mix which is used to communicate
about the product to the market or an organization which aims in selling the product in
Page 23
Consumer behavior 15 6 August 2011
anticipation that the consumer will buy them for their need or demand. (Michael J. Etzel)
It is a way of communicating the information about the product from the seller to a potential
buyer or others in the channel to influence in the buying of a product. Promotion aims to identify
the potential consumer, and to inform them the right product is available at the right place and at
a right price.(William D. Peneault)
Promotion is all about giving information about a product, product line, brand or company to the
consumer using a proper communication method. It is a key aspect of marketing mix. For
example RMKV Silks, a retail outlet promotes traditional silk using handloom weaving
techniques for their bridal collection which makes the saree rich in appearance and attracts
people. A television advertisement about the product and its manufacturing process creates
awareness among the consumer; the store also displays an information board in the window
display along the saree. The main purpose being to communicate its new bridal collection
among the women‘s, and the brand was successful in it. (RMKV Silks) Pothy‘s store uses
leading film actress for television advertisement to attract female consumers.
3.4 Sales Promotion
Some of the interpretations of what sales promotion is, are given below -
Kotler defined sales promotion as a ―short-term incentive to encourage purchase or sale of a
product or services‖. (Kotler)
Sales promotion is used by manufacturers to assist the movement of products to wholesalers
and retailers are called internal sales promotion, and movement of products from the retailer to
the ultimate consumer are called as external sales promotion. (Singh)
It refers to communication strategies which are designed to attract, an added value, or incentive
for the product to customers. Sales promotion assists with other promotional activities carried
out by the store. (Chetan Bajaj)
The media Industry in India is growing at a very faster rate in the recent years with
advancement in technologies, providing a wide range of choice in terms of region, religion and
language to the audience. The increasing literate population, growth in the economy has
assisted to an increase in the consumer using different mass media form like newspaper, radio
and television. New media such as Internet and mobile phones had made a significant impact
for sales promotion since 2000. India is a secular country; there are many people with different
religions. The retailers give special discount on different festival occasions and attract consumer
accordingly. The Indian consumers are regarded more value-conscious compared to western
Page 24
Consumer behavior 16 6 August 2011
consumer. Whenever the Indian consumer gets an opportunity to interact with the brand, he/she
evaluates it a lot more before buying it because they look for value. For some product
categories, consumers are looking for more information, they ask about the feature/attributes
about the product. They look for an experience, than the product itself. And most of the retailers
in mall complain that they have so many footfalls, but people are not buying it. It is very
important for the retailers to understand and communicate effectively to the consumer to make
him buy and sales promotion will assist it.
3.5 Consumer
Some of the interpretations of who a consumer is, are given below -
Bhatt (1985) defined consumer as an individual who consumes goods, whether produced by
business unit or created by nature resources such as air, water, food and utilities offered by the
government and business organizations like hospitals, religious, educational and other voluntary
organization, etc.
Consumers are represented by people in families and other kinds of household who buy and
use products and service to meet their need and wants. (Cravens)
Consumers are individuals and households who buy goods and services for personal
consumption. (Kotler)
The Indian consumers are classified into five categories based on their income level by a
McKinsey report taken from Indiantake blogspot. It includes low level consumers (up to US $160
per month), lower middle level (US $ 165 – US $ 370per month), middle level (US $ 370 – US $
910per month), upper middle level US $ 910 –US $ 1850 per month) and high level (aboveUS $
1850 per month). India will continue to be young not like Europe and Japan, and there will be
increase in smaller size household as families are not having any joint family (extended family
composed of parents, their children, and the children's spouses) system which is traditional until
late 1980‘s. It is generally observed that Indian consumers are becoming social consciousness,
and they use traditional media like internet and mobile to know about the brands. The
consumers are multi-taskers; they use two or three media at a time comfortably. (Indiantake
blogspot)
India has large share of young population starting from the age of 15 – 25 who tend to shop
more in recent days. The increase in salary class people has also created a new platform of
consumers. More and more people move into cities in search of better education, lifestyle and
jobs. It is generally observed that Indian consumers are lacking information on brand and
Page 25
Consumer behavior 17 6 August 2011
quality. They regarded price as the foremost reason to buy fashion products, however today,
consumers have become very conscious about quality and brand which shows the inclination of
Indian consumers towards branded products.
3.6 Consumer Behaviour
Some of the interpretations of what is a consumer behavior, are given below -
It is a field of study concentrating on consumer activities. (Rogers D. Blackwell)
Consumer behavior is defined as a study of responses by individual towards a product or
service. (Kardes)
Consumer behavior is to understand how a consumer makes decision to buy a goods by using
the available resources such as time, money, and effort for buying, using, and disposing goods
and services. (Chetan Bajaj)
It is a decision making process of an individual physically by engaging in assessing, buying and
using or disposing the goods and services. (David L. Loudon)
It is defined as a combination of emotional, mental and physical activity of an individual for
purchase and use of goods and services for a demand or need. (Shukazmi)
Consumer behavior is associated with the culture and economy of a country. Economic growths
in India and young Indian population over 21 years have influenced the consumers to spend
and buy more. Consumers are influenced by their friends and socio cultural environment. More
spending options are growing among Indian consumers which induce higher spending on
gaining status. Indian consumers were more careful in lending and now this attitude is changing
with more credit options in the form of Credit cards and loans. The behavior has western
influence among the Indian consumers; foreign brands have penetrated the market and acquire
a good share.
In recent years, there is a large shift in consumer behavior among Indians due to enhanced
awareness and information technology. Lifestyle among rural consumers has changed
dramatically with influence of socio-economic conditions, cultural environment, education level,
occupation and wide media coverage. There is an increase in working women after 1990‘s, they
are proving to be equally good as men, and make their own decision to buy things which they
need. Yet Indian consumers think before they buy, they are more cautious in spending. Retail
was successful in west during late 90s to 2007; people spend more as they had credit cards and
finance options available for them. Western people spend more than what they use to earn and
with less money to save, Indians on the other hand are always cautious of what they buy and
Page 26
Consumer behavior 18 6 August 2011
spend less and save more for their family and spouse. International branded retailers are
successful to some extent in the Indian market of this reason and they could not cash out more
profits as expected. Even though westernized culture has impact on Indian consumers still the
bridge of spending is more cautious and keeps the International brands guessing what is going
to be the future on how the sustainability of business is taking effect on them.
3.7 Awareness
Some of the interpretations of what awareness is, are given below -
Trying to gain attention of a brand and creating its image for a positive consumer response is
defined as brand awareness. (Jay D. Lindquist)
Lack of education affected the level of awareness among people about fashion products, today
due to increase in the literacy rate and advent of mass media; consumers have got good
awareness about each product group and its associated brand. With the increase in connectivity
and information on the foreign brands, younger generation is also spreading the word to other
people by using various social marketing sites. But the luxury market is only seen in big cities
like New Delhi, Mumbai, Bangalore, Chennai, Hyderabad and it attracts only very few in this
large Indian population. Manyconsumers in India are aware of foreign brands, but they are
unable to distinguish the feature or value in the products and they prefer to buy only the famous
brands. And most of the Indian consumers buy luxury goods for its brand value not to make a
fashion statement. Malls are the next source of creating awareness about fashion products,
malls were started in 2002 in big cities but the concept penetrated into smaller cities quickly with
a very fast growth rate. Technology and media has also aided in creating more awareness
about fashion among teens across the country. Social networking sites and mobile phones with
3G have become a boon for the younger generation and some old people to gainawareness
about the brand.
Consumer has gained knowledge about their rights. Government of India has setup consumer
protection under the Department of Consumer Affairs to create more awareness and to address
the problems systematically. People have also started various clubs / forums across the country
apart from the government, they help the consumers by providing legal advice and directing
them to the concerned grievance cell. Consumers can call for any help through a nationwide
help line number and is promoted through mass media at regular intervals.
3.8 Consumer Service
Some of the interpretations of what consumer service is, are given below -
Page 27
Consumer behavior 19 6 August 2011
Levy and Weitz (2002) explained that customer service is a set of activities and programs
undertaken by the retailers to make the shopping experience more rewarding for their
customers. These activities increase the value customers receive from the merchandise and
services they purchase.
Kotler (2005) expressed that a service is any benefit or activity that one party can offer to
another, which is essentially intangible and does not result in ownership of anything. Its
production may or may not be tied up to a physical product.
Most of the retail shops in India are successful because of their service to the
consumer/customer, by various incentives and in store help. Right from the doorstep when a
customer enters a retail outlet, a customer service person is available to the customer and he
asks them their needs politely. After hearing to the customer the service person guides themto
the exact section and requests one of the floor sales representatives to help the customer and
the service person returns back to the doorstep with a smile to receive the next guest. In some
of the shops they offer the customer with cool drinks/ tea according to the temperature outside
and make them feel comfortable. All these attributes makes a consumer to shop at the store
and return again next time to the same outlet.
3.9 Consumer Preference
Some of the interpretations of what a consumer preference is, are given below -
Elling (1984) explained consumer preference as that ―character of a consumer which, when the
product preferred by him was not available with one dealer, made him to walk to other dealer for
the same product‖.
The way consumer is fulfilled or unhappy about a product after his purchase is called as
customers‘ preference. Once the customer likes the product there are more chances of
purchasing it again. (Kotler)
International brands like Diesel, Armani, Gucci etc., have opened up stores in all major cities,
these stores have a wide range of collections which are suitable for the Indian consumers.
Domestic brands have also stepped into the market with different variety of products according
to the region and culture. Brands are expanding their presence from urban market to rural
market to reach the consumers. In the past consumers were not provided with comprehensive
list of products and so there were no special preferences. In today‘s context, there is wide range
of variety and brands for the consumer to choose and hence the preferences of consumer have
a wider importance. It was sellers‘ market during 1990s and now its buyers‘ market.
Page 28
Consumer behavior 20 6 August 2011
3.10 Consumer Satisfaction
Some of the interpretations of what consumer satisfaction is, are given below -
According to Kotler and Armstrong (2003), Customer satisfaction is an index for the product on
how it matches with the expectations of the buyer. If the product performs to the expected level,
the buyer is happy.
According to Berman and Evans (2004), It is a how a product is matching to the expectations of
the customer.
More stores have started to develop customer friendly policies, well trained store assistants,
good store atmosphere and range of loyalty programs to satisfy the consumers. Before leaving
the store a service person at the store enquires the feedback from the consumer about the
shopping experience and they try to improve it. (More than consumer satisfaction, it is consumer
delight that is being thought by the Indian retailers so that the consumer visits their store again
which improves the loyalty of consumer.
Page 29
Consumer behavior 21 6 August 2011
Chapter IV
4.0 Results and Discussion
The data collected from 200 respondents were analyzed in accordance with objectives of the
study. The results are presented and discussed in this chapter. For the effective presentation of
results, different sections were framed as furnished hereunder.
4.1 General data
As stated in the methodology, questionnaire were given to 200 respondents as classified in the
below table
Age group 15 - 20 21 - 25
Male 50 50
Female 50 50 Table 2 Respondents age group wise
Figure 1 Age group sample size
4.2 Income group
There is a steady increase in the income group in the middle class and upper middle class
sector. Creation of jobs in Engineering industry and ITES services have provided employment to
many youngsters and there is a change in the income level and more population have migrated
from middle class to upper middle class and new middle class people.
Page 30
Consumer behavior 22 6 August 2011
Income category Number of respondent
Below 1 lac (US $ 2200) 20 (20%)
1 to 2 lac (US $ 2200 – US $ 4350) 21 (21%)
2 to 4 lac (US $ 4350 – US $ 8890) 24 (24%)
>4 lac (> US $ 8890) 35 (35%) Table 3 Income group in all age group
4.3 Nature of family
In India people are living in traditional homes and mostly they are nuclear or joint family. Nuclear
family consists of father, mother and sons/daughter and they can have any number of children.
In a joint family is an extended family with many generations living under one roof. Most of the
respondents in this survey have a nuclear family with 70 percent and 25 percent live in a joint
family
Family type Number of
respondents
Nuclear 70 (70%)
Joint family 25 (25%)
Alone 5 (5%) Table 4 Family type
4.4 Frequency of purchase by consumers
Interpretation
From the Table 1, it is inferred that consumers in the age of 20 – 25 (34% Male and 50%
Female) purchase monthly and second purchase behavior was once in three months with
28.5% male and 22.5% female choosing it. Likewise consumers in the age of 15 – 20 preferred
to do shopping once in 3 month once i.e., 26% male and 50% female. It shows that majority of
female in both the age group buy frequently.
Age group 15 – 20 20 – 25
Gender Male Female Male Female
Purchase interval
Monthly 10 (20%) 11 (22%) 17 (34%) 25 (50%)
3 months once 13 (26%) 25 (50%) 15 (30%) 11 (22%)
6 months once 12 (24%) 6 (12%) 5 (10%) 5 (10%)
Need based 10 (20%) 4 (8%) 5 (10%) 3 (6%)
Special occasions 5 (10%) 2 (4%) 7 (14%) 5 (10%)
Other - 2 (4%) 1 (2%) 1 (2%)
Table 5 Frequency of purchase
Page 31
Consumer behavior 23 6 August 2011
Figure 2 Age group 15 - 20, Frequency of purchase
Figure 3 Age group 21 - 25, Frequency of purchase
Page 32
Consumer behavior 24 6 August 2011
4.5 Reasons for not buying apparel regularly (once in a month)
Age group 15 - 20 20 – 25
Gender Male Female Male Female
Reasons for not buying apparel
regularly
Distance 8 (16%) 5 (10%) 7 (14%) 13 (26%)
High Price 22 (44%) 17 (34%) 16 (32%) 12 (24%)
Non-availability of range of apparels 15 (30%) 23 (46) 25 (50%) 23 (46%)
Others 5 (10%) 5 (10%) 2 (4%) 2 (4%)
Table 6 Reason for not buying Vs. Age group
Interpretation
It could be seen that Consumer in both the age group do not buy apparels regularly (once in a
month) as they feel that the expected range of apparels are not available. Second factor could be
seen as the price of apparels, which is high.
Therefore, it could be concluded that majority of the consumers look for more product variety
with average price.
Figure 4 Age group 15 – 20, Reason for not buying apparel
Page 33
Consumer behavior 25 6 August 2011
Figure 5 Age group 21 - 25, Reason for not buying apparels
4.6 Type of brand
Buying behaviors towards type of brand by the consumer‘s mainly depend upon their
awareness, perceived quality and brand loyalty about the brand. The behavior towards type of
brand is tabulated in Table 7.
Age group 15 - 20 21 - 25
Gender Male Female Male Female
Brand type
Domestic 30 (60%) 33 (66%) 28 (56%) 35 (70%)
International 20 (40%) 17 (34%) 22 (44%) 15 (30%)
Table 7 Brand type Vs. Age group
Interpretation
On an average, 63 percent of the consumers prefer domestic brand, which was followed by
international brand (37 percent).
Thus, it is well understood that female consumers prefer to buy domestic brand. Domestic brand
understands and manufacture according to the desires of Indian women. It is achieved by
combining the traditional style with modern western style, domestic brand gives a new outlook
to the dress without taking the pride of Indian culture which makes them more competitive
against western dress.
Page 34
Consumer behavior 26 6 August 2011
.
Figure 6 Age group 15 - 20, Brand type
Figure 7 Age group 21 - 25, Brand type
4.7 Source of information about the products
The results regarding information used to know about the product which is influencing the
consumer to buy, for the sample consumers are given in Table 8.
Page 35
Consumer behavior 27 6 August 2011
Age group 15 - 20 20 – 25
Gender Male Female Male Female
Source of information
Friends and neighbors 13 (26%) 17 (34%) 16 (32%) 20 (40%)
Radio & TV ads 12 (24%) 13 (26%) 12 (24%) 9 (18%)
In-store wall poster 6 (12%) 7 (14%) 7 (14%) 6 (12%)
Newspaper/advertisement 13 (26%) 6 (12%) 9 (18%) 8 (16%)
SMS promotions 4 (8%) 5 (10%) 5 (10%) 6 (12%)
Parents 2 (4%) 2 (4%) 1 (2%) 1 (2%)
Peers - - - -
Table 8 Information source
Interpretation
With regard to source of information, majority of the consumers get data from friends and
neighbors and second most information source is mass media which has hit every corner of the
house in India.
Figure 8 Age group 15 - 20, Information source
Page 36
Consumer behavior 28 6 August 2011
Figure 9 Age group 21 - 25, Information source
4.8 Brand features considered for purchasing
The features of the brand supplemented with quality, value for money, range of apparels and
convenience of many items may influence the purchase decisions and directly related with the
expenditure on apparels with a specific brand of consumers choice. The details of this factor are
presented in Table 9.
Age group 15 - 20 20 – 25
Gender Male Female Male Female
Perception towards a brand
Brand Image 8 (16%) 5 (10%) 9 (18%) 6 (12%)
Quality 12 (24%) 20 (40%) 15 (30%) 18 (36%)
Value for money 15 (30%) 15 (30%) 13 (26%) 15 (30%)
Availability of range of
apparels 10 (20%) 8 (16%) 9 (18%) 6 (12%)
Convenience of many items 5 (10%) 2 (4%) 4 (8%) 5 (10%)
Table 9 Perception towards a brand
Page 37
Consumer behavior 29 6 August 2011
Interpretation
It could be inferred that consumers think about the quality first and value for money followed by
wide range of products when they choose a brand. Female consumers look for good quality and
value for money apparels.
Figure 10 Age group 15 - 20, Brand features
Figure 11 Age group 21 - 25, Brand features
4.9 Understanding the term ethical fashion
It is very much necessary to know what consumers thinking about the term ethical fashion for a
sustainable market with a green environment.
Page 38
Consumer behavior 30 6 August 2011
Age group 15 - 20 20 – 25
Gender Male Female Male Female
Ethical fashion terms
Apparel with less
environmental impact 5 (10%) 11 (22%) 9 (18%) 10 (20%)
Production using green energy 18 (36%) 14 (28%) 12 (24%) 11 (22%)
Production using recycled
materials/ materials that can be
recycled
8 (16%) 7 (14%) 10 (20%) 9 (18%)
Made by people working in
good and clean conditions and
with Minimum pay
6 (12%) 5 (10%) 4 (8%) 7 (14%)
Avoids child labour 12 (24%) 10 (20%) 13 (26%) 12 (24%)
Use of traditional techniques
which can be conserved 1 (2%) 3 (6%) 2 (4%) 1 (2%)
Table 10 Understanding of ethical fashion term
Interpretation
From the above table, it is inferred that an average of 27.5 percent of respondents knew about
ethical fashion by the term production using green energy, followed by the term avoiding child
labor with the average percentage of 23.5. Respondents In the age group of 20 – 25 has said
they know products which are manufactured by avoiding child labor are ethical fashion.
Page 39
Consumer behavior 31 6 August 2011
Figure 12 Age goup 15 - 20, Ethical fashion term
Figure 13 Age goup21 - 25, Ethical fashion term
4.10 Price of Ethical fashion
As there are fewer players in the market with ethical and sustainable products, the pricing of the
garments is also a main factor. The details of what Indian consumers think about the Ethical
fashion is listed in the table
Page 40
Consumer behavior 32 6 August 2011
Age group 15 - 20 21 - 25
Gender Male Female Male Female
Price of ethical fashion
Cheap 2 (4%) 3 (6%) 2 (4%) 3 (6%)
Value for money 7 (14%) 7 (14%) 5 (10%) 5 (10%)
Moderate 6 (6%) 2 (4%) 2 (4%) 2 (4%)
Costly 35 (70%) 38 (76%) 41 (82%) 40 (80%)
Table 11 Ethical fashion Vs. Price
Interpretation
From the Table, it is seen that on an average 77 percent of the consumer felt the price of ethical
fashion products are high and an average of 12 percent of the consumer think it is a value for
money product. It is inferred that prices are one of the major factor which influence purchase
behavior towards ethical fashion.
Figure 14 Age group 15 - 20, Ethical fashion Vs. Price
Page 41
Consumer behavior 33 6 August 2011
Figure 15 Age group 21 - 25, Ethical fashion Vs. Price
4.11 Purchase of ethical products
The results of how many respondents have brought ethical fashion are given in Table 9.
Age group 15 - 20 21 - 25
Gender Male Female Male Female
Yes 15 (30%) 18 (36%) 12 (24%) 25 (50%)
No 35 (70%) 32 (64%) 38 (76%) 25 (50%)
Table 12 Buying decision for Ethical fashion products
Interpretation
It is inferred that on an average 65 percent of the respondent have not purchased ethical
products.
Page 42
Consumer behavior 34 6 August 2011
Figure 16Age group 15 - 20, Buying decision for ethical fashion
Figure 17 Age group 21 - 25, Buying decision for ethical fashion
4.12 Dressing style vs. latest trend
Consumers prefer the taste of latest trend and the current generation is very much excited about
it.
Page 43
Consumer behavior 35 6 August 2011
Age group 15 - 20 21 - 25
Gender Male Female Male Female
Yes 36 (72%) 40 (80%) 45 (90%) 43 (86%)
No 14 (28%) 10 (20%) 5 (10%) 7 (14%)
Table 13 Dressing style and trend
Interpretation
From the Table, it is seen that irrespective of age groups respondents want to upgrade
themselves to the latest trend from time to time.
Figure 18 Age group 15 - 20, Dressing style and trend
Figure 19 Age group 21 - 25, Dressing style and trend
Page 44
Consumer behavior 36 6 August 2011
4.13 Ethical fashion as an option during purchase
Consumers go for shopping at regular intervals, and to know whether they really think about
ethical products as an option when they buy a new one.
Age group 15 - 20 21 - 25
Gender Male Female Male Female
Strongly Disagree 5 (10%) 6 (12%) 4 (8%) 4 (8%)
Disagree 5 (10%) 4 (8%) 4 (8%) 5 (10%)
Neither
Agree/Disagree 28 (56%) 30 (60%) 31 (62%) 25 (50%)
Agree 7 (14%) 5 (10%) 5 (10%) 8 (16%)
Strongly Agree 5 (10%) 5 (10%) 6 (12%) 8 (16%)
Table 14 Ethical fashion as an option
Interpretation
It is inferred from the table that on an average 57 percent of the respondent could not make a
final decision on considering ethical fashion product as an option during their purchase.
Figure 20 Age group 15 - 20, Ethical fashion as an option
Page 45
Consumer behavior 37 6 August 2011
Figure 21 Age group21 - 25, Ethical fashion as an option
4.14 Clothing type
Many international brands have started their operation in India; still domestic brands are selling
more because of its cost and style.
Age group 15 - 20 21 - 25
Gender Male Female Male Female
Type of Clothing
Indian 35 (70%) 30 (60%) 42 (84%) 43 (86%)
International 15 (30%) 20 (40%) 8 (16%) 7 (14%)
Table 15 Clothing type
Interpretation
From the Table, it is seen that both male and female of all age group would like to wear Indian
clothing. In the age group of 15 – 20 there is an average of 35 percent respondents who like to
wear International clothing.
Page 46
Consumer behavior 38 6 August 2011
Figure 22 Age group 15 - 20, Clothing type
Figure 23 Age group 21 - 25, Clothing type
4.15 Buying behavior based on clothing attributes
Factors like the design, aesthetic appearance, price and wearability of the garment will make
choices and decision in the minds of the consumer.
Age group 15 - 20 21 - 25
Gender Male Female Male Female
Attributes for the product
Fashion/Stylish 22 (44%) 19 (38%) 29 (58%) 27 (54%)
Designer 7 (14%) 4 (8%) 7 (14%) 8 (16%)
Modest prices 15 (30%) 9 (18%) 9 (18%) 4 (8%)
Wearability 4 (8%) 16 (32%) 4 (8%) 11 (22%)
Theme 2 (4%) 2 (4%) 1 (2%) -
Table 16 Buying behavior on clothing attributes
Interpretation
Most of the consumers want their garment to be fashion/stylish and with modest price. But on
an average 27 percent of female prefer to have a better wearability characteristic to the
garment.
Page 47
Consumer behavior 39 6 August 2011
Figure 24 Age group 15 – 20, Buying behavior on clothing attributes
Figure 25 Age group 21 – 25, Buying behavior on clothing attributes
Page 48
Consumer behavior 40 6 August 2011
4.16 Trend
Teen and youth around the world have a common approach, behavior, interest and opinion
when they buy apparels among the age group of 15 - 25. But a detailed study would reveal the
varying characteristics which is important to know by what they are influenced to keep upto date
with the clothes they wear.
Age group 15 - 20 21 - 25
Gender Male Female Male Female
Trends 13 (26%) 19 (38%) 29 (58%) 31 (62%)
Friends 18 (36%) 15 (30%) 11 (22%) 8 (16%)
Celebrities 5 (10%) 4 (8%) 5 (10%) 3 (6%)
Age group 12 (24%) 11 (22%) 5 (10%) 7 (14%)
Magazines 2 (4%) 1 (2%) 0 1 (2%)
Table 17 Trend vs. Age group
Interpretation
From the above table respondents in the age group (15 – 20) are influenced by friends on an
average of 33 percent and 32 percent follow the trend. It is also inferred that respondents in the
age group (20 – 25) are attracted towards trends with 60 percent and secondly they change
their style from word of mouth information from friends (19 percent). Some of the respondents of
both the age group are looking into people of same age to keep them update.
Page 49
Consumer behavior 41 6 August 2011
Figure 26 Age group 15 - 20, Trend
Figure 27Age group 21 - 25, Trend
4.17 Spending on apparel
Growing economy has made Indian consumers more prosperous. A detailed report is given
below on the spending by the respondents.
Age group 15 - 20 21 - 25
Gender Male Female Male Female
Spending on apparels
monthly
Rs. < 500 17 (34%) 11 (22%) 0 5 (10%)
Rs. 500 – 1000 10 (20%) 20 (40%) 16 (32%) 13 (26%)
Rs. 1000 – 2500 18 (36%) 10 (20%) 18 (36%) 12 (24%)
Rs. 2500 - 5000 4 (8%) 7 (14%) 11 (22%) 17 (34%)
Above Rs. 5000 1 (2%) 2 (4%) 5 (10%) 3
Table 18 Spending vs. Age group
Interpretation
From the above table we can understand that respondents in the age group of 15 – 20 have
seen a gradual increase on spending towards apparel. The other age group 20 – 25 spends
more as they are working and earning good salary.
Page 50
Consumer behavior 42 6 August 2011
Figure 28 Age group 15 - 20 Monthly spending
Figure 29- Age group 21 - 25, Monthly spending
4.18 Following the fashion/style
From tradition to modern, India has transformed with socio economic changes. Cultural changes
are taking place rapidly in recent years more people go out party with friends and colleagues.
Page 51
Consumer behavior 43 6 August 2011
Age group 15 - 20 21 - 25
Gender Male Female Male Female
Casual 28 (56%) 32 (64%) 25 (50%) 34 (68%)
Party 13 (26%) 11 (22%) 7 (14%) 14 (28%)
Executive 3 (6%) 2 (4%) 14 (28%) 1 (2%)
Street fashion 6 (12%) 5 (10%) 4 (8%) 1 (2%)
Table 19 Gender wise fashion/style
Interpretation
It is inferred from the above table on average 59.5 percent of respondents would like to buy
casual apparels followed by party wear (22.5 percent). Women tend to shop more casual and
party wear, but men in the age group 20 – 25 prefer to buy executive wear (28%).
Figure 30 Age group - 15 - 20, Fashion/style
Figure 31 Age group - 21 - 25, Fashion/style
Page 52
Consumer behavior 44 6 August 2011
4.19 Product features priority
Consumers buy products based on the features like quality, price, style and fit, brand name and
range of apparels.
Age group 15 - 20 21 - 25
Gender Male Female Male Female
Product quality 12 (24%) 14 (28%) 15 (30%) 13 (26%)
Price 13 (26%) 12 (24%) 11 (22%) 12 (24%)
Brand name 7 (14%) 4 (8%) 6 (12%) 4 (8%)
Style and fit 10 (20%) 13 (26%) 9 (18%) 11 (22%)
Product
Variety 8 (16%) 7 (14%) 9 (18%) 10 (20%)
Table 20 Product feature ranking
Interpretation
From the Table, it is seen that on an average 27 percent of the respondents perceived product
quality as their first choice, price along with style and fit is considered next when consumers
choose a product from a brand.
Figure 32Age group 15 - 20, Rank of product features
Page 53
Consumer behavior 45 6 August 2011
Figure 33 Age group21 - 25, Rank of product features
4.20 Sensory feelings
Consumers like to wear comfortable clothing for their day to day life, sensorial factors is an
overall performance of the apparel with associated factors like touch, visual and feel properties.
Age group 15 - 20 21 - 25
Gender Male Female Male Female
Yes 39 (78%) 42 (84%) 34 (68%) 38 (76%)
No 11 (22%) 8 (16%) 16 (32%) 12 (24%)
Table 21Sensory feeling
Interpretation
From the above table it is clearly seen that most of the respondents purchase apparels based
on sensory feelings. Female respondents on average 80 percent like to buy apparels with good
feel, touch and taste.
Page 54
Consumer behavior 46 6 August 2011
Figure 34 Age group 15 - 20, Sensory feeling
Figure 35 Age group 21 - 25, Sensory feeling
4.21 Sensory feeling and brand
Respondents were interviewed about their experience on the level of sensory feelings in
Domestic and International brands.
Age group 15 - 20 21 - 25
Gender Male Female Male Female
Indian 36 (72%) 43 (86%) 28 (56%) 27 (54%)
International 13 (26%) 7 (14%) 22 (44%) 23 (46%)
Table 22 Sensory feeling vs. Brand
Interpretation
From the above table it is inferred that both male and female respondents in the age group of 15
– 20 feels Indian brand has good sensory feelings, they purchase low International brands. But
the other age group about 45% on average feels International brands offer good sensory
Page 55
Consumer behavior 47 6 August 2011
feelings. These consumers buy an equal share of International brand as they are working class
and work in Tier 1 cities where they have good malls and shopping area.
Figure 36 - Age group 15 - 20, Sensory feeling on brands
Figure 37 – Age group20 – 25, Sensory feeling on brands
4.22 Why consumers dislike fashion
Is fashion a trend or a myth to understand it, respondents were asked why they disliked fashion
and what was their view on fashion.
Interpretation
The Female respondents were interviewed and respondents in the age group 15 – 20
expressed fashion has an expensive and dress which is not suitable to wear outside because of
its style in which most of the body parts are exposed. The girls in teen feel fashion has changed
the society and culture. Female in the next age group feels they are expensive and
uncomfortable to wear the clothing. Due to the climatic condition and their working environment
at home and work female respondents feel more fashionable dress are not matching their
desires.
Page 56
Consumer behavior 48 6 August 2011
Male respondents in the both age group (15 – 20, 20 – 25) gave a mixed response as they feel
t-shirts and jeans are making them look funky and cool and most of them prefer to wear it. They
are attracted towards party wear which is most demanding nowadays for teens and youth.
4.23 Awareness about Ethical fashion
Most of the respondents say they know about ethical fashion through mass media and
magazines. Though some have own interest towards eco – friendly fashion and majority of them
are not aware of ethical fashion. But the respondents are eager to learn about the ethical
fashion and its path towards sustainability.
Page 57
Consumer behavior 49 6 August 2011
Chapter V
Conclusion
Growing economy has made Indian consumers more prosperous. An indication of this is clearly
given by the investigation on consumer behaviour of young Indian consumers in the age of 15-
25. This study has focused on how the buying behaviour varies between the age group of 15-20
and 21-25.
Based on the investigations the following conclusions can be drawn on the consumer behaviour
for this particular group.
In the surveyed age group of 15-20 Indian consumers, buy less than age group of 21-25
and this trend exists because 21-25 is the age where people start to work.
India has managed recession better and studies indicate the buying power in India amidst
global recession was higher than European countries.
Apparel were once purchased once a year or based on necessity and today this scenario
has completely changed and in the age group of 15-20 frequent buying is seen with a gap
of three months. This can be attributed to increased buying power.
An interesting outcome of this study is the influence of domestic apparel manufacturers on
the young consumers. The young consumers prefer domestic products than international
products and that is because the domestic products understand the consumer better and
products are based on nativity and suits their needs than international products. Although
international products possess more quality, consumers still consider those as luxurious
ones with high price.
The surveyed age group of 15-20 is very particular about the brands and they judge brands
based on perceived quality, value for money and availability of range of apparels.
The study also shows that in the age group of 15-20, there is a huge buying seen and more
amounts is spent on buying apparels. This can be because of unplanned purchases and
directionless purchases. This age group sometimes lack clarity and spend on non-essential
products.
There is a correlation of Indian consumers with European consumers when it comes to
increased unplanned purchases or buying non-essential items especially in the age group
of 15-20.
In Indian consumers it is interesting to note that some of them don‘t know what ethical
fashion is and they do not buy ethical fashion products.
Page 58
Consumer behavior 50 6 August 2011
Consumers consider that ethical fashion products cost more and they have very less
knowledge about the qualities of ethical fashion products.
The studies reveal that consumers of age group 15-20 should be advised about ethical
fashion products as they are the prime buyers of those products in the future. It is very
important to get this group understand the benefit of ethical fashion products.
The study reveals that age group of 15-20 is more inclined towards casual wear and that is
due to the impact of westernization. In India there was only traditional wear (dhoties,
sarees, salwar and trousers) and there were no casual and formal wears. However the
latest advancements in information technology have shown the Indian consumers what is
casual wear and formal wear.
Consumers of the age group 15-20 who are the pioneers of next generation are interested
in western outfits and that has led to decline in traditional wear in India.
With reference to the above point, the Indian consumers of age group 15-20 are not
thinking about sustainable products and that leads to lot of usage of natural resources. At
some point these resources are going to be extinct and so traditional methods of
manufacturing apparels should be resorted to.
Usage of traditional methods also has a disadvantage that production is less so to obtain a
win-win situation, new ways should be find out to make sustainable products.
The 15-20 age group consumers should look for sustainable products as that will lead to a
better living.
Indigenous technologies should be developed to ensure sustainability. In depth analysis
and introspection is necessary for apparel manufacturers in India to develop sustainable
products as that will be the main factor to drive the consumer in buying an apparel in the
future especially of the age group of 15-20 in India.
There should be balance between sustainability and demand. A new empirical method has
to be worked out to maintain a sustainable business. A more detailed study has to be
carried out to find perception from consumers in different state to develop a new
sustainability model.
In my views the responses from the 200 participants gives a great insight into how actually
the age group of 15-25 purchase apparel and fashion products. The study correlates with
the population of age group of 15-25 in the urban areas of South India though it may
correlate with the whole Indian population of age group of 15-25 with minor deviations.
Facebook and blogs are used by young Indians to just pass time; these media can be used
to promote awareness on ethical/sustainable fashion.
Page 59
Consumer behavior 51 6 August 2011
Appendix
A STUDY ON CUSTOMER PREFERENCE TOWARDS PURCHASE OF APPARELS
QUESTIONNAIRE
1. Name :
2. Gender: (a) Male (b) Female
3. Age: (a) below 15 (b) 15-20 (c)21-25(d) above 25
4. Education Qualification:
5. Occupation: (a) Student (b) Employed (c) Self- employed (d) Home
maker (e) Unemployed
6. Marital status: (a) Married (b) Unmarried
7. Aggregate annual Income (Family/Individual): (a) Below 1 lac (b) 1 to 2 lac (c) 2 to 4
lac(d)>4 lac
8. Nature of the family:(a) Nuclear (b) Joint family (c) Alone
9. Resident of: (a) Urban (b) Suburban (c) Rural
10. Size of the family: (a) 3 (b) 3-6 (c) Above 6
11. Frequency of apparel / fashion purchase: (a) Monthly (b) 3 months once (c) 6 months once
(d) Need based (e) Special occasions
12. Reasons for not purchasing apparels regularly:
(a) Distance (b) High Price (c) Non-availability of range of apparels (d) Others (Please
specify):
13. Which type of brand do you purchase?
(a) Domestic (b) International (c) Other (Please specify)
14. Source of information:
(a) Friends and neighbors (b) Radio & TV ads (c) In-store wall poster
(d) Newspaper/advertisement (f) SMS promotions (g) Parents (h) Peers (i) Others (Please
specify):
15. Reasons to choose a brand for purchase of apparels:
Please specify your importance to the following in the scale of 1 to 5 with 1 as least and 5 as
Highest.
Page 60
Consumer behavior 52 6 August 2011
S. No Factors Rank
(1 – 5)
1. Brand Image
2. Quality
3. Value for money
4. Availability of range of apparels
5. Convenience of many items
16. What do you think about the price of apparels for Ethical Fashion?
(a) Cheap (b) Value for money (c) Moderate (d) Costly
17. Are you aware of ‗ethical/eco fashion‘? If yes, how? * own interest, through family, friends or
media, others
18. What do you understand by the term ‗ethical fashion‘? Select one
Apparel (and jewellery) with less environmental impact
Production using green energy
Production using recycled materials/ materials that can be recycled
Made by people working in ambient conditions and with stipulated pay
Avoids child labour
Use of handicraft techniques which can be preserved
Other:
19. When you buy new clothes, do you consider ‗ethical fashion‘ as an option?
(a) Strongly agree (b) agree (c) Neutral (d) Disagree (e) Strongly disagree
20. Have you ever purchased 'ethical fashion' products? Yes/no
21. Do you change your dressing style according to the latest trends in fashion?Yes / No
22. What kind of outfits do you usually prefer?
(a) International (b) Indian
23. Why you do or don‘t believe companies selling ‗ethical fashion‘?
Not at all
Some of what they claim
Undecided
Most of what they claim
Believe them totally
Page 61
Consumer behavior 53 6 August 2011
24. What is your favorite trend and why?
_____________________________________
25. What influences you the most when you buy clothes?
Fashion/Stylish
A designer
Modest prices
Wearability
A theme
26. Who or what influences your style?
Trends
Friends
Celebrities
Age group
Magazines
Other (Please State):__________________
27. How much do you usually spend on clothes every month?
Rs. < 500
Rs. 500 – 1000
Rs. 1000 – 2500
Rs. 2500 - 5000
Above Rs. 5000
28. What do you dislike about fashion?
Changes quickly
Expensive
Others (Please specify):
29. Which fashion style/trend are you following when you decide to buy clothes
Leisure
Artistic
Celebrity
Latest trend
Romantic
Executive
Classic
Others (Please specify):
Page 62
Consumer behavior 54 6 August 2011
30. Rank the following attributes which is more important when you buy a product
Please rank the following in the scale of 1 to 5 with 1 as least and 5 as Highest.
S. No Factors Rank
(1 – 5)
1. Product quality
2. Price
3. Brand name
4. Style & fit
5. Product variety
31. State your importance to Sensory feeling for apparels Please rank the following in the scale of 1 to 5 with 1 as least and 5 as Highest.
S. No Factors Rank
(1 – 5)
1. Touch
2. Smell
3. Visual
4. Taste
32. Do you buy clothes based on Sensory feelings? Yes / No 33. Which brand has good sensory feelings? Indian International
Page 63
Consumer behavior 55 6 August 2011
List of Sources
"Apparel retail." Images Year book business of Fashion (2009).
Barry Berman, Joel R. Evans. Retail Management; A Strategic approach. Macmillan Publishing
Co. Inc.,, 1979.
Bhatt, R.Gopal. "Consumerism: Concept and its Needs in our Era." Indian Journal of Marketing
(1985): 3 - 8.
Contemporary Retailing. Bolen, W. H. Ed. NJ Englewood Cliffs. 2nd. Prentice – Hall Inc.,, 1983.
561.
Chetan Bajaj, Nidhi Srivastava, Rajnish Tuli. Retail Management. New Delhi: Oxford Unviersity
Press, 2009.
Cravens, H and Wood. Marketing Management. New Delhi: A.I.T.B.S. Publishers and
Distributors, 1996.
Cundiff.E.W and R.R.Still. Basic Marketing - Concepts, Environment and Decisions. New Delhi:
Prentice-Hall of India Pvt. Ltd, 1968.
Dale M. Lewison, M. Wayne. Retailing. Merrill publishing, 1989.
David L. Loudon, Albert J. Della Bitta. Consumer behavior. New Delhi: Tata McGraw-Hill, 2002.
Elling, A. Karl. Introduction to Modern Marketing Management - An Applied Approach. New
York: The Macmillan Company, 1984.
Glenn, C. and Walters. Consumers Behavior: Theory and Practice. Illinois: Richard. D. Irwin Inc,
1974.
Global, McKinsey. "The 'Bird of Gold' : The Rise of India's Consumer Market." Report. May
2007.
IyerBasker. "Is the Consumer Really Involves." Indian Management (1990): 17 - 20.
Jay D. Lindquist, M. Joseph Sirgy. Shopper, Buyer and Consumer Behavior Theory and
Marketing Applications. 2. New Delhi: Dreamtech Press, 2003.
K, Hari .D. Influence of Advertising and Sales Promotion on Sales and Consumers. M.B.A
Thesis. Coimbatore: PSGIM, 1985.
Kardes, Frank R. Consumer Behavior and Managerial Decision Making. Prentice Hall
Publications, 2001.
Kotler, P. Principles of Marketing. New Delhi: Prentice Hall of India, 2004.
KPMG. "Indian Retail: Time to change." Consumer Markets. 2009.
Levy, M and B. Weitzz. Retailing Management. 7th. McGraw-Hill Company, 2008.
Mehta., C.S. Indian Consumers. New Delhi: Tata McGraw Hill Publishing Company Ltd, 1974.
Michael J. Etzel, Bruce J. Walter, Willian J. Stanton, Ajay Pandit. Marketing - Concepts &
Cases. New Delhi: Tata McGraw-hill, 2007.
Michael Levy, Barton Weitz. Retailing Management. 5th . New Delhi: Tata McGraw-Hill, 2003.
Patrick M. Dunne, Robert F. Lusch. Retailing. Thomson South Western Publication, 2002.
Philip Kotler, Gary Armstrong. Principles of Marketing. New Delhi: Prentice Hall India Pvt. Ltd.,
2006.
Philip, Kotler. Principles of Marketing. New Delhi: Prentice Hall of India Ltd, 2000.
Pradhan, Swapna. Retailing Management; Text & cases. Tata McGraw-Hill , 2009.
Page 64
Consumer behavior 56 6 August 2011
Rogers D. Blackwell, Paul W. Miniard, James F. Engel. Consumer Behavior. Vikas Publishing
House, 2002.
Rom, Markin. Marketing, Strategy and Management. New York: John Willey and Sons, 1982.
Sawarkar, Giram and. Consumer Behavior-Theory and Practices. Illinois: Richard Irwin Inc,
1996.
Shukazmi, Satish K Batra. Consumer Behavior. Excel books, 2004.
Singh, Bir. Sales Promotion Management. New Delhi: Anmol Publishing Private Limited, 2006.
Vedamani, Gibson G. Retail Management; Functional princples & practices. New Delhi: Jaico
Publishing House, 2009.
William D. Peneault, Jr. E. Jerome McCarthy. Basic Marketing - A global managerial approach.
New Delhi: Tata McGraw-Hill , 2002.
15 May 2009. India retailing. Retrieved on 15 April 2011
<http://www.indiaretailing.com/news.aspx?topic=1&Id=3774>.
knowledgerush. Retrieved on 25 March 2011
<http://www.knowledgerush.com/kr/encyclopedia/Retailer/>.
Business dictionary . n.d. Retrieved on 23 June 2011
<http://www.businessdictionary.com/definition/consumer-awareness.html>.
CNBC. Money control. 06 May 2011. Retrieved on 20 May 2011
<http://www.moneycontrol.com/news/cnbctv18comments/why-global-retailers-strive-to-find-
right-indian-partner_541214.html>.
Ganguly, Saby. Retailing industry in India. n.d. Retrieved on 10 April 2011
<http://www.indiaonestop.com/retailing.htm>.
"IMaCS VIRTUS." n.d. www.ivgpartners.com. Retrieved on 12 April 2011
<http://www.ivgpartners.com/reports/US%20India%20Retail%20and%20Franchising%20Opp
ortunities.pdf>.
Indiantake blogspot. 03 January 2010. Retrieved on 21 March 2011
<http://indiantake.blogspot.com/2010/01/size-of-india-middle-class.html>.
Legal Service India. n.d. Retrieved on 16 April 2011
<www.legalserviceindia.com/articles/pcnew.html>.
Nimish Tanna. Overseas Indian Facilitation centre . 18 January 2011. Retrieved on May 2011
<http://www.oifc.in/Article/Indian-Retailing---The-Homerun>.
Pandey, Rajni. Indian retailer . 12 April 2011. Retrieved on 20 June 2011
<http://retail.franchiseindia.com/articles/Retail-Trends/Retail-Industry/Top-Retailers-in-India-
404/>.
Retail, IBEF. Indian Brand Equity Foundation. 22 January 2009. Retrieved on 10 April 2011
<http://www.ibef.org/Archives/ViewArticles.aspx?art_id=21574&cat_id=375>.
Retailing definition. n.d. Retrieved on 22 April 2011
<http://www.apparelsearch.com/definitions/miscellaneous/Retailing_definition.htm>.
RMKV Silks. n.d. Retrieved on 1 May 2011 <http://www.rmkv.com/silk-home.aspx>.
Rural Retail in India. 17 September 2009. Retrieved on 10 April 2011 <http://retail-
guru.com/rural-retail-in-india/>.
Waters, Shari. n.d. About.com Retailing. Retrieved on 25 March 2011
<http://retail.about.com/od/retailglossaryr/g/retailer.htm>.


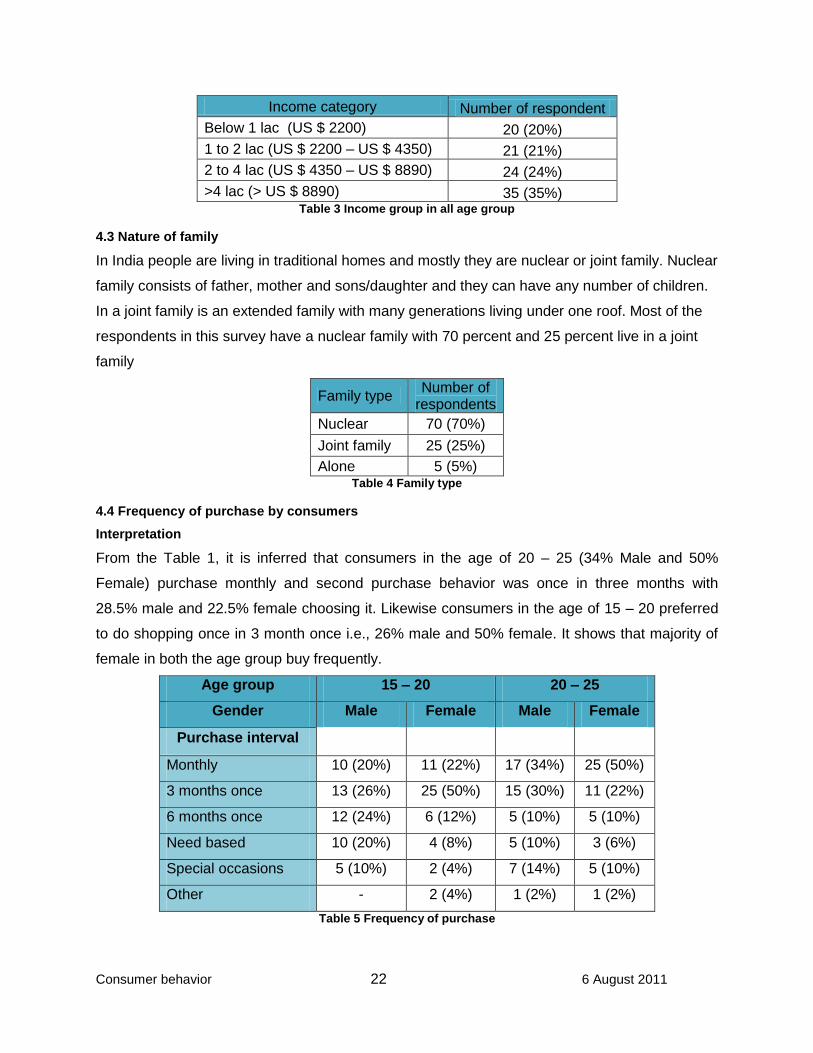


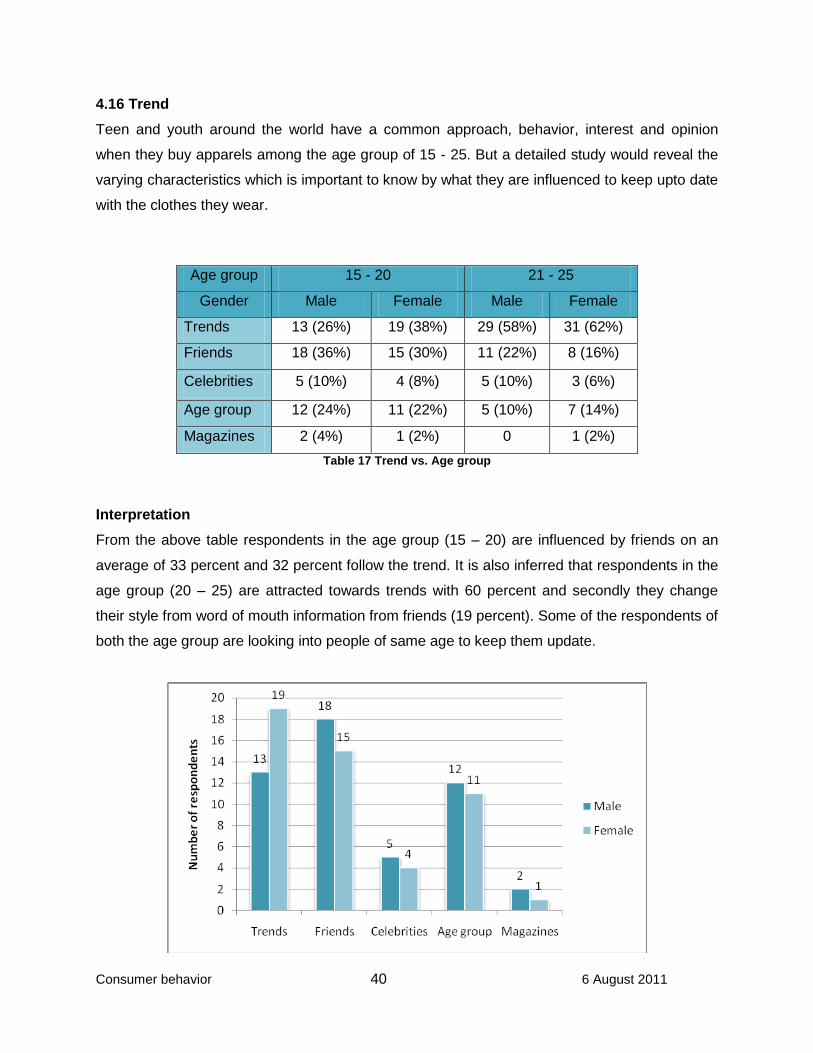


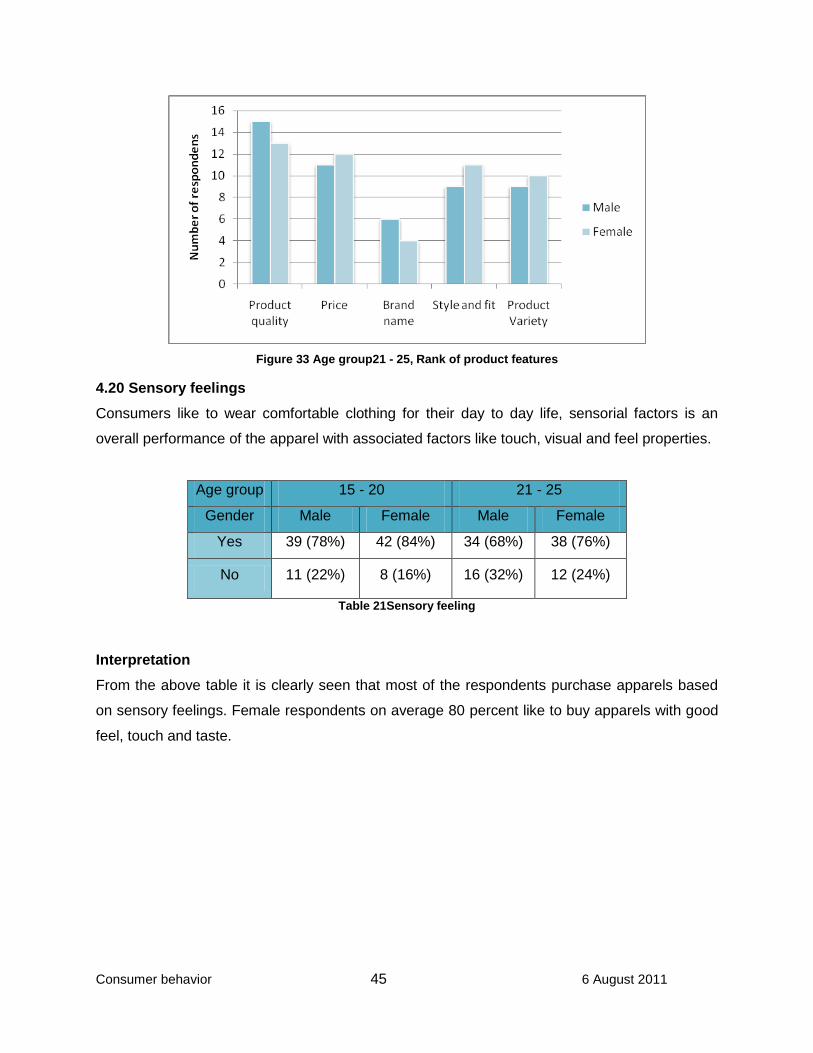
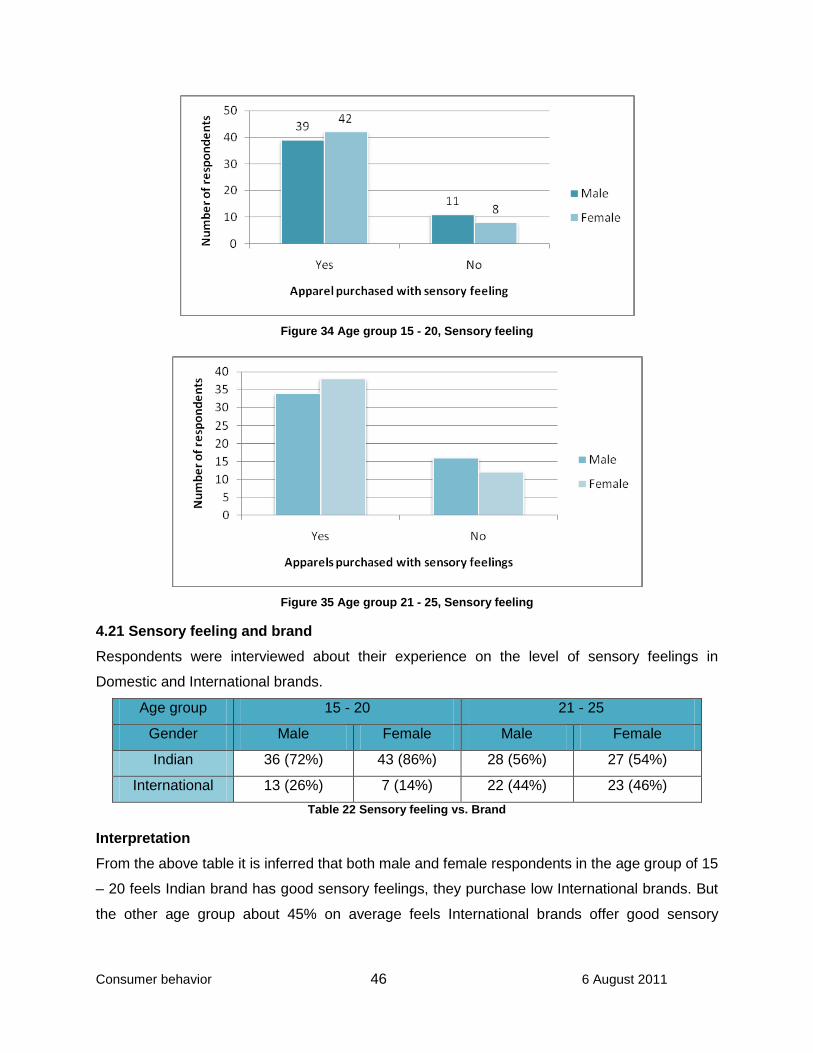


![[PPT]Consumer Behavior and Marketing Strategy - Lars … to CB.ppt · Web viewIntro to Consumer Behavior Consumer behavior--what is it? Applications Consumer Behavior and Strategy](https://static.documents.pub/doc/80x56/5af357b67f8b9a74448b60fb/pptconsumer-behavior-and-marketing-strategy-lars-to-cbpptweb-viewintro.jpg)


