An Observational and Modeling Study of an Atmospheric Internal Bore duringNAME 2004
ELINOR R. MARTIN AND RICHARD H. JOHNSON
Department of Atmospheric Science, Colorado State University, Fort Collins, Colorado
(Manuscript received 12 December 2007, in final form 10 March 2008)
ABSTRACT
Observations from the 2004 North American Monsoon Experiment (NAME) have been used to identifyan atmospheric internal bore that occurred over the Gulf of California (GoC) on 31 July 2004. This boredisturbance was identified at Bahia Kino along the northwest coast of Mexico during the late evening of 31July. It was hypothesized to have originated from the interaction of a gravity current from a large mesoscaleconvective system (MCS), which formed along the western slopes of the Sierra Madre Occidental during theafternoon, and a surface stable layer that developed from a sea-breeze circulation. It is suggested that thebore’s energy was trapped at low levels by an elevated stable layer. The vertical structure and undularnature of the bore was initially identified from 915-MHz wind profiler data at Bahia Kino. Results show aseries of waves along the bore’s leading edge and turbulent mixing of air from above the stable layer to thesurface on the downstream face of the leading undulation. The speed of the bore calculated from satelliteimagery and surface observations (approximately 16.8 m s�1) compared favorably with the speed of a borefrom hydraulic theory when a reliable estimate of the bore depth was used.
A real-data simulation of the event was performed using the Weather Research and Forecasting model(WRF). Results show the model captured both the formation mechanism and structure of the bore, but itwas produced too far south compared to observations, as the MCS also developed too far south. Modelresults indicated that while evidence of a trapping mechanism due to the stability of the atmosphere waspresent in the simulation, the conditions for trapping were modified by the passage of the bore allowingvertical propagation of wave energy. The bore led to increased moisture in the lowest levels of the atmo-sphere across the GoC, providing evidence of the possible importance of these features as moisture trans-port mechanisms in this region.
1. Introduction
Monsoon circulation systems develop over low-latitude continental regions in response to thermal con-trast between continents and adjacent oceans. Mon-soons are major components of warm-season precipita-tion regimes (Higgins et al. 2003). The North AmericanMonsoon (NAM) develops because of heating over theelevated terrain of Mexico and the western UnitedStates beginning in early July. Although the NAM ismuch weaker than the more well-documented Asianmonsoons, it still has prominent monsoon characteris-tics, such as a reversal in the mean low-level flow overthe Gulf of California (Tang and Reiter 1984; Badan-
Dangon et al. 1991), areas (e.g., northwestern Mexico)receiving a major fraction (60%) of their total annualprecipitation during the monsoon season (Tang andReiter 1984; Douglas et al. 1993; Higgins et al. 1997),and a strong upper-level anticyclone (Krishnamurti1971).
The geographical domain of the NAM includes im-portant topographical features, such as the Sierra Ma-dre Occidental (SMO), the Gulf of California (GoC),the Sonoran Desert, and the peninsula range of BajaCalifornia (Fig. 1). The complex topography of theNAM region makes the prediction of warm-season pre-cipitation in this region a challenge (Xu et al. 2004).
A strong diurnal cycle of convection is present duringthe NAM. The combination of heating along the slopesof the SMO during the day and the afternoon seabreeze that develops off the GoC leads to lower-tropospheric convergence centered over the westernslope of the SMO, collocated with strong divergence
Corresponding author address: Elinor Martin, Department ofAtmospheric Science, Colorado State University, Fort Collins,CO 80523.E-mail: [email protected]
4150 M O N T H L Y W E A T H E R R E V I E W VOLUME 136
aloft between 150 and 200 hPa (Johnson et al. 2007),and intense afternoon and evening precipitation.
One aspect of the NAM that has heretofore receivedlittle attention is the frequent occurrence of atmo-spheric internal bores. Observations of these phenom-ena have come about as a result of the 2004 NorthAmerican Monsoon Experiment (NAME; Higgins etal. 2006). An internal bore in the atmosphere is a typeof gravity wave disturbance that forms at an interfacebetween two fluids and propagates on a low-level in-version ahead of a gravity current. The simplest andmost general definition of a bore is a propagating dis-turbance characterized by a sudden, and relatively per-manent change in the height of a horizontal fluid inter-face and in the velocity of the fluid beneath the inter-face.
Internal bores are classified as undular when they are
accompanied by a group of waves that radiate energydownstream (Clarke et al. 1981). Bores can arise in avariety of atmospheric situations when disturbances aregenerated on a preexisting inversion layer. Several the-ories have been proposed as to the possible externalforce required for the generation of bores. Cool airbehind colliding gravity currents (Clarke et al. 1981;Clarke 1984; Noonan and Smith 1987; Wakimoto andKingsmill 1995; Kingsmill and Crook 2003), thunder-storm outflows (Fulton et al. 1990; Koch et al. 1991;Mahapatra et al. 1991; Locatelli et al. 1998; Koch et al.2005; Knupp 2006), and mesoscale fronts (Karyampudiet al. 1995; Smith et al. 1995; Koch and Clark 1999;Demoz et al. 2005) interacting with an existing stablelayer may trigger bore disturbances. However, compli-cations to these ideas arise in the real atmosphere be-cause of complex stratification, vertical shear, elevated
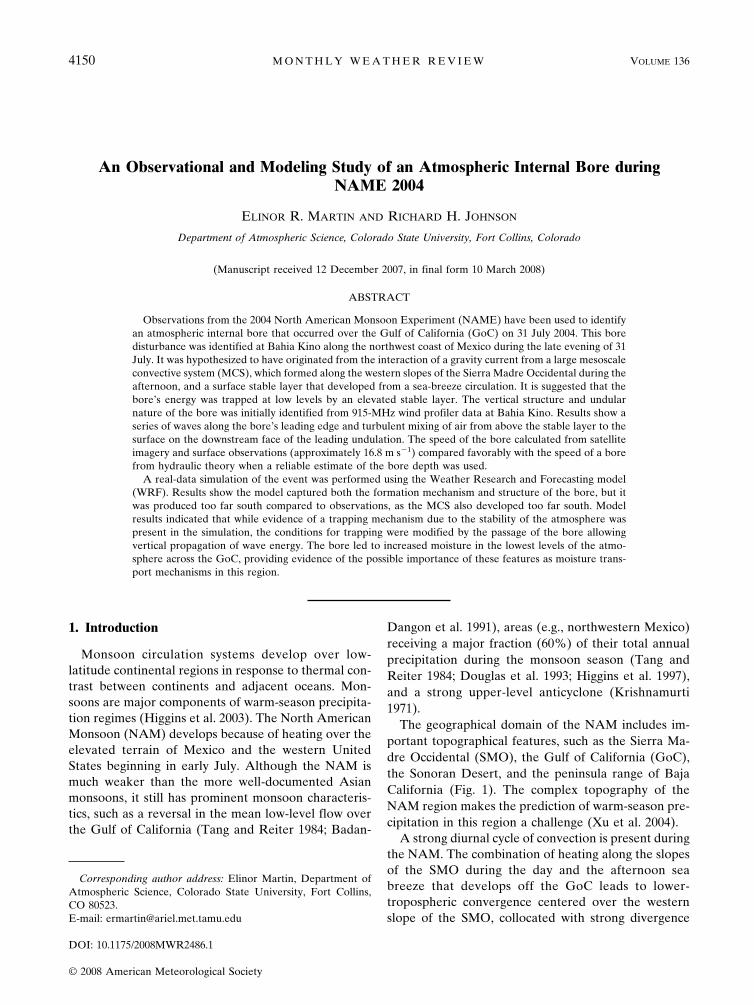
FIG. 1. NAME sounding network and grids used for sounding analysis: tier II array (T2A),tier I array (T1A), and enhanced budget array (EBA). Symbols indicate frequency of routine(EOP) sounding launches (left number) and frequency of increased sounding launches (rightnumber) during IOPs.
NOVEMBER 2008 M A R T I N A N D J O H N S O N 4151
inversions, and unsteady and/or multiple gravity cur-rents.
Previous studies have shown that atmospheric boresexist in several regions of the world. Perhaps the mostrecognizable is the Morning Glory of the Gulf of Car-pentaria in northern Australia, which was first identi-fied as an internal undular bore initiated by the inter-action of a sea breeze and a nocturnal inversion byClarke et al. (1981). Many bores have been identified inthe central United States (Doviak and Ge 1984; Haaseand Smith 1984; Carbone et al. 1990; Fulton et al. 1990;Demoz et al. 2005), Florida (Wakimoto and Kingsmill1995; Kingsmill and Crook 2003), and other regions ofthe world. Prior to the 2004 NAME, there has been noevidence of bores being observed in the NAM domain.However, results emerging from NAME have shownthat these phenomena indeed exist in the GoC region(Rogers and Johnson 2007). In that study bores werepostulated to exist based on NAME observations, al-though details of their structure and behavior were notfully documented.
The primary objective of this study is to extend andexpand these earlier results to better describe the struc-ture, dynamics, and significance of atmospheric bores inthe NAM region. Observational measurements col-lected during NAME from 1 July to 15 August 2004,allow for detailed studies of the structure and dynami-cal mechanisms of internal bores. Very few observa-tions are routinely available in this region from the op-erational network; however, data collected during theNAME field campaign have provided an unprec-edented high temporal and spatial resolution dataset(Higgins et al. 2006). Of particular importance in thisstudy is the deployment of three National Center forAtmospheric Research (NCAR) Integrated SoundingSystems (ISS) along the east coast of the GoC tosample the lower troposphere.
It is important to identify and understand atmo-spheric bores in this region for several reasons. First,circulations produced by bores (and other similar phe-nomenon) may be capable of directly triggering con-vection, as maximum vertical velocities have been ob-served up to 15 m s�1 (Shreffler and Binkowski 1981;Carbone et al. 1990; Fulton et al. 1990; Karyampudi etal. 1995). The convection that is triggered by bores canrange from roll clouds (Clarke et al. 1981) and lightshowers to squall lines with tornadic storms (Karyam-pudi et al. 1995), although the latter do not occur in theNAM region. Second, the accelerated and increaseddepth of the flow behind the leading edge of a bore maybe responsible for increased moisture transport into thesouthwestern United States, providing the fuel for en-hanced convection (Rogers and Johnson 2007).
2. Data and methods
NAME is an internationally coordinated projectaimed at determining the “sources and limits of pre-dictability of warm season precipitation over NorthAmerica.” NAME seeks to improve the understandingof key physical processes that must be parameterizedfor more realistic simulations and accurate predictionswithin the NAM region with coupled numerical mod-els. During the NAME 2004 campaign, data were gath-ered from more than 20 different types of instrumentplatforms, including surface meteorological stations, ra-dars, aircraft, research vessels, satellites, wind profilers,rawinsondes, and rain gauge networks (Higgins et al.2006).
NAME employs a multiscale (tiered) approach withfocused monitoring, diagnostic, and modeling activitiesin the core monsoon region. Figure 1 shows the regionsencompassed by the tier 1A (the core monsoon region)and tier 2A (covering the southwestern United Statesand much of Mexico) domains, along with an enhancedbudget array.
During the extended observing period (EOP) threeNCAR ISSs were deployed along the GoC at PuertoPenasco, Sonora; Bahia Kino, Sonora; and Los Mochis,Sinaloa, on the eastern side of the GoC (Fig. 1). TheISSs consisted of a global positioning system (GPS)sounding system, a 915-MHz Doppler clear-air windprofiler, a Radio Acoustic Sounding System (RASS),and an enhanced surface meteorological station thatmeasured pressure, temperature, relative humidity,wind speed and direction, radiation (solar and net), andprecipitation at 1-min resolution (Higgins et al. 2006).
The atmospheric internal bore discussed in this studywas identified at Bahia Kino using the signal-to-noiseratio (SNR), vertical velocities, spectral width (1-mintemporal resolution) and low-mode horizontal winddata from the 915-MHz Doppler clear-air wind profiler.The NCAR Improved Moments Algorithm (NIMA)quality control program was used to correct bad orquestionable profiler data. Further quality control forthe wind calculation was provided by the NCAR Windsand Confidence Algorithm (NWCA). Data with aNWCA confidence value of 0.5 or greater are consid-ered dependable. Data from the wind profiler at BahiaKino were compared to data from the surface observa-tions of temperature, humidity, and pressure.
In addition to the ISS surface meteorological stationat Bahia Kino, additional surface observations wereused from Servicio Meteorologico Nacional (SMN)sites in Mexico, which reported hourly observations ofpressure, temperature, relative humidity, and windspeed and direction, and a network of automated sta-
4152 M O N T H L Y W E A T H E R R E V I E W VOLUME 136
tions maintained by SMN, which reported 10-min ob-servations of pressure, temperature, relative humidity,wind speed and direction, and precipitation. When ex-amining time series of surface pressure data at SMNsites, it was discovered that the overall data quality wasquite poor. The surface pressure data from the SMNsites were reduced to altimeter settings and pressurevalues outside three standard deviations from the meanwere discarded. The data from the ISS stations were ofa high quality and little quality control needed to beperformed.
To observe the pressure changes associated with thebore, both the diurnal and semidiurnal tides of pressurewere removed from the pressure data at all stations sothat the meteorological signal of the bore could be iso-lated. To calculate the anomalies, the mean value ofpressure was calculated for each time interval (1 min, 10min, or 1 h depending on the temporal resolution of thestation) for the entire EOP. It is assumed that the di-urnal and semidiurnal tidal effects don’t change overthe period of the study. These mean values were thenremoved from the pressure to produce a surface pres-sure anomaly.
In addition to the data described above, Geostation-ary Operational Environmental Satellite-10 (GOES-10)infrared (IR) images centered about the core monsoonregion were obtained from the Cooperative Institutefor Research in the Atmosphere (CIRA). Water vaporimagery was not used since this channel integrates wa-ter vapor over a depth of the atmosphere centeredabout the mid- to upper troposphere, whereas bore-related moisture advection is centered at low levels.The IR images were examined every 15 min during theperiod associated with bore formation, passage, anddissipation to determine areas of relative cloudiness as-sociated with the bore itself and convective activity as-sociated with bore formation. Comparison of these im-ages with the pressure time series at all stations proveduseful in relating cloud features to surface signatures ofthe bore. Visible satellite imagery did not prove usefulbecause the bore event occurred at night. No NAMEpilot balloon, aircraft, or radar data were used in thisstudy, because of the location and timing of the bore inquestion.
3. Numerical model configuration
Despite the increased amount of data available dur-ing NAME, data were still relatively sparse in relationto the structure and dynamics of bores. To fully inves-tigate one bore event, a numerical simulation using theWeather Research and Forecasting (WRF) AdvancedResearch WRF (ARW) model was performed. The
ability of the WRF model, initialized with real data, tosimulate bore phenomenon has not previously been in-vestigated. The WRF modeling system is a multiagencyeffort intended to provide a next-generation mesoscaleforecast model and data assimilation system that willadvance the understanding and prediction of mesoscaleweather.
Version 2.1.2 of the Advanced Research WRF wasset up in a triple, one-way nested grid configurationwith 18-, 6-, and 2-km horizontal grids. The coarsestgrid was initialized with 40 km Eta Model data at 0000UTC 31 July 2004 and run for 12 h with model outputevery 15 min. All three nests contained 53 vertical lev-els, with the greatest resolution in the boundary layer.Cumulus convection was parameterized using theKain–Fritsch scheme on domains 1 and 2, while con-vection was explicitly resolved in domain 3. (Furtherdetails of the model configuration are shown in Table 1and details of the parameterization schemes are avail-able at www.mmm.ucar.edu/wrf/users/.)
4. Observational analyses
This section presents the observational evidence ofan atmospheric internal bore that was observed duringthe evening (local time) at the Bahia Kino ISS site on31 July 2004 during NAME. A variety of data fromdifferent instruments will be presented.
a. Satellite data
Figure 2 shows GOES-10 IR images of the core mon-soon region from 0130 to 0430 UTC 31 July. At 0130UTC (Fig. 2a), a series of mesoscale convective systems(MCSs) had developed along the SMO due to westerlyupslope flow at low levels and strong solar heating andmoisture availability along the SMO, consistent withthe diurnal cycle of convection in this region. Thenorthernmost MCS, located east of the Bahia Kino ISSsite had already developed, with a large cloud anvil andcloud-top temperatures below �60°C.
One hour later, at 0230 UTC (Fig. 2b) the convective
TABLE 1. Design of WRF numerical model experiment. Mul-tiple entries indicate different configurations for domains 1, 2,and 3.
NOVEMBER 2008 M A R T I N A N D J O H N S O N 4153
system to the east of the Bahia Kino ISS site had de-veloped a low-level cloud feature (cloud-top tempera-tures between 276 and 279 K) to its southwest. Inter-mediate satellite imagery (not shown) suggests that thiscloud feature was generated by the convective systemand began moving westward and away from its parentsystem by 0200 UTC. This low-level cloud feature con-tinued to propagate westward, at a speed of 16.5 m s�1,and by 0330 UTC (Fig. 2c), had a distinctive arc-shapedstructure as it moved into the GoC. While we cannotexplicitly determine the nature of this cloud featurefrom the satellite imagery alone, the fast propagationspeed suggests an atmospheric bore. During this time,the MCS that produced the bore moved northward andweakened.
Through 0430 UTC (Fig. 2d) the northernmost por-tion of the low-level cloud feature was in the region ofthe Bahia Kino ISS site. The approximate length of thecloud feature at this time was 220 km. The MCS con-tinued to dissipate as a second larger MCS developed tothe southeast.
The linear structure of the cloud feature began tobreak down and become disorganized as it progressedacross the GoC between 0500 and 0600 UTC (notshown). After 0600 UTC the satellite imagery (notshown) shows that while the southern part of the cloudfeature had dissipated, the northern section stalled overthe eastern slopes of the Baja California Peninsula until0800 UTC when it dissipated completely.
b. 915-MHz Doppler clear-air wind profiler
The 915-MHz wind profiler located at the BahiaKino ISS site was ideally situated to investigate thevertical structure of the lower atmosphere in conjunc-tion with the cloud feature seen in the satellite imagery(Fig. 2). A 2-h section of the profiler data, at the time ofthe cloud passage is shown in Fig. 3. Four different dataproducts are shown from top to bottom: the SNR, ver-tical velocity, spectral width, and horizontal winds ev-ery 30 min. Data are only displayed when the SNR isgreater than �15 dB.
The large values of SNR at low levels (Fig. 3a) were
FIG. 2. Infrared GOES-10 satellite imagery over the core NAM domain at (a) 0130 UTC 31 Jul, (b) 0230 UTC31 Jul, (c) 0330 UTC 31 Jul, and (d) 0430 UTC 31 Jul 2004. Coldest cloud-top temperatures are shaded. The BKin (a) shows the location of the ISS site at Bahia Kino and HE the surface station at Hermosillo.
4154 M O N T H L Y W E A T H E R R E V I E W VOLUME 136
Fig 2 live 4/C
due to changes in the refractive index. At the beginningof the time series a shallow layer (200–400 m) of en-hanced SNR close to the surface, due to a surface stablelayer is evident. At 0435 UTC (2135 LT) this surface-based region of enhanced SNR rapidly evolved, in-creasing in depth to approximately 1 km and increasingin magnitude. This evolution coincided with the low-level cloud passage in the satellite imagery and the up-draft seen in Fig. 3b. The depth of the surface-based
SNR region remained large through 0600 UTC, sup-porting evidence that the disturbance is an atmosphericbore. However, the most convincing evidence that thedisturbance is an atmospheric bore is the series of un-dulations in the SNR in the lowest 3 km, much like theundular bore documented during the InternationalH2O Project (IHOP) by Koch et al. (2005).
At least two undulations are evident in the SNRaround 1 km, indicating the bore was undular at this
FIG. 3. 915-MHz wind profiler data from the Bahia Kino ISS, 0400–0600 UTC 31 Jul 2004; (a) SNR, (b) Dopplervertical velocity (negative vertical velocities indicate motion away from the profiler), (c) spectral width, and (d)horizontal winds derived from NIMA processing.
NOVEMBER 2008 M A R T I N A N D J O H N S O N 4155
Fig 3 live 4/C
period in its life cycle. The time between the first un-dulations is 14 min and between the second is 11 min.Assuming the bore is propagating at 16.5 m s�1, as de-termined from the speed of the low-level cloud in thesatellite, this corresponds to wavelengths of 14 and 11km. The wavelength fits within the range of observa-tions from previous studies. The greater distance be-tween the first undulations compared to the succeedingundulations has also been observed in studies of boresand solitary waves (Fulton et al. 1990) and is attributedto the larger amplitude of the initial undulation (orwave), hence, a greater propagation speed of the firstundulation and increased separation between the firsttwo wave crests.
A second layer of enhanced SNR observed at 1 km at0400 UTC was elevated approximately 800 m by thepassage of the bore at 0435 UTC. The undulations seenin the surface based layer of enhanced SNR were alsoobserved in this elevated layer. The lack of tilt betweenthe undulations in these layers suggests that wave en-ergy is being trapped (Koch et al. 2005), which will beexplored further in section 3f.
The maximum vertical motion associated with thebore was 4–5 m s�1 (Fig. 3b). Three distinct couplets ofascent and descent are seen in the profiler data in phasewith the undulations in the SNR, supporting the hy-pothesis that this is an atmospheric internal undularbore. The first couplet contains the largest magnitudesof vertical motion (both ascent and descent). One of theimportant features of the vertical velocity profile is thatthe vertical velocities extend considerably higher thanthe region of enhanced SNR, indicating that the bore’senergy was not trapped close to the surface (below ap-proximately 3 km).
Spectral width from the profiler is shown in Fig. 3c.There are four processes that contribute to spectralwidth: turbulence, wind shear within the pulse volume,differential fall velocities, and antenna movement. Inthe boundary layer, the largest contribution to the spec-tral width is likely to be from turbulence, with windshear as the secondary contributor. A region of en-hanced spectral width at and below 1 km was observedbeginning at 0440 UTC and lasting for 10 min. Thismaximum is collocated with the downstream face of thefirst undulation in SNR and the downward motion inthe first vertical velocity couplet. It is hypothesized thatthis maximum in spectral width was due to enhancedturbulence on the downstream face of the first undula-tion that mixed turbulent air from above the stablelayer toward the surface. This downward mixing hasbeen observed in laboratory studies (Rottman andSimpson 1989) and atmospheric bores (Knupp 2006).
The vertical profile of the horizontal winds, pro-cessed using NIMA (section 2), is displayed in Fig. 3d.Unfortunately, the NIMA processing algorithm onlyproduced winds at 30-min intervals to ensure high-quality data. However, the change in wind directionfrom southwesterly before the bore to southeasterly (inthe direction of the bore motion) after the bore passageis clearly evident. The southwesterly winds prior to thebore passage are consistent with upslope flow along theSMO that generated the convection seen in the satelliteimagery (Fig. 2).
The RASS at Bahia Kino was switched off at 0400UTC, when the surface stable layer was 400 m in depth,just prior to bore passage, so no observations of thevertical profile of virtual potential temperature of thebore are available.
c. Soundings
The potential temperature from the sounding re-leased from Bahia Kino at 0000 UTC 31 July (1700 LT30 July) is shown in Fig. 4. Unfortunately, this bore didnot occur during an intensive observation period (IOP),so a sounding was not released at 0600 UTC. While thesounding at 0000 UTC was over 4 h prior to the passageof the bore, it is still useful in determining the preboreenvironment and understanding why the bore was ableto propagate.
The 0000 UTC sounding shows a strong stable layerextending to approximately 250 m above the surface.This stable layer is not due to nocturnal cooling as thesounding was taken at 1700 LT. It is suggested that this
FIG. 4. The 0–10-km vertical profile of potential temperature(°C) (solid line, lower axis) and mixing ratio (g kg�1) (dashed line,upper axis) from the 0000 UTC 31 Jul 2004 sounding from BahiaKino.
4156 M O N T H L Y W E A T H E R R E V I E W VOLUME 136
low-level stable layer is due to the sea breeze that de-veloped along the eastern coast of the GoC during theafternoon, and that the bore propagated along thisstable layer. Above the stable layer, between 0.5 and 3km, the temperature profile is close to neutral, hencethe ideal conditions for wave trapping are present; astable layer capped by a layer of neutral stability(Crook 1986). An elevated stable layer between 5.5 and6 km is a prominent feature above the low-level stablelayer.
As discussed in section 4a, the cloud-top temperatureof the low-level cloud feature associated with the bore,was between 276 and 279 K, which would place thecloud top at or close to 600 hPa (4 km AGL) from the0000 UTC sounding (assuming the cloud is opticallythick), noting that this sounding was several hours priorto bore passage. This is consistent with the vertical ve-locities within the bore (Fig. 3b) being large, and ex-tending up to at least 3 km for the first undulation,where the mixing ratio is largest and the environment isclose to saturation (not shown). It is suggested that thelow-level cloud feature identified in the satellite imag-ery is generated by the ascent associated with the lead-ing edge of the bore.
d. Surface observations
The pressure anomaly, temperature, dewpoint tem-perature, wind direction, and wind speed associatedwith the bore passage at Bahia Kino are shown in Fig.5 for the 3 h surrounding the passage of the bore (0330–0630 UTC). A 1.5-hPa rise in the pressure anomaly in
8 min was associated with the arrival of the bore at 0432UTC. The pressure was at its maximum value at 0440UTC, followed by an oscillation of magnitude 0.5 hPa.The timing of the pressure oscillations is consistent withthe undulations in the profiler SNR and the satelliteimagery of the low-level cloud feature.
We see little change in the surface temperature be-fore and after the bore passage. However, the dew-point temperature increased 2°–3°C as the bore passedthe measurement site. The dewpoint temperature re-mained elevated, indicating a moistening at the surface,while the pressure was elevated. This moistening is con-sistent with some previous studies (Koch et al. 1991;Mahapatra et al. 1991); however, other studies show adrying accompanying bores (Fulton et al. 1990; Kochand Clark 1999).
In conjunction with these mean changes in tempera-ture and dewpoint temperature, we see a distinct sig-nature in both variables coinciding with the down-stream face of the first undulation of the bore. At thistime there is a slight increase in temperature of 1°C, asharp decrease in the dewpoint of 7°C, and a minor dipin pressure, which lag the pressure maximum by 7–8min. This lag is consistent with results from Fulton et al.(1990) and Koch and Clark (1999). The timing of thiswarming and drying corresponds to the region of highspectral width (increased turbulence) seen in Fig. 3c.The warming and drying at the surface, and increasedturbulence below 1 km together indicate turbulent mo-tion (due to shear instability) in the lee of the firstundulation of the bore, which mixed potentially
FIG. 5. One-minute resolution observations from the surface meteorological station at BahiaKino, 31 Jul 2004: (a) pressure anomaly (green) (hPa), temperature (red) (°C), and dewpointtemperature (blue) (°C) and (b) wind speed (dotted) (m s�1) and wind direction (solid).
NOVEMBER 2008 M A R T I N A N D J O H N S O N 4157
Fig 5 live 4/C
warmer, drier air from above the surface stable layerdownward to the surface.
Coincident with the two oscillations in pressure aretwo maxima in wind speed (Fig. 5b), with wind speedsmore than doubling as each undulation passed over theobserving station. This in-phase relationship betweenpressure and wind speed undulations has been welldocumented in observations of both solitary waves andundular bores (Haase and Smith 1984; Fulton et al.1990; Mahapatra et al. 1991; Koch et al. 1991; Karyam-pudi et al. 1995; Knupp 2006). The wind direction at thesurface is consistent with the profiler-measured winddirection close to the surface.
To investigate the mechanism involved in generatingthe bore, hourly surface observations from Hermosillo(see Fig. 2a for location) are presented in Fig. 6. Thisstation is situated to the west of the MCS that gener-ated the outflow boundary that led to the generation ofthe bore observed at Bahia Kino. Despite only havinghourly observations from Hermosillo, Fig. 6 shows sur-face observations consistent with a gravity current. Thepressure increases by 4.9 hPa between 0300 and 0500UTC and rapidly decreases after this time, in agree-ment with previous observations of gravity currents(Wakimoto 1982). The large pressure change is accom-panied by a temperature drop of 7°C, between 0400 and0500 UTC. This drop in temperature, accompanied bypressure and wind speed increase, indicates that thedisturbance was a strong gravity current at this time.
It is suggested that the gravity current arrived at Her-mosillo after 0400 UTC, when the large temperature
drop is measured. The timing of the gravity currentpassage at Hermosillo (at most 35 min prior to thebore’s arrival at Bahia Kino) suggests that the bore hadalready been generated before the gravity currentpassed Hermosillo, and was not observed at Hermosillobecause of the hourly resolution of the data. It is likelythat it is the propagation of this gravity current into thestable layer present at Bahia Kino (which is likely toalso be present in the surrounding regions) that gener-ated an atmospheric internal undular bore. This mecha-nism, rather than the collision between the sea breezeitself and the gravity current is plausible for bore for-mation as the structure of the sea-breeze front wouldhave been significantly weaker during late evening localtime.
No observations are available between the MCS andHermosillo or between Hermosillo and Bahia Kino sowe cannot ascertain the exact formation time of thebore or observe the processes involved in generatingthe bore from the gravity current. The low-level cloudfeature is initially evident in the satellite at 0230 UTC,but the bore may have formed sooner and not devel-oped clouds until this time, or the cloud feature mayinitially have been associated with the edge of the grav-ity current.
e. Theoretical aspects
Satellite and surface observations were used to de-termine the speed of the bore to be 16.8 � 1 m s�1,which adjusted for the headwind into which the bore is
FIG. 6. One-hour resolution observations from the surface meteorological station at Her-mosillo, 31 Jul 2004: (a) pressure anomaly (green) (hPa), temperature (red) (°C), and dew-point temperature (blue) (°C) and (b) wind speed (dotted) (m s�1) and wind direction (solid).
4158 M O N T H L Y W E A T H E R R E V I E W VOLUME 136
Fig 6 live 4/C
propagating becomes an actual bore speed Cb � 21.8 �1 m s�1. For a bore advancing into a fluid that is at rest,the theoretical speed of a bore in this frame of refer-ence is found using hydraulic theory and conservationof mass and momentum (Rottman and Simpson 1989),yielding
Cb2
Cgw2 �
12
h1
h0�1 �
h1
h0�,
where h1 is the depth of the bore, h0 is the depth of theprebore stable layer, and C2
gw � g�h0 is the speed of along gravity wave (with g� � g�� /� the reduced grav-ity). The theoretical speed of a bore is faster than thatof linear waves on fluid of depth h0, because the fluidfollowing the bore is moving in the same direction (inthis reference frame).
The depth of the prebore stable layer at Bahia Kino(h0) was determined to be 400 m at 0400 UTC from theRASS profiler virtual temperature data (not shown)just prior to it being switched off. As the wind profilerwas the only instrument to measure the vertical struc-ture of the bore itself, the depth of the bore (h1) proveddifficult to evaluate. A combination of the averagedepth of the two enhanced SNR layers (Fig. 3a) and thedepth of the enhanced spectral width region (Fig. 3c)were used to estimate h1 as approximately 1500 m. Us-ing the classification system of Rottman and Simpson(1989), who determine the strength of a bore, S, to bethe ratio between the bore depth and the prebore stablelayer depth (h1/h0) we find for the bore at Bahia Kino,S � 3.8. This classifies the bore as type B, a smoothundular bore but with some mixing, due to shear insta-bility, on the downstream face of the first undulation.This classification fits well with the surface observationsat Bahia Kino (Fig. 5), where we see warmer drier airmixed down to the surface from above the bore on thedownstream face of the first undulation. This mixingalso coincides with the enhanced spectral width inFig. 3c.
Using these observational values along with the re-duced gravity determined from the 0000 UTC sound-ing, we obtain a theoretical bore speed of Cb � 21.5m s�1, which compares well with the observed borespeed, taking into account the adjustment for the head-wind. We must, however, note the limitations to thesimple hydraulic theory of Rottman and Simpson(1989) for determining the speed of a bore. This theoryassumes that fluid mixing and interfacial stress betweenthe two layers are negligible, which is likely not the casein the event studied here where the profiler data indi-cate turbulence and intermittent mixing.
f. Trapping mechanisms
To produce a wavelike disturbance with a large am-plitude near the ground, such as a bore, it is necessaryto restrict the radiation of energy upward, which con-siderably reduces the amplitude of the disturbance. Fig-ure 4 showed that the environment at Bahia Kino at0000 UTC consisted of a low-level stable layer cappedby a near-neutral layer, which is known to inhibit thevertical propagation of energy (Crook 1986) by creatinga wave duct. To investigate the possibility that a wave-ducting mechanism was involved in maintaining thebore’s longevity, the Scorer parameter was determinedfrom the 0000 UTC sounding at Bahia Kino. Bores canbe trapped and maintained in regions where the Scorerparameter l2 decreases with height, where
l2 �N2
�U � Cb2 ��2U��z2
U � Cb.
The first term measures the effects of static stability,where N2 is the Brunt–Väisälä frequency, U is the windspeed in the direction of motion of the bore, and Cb isthe speed of the bore. The second term measures theeffects of wind profile curvature.
The components of the Scorer parameter [(Fig. 7a)bore relative wind and (Fig. 7b) Brunt–Väisälä fre-quency], the Scorer parameter itself (Fig. 7c), and thestability and curvature terms of the Scorer parameter(Fig. 7d) are shown. The bore relative wind wassmoothed in order to filter small-scale variations in thewind speed profile that lead to rapid fluctuations in theScorer parameter.
It is seen in Fig. 7c that there are two layers where theScorer parameter decreases rapidly with height. Thefirst layer, below 0.5 km, is associated with the small-scale fluctuations in the curvature of the wind profile(Fig. 7a) close to the surface. It is unlikely that waveenergy is being trapped at this level, as this is the depthof the stable layer that the bore is propagating along.The second layer is at 6 km and is associated with theincrease in stability at this level because of the elevatedstable layer evident in the 0000 UTC sounding (Fig.7b). In most previous studies of atmospheric bores thathave analyzed the Scorer parameter with respect towave trapping, it has been the curvature term that hasbeen the dominant contributor to the decrease in heightof the Scorer parameter due to the presence of a low-level jet in the region. In this case, there is no low-leveljet (Fig. 7a) and it appears to be the stability of theatmosphere that is trapping the wave energy below 6km. There is a small region of decreasing Scorer pa-rameter with height at 3 km, due to slight curvature of
NOVEMBER 2008 M A R T I N A N D J O H N S O N 4159
the wind profile that may also be contributing to wavetrapping.
Evidence from the wind profiler (Fig. 3), indicatesthat the strongest vertical velocities are trapped at lowlevels (approximately at 1.5 km). However, as the maxi-mum height of reliable profiler measurements on thisday is close to 3 km, it cannot be determined whetherthe elevated stable layer at 6 km, which is causing theScorer parameter to decrease with height, is trappingthe wave energy associated with the bore below thislevel, or whether the vertical motion associated withthe bore extends above 6 km. The full vertical extent ofatmospheric bores has not been presented in previousstudies of bores, and it is unknown whether verticalmotion associated with a bore’s undular nature extendsabove the depth of the stable layer increase (h1).
5. Numerical model results
While the observations from NAME 2004 providedan unprecedented look at the structure and mecha-nisms involved in the atmospheric bore on 31 July 2004,
the observations were still relatively sparse and certainphysical characteristics of the bore could not be deter-mined. Also, the effect of the bore on its environmentcould not be determined due to the temporal resolutionof the observations. The model simulation configuredas discussed in section 3 produced an atmospheric in-ternal bore with many similar characteristics to the ob-served bore.
a. Formation and evolution
The generation of a convective system, and more im-portantly an associated gravity current, was essential inthe generation of an atmospheric bore in this case. Dueto the initial conditions that forced the model, an up-per-level anticyclone developed as expected, leading toeasterly winds aloft across much of northwest Mexicoand afternoon low-level convergence along the westernslope of the SMO.
Convection developed along the SMO in the regionwith strongest onshore winds and largest virtual poten-tial temperature advected inland from the GoC. Con-vection that began to develop around 0100 UTC, was
FIG. 7. Vertical profiles derived from the 0000 UTC sounding at Bahia Kino: (a) smoothed bore relative wind(U � Cb), (b) Brunt–Väisälä frequency, (c) Scorer parameter, and (d) the curvature and stability terms of theScorer parameter.
4160 M O N T H L Y W E A T H E R R E V I E W VOLUME 136
most intense at 0200 UTC (50–55-dBZ reflectivitymaxima; Fig. 8a, left panel), and by 0400 UTC (Fig. 8c,left panel) the reflectivity associated with the convec-tive system had maintained a similar size but had re-duced in strength. The convective system propagatedsouthward and developed an arc-shaped line of weakreflectivity along its southern edge. This arc-shaped re-flectivity feature propagated southward and away fromthe dissipating convection and remained a prominentfeature even when the convection almost completelydissipated at 0600 UTC (Fig. 8d, left panel).
From the reflectivity alone it cannot be determined ifthis feature is an atmospheric bore, but the horizontaldivergence at the first model level (Fig. 8, right panels)clearly indicates a large arc-shaped feature consisting ofregions of alternating convergence and divergence con-sistent with an undular atmospheric bore. The conver-gence/divergence couplets associated with the undularnature of the bore were captured at the highest modelresolution (2 km) in domain 3 but not in domain 2 (6km), where only the convergent leading edge of thefeature was captured.
It is evident from Figs. 8a,b that the atmospheric borethat developed was generated by a gravity current thatdeveloped from the convective system, and is distin-guished by an intense, narrow region of convergencesurrounding the western side of the surface divergencefrom the convective system. By 0400 UTC (Fig. 8c) thegravity current formed an atmospheric bore, which isevident in the large increase in propagation speed ofthe boundary from 14 to 22 m s�1. The intense region ofconvergence that initially marked the edge of the grav-ity current and now marks the leading edge of the bore,propagated westward, and expanded in radius. By 0500UTC (Fig. 8d) the bore further expanded in radius andpropagated westward over the GoC. The convergencemarking the leading edge of the bore corresponds withthe enhanced reflectivity from the model, indicatinglight precipitation associated with the southern part ofthe bore’s leading edge. For purposes of brevity, thecentral part of the bore will be the primary focus offurther results.
The model sounding at 0300 UTC (Fig. 9), just priorto bore passage, shows ideal conditions for wave duct-ing and the propagation of an atmospheric bore, with astrong stable layer extending close to 900 hPa, and anear-neutral layer above capped by a region of higherstability. The near-surface structure is very similar tothe 0000 UTC sounding at Bahia Kino (Fig. 4), but thestable layer is 50 hPa deeper in the model by 0300 UTC.The structure of the winds (westerly within the stablelayer and easterly above) and the dry layer just above
the surface are seen in both the model sounding andobservations.
Results from the simulation (not shown) provide evi-dence that a deep sea breeze developed along the GoCby 0030 UTC and moved 30 km inland by 0130 UTC,supporting the hypothesis from the observations thatthe low-level stable layer at Bahia Kino developed dueto the sea breeze that formed along the GoC andmoved onshore.
At 0230 UTC the westward (downslope) movinggravity current produced by the convective system andseen in Fig. 8, and the eastward-moving sea breeze be-gan to interact and this led to an increase in stable layerdepth (not shown). At this point the gravity currentevolved into a modified gravity current (Locatelli et al.1998), which had features of both bores and gravitycurrents, with evidence of undulations atop the gravitycurrent in the potential temperature field. These undu-lations did not propagate away from the gravity currentto become a bore or sequence of solitary waves at thistime possibly due to the strength of the sea-breeze-induced stable layer being too weak to sustain propa-gation along it. However, this feature developed into anatmospheric bore by 0315 UTC.
b. Structure and features
A vertical cross section of potential temperature andrelative humidity at 0400 UTC is shown in Fig. 10. Atthis time the bore exhibited a sharp gradient in � at itsleading edge as the prebore stable layer was rapidlyelevated. Three significant undulations and a sugges-tion of two weaker undulations are seen, consistentwith the profiler observations of the bore at Bahia Kino(Fig. 3). The stable layer remained elevated due to thebore for 70 km behind its leading edge.
Within each undulation (at approximately 1 km) wesee regions of high relative humidity, with values closeto 100% in the first undulation and 80% in subsequentundulations. This humidity enhancement over back-ground values (40%–50% at this level) is due to moisterair close to the surface of the GoC being elevated bythe vertical motions associated with the bore. The mois-ture is lifted successively higher with each undulation.
The high humidity values associated with the firstundulation of the bore corresponded to the lower oftwo regions where the model produced cloud. Whilethe cloud mixing ratios are small (0.5–1.5 g kg�1) inboth layers, the cloud-top heights (4.2 and 2.0 km),depths (1.2 and 0.8 km) for each layer, respectively, andcloud-top temperatures in the model are consistentwith the observations from the satellite imagery.
The vertical motion associated with the bore at 0400UTC is shown in Fig. 11. Four vertical velocity (w)
NOVEMBER 2008 M A R T I N A N D J O H N S O N 4161
FIG. 8. (left) The simulated reflectivity (dBZ ) for domain 2 and (right) horizontal divergence at thefirst model level (97 m) for domain 3 for (a) 0200, (b) 0300, (c) 0400, and (d) 0500 UTC. The black linein (d) indicates location of cross sections, and the red X the location of the model sounding. The box in(a) (left) shows the location of domain 3. The Mexican coastline is shown for reference in (a)–(d).
4162 M O N T H L Y W E A T H E R R E V I E W VOLUME 136
Fig 8 live 4/C
couplets with widths similar to those observed arepresent below 5 km, associated with the undulations inpotential temperature seen in Fig. 10. The first w cou-plet is the strongest with magnitudes between 4 and 5m s�1, equal to those seen in the profiler data (Fig. 3b).The maximum w in the first couplet is 1.5 km higherthan seen in the wind profiler data; possibly due to thelocation and time of the cross section (the bore has anonuniform structure along its length as seen in Fig. 8).The succeeding w couplets have decreasing magnitudeand depth with each subsequent undulation, as seen inthe profiler data. The good agreement between thesimulation and observations of the vertical structure ofw gives us confidence in analyzing the bore’s verticalstructure in the simulation.
Several features of the observed bore were well rep-resented in the simulation, including the wavelength ofthe bore’s undulations and several features not shown:the rapid increase in surface pressure associated withthe leading edge of the bore, the elevation of the pres-sure for several hours after the bore’s passage, and littlechange in the surface temperature associated with thebore passage.
The speed of the simulated bore was found to be veryclose to that calculated from the observations. Whennot accounting for the headwind (which was also simi-lar in the observations and simulation) the averagesimulated bore speed throughout the bore’s lifetimewas 15.6 m s�1. We can determine from the model out-put that the bore propagated faster in its initial stages,and slowed as it propagated across the GoC and beganto dissipate.
c. Maintenance
Observations suggest that wave trapping by the el-evated stable layer at 6 km (and possible wave trappingat lower levels) prevented the upward propagation ofwave energy associated with the bore, leading to alarge-amplitude wavelike disturbance at low levels. Themodel sounding, however, did not fully capture thestrength and intensity of this elevated stable layer (Fig.9), likely due to the vertical resolution within themodel. Despite this, the model still produced a borewith a large amplitude at low levels (as seen in Fig. 11),suggesting that even with a weaker elevated stable layer
FIG. 9. Model sounding and hodograph at location X (see Fig. 8d) at 0300 UTC.
NOVEMBER 2008 M A R T I N A N D J O H N S O N 4163
Fig 9 live 4/C
at 6 km than seen in the observations, wave trappingcan occur.
In Fig. 11 we see that while w (and hence the bore) isstrongest close to the surface (between 1 and 3 km),
vertical motions associated with the bore are evident upto 12 km where a secondary maximum is present. Thesecondary maximum consists of a region of downwardmotion (3 m s�1 maximum) followed by a region of
FIG. 11. Model cross section at 0400 UTC of vertical velocity (cm s�1) from 0 to 20 km. Dashed lines indicate enhanced domain on right.
FIG. 10. Model cross section at 0400 UTC of potential temperature (K) (solid contours)and relative humidity (shaded above 70%) from 0 to 5 km.
4164 M O N T H L Y W E A T H E R R E V I E W VOLUME 136
Fig 11 live 4/C
upward motion (4 m s�1 maximum). The ascent in thefirst velocity couplet associated with the leading edge ofthe bore is trapped below the region of elevated stabil-ity, whereas the subsequent w maxima are not. Thissuggests that the bore itself modified the region of el-evated stability, preventing trapping of wave energy atlow levels. There is little to no tilt in w in the vertical,suggesting that the wave energy behind the leadingedge of the bore is still being trapped, but not at lowlevels as expected from previous studies of bores.
No other studies have looked at the effect of bores atsuch a high level in the atmosphere. However, it cannotbe said with certainty that the model simulation is acompletely accurate portrayal of the observed bore.Despite the model simulating many aspects of the boreextremely well, it did not correctly reproduce the ver-tical structure of the environment. The lack of a strongelevated stable layer in the model soundings may haveplayed an important role in the wave trapping mecha-nisms. It is suggested that if a strong elevated stablelayer was present, the secondary maximum in verticalvelocity at 12 km would not have been present as waveenergy would have been confined to lower levels.Model simulations suggest a low-level (above theheight of the bore itself) trapping mechanism is not anessential feature for the maintenance of an atmosphericbore.
d. Effects
The effect of the bore on the environment after itsdissipation can be seen in Fig. 12, which shows the rela-tive humidity of the lower atmosphere in the GoCbefore and after bore passage. Prior to the bore, at
0100 UTC (Fig. 12a) the environment is characterizedby a shallow moist layer in the GoC, a dry layer up to2 km and increased moisture (40%–90% relative hu-midity) up to 5 km. The large relative humidities overthe SMO are due to the convective system, which hasalready developed at this time. After the bore propa-gated across the GoC and dissipated, a large increase inrelative humidity at the lowest levels and the midlevelsis seen across the domain. At midlevels (2–5 km) rela-tive humidity increases of 20%–40% are apparent, dueto the easterly steering flow at this level advecting mois-ture from the convective system across the GoC. At lowlevels in the GoC we see that moisture has increased inthe lowest 1 km, particularly in the western GoC, at-tributed to the propagation of the bore through thisregion, providing evidence that the bore has acted as amoisture transport mechanism in this region.
6. Discussion and conclusions
Using wind profiler data from the NAME, which oc-curred in the summer of 2004, an atmospheric internalbore was identified along the northwestern coast ofMexico. The bore was found, in a broad sense, to besimilar to those in two other regions of the world wherebores have been associated with sea breezes: 1) overnorthern Australia generated by the collision of seabreezes, and 2) over southern Florida where bores havebeen observed to be created by collisions between seabreezes and gust fronts. Some of the features of thebore that were consistent with previous studies of at-mospheric internal bores around the world are as fol-lows:
FIG. 12. Model cross section of relative humidity at (a) 0100 and (b) 0700 UTC.
NOVEMBER 2008 M A R T I N A N D J O H N S O N 4165
• A rapid rise in the depth of the stable layer and sur-face pressure was observed and was maintained forseveral hours after the passage of the bore.
• The bore propagated westward, across the GoC at21.8 m s�1 (accounting for an environmental head-wind).
• Three undulations were identified atop the bore, as-sociated with vertical velocities up to 4–5 m s�1.
• Little change in surface temperature and humidityaccompanied the bore, except for the slight increasein temperature and rapid decrease in dewpoint tem-perature associated with turbulence resulting fromshear instability on the downstream face of the firstbore undulation.
One important feature of the bore that differed fromprevious studies was the wave trapping mechanism,identified using the Scorer parameter. The Scorer pa-rameter decreased rapidly with height at 6 km, becauseof the presence of an elevated stable layer, suggestingthat wave ducting would occur below this height. Re-gions of decreasing Scorer parameter with height wereobserved below 6 km, with the most significant de-crease at 0.5 km, at the approximate depth of the pre-bore inversion. The majority of previous studies havefound the wave-trapping mechanism is due to curvaturein the wind profile due to the presence of a low-level jet(Fulton et al. 1990; Karyampudi et al. 1995; Koch andClark 1999; Koch et al. 2005). Results from this studysuggest that the ability of an elevated stable layer totrap the wave energy of a bore is of importance, as itdistinguishes this region from other regions wherebores have been observed to form (i.e., in the GreatPlains).
The bore was generated when a MCS that developedon the slopes of the SMO produced a gravity currentalong its western edge that propagated westward andaway from its parent system. This gravity current inter-acted with a preexisting stable layer that had been gen-erated from the sea breeze on the western coast of theGulf of California.
The observations of the bore were compared withpreviously developed theories of atmospheric internalbores. The theoretical bore speed, developed by Rott-man and Simpson (1989) was found to be in agreementwith the observed bore speed, assuming a bore depth of1500 m and a bore strength of 3.8 (a type B bore),consistent with the observations at Bahia Kino.
To further investigate the bore that was observed atBahia Kino, and determine the ability of the AdvancedResearch WRF model to simulate atmospheric internalbores, a real data simulation was performed using theWRF model. The WRF model simulated both the for-
mation mechanism (including the development of anMCS and subsequent gravity current) and structure ofthe bore correctly, a unique aspect of this study.
One feature of the simulated bore that was not inagreement with the observations was the lack of a low-level wave-trapping mechanism behind the leadingedge of the bore. The vertical velocity field extendedthrough the entire troposphere, with little tilt in thevertical, indicative of a trapping mechanism at the up-per levels. Only a weak layer of elevated stability closeto 6 km was identified in the model soundings, close tothe region of bore formation. This elevated stabilityappeared to play a role in the initial trapping of thebore’s energy, but was modified by the passage of thebore, which allowed wave energy to propagate throughthe troposphere.
The results of the WRF simulation provided insightinto mechanisms that were not seen in the observations,particularly the dissipation mechanism and the effect ofthe bore on the atmosphere. The bore was shown tohave increased moisture in the lowest 1 km across theGoC, providing evidence that bores are an importantmoisture transport mechanism in this region.
Acknowledgments. This research has been supportedby the National Science Foundation Mesoscale Dy-namic Meteorology Program under Grant ATM-0340602, and the National Oceanic and AtmosphericAdministration Office of Global Programs under GrantNA17RJ1228. Computing resources were provided bythe National Center for Atmospheric Research which issponsored by the National Science Foundation. Thecomments of two anonymous reviewers are appreci-ated. Special thanks go to Paul Ciesielski for his assis-tance throughout this project.
REFERENCES
Badan-Dangon, A., C. E. Dorman, M. A. Merrield, and C. D.Winant, 1991: The lower atmosphere over the Gulf of Cali-fornia. J. Geophys. Res., 96, 877–896.
Carbone, R. E., J. W. Conway, N. A. Crook, and M. W. Mon-crieff, 1990: The generation and propagation of a nocturnalsquall line. Part I: Observations and implications for meso-scale predictability. Mon. Wea. Rev., 118, 26–49.
Clarke, R. H., 1984: Colliding sea-breezes and the creation of in-ternal atmospheric bore waves: Two-dimensional numericalstudies. Aust. Meteor. Mag., 32, 207–226.
——, R. K. Smith, and D. G. Reid, 1981: The Morning Glory ofthe Gulf of Carpentaria: An atmospheric undular bore. Mon.Wea. Rev., 109, 1726–1750.
Crook, N. A., 1986: The effect of ambient stratification and mois-ture on the motion of atmospheric undular bores. J. Atmos.Sci., 43, 171–181.
Demoz, B. B., and Coauthors, 2005: The cold front of 15 April
4166 M O N T H L Y W E A T H E R R E V I E W VOLUME 136
1994 over the central United States. Part I: Observations.Mon. Wea. Rev., 133, 1525–1543.
Douglas, M. W., R. A. Maddox, K. Howard, and S. Reyes, 1993:The Mexican monsoon. J. Climate, 6, 1665–1677.
Doviak, R. J., and R. Ge, 1984: An atmospheric solitary gust ob-served with a Doppler radar, a tall tower, and a surface net-work. J. Atmos. Sci., 41, 2559–2573.
Fulton, R., D. S. Zrnic, and R. J. Doviak, 1990: Initiation of asolitary wave family in the demise of a nocturnal thunder-storm density current. J. Atmos. Sci., 47, 319–337.
Haase, S. P., and R. K. Smith, 1984: Morning glory wave clouds inOklahoma: A case study. Mon. Wea. Rev., 112, 2078–2089.
Higgins, R. W., Y. Yao, and X. L. Wang, 1997: Influence of theNorth American monsoon system on the U.S. summer pre-cipitation regime. J. Climate, 10, 2600–2622.
——, and Coauthors, 2003: Progress in Pan American CLIVARresearch: The North American monsoon system. Atmósfera,16, 29–65.
——, and Coauthors, 2006: The NAME 2004 field campaign andmodeling strategy. Bull. Amer. Meteor. Soc., 87, 79–94.
Johnson, R. H., P. E. Ciesielski, B. D. McNoldy, P. J. Rogers, andR. K. Taft, 2007: Multiscale variability of the flow during theNorth American Monsoon Experiment. J. Climate, 20, 1628–1648.
Karyampudi, V. M., S. E. Koch, C. Chen, J. W. Rottman, andM. L. Kaplan, 1995: The influence of the Rocky Mountainson the 13–14 April 1986 severe weather outbreak. Part II:Evolution of a prefrontal bore and its role in triggering asquall line. Mon. Wea. Rev., 123, 1423–1446.
Kingsmill, D. E., and N. A. Crook, 2003: An observational studyof atmospheric bore formation from colliding density cur-rents. Mon. Wea. Rev., 131, 2985–3002.
Knupp, K., 2006: Observational analysis of a gust front to bore tosolitary wave transition within an evolving nocturnal bound-ary layer. J. Atmos. Sci., 63, 2016–2035.
Koch, S. E., and W. Clark, 1999: A nonclassical cold front ob-served during COPS-91: Frontal structure and the process ofsevere storm initiation. J. Atmos. Sci., 56, 2862–2890.
——, P. B. Dorian, R. Ferrare, S. H. Mel, W. C. Skillman, and D.Whiteman, 1991: Structure of an internal bore and dissipatinggravity current as revealed by raman lidar. Mon. Wea. Rev.,119, 857–887.
——, M. Pagowski, J. W. Wilson, F. Fabry, C. Flamant, W. Feltz,G. Schwemmer, and B. Geerts, 2005: The structure and dy-namics of atmospheric bores and solitons as determined fromremote sensing and modeling experiments during IHOP. Pre-prints, 32nd Conf. on Radar Meteorology/11th Conf. on Me-soscale Processes, Albuquerque, NM, Amer. Meteor. Soc.,JP6J.4.
Krishnamurti, T. N., 1971: Tropical east-west circulations duringthe northern summer. J. Atmos. Sci., 28, 1342–1347.
Locatelli, J. D., M. T. Stoelinga, P. V. Hobbs, and J. Johnson,1998: Structure and evolution of an undular bore on the highplains and its effects on migrating birds. Bull. Amer. Meteor.Soc., 79, 1043–1060.
Mahapatra, P. R., R. J. Doviak, and D. S. Zrnic, 1991: Multisensorobservation of an atmospheric undular bore. Bull. Amer. Me-teor. Soc., 72, 1468–1480.
Noonan, J. A., and R. K. Smith, 1987: The generation of NorthAustralian cloud lines and the “morning glory.” Aust. Meteor.Mag., 35, 31–45.
Rogers, P. J., and R. H. Johnson, 2007: Analysis of the 13–14 JulyGulf Surge event during the 2004 North American MonsoonExperiment. Mon. Wea. Rev., 135, 3098–3117.
Rottman, J. W., and J. E. Simpson, 1989: The formation of inter-nal bores in the atmosphere: A laboratory model. Quart. J.Roy. Meteor. Soc., 115, 941–963.
Shreffler, J. H., and F. S. Binkowski, 1981: Observations of pres-sure jump lines in the Midwest, 10–12 August 1976. Mon.Wea. Rev., 109, 1713–1725.
Smith, R. K., M. J. Reeder, N. J. Tapper, and D. R. Christie, 1995:Central Australia cold fronts. Mon. Wea. Rev., 123, 16–38.
Tang, M., and E. R. Reiter, 1984: Plateau monsoons of the North-ern Hemisphere: A comparison between North America andTibet. Mon. Wea. Rev., 112, 617–637.
Wakimoto, R. M., 1982: The life cycle of thunderstorm gust frontsas viewed with Doppler radar and rawinsonde data. Mon.Wea. Rev., 110, 1060–1082.
——, and D. E. Kingsmill, 1995: Structure of an atmospheric un-dular bore generated from colliding boundaries duringCAPE. Mon. Wea. Rev., 123, 1374–1393.
Xu, J., X. Gao, J. Shuttleworth, S. Sorooshian, and E. Small, 2004:Model climatology of the North American monsoon onsetperiod during 1980–2001. J. Climate, 17, 3892–3906.
NOVEMBER 2008 M A R T I N A N D J O H N S O N 4167