Bangladesh J. Agric. Econs, 1 & 2(2002) 39-55 AN OPTIMAL CROPPING PLAN FOR FARMERS IN A SHALLOW TUBEWELL IRRIGATED AREA IN BANGLADESH F I M Golam Wahed Sarker John Lingard ABSTRACT This study was undertaken in an area of Bangladesh to assess the impact of minor irrigation on different farm sizes and determines the optimum allocation of resources of large and small farmers among different crops in a shallow tubewell (STW) irrigation system. Farm survey method was used to collect data in order to develop linear programming representative farm models. The analysis takes into account crop activities, inputs used, farm size and soil types. Optimal plans show mis-allocation of existing resources and indicated considerable scope for increasing farm income by reallocation of existing resources. The mis-allocation of resources on large farms was greater than on small farms. The analysis suggests that, by reallocating existing resources, large farms can increase farm income and employment more significantly than small farms. The research supports the view that the government should maintain a policy that favours private sector investment and operation of STW irrigation and the extension workers may direct farmers to allocate their resources in better way. I. INTRODUCTION Agriculture is the major component of the GDP of Bangladesh though its share is decreasing. The crop sub-sector (especially food crops) contributes 73% of total agricultural output. Agriculture is dominated by traditional farming with small, fragmented, scattered holdings and low productivity. Since the mid-sixties the government has promoted the introduction of 'green revolution technologies' (seed-fertiliser-irrigation) to increase yields. Irrigation is considered the 'leading input' in the green revolution technology and is the prime mover of growth for Bangladesh agriculture. The rapid growth in irrigation, especially minor irrigation, made it possible for Bangladesh to make a progressive shift from a high-risk monsoon dependent agriculture and increase crop yields, farm income and employment. Minor irrigation technologies in Bangladesh comprise low lift pumps (LLPs), deep tubewells (DTWs), shallow tubewells (STWs) and manually operated pumps (MOPs) (IIMI, 1995). Since 1973 the area under irrigation has expanded from 0.5 million hectares to 3.7 million hectares in 1997. Over 90% of this area is irrigated by various modes of minor irrigation and about 10% by major surface water canal schemes (FAO, 1997). Almost 60% of the area under minor irrigation is irrigated by STWs with 32% divided more or less equally between LLPs and DTWs, and the remaining 8% irrigated by manually operated pumps. Most The author is a Senior Scientific Officer (Ag. Econ.), Irrigation and Water Management Division, Bangladesh Rice Research Institute, Gazipur - 1701. Bangladesh and Professor, Department of Agricultural Economics and Food Marketing, University of Newcastle upon Tyne, NE 1, 7 RU, UK, respectively. (Part of M Phil Thesis.)
Transcript
Bangladesh J. Agric. Econs, 1 & 2(2002) 39-55
AN OPTIMAL CROPPING PLAN FOR FARMERS IN A SHALLOW TUBEWELL IRRIGATED AREA IN BANGLADESH
F I M Golam Wahed Sarker
John Lingard
ABSTRACT
This study was undertaken in an area of Bangladesh to assess the impact of minor irrigation on different farm sizes and determines the optimum allocation of resources of large and small farmers among different crops in a shallow tubewell (STW) irrigation system. Farm survey method was used to collect data in order to develop linear programming representative farm models. The analysis takes into account crop activities, inputs used, farm size and soil types. Optimal plans show mis-allocation of existing resources and indicated considerable scope for increasing farm income by reallocation of existing resources. The mis-allocation of resources on large farms was greater than on small farms. The analysis suggests that, by reallocating existing resources, large farms can increase farm income and employment more significantly than small farms. The research supports the view that the government should maintain a policy that favours private sector investment and operation of STW irrigation and the extension workers may direct farmers to allocate their resources in better way.
I. INTRODUCTION Agriculture is the major component of the GDP of Bangladesh though its share is decreasing. The crop sub-sector (especially food crops) contributes 73% of total agricultural output. Agriculture is dominated by traditional farming with small, fragmented, scattered holdings and low productivity. Since the mid-sixties the government has promoted the introduction of 'green revolution technologies' (seed-fertiliser-irrigation) to increase yields. Irrigation is considered the 'leading input' in the green revolution technology and is the prime mover of growth for Bangladesh agriculture. The rapid growth in irrigation, especially minor irrigation, made it possible for Bangladesh to make a progressive shift from a high-risk monsoon dependent agriculture and increase crop yields, farm income and employment. Minor irrigation technologies in Bangladesh comprise low lift pumps (LLPs), deep tubewells (DTWs), shallow tubewells (STWs) and manually operated pumps (MOPs) (IIMI, 1995). Since 1973 the area under irrigation has expanded from 0.5 million hectares to 3.7 million hectares in 1997. Over 90% of this area is irrigated by various modes of minor irrigation and about 10% by major surface water canal schemes (FAO, 1997). Almost 60% of the area under minor irrigation is irrigated by STWs with 32% divided more or less equally between LLPs and DTWs, and the remaining 8% irrigated by manually operated pumps. Most The author is a Senior Scientific Officer (Ag. Econ.), Irrigation and Water Management Division, Bangladesh Rice Research Institute, Gazipur - 1701. Bangladesh and Professor, Department of Agricultural Economics and Food Marketing, University of Newcastle upon Tyne, NE 1, 7 RU, UK, respectively. (Part of M Phil Thesis.)
40 The Bangladesh Journal of Agricultural Economics of the growth in the irrigated area can be attributed to STWs and the area irrigated by STWs has increased over five times since 1982 compared to around two times for LLP, DTW and canal irrigation and a decline in the area irrigated manually. One of the government's main objectives for irrigation development is "to ensure equitable distribution of benefits and poverty alleviation" (GOB, 1998). The effects of irrigation development on different farm sizes are one important consideration. With rapid expansion of minor irrigation, there has been concern as to who gained access to the benefits of this technology. Empirical studies show that irrigation technologies have increased agricultural productivity and employment, but the benefits have accrued disproportionately and more rapidly to the relatively rich. The study will examine the effects of minor irrigation (STWs) on farm sizes and their cropping patterns, agricultural productivity, farm income and employment. It is felt that under the existing technology, sufficient potential exists for improving agricultural production and augmenting farm returns by reallocation of the existing resources. An optimum combination of crop enterprises will lead to efficient use of land and other resources, and thereby increase the income of farmers. This study makes an attempt to examine the land use pattern for farmers in STW area and develop optimal plans considering their available resources. The study will provide information to planners, government, extension workers and farmers regarding the optimal cropping plans of large and small farmers. The main objective of the study is to develop efficient farm plans for an average large and small farm in the STW irrigated system in Shibganj Upazila of Bogra district. The objectives are: i) To develop representative farm level models to assess the optimum allocation of the available resources of small and large farmers among different crops in a STW irrigation system; and ii) To provide planning guidelines for better utilisation of available farm resources.
II. METHODOLOGY
(a) Sampling Technique: A group of farmers from 10 shallow tubewells (2 from each block) from 5 agricultural blocks of Shibganj Upazila of Bogra district were chosen randomly. The area is situated about 20 kilometers north of Bogra town on the Bogra - Rangpur highway. All farms in the study area were listed according to their land holdings to identify farm size. Selection of sample farms in each of the block by land distribution is shown in Table 1.
An optimal cropping plan for farmers 45
III. RESULTS AND DISCUSSION
A. Resource Utilisation
(a) Land Utilisation: Optimisation and reallocation of available resources bring significant changes to the existing land use pattern (Table 2). The crop HYV boro found prime place on the medium land on the large and small farms, which accounted for 38% and 39% of the total cropped areas respectively. The next dominant crop was Transplanted (T) aman on the medium land, which occupied about 37% and 39% on both types of farms. The optimum plan increased medium aman land (2% on large and 4% on small farms) than the existing plans and full utilisation of other types of land. Banana was the dominant crop on high non-rice land, which accounted for 4% and 3% of the total cropped area on large and small farms. Model results show that the area under banana increased approximately twice over the existing land allocation on the high non-rice land. In the medium non-rice land the area under potato increased by about 3% and 4% over the existing land allocation on large and small farms. About 78% and 80% land was under cereal production on large and small farms. Due to optimisation, the cropping intensity increased for both groups of farms compared to their existing plans. The cropping intensity increased to 222% and 218% in the optimal plans on large and small farms, compared to 205% and 212% in their existing plans (Table 2). This finding is similar to Alam (1994) who concluded that optimal plans can increase cropping intensity by 16% compare to the existing plan. Commercial crops such as banana and potato were important for all farms. (b) Labour Utilisation: The optimum plans indicate a transfer of land from low valued crops to high valued cash crops. The utilisation of human labour on different farms for the existing and optimal production plans in different months is presented in Tables 3 which reveals that total employment of labour increased 24% and 2% on large and small farms respectively compared to the existing situation. This was due to transfer of a land to banana, aus and T. aman (Table 2), which utilised more labour. Therefore, during January to March and June to December greater utilisation of labour was observed in the optimal plans. The optimum plan shows that on small farms, the availability of family labour was sufficient to meet all farming needs. However, large farmers hired greater numbers of labour (369 man-days) on daily wages to perform farming operations on time. Human labour hiring was observed in the months of February to May, July and November on large farms (Table 3). Family labour supply is scarce in these periods. February to May are months for HYV boro and rabi crops cultivation, which demand more labour for planting, intercultural operations like weeding and irrigating, and post harvest operations like cutting, threshing, cleaning and storing. February and November are peak labour demand months due to HYV boro transplanting and T. aman harvesting. The increase in the employment of labour in the optimal plans (24% for large farms and 2% for small farms) is very important finding in the context of the labour surplus economy of Bangladesh, where one government objective is to alleviate poverty and create new employment opportunities. Results of the analysis show that the increase of labour employment on irrigated farms was mostly derived from the changes in land use patterns and increased T. aman area (Table 2).
An optimal cropping plan for farmers 47 Table 3. Labour utilization (man-days) by large and small farms
Increase or Decrease Over Existing Plan Months Available Existing Plan Optimal Plan Man-days Percentage
Large Farm January 88 67.6 68.4 0.8 1.2 February 88 164.0 170.7 6.7 4.0 March 88 106.2 106.2 0 0 April 88 94.0 98.8 4.8 5.0 May 88 139.8 139.9 0.1 0 June 61.6 6.2 34.2 28.0 452.0 July 61.6 94.7 144.1 49.4 52.2 August 88 50.3 60.7 10.4 20.6 September 61.6 26.8 61.0 34.2 128.0 October 61.6 22.8 58.1 35.3 155.0 November 88 192.0 237.7 45.7 23.8 December 61.6 33.5 59.8 26.3 78.7 Total 924.0 998.0 1239.5 24L6 24.2
Small Farm January 34.3 14.2 14.4 0.20 1.4 February 34.3 29.7 31.6 1.9 6.4 March 34.3 23.3 25.3 2.0 8.6 April 34.3 26.0 16.4 -9.6 -37.0 May 34.3 37.0 36.7 -0.3 0 June 34.3 1.3 1.4 0.1 6.9 July 34.3 24.3 25.8 1.5 6.2 August 34.3 14.9 15.7 0.8 5.2 September 34.3 7.4 8.0 0.6 8.4 October 34.3 6.1 7.0 0.9 15.0 November 34.3 45.8 51.7 5.9 12.9 December 34.3 6.1 5.5 -0.6 -10.5 Total 411.6 236.2 239.7 3.5 1.5 Source: Sarker, 2000 (c) Bullock Utilisation: The utilisation of bullock time on different farm groups in different months is presented in Table 4. The optimal plans indicate that total bullock utilisation increased by 8% on large farms and 3% on small farms compared to their existing situation. This was due to increased area under T, aman which utilised more bullock time (Table 2). Therefore, during July greater utilisation of bullock time was noticed for land preparation in the optimal plans (Table 4). The optimum plans predict that for small farms, the availability of bullock time was sufficient to meet all farming needs. However, large farmers hired bullock time during January, July and November to perform land preparation operation for HYV boro, T. aman and potato on time (Table 4).
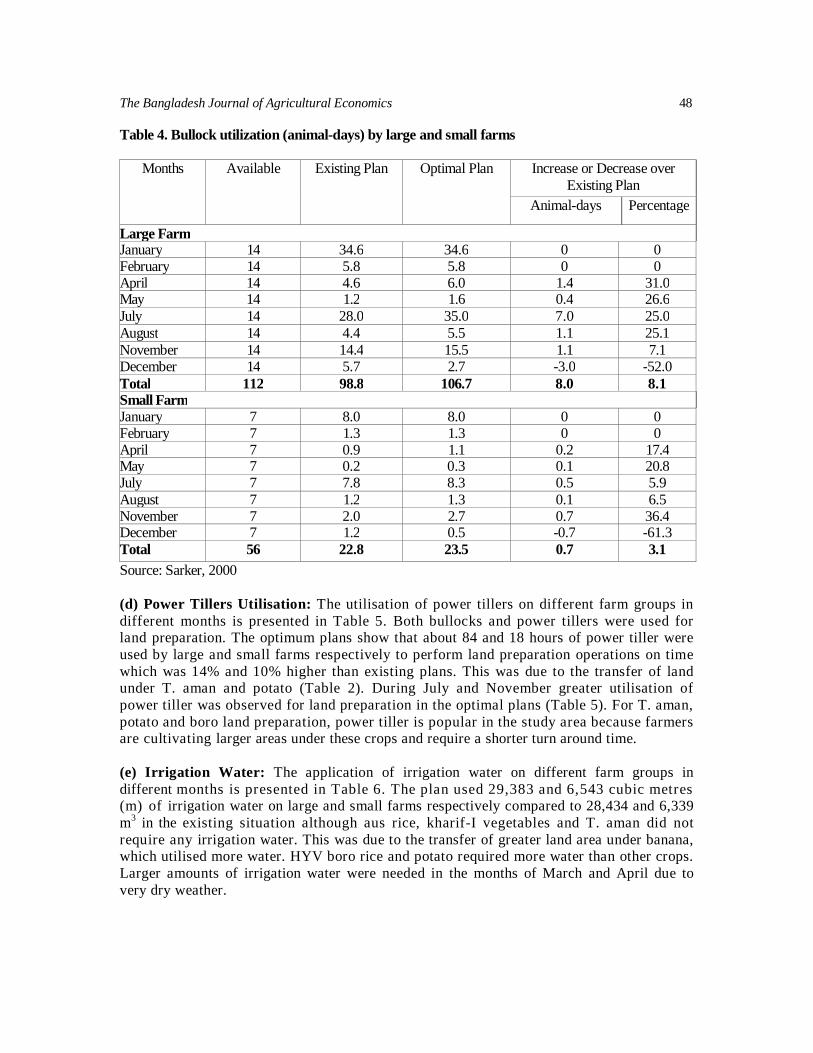
The Bangladesh Journal of Agricultural Economics 48 Table 4. Bullock utilization (animal-days) by large and small farms
Increase or Decrease over Existing Plan
Months Available Existing Plan Optimal Plan
Animal-days Percentage
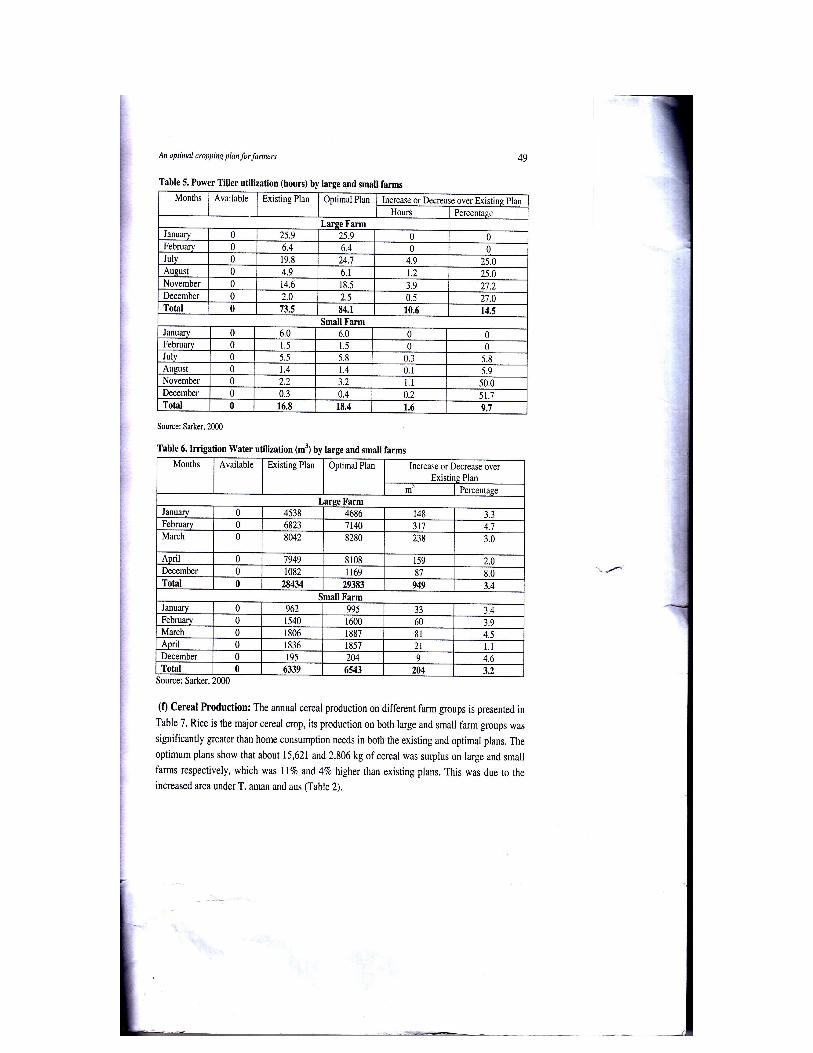
Large Farm January 14 34.6 34.6 0 0 February 14 5.8 5.8 0 0 April 14 4.6 6.0 1.4 31.0 May 14 1.2 1.6 0.4 26.6 July 14 28.0 35.0 7.0 25.0 August 14 4.4 5.5 1.1 25.1 November 14 14.4 15.5 1.1 7.1 December 14 5.7 2.7 -3.0 -52.0 Total 112 98.8 106.7 8.0 8.1 Small Farm January 7 8.0 8.0 0 0 February 7 1.3 1.3 0 0 April 7 0.9 1.1 0.2 17.4 May 7 0.2 0.3 0.1 20.8 July 7 7.8 8.3 0.5 5.9 August 7 1.2 1.3 0.1 6.5 November 7 2.0 2.7 0.7 36.4 December 7 1.2 0.5 -0.7 -61.3 Total 56 22.8 23.5 0.7 3.1 Source: Sarker, 2000 (d) Power Tillers Utilisation: The utilisation of power tillers on different farm groups in different months is presented in Table 5. Both bullocks and power tillers were used for land preparation. The optimum plans show that about 84 and 18 hours of power tiller were used by large and small farms respectively to perform land preparation operations on time which was 14% and 10% higher than existing plans. This was due to the transfer of land under T. aman and potato (Table 2). During July and November greater utilisation of power tiller was observed for land preparation in the optimal plans (Table 5). For T. aman, potato and boro land preparation, power tiller is popular in the study area because farmers are cultivating larger areas under these crops and require a shorter turn around time. (e) Irrigation Water: The application of irrigation water on different farm groups in different months is presented in Table 6. The plan used 29,383 and 6,543 cubic metres (m) of irrigation water on large and small farms respectively compared to 28,434 and 6,339 m3 in the existing situation although aus rice, kharif-I vegetables and T. aman did not require any irrigation water. This was due to the transfer of greater land area under banana, which utilised more water. HYV boro rice and potato required more water than other crops. Larger amounts of irrigation water were needed in the months of March and April due to very dry weather.
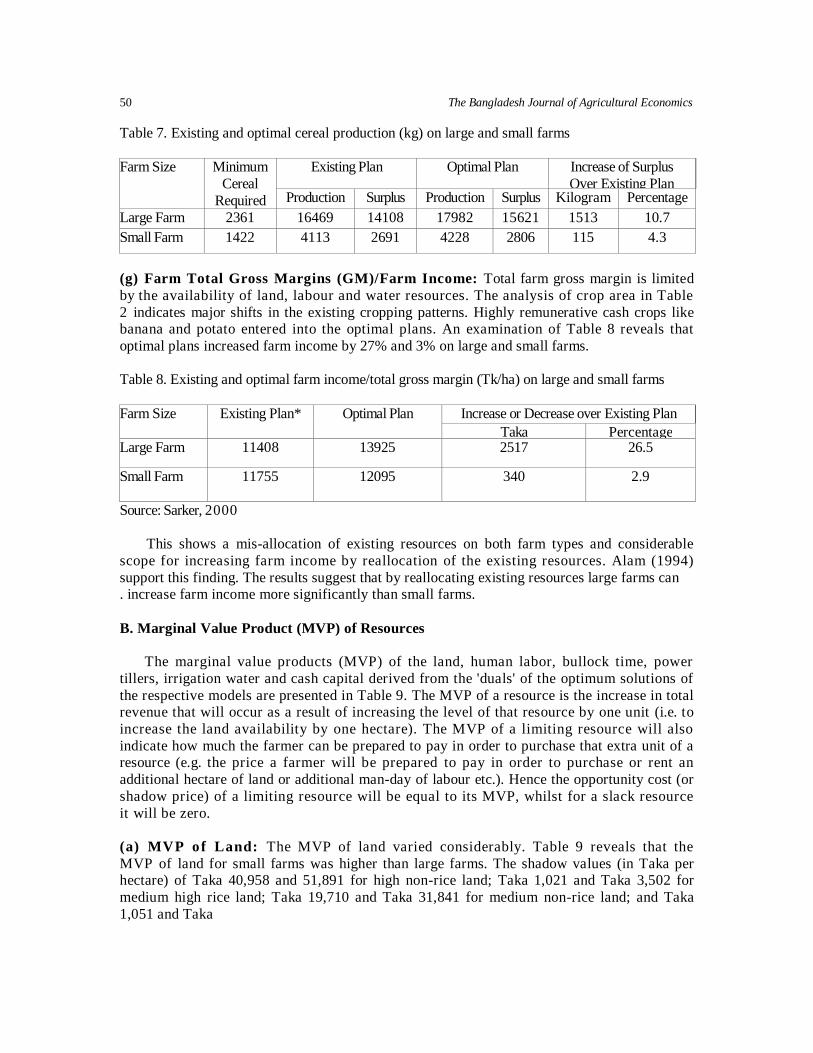
50 The Bangladesh Journal of Agricultural Economics Table 7. Existing and optimal cereal production (kg) on large and small farms
Existing Plan Optimal Plan Increase of Surplus Over Existing Plan
Farm Size Minimum Cereal
Required Production Surplus Production Surplus Kilogram Percentage Large Farm 2361 16469 14108 17982 15621 1513 10.7 Small Farm 1422 4113 2691 4228 2806 115 4.3
(g) Farm Total Gross Margins (GM)/Farm Income: Total farm gross margin is limited by the availability of land, labour and water resources. The analysis of crop area in Table 2 indicates major shifts in the existing cropping patterns. Highly remunerative cash crops like banana and potato entered into the optimal plans. An examination of Table 8 reveals that optimal plans increased farm income by 27% and 3% on large and small farms. Table 8. Existing and optimal farm income/total gross margin (Tk/ha) on large and small farms
Increase or Decrease over Existing Plan Farm Size Existing Plan* Optimal Plan Taka Percentage
Large Farm 11408 13925 2517 26.5
Small Farm 11755 12095 340 2.9
Source: Sarker, 2000 This shows a mis-allocation of existing resources on both farm types and considerable scope for increasing farm income by reallocation of the existing resources. Alam (1994) support this finding. The results suggest that by reallocating existing resources large farms can . increase farm income more significantly than small farms. B. Marginal Value Product (MVP) of Resources The marginal value products (MVP) of the land, human labor, bullock time, power tillers, irrigation water and cash capital derived from the 'duals' of the optimum solutions of the respective models are presented in Table 9. The MVP of a resource is the increase in total revenue that will occur as a result of increasing the level of that resource by one unit (i.e. to increase the land availability by one hectare). The MVP of a limiting resource will also indicate how much the farmer can be prepared to pay in order to purchase that extra unit of a resource (e.g. the price a farmer will be prepared to pay in order to purchase or rent an additional hectare of land or additional man-day of labour etc.). Hence the opportunity cost (or shadow price) of a limiting resource will be equal to its MVP, whilst for a slack resource it will be zero. (a) MVP of Land: The MVP of land varied considerably. Table 9 reveals that the MVP of land for small farms was higher than large farms. The shadow values (in Taka per hectare) of Taka 40,958 and 51,891 for high non-rice land; Taka 1,021 and Taka 3,502 for medium high rice land; Taka 19,710 and Taka 31,841 for medium non-rice land; and Taka 1,051 and Taka