19
1 AN OVERVIEW OF THE US STUDY ABROAD MARKET Allison Doorbar The German Academic Exchange Service Deutscher Akademischer Austauschdienst (DAAD)
1
AN OVERVIEW OF THE US STUDY ABROAD MARKET
Allison Doorbar
The German Academic Exchange ServiceDeutscher Akademischer Austauschdienst (DAAD)

2
The views in this publication are those of the author(s) alone. They do notnecessarily reflect the views of the German Academic Exchange Service (DAAD).
German Academic Exchange ServiceDeutscher Akademischer Austauschdienst (DAAD)871 United Nations PlazaNew York, NY 10017Tel: (212) 758-3223Fax: (212) [email protected]://www.daad.org
© 2003 The German Academic Exchange Service (DAAD)
Project Execution: Heide Naderer, Aranka Müller-MatitsCover Design: Barbara FriedmanPrint: COMPANY NAME

3
AN OVERVIEW OF THE US STUDY ABROAD MARKET
INTRODUCTION …………………………………………………………… 4
GENERAL OVERVIEW OF THE US STUDY ABROAD MARKET
I. OVERALL MARKET 51.1 Growth in the US Abroad Market 51.2 Leading Destination Countries 6
II. DESTINATION GERMANY 7
III. DURATION OF STUDY ABROAD PROGRAM ANDWHO IS STUDYING ABROAD 93.1 Duration of Program 93.2 Fields of Study for US Abroad Students 93.3 Student Profiles 10
IV. INSIGHT INTO THE US STUDY ABROAD STUDENT 114.1 Influencing Factors
on Student’s Choice of Destination 124.2 Influencing Factors
on Student’s Choice of Institution 134.3 Who Influences a Student’s
Choice of Study Abroad Destination 14
V. RANKING OF STUDY ABROAD PROGRAMS 14
VI. THE IMPACT OF SEPTEMBER 11ON THE US STUDY ABROAD MARKETby Christian Klöckner 15
APPENDIX 18

4
Introduction
This report provides an overview of the US study abroad market prepared byAllison Doorbar/JWT Education in 2001. It was revised by Christian Klöcknerin 2002 and Chapter VI was added. “Study Abroad” for the purpose of thisreport, and in general usage in the US market, refers to a student undertakingeither a semester or year’s study in a foreign country while (generally) earningcredits towards their degree program in the US.
The report details what is happening in the market place currently; highlightsthe trends over recent years; reports on Germany’s share of this market aswell as identifying student motivations and influences.
5
General Overview of the US Study Abroad Market
I. Overall Market
1.1 Growth in the US Study Abroad Market
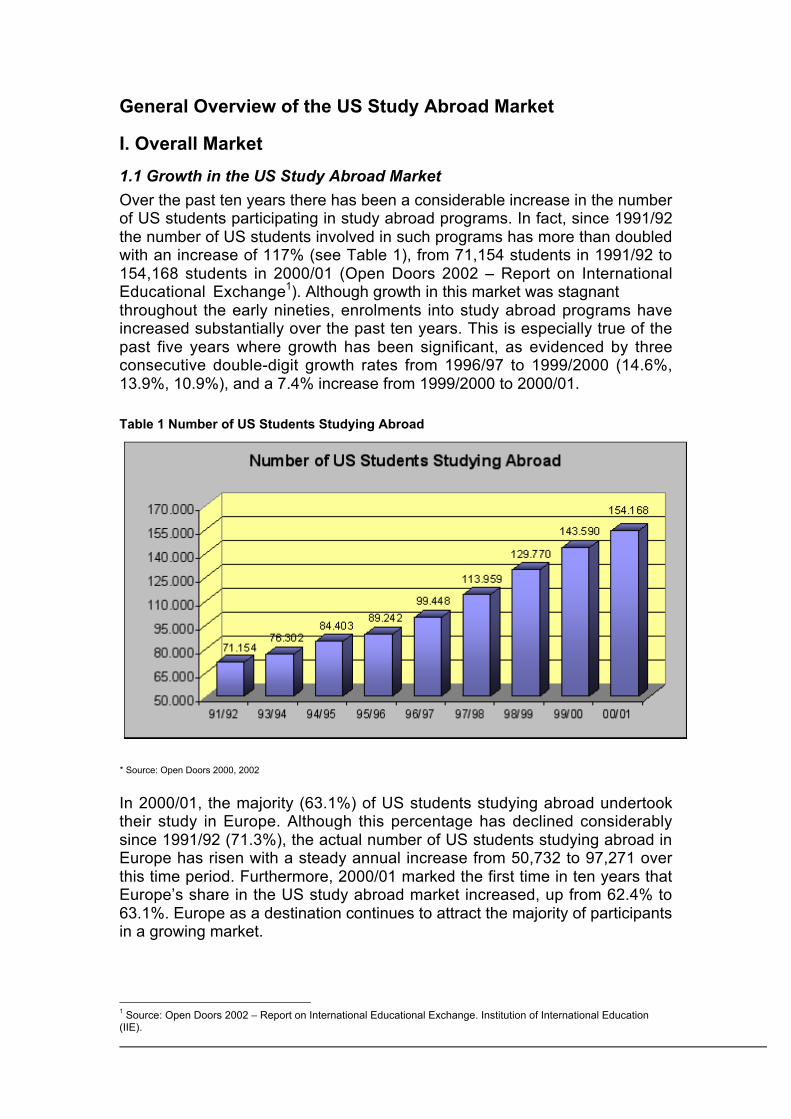
Over the past ten years there has been a considerable increase in the numberof US students participating in study abroad programs. In fact, since 1991/92the number of US students involved in such programs has more than doubledwith an increase of 117% (see Table 1), from 71,154 students in 1991/92 to154,168 students in 2000/01 (Open Doors 2002 – Report on InternationalEducational Exchange1). Although growth in this market was stagnantthroughout the early nineties, enrolments into study abroad programs haveincreased substantially over the past ten years. This is especially true of thepast five years where growth has been significant, as evidenced by threeconsecutive double-digit growth rates from 1996/97 to 1999/2000 (14.6%,13.9%, 10.9%), and a 7.4% increase from 1999/2000 to 2000/01.
Table 1 Number of US Students Studying Abroad
* Source: Open Doors 2000, 2002
In 2000/01, the majority (63.1%) of US students studying abroad undertooktheir study in Europe. Although this percentage has declined considerablysince 1991/92 (71.3%), the actual number of US students studying abroad inEurope has risen with a steady annual increase from 50,732 to 97,271 overthis time period. Furthermore, 2000/01 marked the first time in ten years thatEurope’s share in the US study abroad market increased, up from 62.4% to63.1%. Europe as a destination continues to attract the majority of participantsin a growing market.
1 Source: Open Doors 2002 – Report on International Educational Exchange. Institution of International Education(IIE).
6
1.2 Leading Destination Countries
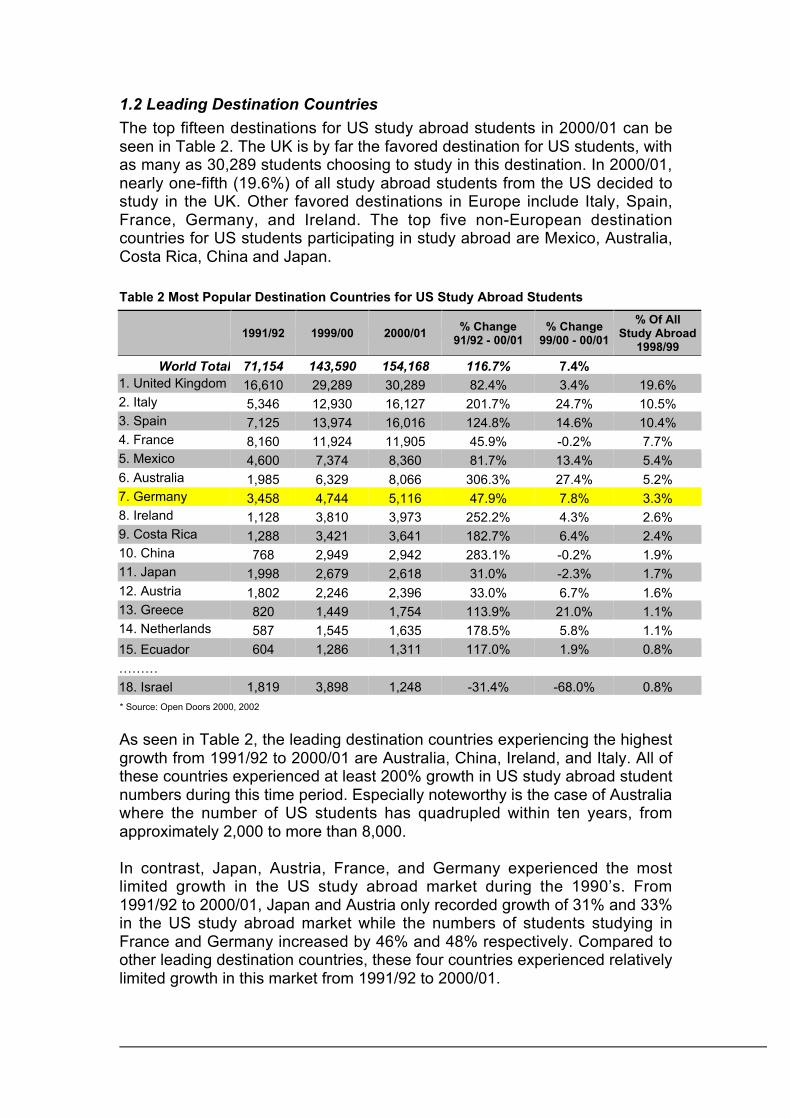
The top fifteen destinations for US study abroad students in 2000/01 can beseen in Table 2. The UK is by far the favored destination for US students, withas many as 30,289 students choosing to study in this destination. In 2000/01,nearly one-fifth (19.6%) of all study abroad students from the US decided tostudy in the UK. Other favored destinations in Europe include Italy, Spain,France, Germany, and Ireland. The top five non-European destinationcountries for US students participating in study abroad are Mexico, Australia,Costa Rica, China and Japan.
Table 2 Most Popular Destination Countries for US Study Abroad Students
1991/92 1999/00 2000/01
% Change91/92 - 00/01
% Change99/00 - 00/01
% Of AllStudy Abroad
1998/99
World Total 71,154 143,590 154,168 116.7% 7.4%1. United Kingdom 16,610 29,289 30,289 82.4% 3.4% 19.6%2. Italy 5,346 12,930 16,127 201.7% 24.7% 10.5%3. Spain 7,125 13,974 16,016 124.8% 14.6% 10.4%4. France 8,160 11,924 11,905 45.9% -0.2% 7.7%5. Mexico 4,600 7,374 8,360 81.7% 13.4% 5.4%6. Australia 1,985 6,329 8,066 306.3% 27.4% 5.2%7. Germany 3,458 4,744 5,116 47.9% 7.8% 3.3%8. Ireland 1,128 3,810 3,973 252.2% 4.3% 2.6%9. Costa Rica 1,288 3,421 3,641 182.7% 6.4% 2.4%10. China 768 2,949 2,942 283.1% -0.2% 1.9%11. Japan 1,998 2,679 2,618 31.0% -2.3% 1.7%12. Austria 1,802 2,246 2,396 33.0% 6.7% 1.6%13. Greece 820 1,449 1,754 113.9% 21.0% 1.1%14. Netherlands 587 1,545 1,635 178.5% 5.8% 1.1%
15. Ecuador 604 1,286 1,311 117.0% 1.9% 0.8%
………
18. Israel 1,819 3,898 1,248 -31.4% -68.0% 0.8%
* Source: Open Doors 2000, 2002
As seen in Table 2, the leading destination countries experiencing the highestgrowth from 1991/92 to 2000/01 are Australia, China, Ireland, and Italy. All ofthese countries experienced at least 200% growth in US study abroad studentnumbers during this time period. Especially noteworthy is the case of Australiawhere the number of US students has quadrupled within ten years, fromapproximately 2,000 to more than 8,000.
In contrast, Japan, Austria, France, and Germany experienced the mostlimited growth in the US study abroad market during the 1990’s. From1991/92 to 2000/01, Japan and Austria only recorded growth of 31% and 33%in the US study abroad market while the numbers of students studying inFrance and Germany increased by 46% and 48% respectively. Compared toother leading destination countries, these four countries experienced relativelylimited growth in this market from 1991/92 to 2000/01.
7
Although China recorded the second highest growth rate in the 1990’s, thisgrowth has slowed to an average growth rate over the last four years. In2000/01, China actually experienced a minimal decline (-0.2%) in the numberof US study abroad students. Numbers also decreased slightly for France(-0.2%) and Japan (-2.3%) from the previous year. Only limited growth wasapparent in Ecuador (+1.9%) and the United Kingdom (+3,4%) during thistime.
However, growth within the US study abroad market was strong over1999/2000 – 2000/01, growing 7.4% for the year. Australia experienced thehighest growth at 27% and Italy and Greece both recorded growth in excessof 20%. Relatively strong growth was also present in Spain (14.6%) andMexico (13.4%) over this time period.
A special but significant case is the one of Israel. Traditionally one of the topten destination countries for US study abroad, the number of US studentsstudying there fell sharply by over two thirds (-68%) to 1,248 students in2000/01. After being the 8th most popular destination in 1999/2000, Israel fellback to the 18th rank in 2000/01. Clearly, the deteriorating peace process inthe Middle East was the cause of this development. In light of suicidebombings and state retaliation many Americans apparently didn’t feel it wouldbe safe to study in Israel anymore. Safety as a criterion of students’ choice ofdestination has in general become more important since the terrorist attacksof September 11, 2001, as will be argued in the last chapter of this report.
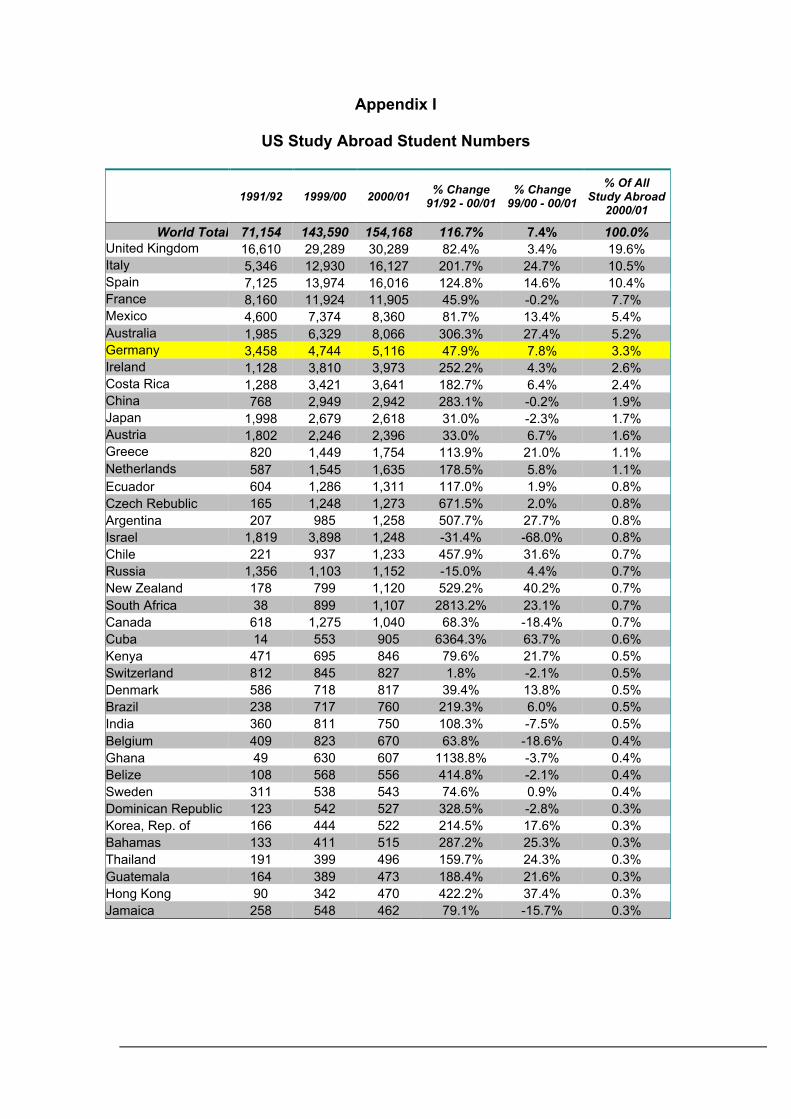
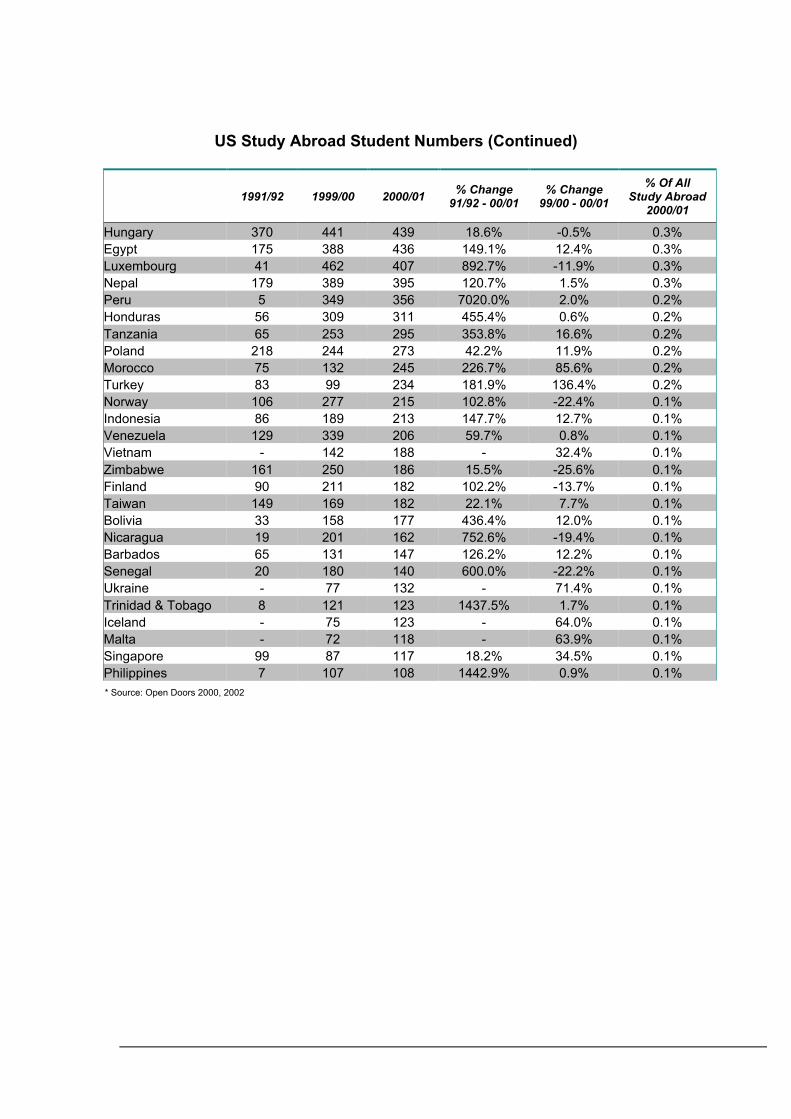
A more comprehensive list of destination countries and US study abroad datacan be found in Appendix I. This list includes all destination countries with atleast 100 US study abroad students in 2000/01.
II. Destination Germany
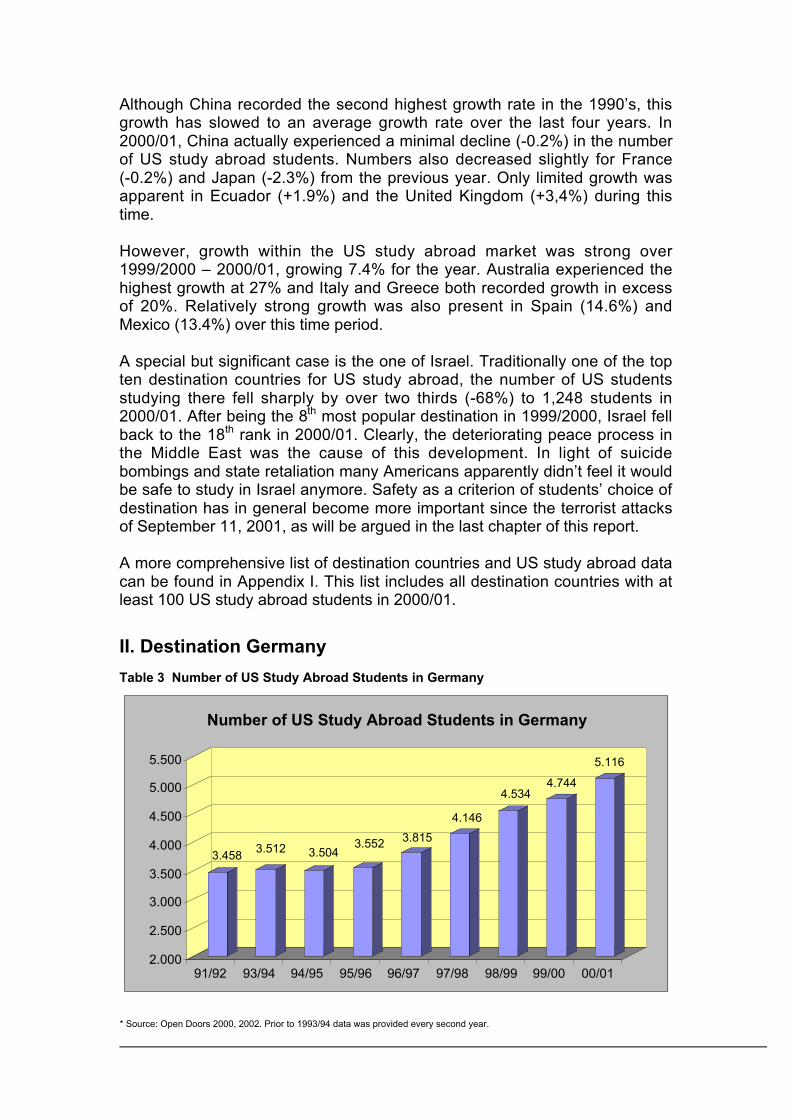
Table 3 Number of US Study Abroad Students in Germany
3.4583.512 3.504
3.552 3.815
4.146
4.5344.744
5.116
2.000
2.500
3.000
3.500
4.000
4.500
5.000
5.500
91/92 93/94 94/95 95/96 96/97 97/98 98/99 99/00 00/01
Number of US Study Abroad Students in Germany
* Source: Open Doors 2000, 2002. Prior to 1993/94 data was provided every second year.
8
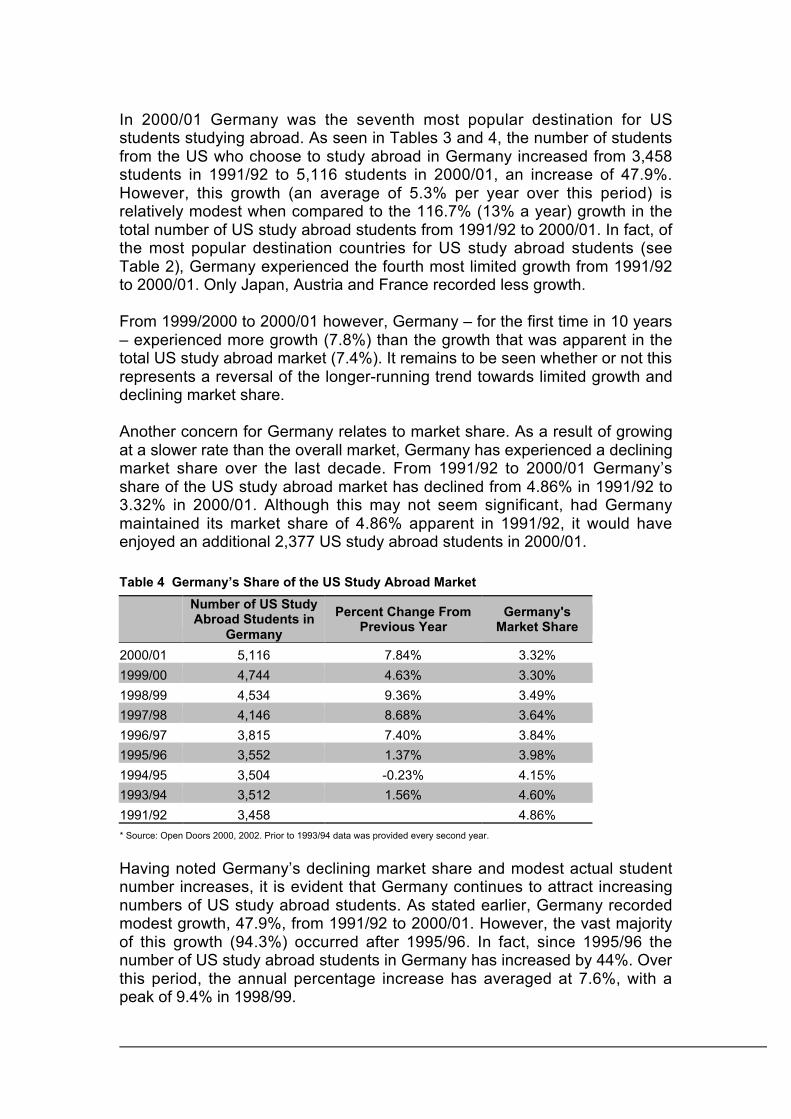
In 2000/01 Germany was the seventh most popular destination for USstudents studying abroad. As seen in Tables 3 and 4, the number of studentsfrom the US who choose to study abroad in Germany increased from 3,458students in 1991/92 to 5,116 students in 2000/01, an increase of 47.9%.However, this growth (an average of 5.3% per year over this period) isrelatively modest when compared to the 116.7% (13% a year) growth in thetotal number of US study abroad students from 1991/92 to 2000/01. In fact, ofthe most popular destination countries for US study abroad students (seeTable 2), Germany experienced the fourth most limited growth from 1991/92to 2000/01. Only Japan, Austria and France recorded less growth.
From 1999/2000 to 2000/01 however, Germany – for the first time in 10 years– experienced more growth (7.8%) than the growth that was apparent in thetotal US study abroad market (7.4%). It remains to be seen whether or not thisrepresents a reversal of the longer-running trend towards limited growth anddeclining market share.
Another concern for Germany relates to market share. As a result of growingat a slower rate than the overall market, Germany has experienced a decliningmarket share over the last decade. From 1991/92 to 2000/01 Germany’sshare of the US study abroad market has declined from 4.86% in 1991/92 to3.32% in 2000/01. Although this may not seem significant, had Germanymaintained its market share of 4.86% apparent in 1991/92, it would haveenjoyed an additional 2,377 US study abroad students in 2000/01.
Table 4 Germany’s Share of the US Study Abroad Market
Number of US StudyAbroad Students in
Germany
Percent Change FromPrevious Year
Germany'sMarket Share
2000/01 5,116 7.84% 3.32%
1999/00 4,744 4.63% 3.30%
1998/99 4,534 9.36% 3.49%
1997/98 4,146 8.68% 3.64%
1996/97 3,815 7.40% 3.84%
1995/96 3,552 1.37% 3.98%
1994/95 3,504 -0.23% 4.15%
1993/94 3,512 1.56% 4.60%
1991/92 3,458 4.86%
* Source: Open Doors 2000, 2002. Prior to 1993/94 data was provided every second year.
Having noted Germany’s declining market share and modest actual studentnumber increases, it is evident that Germany continues to attract increasingnumbers of US study abroad students. As stated earlier, Germany recordedmodest growth, 47.9%, from 1991/92 to 2000/01. However, the vast majorityof this growth (94.3%) occurred after 1995/96. In fact, since 1995/96 thenumber of US study abroad students in Germany has increased by 44%. Overthis period, the annual percentage increase has averaged at 7.6%, with apeak of 9.4% in 1998/99.
9
Although Germany is enjoying an increasing number of study abroad studentsfrom the US, it would appear that the major reason for this is the overallincrease in the number of US students who are choosing to participate instudy abroad programs. Factors such as modest growth and decreasingmarket share indicate that increasing student numbers may be a result offactors external to Germany rather than internal factors that are designed toattract US students considering studying abroad.
III. Duration of Study Abroad Programs and Who is StudyingAbroad
3.1 Duration of Program
Table 5 Duration of Study Abroad Program
96/97 97/98 98/99 99/00Number of Students
99/00
One Semester 40.2% 38.4% 39.8% 38.1% 54,683
Summer Term 32.8% 33.8% 34.6% 34.2% 49,131
Academic Year 10.7% 9.5% 8.6% 8.2% 11,728
Fewer than 8 Weeks 3.3% 4.2% 4.8% 7.3% 10,552
January Term 6.8% 6.6% 6.5% 6.0% 8,660
One Quarter 4.0% 4.8% 4.0% 4.7% 6,756
Two Quarters 0.9% 1.1% 0.6% 0.7% 946
Calender Year 0.2% 0.5% 0.2% 0.4% 613
Other 1.2% 1.0% 0.8% 0.4% 520* Source: Open Doors 2001
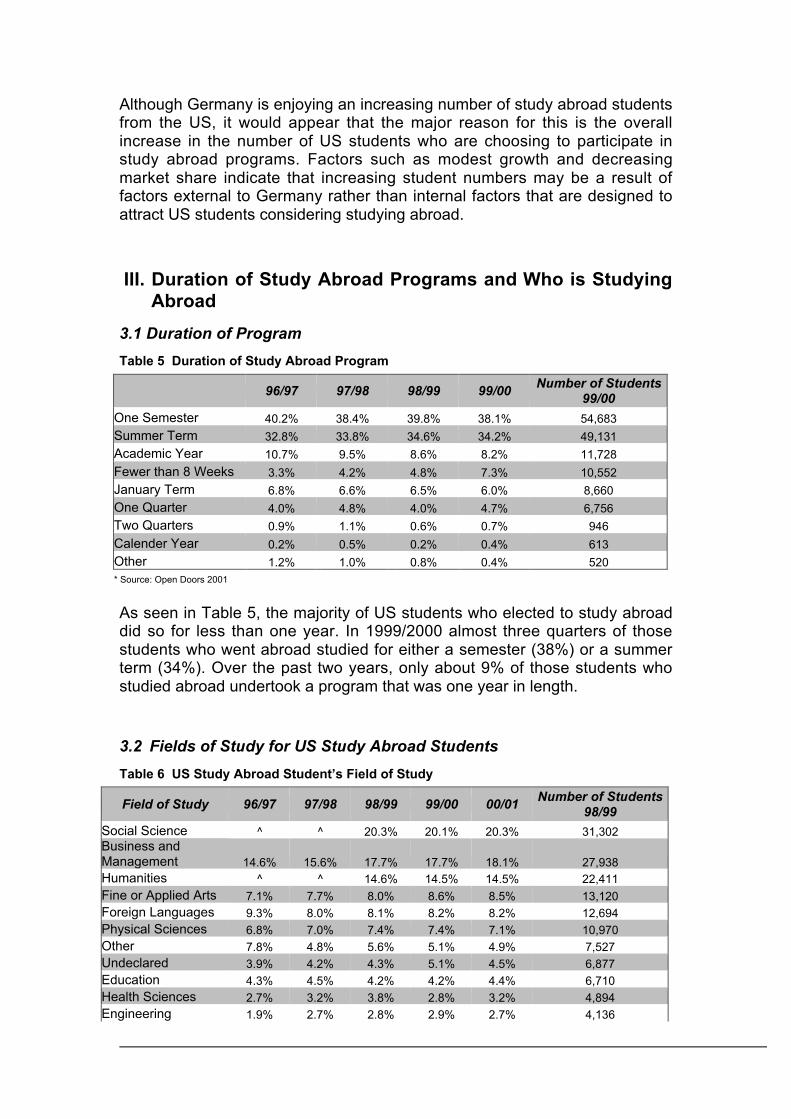
As seen in Table 5, the majority of US students who elected to study abroaddid so for less than one year. In 1999/2000 almost three quarters of thosestudents who went abroad studied for either a semester (38%) or a summerterm (34%). Over the past two years, only about 9% of those students whostudied abroad undertook a program that was one year in length.
3.2 Fields of Study for US Study Abroad Students
Table 6 US Study Abroad Student’s Field of Study
Field of Study 96/97 97/98 98/99 99/00 00/01Number of Students
98/99
Social Science ^ ^ 20.3% 20.1% 20.3% 31,302Business andManagement 14.6% 15.6% 17.7% 17.7% 18.1% 27,938Humanities ^ ^ 14.6% 14.5% 14.5% 22,411
Fine or Applied Arts 7.1% 7.7% 8.0% 8.6% 8.5% 13,120Foreign Languages 9.3% 8.0% 8.1% 8.2% 8.2% 12,694Physical Sciences 6.8% 7.0% 7.4% 7.4% 7.1% 10,970Other 7.8% 4.8% 5.6% 5.1% 4.9% 7,527Undeclared 3.9% 4.2% 4.3% 5.1% 4.5% 6,877Education 4.3% 4.5% 4.2% 4.2% 4.4% 6,710Health Sciences 2.7% 3.2% 3.8% 2.8% 3.2% 4,894Engineering 1.9% 2.7% 2.8% 2.9% 2.7% 4,136
10
Math or ComputerScience 1.6% 1.6% 1.8% 2.0% 2.0% 3,136Agriculture 1.2% 1.5% 1.4% 1.4% 1.6% 2,453Social Science andHumanities 34.0% 34.8% ^ ^ ^Dual Major 4.9% 4.3% -* Source: Open Doors 2000, 2002
^ Social Sciences and Humanities were included as one field in years prior to 98/99.
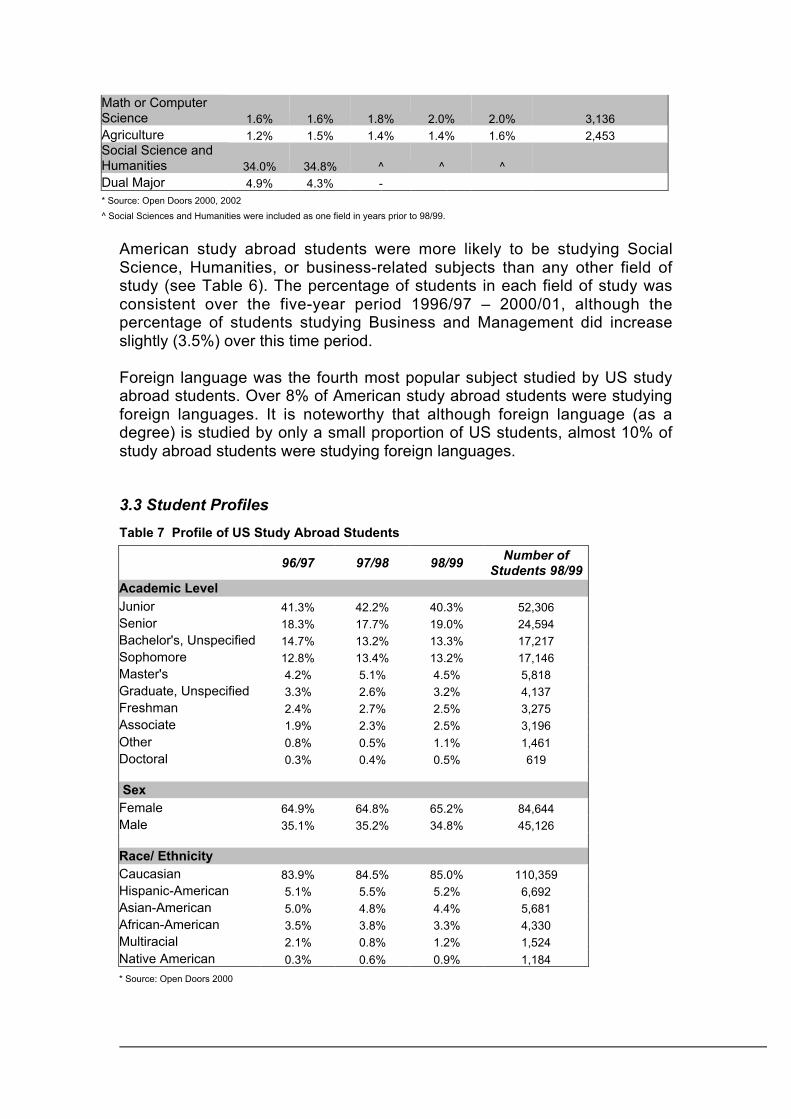
American study abroad students were more likely to be studying SocialScience, Humanities, or business-related subjects than any other field ofstudy (see Table 6). The percentage of students in each field of study wasconsistent over the five-year period 1996/97 – 2000/01, although thepercentage of students studying Business and Management did increaseslightly (3.5%) over this time period.
Foreign language was the fourth most popular subject studied by US studyabroad students. Over 8% of American study abroad students were studyingforeign languages. It is noteworthy that although foreign language (as adegree) is studied by only a small proportion of US students, almost 10% ofstudy abroad students were studying foreign languages.
3.3 Student Profiles
Table 7 Profile of US Study Abroad Students
96/97 97/98 98/99Number of
Students 98/99Academic LevelJunior 41.3% 42.2% 40.3% 52,306Senior 18.3% 17.7% 19.0% 24,594Bachelor's, Unspecified 14.7% 13.2% 13.3% 17,217Sophomore 12.8% 13.4% 13.2% 17,146Master's 4.2% 5.1% 4.5% 5,818Graduate, Unspecified 3.3% 2.6% 3.2% 4,137Freshman 2.4% 2.7% 2.5% 3,275Associate 1.9% 2.3% 2.5% 3,196
Other 0.8% 0.5% 1.1% 1,461Doctoral 0.3% 0.4% 0.5% 619 SexFemale 64.9% 64.8% 65.2% 84,644Male 35.1% 35.2% 34.8% 45,126 Race/ EthnicityCaucasian 83.9% 84.5% 85.0% 110,359Hispanic-American 5.1% 5.5% 5.2% 6,692Asian-American 5.0% 4.8% 4.4% 5,681African-American 3.5% 3.8% 3.3% 4,330Multiracial 2.1% 0.8% 1.2% 1,524
Native American 0.3% 0.6% 0.9% 1,184
* Source: Open Doors 2000
11
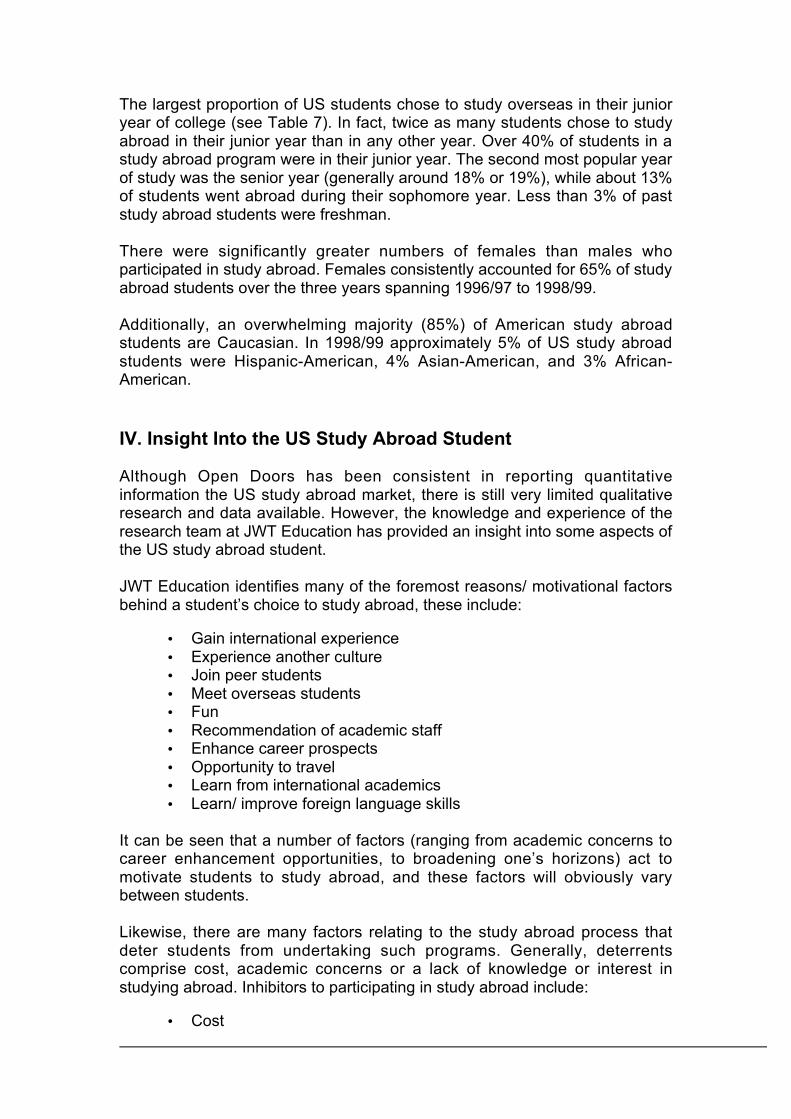
The largest proportion of US students chose to study overseas in their junioryear of college (see Table 7). In fact, twice as many students chose to studyabroad in their junior year than in any other year. Over 40% of students in astudy abroad program were in their junior year. The second most popular yearof study was the senior year (generally around 18% or 19%), while about 13%of students went abroad during their sophomore year. Less than 3% of paststudy abroad students were freshman.
There were significantly greater numbers of females than males whoparticipated in study abroad. Females consistently accounted for 65% of studyabroad students over the three years spanning 1996/97 to 1998/99.
Additionally, an overwhelming majority (85%) of American study abroadstudents are Caucasian. In 1998/99 approximately 5% of US study abroadstudents were Hispanic-American, 4% Asian-American, and 3% African-American.
IV. Insight Into the US Study Abroad Student
Although Open Doors has been consistent in reporting quantitativeinformation the US study abroad market, there is still very limited qualitativeresearch and data available. However, the knowledge and experience of theresearch team at JWT Education has provided an insight into some aspects ofthe US study abroad student.
JWT Education identifies many of the foremost reasons/ motivational factorsbehind a student’s choice to study abroad, these include:
• Gain international experience• Experience another culture• Join peer students• Meet overseas students• Fun• Recommendation of academic staff• Enhance career prospects• Opportunity to travel• Learn from international academics• Learn/ improve foreign language skills
It can be seen that a number of factors (ranging from academic concerns tocareer enhancement opportunities, to broadening one’s horizons) act tomotivate students to study abroad, and these factors will obviously varybetween students.
Likewise, there are many factors relating to the study abroad process thatdeter students from undertaking such programs. Generally, deterrentscomprise cost, academic concerns or a lack of knowledge or interest instudying abroad. Inhibitors to participating in study abroad include:
• Cost
12
• Lack of information• Lack of personal reference points• Fear of slowing academic progress• Not wanting to miss home campus activities• Fear of living away from home• Lack of credit transfer• Lack of enthusiasm from home university academics• Timing (within academic year or within degree program)• Recommended study abroad program does not meet student’s
needs (academically or personally)
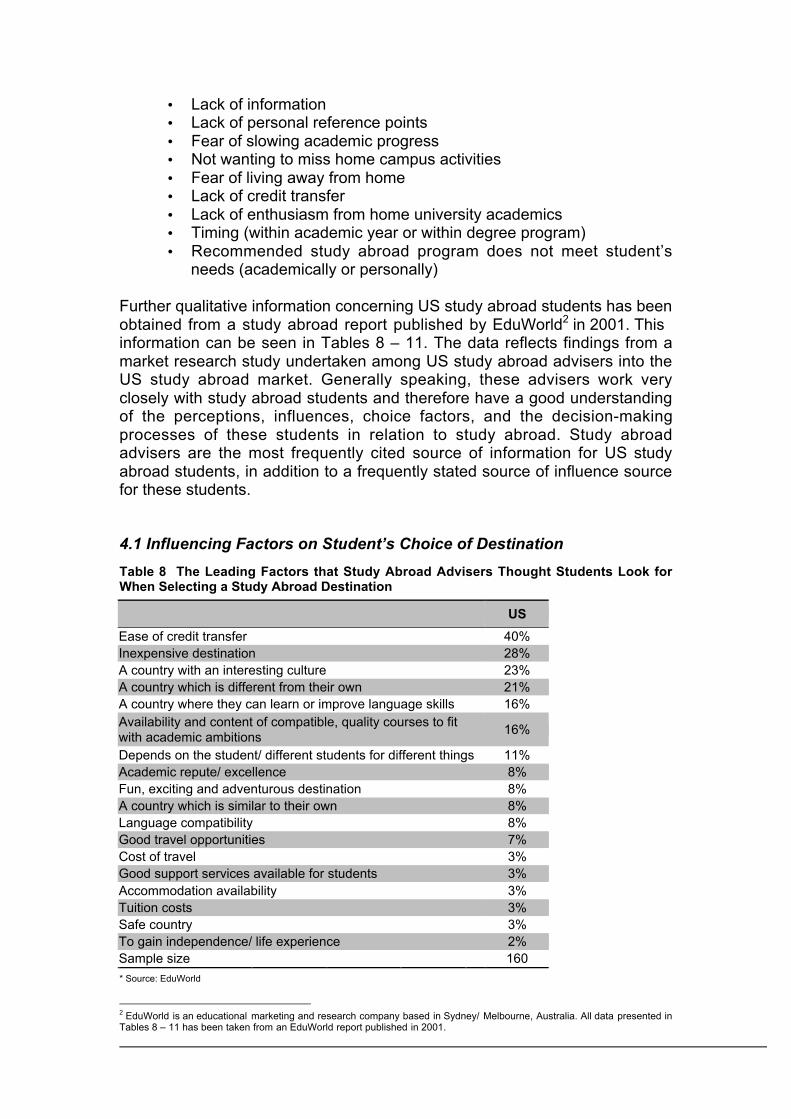
Further qualitative information concerning US study abroad students has beenobtained from a study abroad report published by EduWorld2 in 2001. Thisinformation can be seen in Tables 8 – 11. The data reflects findings from amarket research study undertaken among US study abroad advisers into theUS study abroad market. Generally speaking, these advisers work veryclosely with study abroad students and therefore have a good understandingof the perceptions, influences, choice factors, and the decision-makingprocesses of these students in relation to study abroad. Study abroadadvisers are the most frequently cited source of information for US studyabroad students, in addition to a frequently stated source of influence sourcefor these students.
4.1 Influencing Factors on Student’s Choice of Destination
Table 8 The Leading Factors that Study Abroad Advisers Thought Students Look forWhen Selecting a Study Abroad Destination
US
Ease of credit transfer 40%Inexpensive destination 28%A country with an interesting culture 23%A country which is different from their own 21%A country where they can learn or improve language skills 16%Availability and content of compatible, quality courses to fitwith academic ambitions
16%
Depends on the student/ different students for different things 11%Academic repute/ excellence 8%Fun, exciting and adventurous destination 8%A country which is similar to their own 8%Language compatibility 8%Good travel opportunities 7%Cost of travel 3%Good support services available for students 3%Accommodation availability 3%Tuition costs 3%Safe country 3%To gain independence/ life experience 2%Sample size 160
* Source: EduWorld
2 EduWorld is an educational marketing and research company based in Sydney/ Melbourne, Australia. All data presented inTables 8 – 11 has been taken from an EduWorld report published in 2001.

13
Table 8 indicates the factors that study abroad advisers feel are important tostudents when selecting a study abroad destination. Forty percent of studyabroad advisors indicated they believed that the ease of credit transfer was animportant factor when the student selected a destination country. Otherfactors often noted by advisers as being important for students when choosingto study abroad were an inexpensive destination, the student’s interest in thecountry’s culture, and selecting a country that varied from the US. Students’abilities to improve their language skills and the availability of quality coursesthat coincide with the student’s academic ambitions are also seen to beimportant to students when choosing a study abroad destination.
4.2 Influencing Factors on Student’s Choice of Institution
Table 9 The Leading Factors that Study Abroad Advisers Thought Students Look forWhen Selecting an Institution for Study Abroad
US
An institution which offers good credit transfers 43%Interesting course(s) 31%City location 22%Inexpensive tuition fees/ good value for money 17%Academic reputation 14%Good facilities 10%Good living accommodation 9%Different students look for different things 9%Location 5%Good course match 5%Availability and content of courses 4%Whether friends are studying there 4%Good student support services 4%Faculty reputation 3%Travelling opportunities 3%Large size of institution 2%Language requirement 2%Supportive and friendly staff 2%Good social scene 2%Sample size 160
* Source: EduWorld
Study abroad advisers indicated that some of the same factors that areimportant for students when deciding on a study abroad destination are alsoimportant when selecting a particular institution for study abroad. Once again,the factor that is most likely considered by study abroad advisers as beingimportant for students is credit transfers. When choosing destination advisersfelt an important factor for students was an inexpensive destination, likewisethey also indicated that inexpensive tuition fees was an influencing factor forstudents when selecting an institution for study abroad.
Other factors more commonly indicated by advisers as to what students arelooking for when choosing an institution for study abroad are the availability of
14
interesting courses, city location, academic reputation, good facilities andaccommodation.
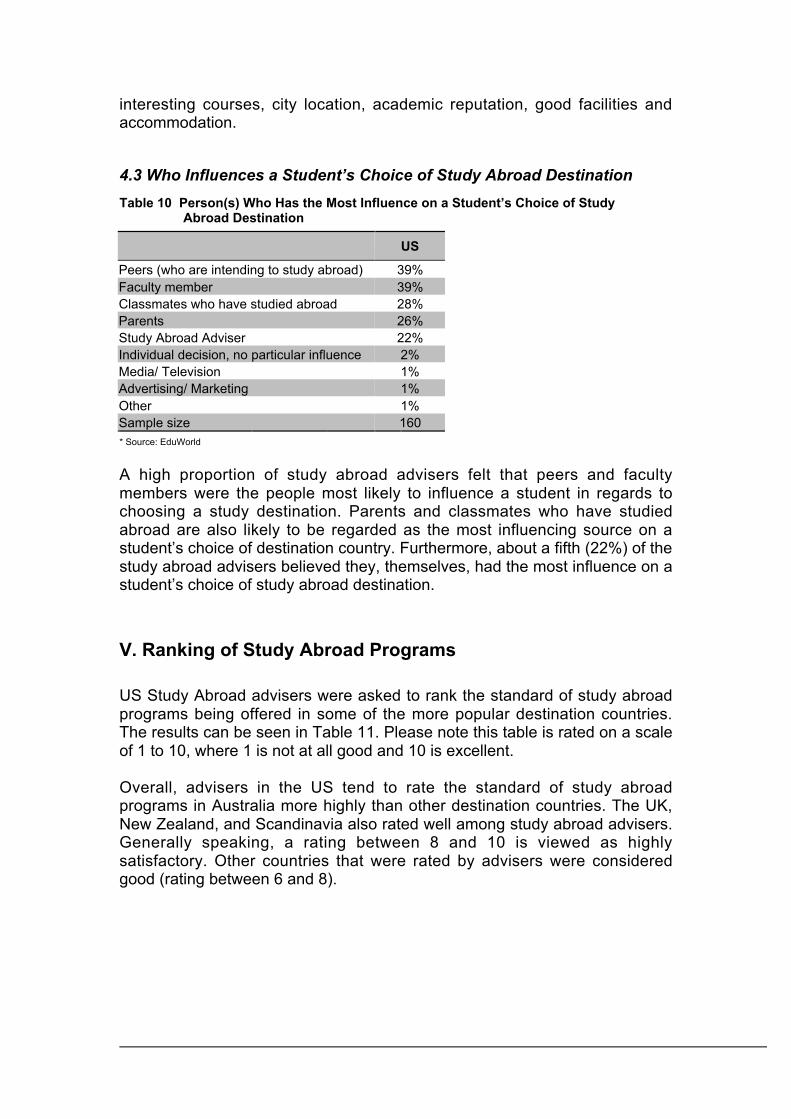
4.3 Who Influences a Student’s Choice of Study Abroad Destination
Table 10 Person(s) Who Has the Most Influence on a Student’s Choice of Study Abroad Destination
US
Peers (who are intending to study abroad) 39%Faculty member 39%Classmates who have studied abroad 28%Parents 26%Study Abroad Adviser 22%Individual decision, no particular influence 2%Media/ Television 1%Advertising/ Marketing 1%Other 1%Sample size 160* Source: EduWorld
A high proportion of study abroad advisers felt that peers and facultymembers were the people most likely to influence a student in regards tochoosing a study destination. Parents and classmates who have studiedabroad are also likely to be regarded as the most influencing source on astudent’s choice of destination country. Furthermore, about a fifth (22%) of thestudy abroad advisers believed they, themselves, had the most influence on astudent’s choice of study abroad destination.
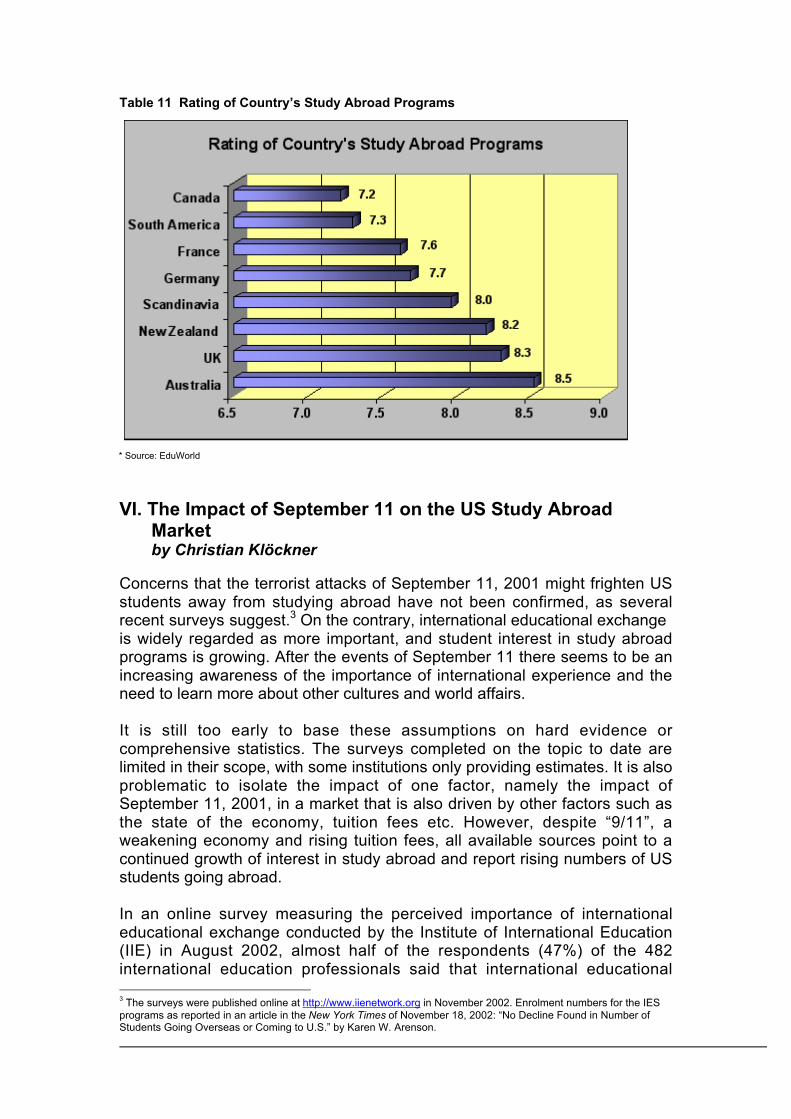
V. Ranking of Study Abroad Programs
US Study Abroad advisers were asked to rank the standard of study abroadprograms being offered in some of the more popular destination countries.The results can be seen in Table 11. Please note this table is rated on a scaleof 1 to 10, where 1 is not at all good and 10 is excellent.
Overall, advisers in the US tend to rate the standard of study abroadprograms in Australia more highly than other destination countries. The UK,New Zealand, and Scandinavia also rated well among study abroad advisers.Generally speaking, a rating between 8 and 10 is viewed as highlysatisfactory. Other countries that were rated by advisers were consideredgood (rating between 6 and 8).
15
Table 11 Rating of Country’s Study Abroad Programs
* Source: EduWorld
VI. The Impact of September 11 on the US Study AbroadMarketby Christian Klöckner
Concerns that the terrorist attacks of September 11, 2001 might frighten USstudents away from studying abroad have not been confirmed, as severalrecent surveys suggest.3 On the contrary, international educational exchangeis widely regarded as more important, and student interest in study abroadprograms is growing. After the events of September 11 there seems to be anincreasing awareness of the importance of international experience and theneed to learn more about other cultures and world affairs.
It is still too early to base these assumptions on hard evidence orcomprehensive statistics. The surveys completed on the topic to date arelimited in their scope, with some institutions only providing estimates. It is alsoproblematic to isolate the impact of one factor, namely the impact ofSeptember 11, 2001, in a market that is also driven by other factors such asthe state of the economy, tuition fees etc. However, despite “9/11”, aweakening economy and rising tuition fees, all available sources point to acontinued growth of interest in study abroad and report rising numbers of USstudents going abroad.
In an online survey measuring the perceived importance of internationaleducational exchange conducted by the Institute of International Education(IIE) in August 2002, almost half of the respondents (47%) of the 482international education professionals said that international educational 3 The surveys were published online at http://www.iienetwork.org in November 2002. Enrolment numbers for the IESprograms as reported in an article in the New York Times of November 18, 2002: “No Decline Found in Number ofStudents Going Overseas or Coming to U.S.” by Karen W. Arenson.
16
exchange, including study abroad, was regarded as more important on theircampuses in the aftermath of September 11. Slightly more than the half (52%)felt that international educational exchange was equally as important asbefore.
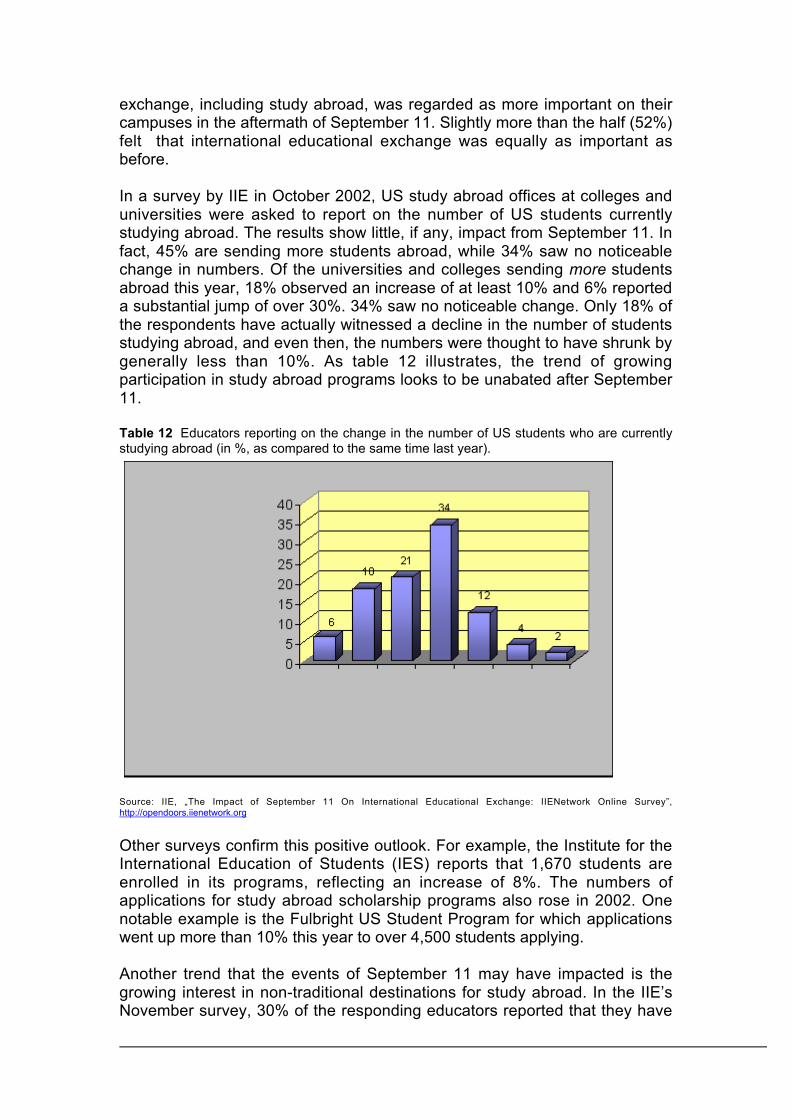
In a survey by IIE in October 2002, US study abroad offices at colleges anduniversities were asked to report on the number of US students currentlystudying abroad. The results show little, if any, impact from September 11. Infact, 45% are sending more students abroad, while 34% saw no noticeablechange in numbers. Of the universities and colleges sending more studentsabroad this year, 18% observed an increase of at least 10% and 6% reporteda substantial jump of over 30%. 34% saw no noticeable change. Only 18% ofthe respondents have actually witnessed a decline in the number of studentsstudying abroad, and even then, the numbers were thought to have shrunk bygenerally less than 10%. As table 12 illustrates, the trend of growingparticipation in study abroad programs looks to be unabated after September11.
Table 12 Educators reporting on the change in the number of US students who are currentlystudying abroad (in %, as compared to the same time last year).
Source: IIE, „The Impact of September 11 On International Educational Exchange: IIENetwork Online Survey”,http://opendoors.iienetwork.org
Other surveys confirm this positive outlook. For example, the Institute for theInternational Education of Students (IES) reports that 1,670 students areenrolled in its programs, reflecting an increase of 8%. The numbers ofapplications for study abroad scholarship programs also rose in 2002. Onenotable example is the Fulbright US Student Program for which applicationswent up more than 10% this year to over 4,500 students applying.
Another trend that the events of September 11 may have impacted is thegrowing interest in non-traditional destinations for study abroad. In the IIE’sNovember survey, 30% of the responding educators reported that they have
17
seen such a development. Another factor pointing to this is the success of theNational Security Education Program (NSEP) which funds US undergraduatesto study less-commonly-taught languages in less-commonly-visited countries.Application numbers for the NSEP rose by over 50% to almost 700 in 2002. Infact, over 20% of this program’s scholarship recipients will be studying Arabicin 2002/03.
On the other hand, as the sharp decline of the number of US studentsstudying in Israel in 2000/01 documented, the issue of safety has always beenimportant. To be sure, after the terrorist attacks of September 11, 2001 safetyhas emerged as a more conscious factor in the choice of students’destinations of study abroad.
While next year’s reporting of the 2002 numbers will give the fullest picture ofSeptember 11th’s impact on study abroad, the early indications are generallypositive.
18
Appendix I
US Study Abroad Student Numbers
1991/92 1999/00 2000/01% Change
91/92 - 00/01% Change
99/00 - 00/01
% Of AllStudy Abroad
2000/01
World Total 71,154 143,590 154,168 116.7% 7.4% 100.0%United Kingdom 16,610 29,289 30,289 82.4% 3.4% 19.6%Italy 5,346 12,930 16,127 201.7% 24.7% 10.5%Spain 7,125 13,974 16,016 124.8% 14.6% 10.4%France 8,160 11,924 11,905 45.9% -0.2% 7.7%Mexico 4,600 7,374 8,360 81.7% 13.4% 5.4%Australia 1,985 6,329 8,066 306.3% 27.4% 5.2%Germany 3,458 4,744 5,116 47.9% 7.8% 3.3%Ireland 1,128 3,810 3,973 252.2% 4.3% 2.6%Costa Rica 1,288 3,421 3,641 182.7% 6.4% 2.4%China 768 2,949 2,942 283.1% -0.2% 1.9%Japan 1,998 2,679 2,618 31.0% -2.3% 1.7%Austria 1,802 2,246 2,396 33.0% 6.7% 1.6%Greece 820 1,449 1,754 113.9% 21.0% 1.1%Netherlands 587 1,545 1,635 178.5% 5.8% 1.1%Ecuador 604 1,286 1,311 117.0% 1.9% 0.8%Czech Rebublic 165 1,248 1,273 671.5% 2.0% 0.8%Argentina 207 985 1,258 507.7% 27.7% 0.8%Israel 1,819 3,898 1,248 -31.4% -68.0% 0.8%Chile 221 937 1,233 457.9% 31.6% 0.7%Russia 1,356 1,103 1,152 -15.0% 4.4% 0.7%New Zealand 178 799 1,120 529.2% 40.2% 0.7%South Africa 38 899 1,107 2813.2% 23.1% 0.7%Canada 618 1,275 1,040 68.3% -18.4% 0.7%Cuba 14 553 905 6364.3% 63.7% 0.6%Kenya 471 695 846 79.6% 21.7% 0.5%Switzerland 812 845 827 1.8% -2.1% 0.5%Denmark 586 718 817 39.4% 13.8% 0.5%Brazil 238 717 760 219.3% 6.0% 0.5%India 360 811 750 108.3% -7.5% 0.5%Belgium 409 823 670 63.8% -18.6% 0.4%Ghana 49 630 607 1138.8% -3.7% 0.4%Belize 108 568 556 414.8% -2.1% 0.4%Sweden 311 538 543 74.6% 0.9% 0.4%Dominican Republic 123 542 527 328.5% -2.8% 0.3%Korea, Rep. of 166 444 522 214.5% 17.6% 0.3%Bahamas 133 411 515 287.2% 25.3% 0.3%Thailand 191 399 496 159.7% 24.3% 0.3%Guatemala 164 389 473 188.4% 21.6% 0.3%Hong Kong 90 342 470 422.2% 37.4% 0.3%Jamaica 258 548 462 79.1% -15.7% 0.3%
19
US Study Abroad Student Numbers (Continued)
1991/92 1999/00 2000/01% Change
91/92 - 00/01% Change
99/00 - 00/01
% Of AllStudy Abroad
2000/01
Hungary 370 441 439 18.6% -0.5% 0.3%Egypt 175 388 436 149.1% 12.4% 0.3%Luxembourg 41 462 407 892.7% -11.9% 0.3%Nepal 179 389 395 120.7% 1.5% 0.3%Peru 5 349 356 7020.0% 2.0% 0.2%Honduras 56 309 311 455.4% 0.6% 0.2%Tanzania 65 253 295 353.8% 16.6% 0.2%Poland 218 244 273 42.2% 11.9% 0.2%Morocco 75 132 245 226.7% 85.6% 0.2%Turkey 83 99 234 181.9% 136.4% 0.2%Norway 106 277 215 102.8% -22.4% 0.1%Indonesia 86 189 213 147.7% 12.7% 0.1%Venezuela 129 339 206 59.7% 0.8% 0.1%Vietnam - 142 188 - 32.4% 0.1%Zimbabwe 161 250 186 15.5% -25.6% 0.1%Finland 90 211 182 102.2% -13.7% 0.1%Taiwan 149 169 182 22.1% 7.7% 0.1%Bolivia 33 158 177 436.4% 12.0% 0.1%Nicaragua 19 201 162 752.6% -19.4% 0.1%Barbados 65 131 147 126.2% 12.2% 0.1%Senegal 20 180 140 600.0% -22.2% 0.1%Ukraine - 77 132 - 71.4% 0.1%Trinidad & Tobago 8 121 123 1437.5% 1.7% 0.1%Iceland - 75 123 - 64.0% 0.1%Malta - 72 118 - 63.9% 0.1%Singapore 99 87 117 18.2% 34.5% 0.1%Philippines 7 107 108 1442.9% 0.9% 0.1%* Source: Open Doors 2000, 2002


