17
WASHINGTON STATE UNIVERSITY EXTENSION • EM090E Anaerobic Digester Project and System Modifications: An Economic Analysis

W A S H I N G T O N S T A T E U N I V E R S I T Y E X T E N S I O N • E M 0 9 0 E
Anaerobic Digester Project and System Modifications:
An Economic Analysis

1
Anaerobic Digester Project and System Modifications:
An Economic Analysis
Preface
This Washington State University Extension publication is a substantially abbreviated review of information contained in the publication Renewable Natural Gas and Nutrient Recovery Feasibility for DeRuyter Dairy (Coppedge et al. 2012). This publication is also part of the Anaerobic Digestion Systems Series, which aims to provide information that improves decision-making concerning anaerobic digestion systems. Readers interested in further details are encouraged to read the full WSU report located at http://csanr.wsu.edu/publications/deRuyterFeasibilityStudy.pdf. Further, individuals seriously interested in a specific digester installation should seek expert guidance from an Anaerobic Digestion System technology provider. The U.S. EPA-AgSTAR project database contains a list of technology providers across the country. This provider list can be found at http://www.epa.gov/agstar/projects/index.html#database.
This publication introduces readers to key concerns regarding the profitability of anaerobic digestion systems and includes a discussion of general project costs and potential revenue sources. This publica-tion also examines the potential profitability of three alternative anaerobic digester systems: (a) com-bined heat and power, which is the baseline system; (b) boiler as a substitute for combined heat and power; and (c) renewable natural gas infrastructure.
Anaerobic Digester Projects in Washington State
Washington State has 443 commercial dairy farms, totaling more than 250,000 dairy cows. Roughly 100 of these dairies, or 23 percent of the total, can be considered large production facilities comprising 700 or more mature animals. Whatcom County, in the upper northwest corner of the state, and Yakima Valley, in the central region of the state, are the two primary dairy centers, totaling nearly 50,000 and 100,000 dairy cows, respectively. Over 70% of the identified large dairies are located in the central
region of the state (WSDA 2011). The map in Figure 1 shows the dairy sector in Washington State and the location of seven anaerobic digester (AD) projects. Seven AD facilities can be found in Whatcom, Skagit, and King Counties along the I-5 corridor, and one facility is located in the Yakima Valley.
Anaerobic Digester
An anaerobic digester is a vessel that allows animal manure to interact with bacteria under controlled conditions (a set time and temperature and the absence of oxygen), so that a portion of the organic material can be converted to methane-rich biogas. This biogas, in turn, can be harnessed and converted into renewable energy. The U.S. EPA-AgSTAR website (http://www.epa.gov/agstar/anaerobic/index.html) provides an introduction to anaerobic digestion, including different digester types and a process flow diagram. Additionally, an in-depth description of the process and co-products of anaerobic digestion
Highlights• Operating costs can have more impact
than capital costs on the profitability of an anaerobic digester project.
• An AD project is more sustainable when it has multiple sources of revenue (energy, fiber and nutrients, and environmental incentives).
• A substantial portion of the AD project’s total revenue is comprised of income from fiber products and nutrients, thus underscoring the importance of these co-products in the economic viability of anaerobic digestion.
• An AD project with a renewable natural gas system offers promising opportunities, particularly when the project can acquire Renewable Fuel Standard credits.

2
on Washington State dairies can be found in Anaero-bic Co-Digestion on Dairies in Washington State: The Solid Waste Handling Permit Exemption (Yorgey et al. 2011a). Applicable information can also be found in Anaerobic Digestion in the Pacific Northwest (Yorgey et al. 2011b).
Anaerobic Digester Systems
The following sections provide an overview of three alternative (modified) systems for AD projects and their co-products. These different system modifica-tions lead to different end-uses of biogas, specifi-cally, heat, electricity, or renewable natural gas. The detailed assumptions used in evaluating capital and operating requirements and revenue sources for different systems can be found on the WSU CSANR website at http://csanr.wsu.edu/publications/de-RuyterFeasibilityStudy.pdf. Diagrams illustrating each of the three alternative AD systems are located in the Appendix (Figures A1 through A3).
Anaerobic Digester with Combined Heat and Power (CHP)–Baseline System
The capital cost for a baseline AD system that produces combined heat and power is approximately $4.4 million. This baseline system produces biogas that fuels a modified diesel engine and generator, which then produce electricity and recovered heat. A portion of the recovered heat is used to maintain the temperature of the digester, while the rest is released without value through a dump radiator. The electrical power is sold to the
grid (that is, the national or regional network that provides electricity to consumers). Fibrous solids are separated from the remaining liquid, dehydrated in settling weirs, and then sold to companies producing soil amendments.
Anaerobic Digester with Boiler–Substitute for Combined Heat and Power
The capital cost for an anaerobic digester with a boil-er is approximately $4.4 million. The only difference between this system and the baseline system is that all biogas produced is used by a boiler as opposed to a combined heat and power system. The boiler supplies thermal heat to the digester for its own operation. Excess heat is not used and, instead, goes to a dump radiator. The boiler system’s efficiency is assumed to be 80% and capable of providing more than enough thermal capacity to meet the digester’s needs. In this AD system, no electrical power is sold to the grid. Any revenue comes from treated nutri-ents and fiber products that are sold to companies producing or selling soil amendments.
Anaerobic Digester with Renewable Natural Gas (RNG) Infrastructure–Conversion from CHP System
The capital cost for this system includes the cost of a gas cleaning unit; digester modification for accepting non-manure inputs such as food-processing substrates; transportation of gas off-site (e.g., by pipeline to an injection point or by tube trailer); and an injection point. The present discussion focuses
Figure 1. Washington State dairies and anaerobic digester installations (Washington State Department of Agriculture 2014).
!(
!(!(!(
!(
!(
!(
!(
!(
!(
!( !(!(
!(
!(
!(
!(
!(
!(
!(
!(
!(
!(
!(
!(
!(
!(
!(
!(!(
!(
!(
!(
!(
!(
!(
!(
!(
!(
!(!(
!(
!(
!(
!(
!(
!(
!(
!(
!(
!(!(!(
!(
!(
!(
!(
!(
!(
!(
!(
!(
!(
!(
!(
!(
!(
!(
!(
!(
!( !(
!(
!(
!(
!(
!(
!(
!(
!(
!(
!(
!(
!(
!(
!(
!(
!(
!(
!(
!(
!(
!(
!(
!(
!(
!(
!(
!(
!(
!(
!(
!(
!(
!(
!(
!(
!(
!(
!(
!(
!(
!(
!(
!(!(
!(
!(
!(
!(
!(
!(
!(
!(
!(
!(
!(!(!(
!(
!(
!(
!(
!(
!(
!(
!(
!(
!(
!(
!(
!(
!(
!(!(
!(
!(
!(!(
!(
!(
!(
!(
!(
!(
!(
!(
!(
!(
!(
!(
!(
!(
!(
!(
!(
!(
!(
!(
!(
!(
!(
!(
!(
!(
!(
!(
!(
!(
!(
!(
!(
!(
!(
!(
!(
!(
!(
!(
!(!(
!(
!(!(
!(
!(
!(
!(
!(
!(
!(
!(
!(
!(
!(
!(
!(
!(
!(!(
!(!(
!(
!(!(
!(
!(
!(
!(
!(
!(
!(
!(
!(
!(
!( !(!(!(
!(!(!(!( !(!(
!(
!(!(
!(
!(
!(!(
!(
!(
!(
!(!(!(!( !(!(!(!(
!(
!(!(!(!(
!(
!(!(
!(
!(
!(!(!(
!(
!(
!(
!(
!(
!(
!(
!(!(!(!(
!(!(
!(
!(!(!(
!(
!(
!(
!(
!(
!(
!(
!(
!(
!(
!(
!(
!(
!(
!(
!(
!(
!(
!(
!(!(
!(
!(
!(
!(
!(
!(
!(
!(
!(
!(
!(
!(
!(
!(
!(
!(
!(
!(
!(
!(
!(
!(
!(
!(
!(
!(
!(
!(!(
!(
!(
!(
!(
!(!(
!(
!(
!(
!(
!(
!(
!(
!(
!(!(
!(
!(
!(
!(
!(
!(!(
!(
!(
!(
!(
!(
!(
!(
!(
!(
!(
!(
!(
!(
!(
!(
!(
!(
!(
!(!(
!(
!(
!(
!(
!(
!(
!(
!(
!(
!(
!(
!(
GF
GF
GF
GF
GFGF
GF
GF
§̈¦5
§̈¦5
§̈¦90
§̈¦90
§̈¦82
£¤2
£¤101
£¤395
£¤195
£¤97
£¤101
£¤12
£¤2
£¤12
£¤12
£¤395
£¤2
£¤97
2004: FPE Renewables
2006: G. DeRuyter & Sons Dairy
2008: Qualco Energy
2008: Farm Power Rexville
2011: Van Dyk-S Holsteins
2010: Farm Power Lynden
2012: Rainier Biogas
2012: Edaleen Cow Power
/0 50 10025
Miles
Source: Washington State Department of Agriculture, Dairy Nutrient Management Program, 2014 Registration
(Year Operational: Name)Dairy DigestersÑ
Dairies by Size!(
!(
!(
(152 Farms)1 to 199 mature animalsSmall
(134 Farms)200 to 699 mature animalsMedium
(102 Farms)700 or more mature animalsLarge
3
on the production and transportation of renewable natural gas by pipeline, with an estimated total capital cost of approximately $9.8 million (i.e., $4.4 million initial investment for the AD-CHP system, plus a $5.4 million investment to convert the existing system and build the infrastructure needed to produce RNG). Renewable natural gas can also be used as transportation fuel. The renewable natural gas scenario is discussed in the section on sensitivity analysis in this publication. In the AD-RNG system, biogas produced by the anaerobic digester is upgraded to renewable natural gas, which becomes a source of revenue in addition to nutrients and fiber products and avoided methane emission.
Economic Analysis of Different Anaerobic Digester Systems
Capital costs and operating costs
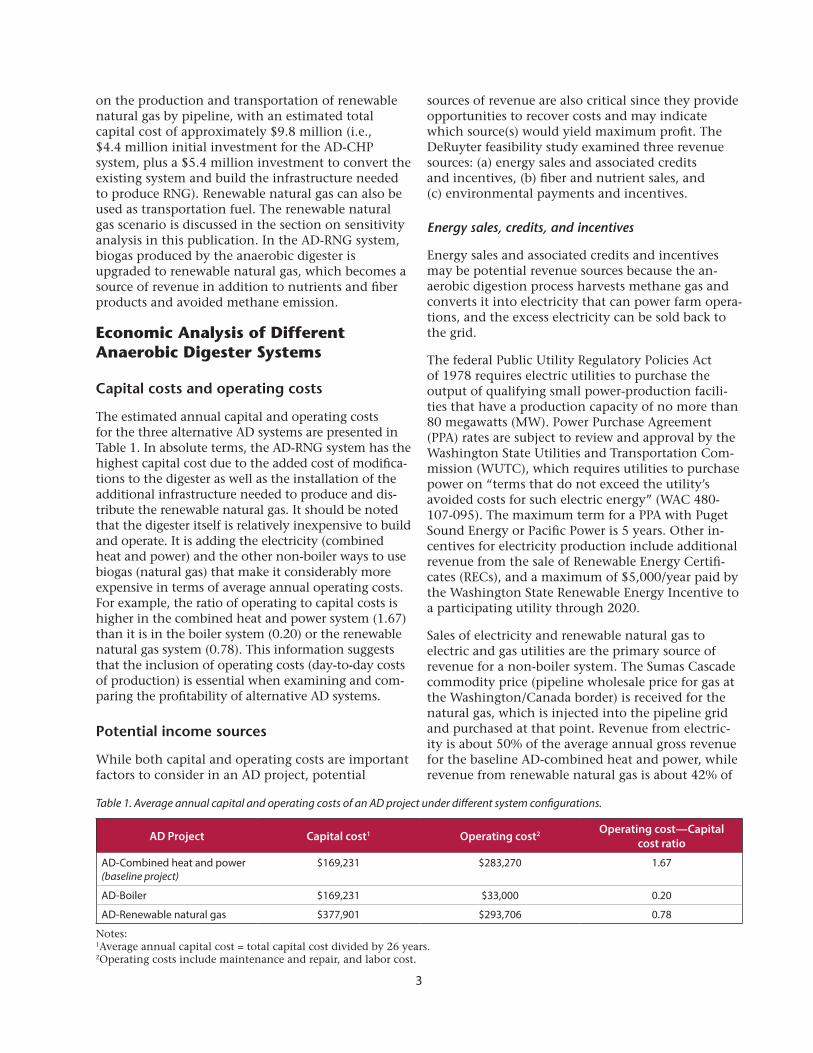
The estimated annual capital and operating costs for the three alternative AD systems are presented in Table 1. In absolute terms, the AD-RNG system has the highest capital cost due to the added cost of modifica-tions to the digester as well as the installation of the additional infrastructure needed to produce and dis-tribute the renewable natural gas. It should be noted that the digester itself is relatively inexpensive to build and operate. It is adding the electricity (combined heat and power) and the other non-boiler ways to use biogas (natural gas) that make it considerably more expensive in terms of average annual operating costs. For example, the ratio of operating to capital costs is higher in the combined heat and power system (1.67) than it is in the boiler system (0.20) or the renewable natural gas system (0.78). This information suggests that the inclusion of operating costs (day-to-day costs of production) is essential when examining and com-paring the profitability of alternative AD systems.
Potential income sources
While both capital and operating costs are important factors to consider in an AD project, potential
sources of revenue are also critical since they provide opportunities to recover costs and may indicate which source(s) would yield maximum profit. The DeRuyter feasibility study examined three revenue sources: (a) energy sales and associated credits and incentives, (b) fiber and nutrient sales, and (c) environmental payments and incentives.
Energy sales, credits, and incentives
Energy sales and associated credits and incentives may be potential revenue sources because the an-aerobic digestion process harvests methane gas and converts it into electricity that can power farm opera-tions, and the excess electricity can be sold back to the grid.
The federal Public Utility Regulatory Policies Act of 1978 requires electric utilities to purchase the output of qualifying small power-production facili-ties that have a production capacity of no more than 80 megawatts (MW). Power Purchase Agreement (PPA) rates are subject to review and approval by the Washington State Utilities and Transportation Com-mission (WUTC), which requires utilities to purchase power on “terms that do not exceed the utility’s avoided costs for such electric energy” (WAC 480-107-095). The maximum term for a PPA with Puget Sound Energy or Pacific Power is 5 years. Other in-centives for electricity production include additional revenue from the sale of Renewable Energy Certifi-cates (RECs), and a maximum of $5,000/year paid by the Washington State Renewable Energy Incentive to a participating utility through 2020.
Sales of electricity and renewable natural gas to electric and gas utilities are the primary source of revenue for a non-boiler system. The Sumas Cascade commodity price (pipeline wholesale price for gas at the Washington/Canada border) is received for the natural gas, which is injected into the pipeline grid and purchased at that point. Revenue from electric-ity is about 50% of the average annual gross revenue for the baseline AD-combined heat and power, while revenue from renewable natural gas is about 42% of
Table 1. Average annual capital and operating costs of an AD project under different system configurations.
AD Project Capital cost1 Operating cost2 Operating cost—Capital cost ratio
AD-Combined heat and power (baseline project)
$169,231 $283,270 1.67
AD-Boiler $169,231 $33,000 0.20
AD-Renewable natural gas $377,901 $293,706 0.78
Notes:1Average annual capital cost = total capital cost divided by 26 years.2Operating costs include maintenance and repair, and labor cost.

4
the average annual gross revenue for the AD-RNG system (Figure 2).
Fiber and nutrient sales
The sale of fiber and nutrients may be another potential source of revenue because after anaerobic digestion the remaining manure fiber and phospho-rus solids from the digester effluent can be screened, settled, and harvested and then sold to a fertilizer manufacturer. The anaerobic digester used in the DeRuyter feasibility study produced an average of 42,000 cubic yards of fiber per year. Approximately 250 tons of phosphorus solids were produced by the digester during the first 6 years of the study (2007–2012), 750 tons in 2013, and it is expected to pro-duce 1,000 tons of phosphorus solids per year from 2014 to 2032.
The sales from fiber and nutrients are the main source of income for the AD-boiler system, account-ing for 77% of the average annual gross revenue (Figure 2). Furthermore, sales of these co-products are the second most important source of income for the AD-combined heat and power (35%) and AD-renew-able natural gas (34%) systems.
Environmental credits and incentives
Carbon credits resulting from the collection and use of methane gas, which is normally released into the atmosphere during non-digested storage in lagoons (the current standard practice for dairy waste management), could be another potential revenue source. Most AD projects certify and sell voluntary credits under the Climate Action Reserve Livestock Protocol. Carbon credits under this protocol were first
issued to the DeRuyter AD project in 2010 (Climate Action Reserve n.d.). Another venue for carbon credits is the California carbon market (implemented in 2013), which is regulated by the California Air Resource Board. The price of carbon credits is higher in regulated markets than in voluntary markets. In the DeRuyter feasibility study, the AD project sold credits to the Climate Action Reserve Livestock Protocol until 2013, and made the assumption that it would transfer to the California program beginning in 2014. The study also assumed that the AD project would generate credits for 10 years (i.e., 2014–2023) with the option of being renewed if the project met the eligibility criteria of the newest protocol available at the time.
Total receipts from carbon credits and other incen-tives represented 10% and 8% of the average annual gross revenue for the AD-combined heat and power and AD-renewable natural gas systems, respectively (Figure 2). Additional environmental payment, in the form of a Renewable Fuel Standard credit (Renewable Identification Number or RIN), may be received by the AD-RNG system if renewable natural gas was sold as transportation fuel that generated RIN values. This potential income is further discussed in the section on sensitivity analyses.
Economic viability of different AD systems
The viability of an AD project can be evaluated by using investment decision criteria such as the net present value (NPV). NPV is calculated as the sum of the discounted cash flows minus the initial investment. Cash flow is the difference in the cash inflow (or benefits) and cash outflow (or costs) from the first year to the last year of the project and is discounted back to its present value.
Figure 2. AD system revenue from multiple sources, as a percentage of average annual gross revenue.
0%
10%
20%
30%
40%
50%
60%
70%
80%
90%
Combined heat and power system Boiler system Renewable natural gas system
As % of A
ve. A
nnua
l Gross Reven
ue
Electricity Renewable natural gas Fiber & nutrients REC & WA REI Carbon credits
5
The present value refers to the value of future cash flows that is discounted to reflect the current value. A discount rate of 4%, which is the average rate of return to equity in U.S. farming (Shumway and Bishop 2008) was used in the AD system calculations. The discount rate represents the opportunity cost of capital. Tables A1 through A3 in the Appendix show the cash flows in 2012 constant dollars for the different AD systems that were used in the NPV analysis. As a result of limited space, data are presented only for selected years from 2012 to 2032. However, complete tables can be accessed at http://csanr.wsu.edu/wp-content/uploads/2015/02/Appendix-Tables-for-EM090.xlsx.
In general, the investment decision rule is to accept a project when the NPV is greater than zero. The NPV can also be used to compare the profitability of different digester project alternatives. The greater the NPV, the more economical the project.
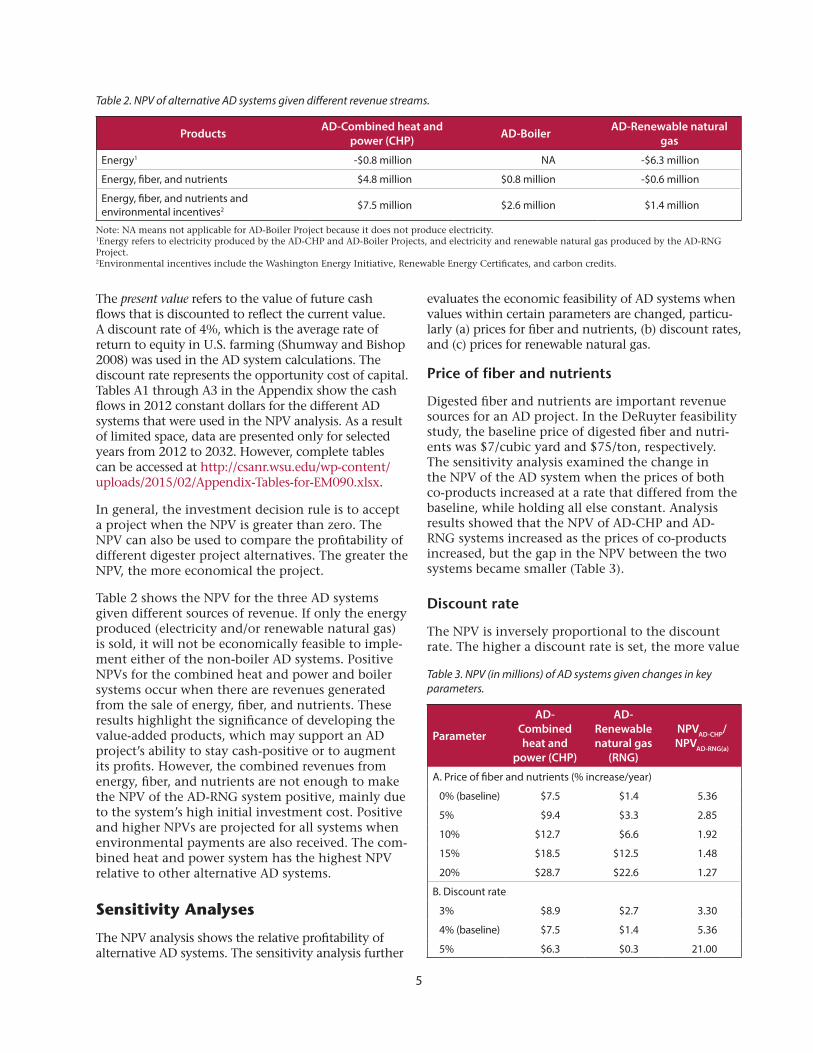
Table 2 shows the NPV for the three AD systems given different sources of revenue. If only the energy produced (electricity and/or renewable natural gas) is sold, it will not be economically feasible to imple-ment either of the non-boiler AD systems. Positive NPVs for the combined heat and power and boiler systems occur when there are revenues generated from the sale of energy, fiber, and nutrients. These results highlight the significance of developing the value-added products, which may support an AD project’s ability to stay cash-positive or to augment its profits. However, the combined revenues from energy, fiber, and nutrients are not enough to make the NPV of the AD-RNG system positive, mainly due to the system’s high initial investment cost. Positive and higher NPVs are projected for all systems when environmental payments are also received. The com-bined heat and power system has the highest NPV relative to other alternative AD systems.
Sensitivity Analyses
The NPV analysis shows the relative profitability of alternative AD systems. The sensitivity analysis further
evaluates the economic feasibility of AD systems when values within certain parameters are changed, particu-larly (a) prices for fiber and nutrients, (b) discount rates, and (c) prices for renewable natural gas.
Price of fiber and nutrients
Digested fiber and nutrients are important revenue sources for an AD project. In the DeRuyter feasibility study, the baseline price of digested fiber and nutri-ents was $7/cubic yard and $75/ton, respectively. The sensitivity analysis examined the change in the NPV of the AD system when the prices of both co-products increased at a rate that differed from the baseline, while holding all else constant. Analysis results showed that the NPV of AD-CHP and AD-RNG systems increased as the prices of co-products increased, but the gap in the NPV between the two systems became smaller (Table 3).
Discount rate
The NPV is inversely proportional to the discount rate. The higher a discount rate is set, the more value
Table 2. NPV of alternative AD systems given different revenue streams.
Products AD-Combined heat and power (CHP) AD-Boiler AD-Renewable natural
gas
Energy1 -$0.8 million NA -$6.3 million
Energy, fiber, and nutrients $4.8 million $0.8 million -$0.6 million
Energy, fiber, and nutrients and environmental incentives2 $7.5 million $2.6 million $1.4 million
Note: NA means not applicable for AD-Boiler Project because it does not produce electricity.1Energy refers to electricity produced by the AD-CHP and AD-Boiler Projects, and electricity and renewable natural gas produced by the AD-RNG Project.2Environmental incentives include the Washington Energy Initiative, Renewable Energy Certificates, and carbon credits.
Table 3. NPV (in millions) of AD systems given changes in key parameters.
Parameter
AD-Combined heat and
power (CHP)
AD-Renewable natural gas
(RNG)
NPVAD-CHP/NPVAD-RNG(a)
A. Price of fiber and nutrients (% increase/year)
0% (baseline) $7.5 $1.4 5.36
5% $9.4 $3.3 2.85
10% $12.7 $6.6 1.92
15% $18.5 $12.5 1.48
20% $28.7 $22.6 1.27
B. Discount rate
3% $8.9 $2.7 3.30
4% (baseline) $7.5 $1.4 5.36
5% $6.3 $0.3 21.00

6
is placed on current money as opposed to future money. A discount rate of 4% was used as the base-line in the sensitivity analysis. Given the analysis results, the combined heat and power digester system appears to be a better option than the renewable natural gas system, and even more so as the discount rate increases (Table 3).
Price scenarios for renewable natural gas
Renewable natural gas can qualify for Renewable Fuel Standard (RFS) credits or Renewable Identification Numbers (RIN) if the gas is used as transportation fuel. A full explanation of the RFS program will not be presented in this publication; however, interested readers are referred to the EPA AgSTAR Projects (2013) for details on the regulations and standards. Also, the Renewable Natural Gas and Nutrient Recovery Feasibility for DeRuyter Dairy study (Coppedge et al. 2012) includes a detailed discussion on transportation fuel projects and the potential of these projects to earn RINs.
Both the capital and operating costs to produce renewable natural gas can vary depending on the means of transporting it from the digester site to a point of interconnection with the natural gas grid (e.g., by pipeline or by tube trailer). There are also additional costs if it is dispensed at a compressed natural gas (CNG) fueling station. For the sensitiv-ity analysis, two alternative pricing scenarios for compressed natural gas were examined: Scenario 1 focused on the CNG price plus “green premium”—where renewable natural gas was sold as transporta-tion fuel thus generating RIN values in addition to the commodity value, and Scenario 2 focused on the retail CNG price plus “green premium”—where renewable natural gas was used as transportation fuel (generating RIN values) and was dispensed at a CNG fueling station.
In Scenario 1, the capital and operating costs of the AD-RNG system remained the same. The only difference was the revenue received for renewable natural gas if it was used as transportation fuel and thus qualified for RINs. In this scenario, the sale of RNG included the Sumas Index price of natural gas plus the percentage of the RIN agreed on by the AD project and the purchaser of RNG (gas utility, gas brokers, CNG or liquefied natural gas retailers). If renewable natural gas was placed into the pipeline and then compressed and used for fuel off-site, the RIN will be generated off-site. There was potential for RIN revenue-sharing between the AD project, which produced and transported the gas through a pipe to the pipeline injection point, and the RNG purchaser. The following assumptions were used for
the Scenario 1 and Scenario 2 analyses:
• TheRINvalueequaled$0.74/RIN;
• TheADprojecthad100%ownershipoftheRIN value; and
• Therewere2,056,377RINsgeneratedperyear,based on the annual production of renewable natural gas (148,341,050 British thermal units (BTUs) of RNG produced per year divided by 77,000 BTUs per RIN).
In Scenario 2, the capital and operating costs were higher than for the AD-RNG system because they took into account the additional costs associated with the construction and operation of a fueling station. The capital cost of the fueling station was estimated at approximately $0.3 million, which made the total capital cost of the AD-RNG system equal to approximately $10.1 million in this scenario. The CNG retail price was combined with the applicable RIN rate paid through the RFS program. The AD project in this second scenario realized 100% of the RIN value because the project itself cleaned and compressed the gas and fueled its own vehicles. The assumed number and price of RINs were the same as those in Scenario 1.
Tables A4 and A5 in the Appendix provide a snapshot of the annual cost and returns of the AD-RNG system using two price scenarios for natural gas. Figure 3 shows the contribution of different income sources to the total revenue of the AD project. Approximately half of the total revenue in Scenario 1 came from RINs, followed by receipts from natural gas. In Scenario 2, income from natural gas accounted for 49% of total revenue, followed by RINs (33%). Fiber and nutrients were also essential sources of income, contributing 17% and 11% to the total revenue of Scenario 1 and Scenario 2, respectively.
Table 4 provides a summary of the NPV, benefit-cost ratio (BCR), and total project costs for alternative AD systems. NPV is an absolute measure of project viabil-ity, while BCR is a relative measure of project viability and thus will provide some indication of how much the project’s benefits outweigh its costs. The BCR is the ratio of the present value of estimated benefits to the present value of estimated costs. As before, the discount rate used was 4%. The BCR should be greater than 1.0 for a project to be acceptable. Also, this ratio indicates the return per dollar of expendi-ture. For example, the AD-CHP project had a BCR of 1.8, indicating the project had a return of $1.8 for every $1 spent.
The AD-CHP system had the lowest total project cost, winning over the alternative AD-RNG system (if the

7
Table 4. NPV, BCR, and total costs of different AD systems.
AD System NPV BCR Total Project Costs
AD-Combined heat and power $7.5 million 1.80 $11.8 million
AD-Renewable natural gas (RNG)
Baseline RNG price: commodity value $1.4 million 1.10 $17.5 million
RNG Price Scenario 1: commodity value + RIN $16.8 million 2.12 $17.5 million
RNG Price Scenario 2: retail price + RIN $28.5 million 2.50 $25.4 million
0%
10%
20%
30%
40%
50%
60%
RNG Price Scenario 1 (commodity value + RIN) RNG Price Scenario 2 (CNG retail price + RIN)
As % of A
ve. A
nnua
l Gross Reven
ue
Electricity Renewable natural gas Fiber & nutrients REC & WA REI Carbon credits RIN
Figure 3. Contribution of different products to the total revenue of the AD-RNG system, given two price scenarios for renewable fuel.
commodity price was received for natural gas). How-ever, the AD-RNG system had an NPV that was about two to four times higher than the AD-CHP system when a green premium (RIN) was added to the value of natural gas (Scenario 1), or when natural gas was dispensed and sold at a fueling station and gener-ated RIN values (Scenario 2). Under Scenario 1, there was an estimated return of $2.12 for every $1 spent; while under Scenario 2, the estimated benefit was a bit higher at $2.50 for every $1 spent.
As previously mentioned, renewable natural gas can be potentially sold to gas utilities, gas brokers, and CNG retailers, and these purchasers may require some sharing of the RIN value. In order to examine the impact of RIN revenue-sharing on the profitability of an AD-RNG system, sensitivity analyses were done at 0%, 25%, 50%, and 75% of the RIN value retained by the project (Table 5). The following results were obtained:
• TherelativedifferencebetweentheNPVinScenario 1 and the NPV in Scenario 2 in-creased as the percentage of the RIN value retained by the AD-RNG system decreased.
This difference occurred because under the first price scenario, 50% of the total revenue for the AD-RNG system came from RINs.
• InScenario1,atavalueof$0.74perRIN,the NPV of the AD-RNG system and the combined heat and power system was the same if the AD-RNG system retained about 42% of the RIN value. Therefore, in this price scenario, the AD-RNG system must receive more than 42% of the RIN value in order to be more profitable than the baseline AD-CHP system.
• InScenario2,theAD-RNGsystemthatincluded a CNG fueling station had a higher NPV than the baseline AD-CHP system, even in the absence of RIN revenue.
Conclusion
Capital cost is a significant factor when considering an AD system, but the relative differences between capital and operating costs indicate that non-boiler systems (combined heat and power and renewable

8
natural gas) have higher annual operating costs, on average. However, the renewable natural gas system has lower operating costs compared to the baseline combined heat and power system. These findings suggest that operating costs can have more impact (than capital costs) on the profitability of an AD project.
The findings of the DeRuyter feasibility study also suggest that the renewable natural gas system offers promising opportunities. When RFS credits (RIN) are added to the commodity price of gas, the AD project with this system may generate greater net returns than the baseline combined heat and power system. Furthermore, if renewable fuel is sold as transportation fuel in the retail compressed-natural-gas market, the renewable natural gas system will be more profitable than the baseline system with or without the addition of environmental incentives.
Economic analyses also show that an anaerobic digester project can be profitable under many differ-ent scenarios, but is most sustainable when it allows for revenues from electricity or renewable fuel, fiber products, nutrients, and carbon credits for avoided methane emissions. In particular, the combined income from fiber products and nutrients represents a substantial portion of the AD project’s gross revenue, thereby underscoring the importance of co-product markets in the economic viability of anaerobic diges-tion. Environmental incentives like carbon credits and RFS credits (RIN) also make a significant contribution to the profitability of an AD project, particularly when the project produces renewable natural gas.
References
Climate Action Reserve. Undated. View CRTs Issued. http://www.climateactionreserve.org/how/projects/.
Coppedge, B., G. Coppedge, D. Evans, J. Jensen, E. Kanoa, K. Scanlan, B. Scanlan, P. Weisberg, and C. Frear. 2012. Renewable Natural Gas and Nutrient Recovery Feasibility for DeRuyter Dairy: An Anaerobic Digester Case Study for Alternative Off-Take Markets and Remediation of Nutrient Loading Concerns within the Region. A Report to the Washington State Department of Commerce. http://csanr.wsu.edu/publications/deRuyterFeasibilityStudy.pdf.
Shumway, C.R., and C.P. Bishop. 2008. The Economics of Anaerobic Digestion with Co-Product Marketing. http://www.epa.gov/agstar/documents/workshop08-2/shumway.pdf.
U.S. Environmental Protection Agency (EPA). 2013. Renewable Fuel Standard. http://www.epa.gov/otaq/fuels/renewablefuels/index.htm.
U.S. EPA. 2012. Anaerobic Digestion. http://www.epa.gov/agstar/anaerobic/index.html.
U.S. EPA. 2013. AgSTAR Projects. http://www.epa.gov/agstar/projects/index.html#database.
Washington State Department of Agriculture (WSDA). 2014. Dairy Nutrient Management Program, 2014 Registration, Map of Washington Dairies and Digesters. WSDA, Olympia, WA.
Table 5. NPV and BCR of AD systems given different rates of RIN revenue retained by the AD project.
AD System NPV ($ million) BCR
AD-Combined heat and power $7.5 1.8
AD-Renewable natural gas (RNG)
Baseline Scenario: commodity value $1.4 1.1
RNG Price Scenario 1: commodity value plus RIN
100% RIN retained by AD Project $16.0 2.1
75% RIN retained by AD Project $12.4 1.9
50% RIN retained by AD Project $8.8 1.6
25% RIN retained by AD Project $5.1 1.4
0% RIN retained by AD Project $1.4 1.1
RNG Price Scenario 2: retail price plus RIN
100% RIN retained by AD Project $28.5 2.5
75% RIN retained by AD Project $24.8 2.3
50% RIN retained by AD Project $21.1 2.1
25% RIN retained by AD Project $17.5 1.9
0% RIN retained by AD Project $13.8 1.7

9
Yorgey, G., C. Kruger, K. Steward, C. Frear, and N. Mena. 2011a. Anaerobic Co-Digestion on Dairies in Washington State: The Solid Waste Handling Permit Exemption. Washington State University Extension Publication FS040E. http://cru.cahe.wsu.edu/CEPublications/FS040E/FS040E.pdf.
Yorgey, G., C. Kruger, C. Frear, C.R. Shumway, C. Bishop, S. Chen, and C. MacConnell. 2011b. Anaerobic Digestion in the Pacific Northwest. Rural Connections 5(2): 33–38. https://wrdc.usu.edu/files/uploads/Rural%20Connections/RCJUN11w.pdf#page=35.
Acknowledgements
The preparation of this publication was funded by the WSU ARC Biomass Research Program and the USDA National Institute of Food and Agriculture Award #2012-6800219814.

10
Appendix
Diagrams of three alternative systems for an anaerobic digester project.
Figure A1. Anaerobic digester with combined heat and power (CHP) system.
Figure A2. Anaerobic digester with boiler system.
Figure A3. Anaerobic digester with renewable natural gas (RNG) infrastructure.

11
Appe
ndix
Tabl
e 1.
Rev
enue
s and
ope
ratio
nal c
osts
(in
2012
cons
tant
dol
lars
) for
the
anae
robi
c di
gest
er p
roje
ct w
ith a
com
bine
d he
at a
nd p
ower
syst
em, s
elec
ted
year
s.
2012
2014
2016
2018
2020
2022
2024
2026
2028
2030
2032
Elec
tric
ity
Prod
uced
/Rat
e
El
ectr
icity
Gen
erat
ion
(kW
h)8,
409,
600
8,40
9,60
08,
409,
600
8,40
9,60
08,
409,
600
8,40
9,60
08,
409,
600
8,40
9,60
08,
409,
600
8,40
9,60
08,
409,
600
El
ectr
icity
Use
d in
Dig
este
r 67
2,76
867
2,76
867
2,76
867
2,76
867
2,76
867
2,76
867
2,76
867
2,76
867
2,76
867
2,76
867
2,76
8
N
et E
lect
ricity
Ava
ilabl
e fo
r Sal
e7,
736,
832
7,73
6,83
27,
736,
832
7,73
6,83
27,
736,
832
7,73
6,83
27,
736,
832
7,73
6,83
27,
736,
832
7,73
6,83
27,
736,
832
El
ectr
icity
Pur
chas
e Pr
ice
(per
kW
h)$0
.065
$0.0
65$0
.065
$0.0
65$0
.065
$0.0
65$0
.065
$0.0
65$0
.065
$0.0
65$0
.065
Re
new
able
Ene
rgy
Cert
ifica
te P
rice
(per
kW
h)$0
.010
$0.0
10$0
.004
$0.0
04$0
.004
$0.0
04$0
.004
$0.0
04$0
.004
$0.0
04$0
.004
Proj
ecte
d Re
venu
e El
ectr
icit
y
El
ectr
icity
Sal
es$5
06,1
44$5
06,1
44$5
06,1
44$5
06,1
44$5
06,1
44$5
06,1
44$5
06,1
44$5
06,1
44$5
06,1
44$5
06,1
44$5
06,1
44
Re
new
able
Ene
rgy
Cert
ifica
tes
$77,
368
$77,
368
$30,
947
$30,
947
$30,
947
$30,
947
$30,
947
$30,
947
$30,
947
$30,
947
$30,
947
W
ashi
ngto
n St
ate
Rene
wab
le E
nerg
y In
cent
ive
$5,0
00$5
,000
$5,0
00$5
,000
$5,0
00$0
$0$0
$0$0
$0
Su
btot
al E
lect
ricity
Rev
enue
s$5
88,5
12$5
88,5
12$5
42,0
91$5
42,0
91$5
42,0
91$5
37,0
91$5
37,0
91$5
37,0
91$5
37,0
91$5
37,0
91$5
37,0
91
Fibe
r Sal
es
Cu
bic
Yard
s Pe
r Yea
r 42
,000
42,0
0042
,000
42,0
0042
,000
42,0
0042
,000
42,0
0042
,000
42,0
0042
,000
Pr
ice
per c
ubic
yar
d$7
.00
$7.0
0$7
.00
$7.0
0$7
.00
$7.0
0$7
.00
$7.0
0$7
.00
$7.0
0$7
.00
Su
btot
al F
iber
Rev
enue
s29
4,00
029
4,00
029
4,00
029
4,00
029
4,00
029
4,00
029
4,00
029
4,00
029
4,00
029
4,00
029
4,00
0
Nut
rien
t Sal
es
To
ns P
er Y
ear
500
1,00
01,
000
1,00
01,
000
1,00
01,
000
1,00
01,
000
1,00
01,
000
Pr
ice/
Ton
(med
ium
pric
e)$7
5.00
$75.
00$7
5.00
$75.
00$7
5.00
$75.
00$7
5.00
$75.
00$7
5.00
$75.
00$7
5.00
Su
btot
al N
utrie
nt R
even
ues
$37,
500
$75,
000
$75,
000
$75,
000
$75,
000
$75,
000
$75,
000
$75,
000
$75,
000
$75,
000
$75,
000
Carb
on C
redi
ts
Cr
edits
per
Yea
r21
,063
.00
21,0
63.0
021
,063
.00
21,0
63.0
021
,063
.00
21,0
63.0
00.
000.
000.
000.
000.
00
Pr
ice
per C
redi
t$8
.50
$10.
00$1
0.00
$10.
00$1
0.00
$10.
00$0
.00
$0.0
0$0
.00
$0.0
0$0
.00
Tr
ansa
ctio
n Co
sts
$6,6
72$1
1,67
2$6
,672
$6,6
72$6
,672
$6,6
72$0
$0$0
$0$0
Su
btot
al C
arbo
n Cr
edits
Rev
enue
$172
,363
$198
,958
$203
,958
$203
,958
$203
,958
$203
,958
$0$0
$0$0
$0
TOTA
L RE
VEN
UE
$1,0
92,3
75$1
,156
,470
$1,1
15,0
49$1
,115
,049
$1,1
15,0
49$1
,110
,049
$906
,091
$906
,091
$906
,091
$906
,091
$906
,091
Ope
ratio
n Co
sts
G
ener
ator
Mai
nten
ance
& R
epai
r Cos
t$2
27,0
59$2
27,0
59$2
27,0
59$2
27,0
59$2
27,0
59$2
27,0
59$2
27,0
59$2
27,0
59$2
27,0
59$2
27,0
59$2
27,0
59
D
iges
ter M
aint
enan
ce &
Rep
air C
ost
$23,
210
$23,
210
$23,
210
$23,
210
$23,
210
$23,
210
$23,
210
$23,
210
$23,
210
$23,
210
$23,
210
Labo
r Cos
t$3
3,00
0$3
3,00
0$3
3,00
0$3
3,00
0$3
3,00
0$3
3,00
0$3
3,00
0$3
3,00
0$3
3,00
0$3
3,00
0$3
3,00
0
TOTA
L CO
ST$2
83,2
70$2
83,2
70$2
83,2
70$2
83,2
70$2
83,2
70$2
83,2
70$2
83,2
70$2
83,2
70$2
83,2
70$2
83,2
70$2
83,2
70
NET
REV
ENU
E$8
09,1
05$8
73,2
00$8
31,7
79$8
31,7
79$8
31,7
79$8
26,7
79$6
22,8
21$6
22,8
21$6
22,8
21$6
22,8
21$6
22,8
21

12
Appe
ndix
Tabl
e 2.
Rev
enue
s and
ope
ratio
nal c
osts
(in
2012
cons
tant
dol
lars
) for
the
anae
robi
c di
gest
er p
roje
ct w
ith a
boi
ler s
yste
m, s
elec
ted
year
s.
2012
2014
2016
2018
2020
2022
2024
2026
2028
2030
2032
Elec
tric
ity
Prod
uced
/Rat
e
El
ectr
icity
Gen
erat
ion
(kW
h)0
00
00
00
00
00
El
ectr
icity
Use
d in
Dig
este
r 0
00
00
00
00
00
N
et E
lect
ricity
Ava
ilabl
e fo
r Sal
e0
00
00
00
00
00
El
ectr
icity
Pur
chas
e Pr
ice
(per
kW
h)$0
.065
4$0
.065
4$0
.065
4$0
.065
4$0
.065
4$0
.065
4$0
.065
4$0
.065
4$0
.065
4$0
.065
4$0
.065
4
Re
new
able
Ene
rgy
Cert
ifica
te P
rice
(per
kW
h)$0
.010
0$0
.010
0$0
.004
0$0
.004
0$0
.004
0$0
.004
0$0
.004
0$0
.004
0$0
.004
0$0
.004
0$0
.004
0
Proj
ecte
d Re
venu
e El
ectr
icit
y
El
ectr
icity
Sal
es$0
.00
$0.0
0$0
.00
$0.0
0$0
.00
$0.0
0$0
.00
$0.0
0$0
.00
$0.0
0$0
.00
Re
new
able
Ene
rgy
Cert
ifica
tes
$0.0
0$0
.00
$0.0
0$0
.00
$0.0
0$0
.00
$0.0
0$0
.00
$0.0
0$0
.00
$0.0
0
W
ashi
ngto
n St
ate
Rene
wab
le E
nerg
y In
cent
ive
$0.0
0$0
.00
$0.0
0$0
.00
$0.0
0$0
.00
$0.0
0$0
.00
$0.0
0$0
.00
$0.0
0
Su
btot
al E
lect
ricity
Rev
enue
s$0
.00
$0.0
0$0
.00
$0.0
0$0
.00
$0.0
0$0
.00
$0.0
0$0
.00
$0.0
0$0
.00
Fibe
r Sal
es
Cu
bic
Yard
s Pe
r Yea
r42
,000
42,0
0042
,000
42,0
0042
,000
42,0
0042
,000
42,0
0042
,000
42,0
0042
,000
Pr
ice
per c
ubic
yar
d$7
.00
$7.0
0$7
.00
$7.0
0$7
.00
$7.0
0$7
.00
$7.0
0$7
.00
$7.0
0$7
.00
Su
btot
al F
iber
Rev
enue
s$2
94,0
00$2
94,0
00$2
94,0
00$2
94,0
00$2
94,0
00$2
94,0
00$2
94,0
00$2
94,0
00$2
94,0
00$2
94,0
00$2
94,0
00
Nut
rien
t Sal
es
To
ns P
er Y
ear
500
1,00
01,
000
1,00
01,
000
1,00
01,
000
1,00
01,
000
1,00
01,
000
Pr
ice/
Ton
(med
ium
pric
e)$7
5.00
$75.
00$7
5.00
$75.
00$7
5.00
$75.
00$7
5.00
$75.
00$7
5.00
$75.
00$7
5.00
Su
btot
al N
utrie
nt R
even
ues
$37,
500
$75,
000
$75,
000
$75,
000
$75,
000
$75,
000
$75,
000
$75,
000
$75,
000
$75,
000
$75,
000
Carb
on C
redi
ts
Cr
edits
per
Yea
r21
,063
21,0
6321
,063
21,0
6321
,063
21,0
630
00
00
Pr
ice
per C
redi
t$8
.50
$10.
00$1
0.00
$10.
00$1
0.00
$10.
00$0
.00
$0.0
0$0
.00
$0.0
0$0
.00
Tr
ansa
ctio
n Co
sts
$6,6
72$1
1,67
2$6
,672
$6,6
72$6
,672
$6,6
72$0
$0$0
$0$0
Su
btot
al C
arbo
n Cr
edits
Rev
enue
$172
,363
$198
,958
$203
,958
$203
,958
$203
,958
$203
,958
$0$0
$0$0
$0
TOTA
L RE
VEN
UE
$503
,863
$567
,958
$572
,958
$572
,958
$572
,958
$572
,958
$369
,000
$369
,000
$369
,000
$369
,000
$369
,000
Ope
ratio
n Co
sts
G
ener
ator
Mai
nten
ance
& R
epai
r Cos
t$0
$0$0
$0$0
$0$0
$0$0
$0$0
D
iges
ter M
aint
enan
ce &
Rep
air C
ost
$0$0
$0$0
$0$0
$0$0
$0$0
$0
Labo
r Cos
t$3
3,00
0$3
3,00
0$3
3,00
0$3
3,00
0$3
3,00
0$3
3,00
0$3
3,00
0$3
3,00
0$3
3,00
0$3
3,00
0$3
3,00
0
TOTA
L CO
ST$3
3,00
0$3
3,00
0$3
3,00
0$3
3,00
0$3
3,00
0$3
3,00
0$3
3,00
0$3
3,00
0$3
3,00
0$3
3,00
0$3
3,00
0
NET
REV
ENU
E$4
70,8
63$5
34,9
58$5
39,9
58$5
39,9
58$5
39,9
58$5
39,9
58$3
36,0
00$3
36,0
00$3
36,0
00$3
36,0
00$3
36,0
00

13
Appe
ndix
Tabl
e 3.
Rev
enue
s and
ope
ratio
nal c
osts
(in
2012
cons
tant
dol
lars
) for
the
anae
robi
c di
gest
er p
roje
ct w
ith a
rene
wab
le n
atur
al g
as in
frast
ruct
ure,
sele
cted
yea
rs.
2012
2014
2016
2018
2020
2022
2024
2026
2028
2030
2032
Elec
tric
ity
Prod
uced
/Rat
e
El
ectr
icity
Gen
erat
ion
(kW
h)8,
409,
600
00
00
00
00
00
El
ectr
icity
Use
d in
Dig
este
r 67
2,76
80
00
00
00
00
0
N
et E
lect
ricity
Ava
ilabl
e fo
r Sal
e7,
736,
832
00
00
00
00
00
El
ectr
icity
Pur
chas
e Pr
ice
(per
kW
h)$0
.065
4$0
.000
0$0
.000
0$0
.000
0$0
.000
0$0
.000
0$0
.000
0$0
.000
0$0
.000
0$0
.000
0$0
.000
0
Re
new
able
Ene
rgy
Cert
ifica
te P
rice
(per
kW
h)$0
.010
0$0
.000
0$0
.000
0$0
.000
0$0
.000
0$0
.000
0$0
.000
0$0
.000
0$0
.000
0$0
.000
0$0
.000
0
Proj
ecte
d Re
venu
e El
ectr
icit
y
El
ectr
icity
Sal
es$5
06,1
44$0
$0$0
$0$0
$0$0
$0$0
$0
Re
new
able
Ene
rgy
Cert
ifica
tes
$77,
368
$0$0
$0$0
$0$0
$0$0
$0$0
W
ashi
ngto
n St
ate
Rene
wab
le E
nerg
y In
cent
ive
$5,0
00$0
$0$0
$0$0
$0$0
$0$0
$0
Su
btot
al E
lect
ricity
Rev
enue
s $5
88,5
12$0
$0$0
$0$0
$0$0
$0$0
$0
Rene
wab
le N
atur
al G
as
N
atur
al G
as P
rodu
ced
(MM
BTU
per
yea
r)0
158,
341
158,
341
158,
341
158,
341
158,
341
158,
341
158,
341
158,
341
158,
341
158,
341
Su
mas
Cas
cade
Pric
e (p
er M
MBT
U)
$3.2
7$3
.27
$3.2
7$3
.27
$3.2
7$3
.27
$3.2
7$3
.27
$3.2
7$3
.27
$3.2
7
Su
btot
al N
atur
al G
as R
even
ues
$0$5
17,7
75$5
17,7
75$5
17,7
75$5
17,7
75$5
17,7
75$5
17,7
75$5
17,7
75$5
17,7
75$5
17,7
75$5
17,7
75
Fibe
r Sal
es
Cu
bic
Yard
s Pe
r Yea
r42
,000
42,0
0042
,000
42,0
0042
,000
42,0
0042
,000
42,0
0042
,000
42,0
0042
,000
Pr
ice
per c
ubic
yar
d (m
ediu
m p
rice)
$7.0
0$7
.00
$7.0
0$7
.00
$7.0
0$7
.00
$7.0
0$7
.00
$7.0
0$7
.00
$7.0
0
Su
btot
al F
iber
Rev
enue
s$2
94,0
00$2
94,0
00$2
94,0
00$2
94,0
00$2
94,0
00$2
94,0
00$2
94,0
00$2
94,0
00$2
94,0
00$2
94,0
00$2
94,0
00
Nut
rien
t Sal
es
To
ns P
er Y
ear
500
1,00
01,
000
1,00
01,
000
1,00
01,
000
1,00
01,
000
1,00
01,
000
Pr
ice/
Ton
(med
ium
pric
e)$7
5.00
$75.
00$7
5.00
$75.
00$7
5.00
$75.
00$7
5.00
$75.
00$7
5.00
$75.
00$7
5.00
Su
btot
al N
utrie
nt R
even
ues
$37,
500
$75,
000
$75,
000
$75,
000
$75,
000
$75,
000
$75,
000
$75,
000
$75,
000
$75,
000
$75,
000
Carb
on C
redi
ts$1
42,4
46$1
63,6
88$1
68,6
88$1
68,6
88$1
68,6
88$1
68,6
88$0
$0$0
$0$0
TOTA
L RE
VEN
UE
$1,0
62,4
57$1
,050
,463
$1,0
55,4
63$1
,055
,463
$1,0
55,4
63$1
,055
,463
$886
,775
$886
,775
$886
,775
$886
,775
$886
,775
Ope
ratio
n Co
sts*
$283
,270
$297
,551
$297
,551
$297
,551
$297
,551
$297
,551
$297
,551
$297
,551
$297
,551
$297
,551
$297
,551
TOTA
L CO
ST$2
83,2
70$2
97,5
51$2
97,5
51$2
97,5
51$2
97,5
51$2
97,5
51$2
97,5
51$2
97,5
51$2
97,5
51$2
97,5
51$2
97,5
51
NET
REV
ENU
E$7
79,1
88$7
52,9
12$7
57,9
12$7
57,9
12$7
57,9
12$7
57,9
12$5
89,2
24$5
89,2
24$5
89,2
24$5
89,2
24$5
89,2
24
TOTA
L CO
ST$3
3,00
0$3
3,00
0$3
3,00
0$3
3,00
0$3
3,00
0$3
3,00
0$3
3,00
0$3
3,00
0$3
3,00
0$3
3,00
0$3
3,00
0
NET
REV
ENU
E$4
70,8
63$5
34,9
58$5
39,9
58$5
39,9
58$5
39,9
58$5
39,9
58$3
36,0
00$3
36,0
00$3
36,0
00$3
36,0
00$3
36,0
00
*Op
erat
ion
cos
ts i
ncl
ud
e la
bor,
an
d m
ain
ten
ance
an
d r
epai
r of
th
e d
iges
ter
and
scr
ubb
ing
tech
nol
ogy
(use
d t
o re
mov
e im
pu
riti
es f
rom
met
han
e to
pro
du
ce p
ipel
ine
qu
alit
y ga
s), m
ain
ten
ance
of
the
pip
elin
e, a
nd
in
ject
ion
of
RN
G t
o th
e p
ipel
ine
(del
iver
y ch
arge
).

14
Appe
ndix
Tabl
e 4.
Rev
enue
s and
ope
ratio
nal c
osts
(in
2012
cons
tant
dol
lars
) for
the
anae
robi
c di
gest
er p
roje
ct w
ith a
rene
wab
le n
atur
al g
as (R
NG
) inf
rast
ruct
ure
unde
r RN
G p
rice
scen
ario
1 (c
omm
odity
val
ue p
lus t
he R
IN v
alue
), se
lect
ed y
ears
.
2012
2014
2016
2018
2020
2022
2024
2026
2028
2030
2032
Elec
tric
ity
Prod
uced
/Rat
e
El
ectr
icity
Gen
erat
ion
(kW
h)8,
409,
600
00
00
00
00
00
El
ectr
icity
Use
d in
Dig
este
r 67
2,76
80
00
00
00
00
0
N
et E
lect
ricity
Ava
ilabl
e fo
r Sal
e7,
736,
832
00
00
00
00
00
El
ectr
icity
Pur
chas
e Pr
ice
(per
kW
h)$0
.065
4$0
.000
0$0
.000
0$0
.000
0$0
.000
0$0
.000
0$0
.000
0$0
.000
0$0
.000
0$0
.000
0$0
.000
0
Re
new
able
Ene
rgy
Cert
ifica
te P
rice
(per
kW
h)$0
.010
0$0
.000
0$0
.000
0$0
.000
0$0
.000
0$0
.000
0$0
.000
0$0
.000
0$0
.000
0$0
.000
0$0
.000
0
Proj
ecte
d Re
venu
e El
ectr
icit
y
El
ectr
icity
Sal
es$5
06,1
44$0
$0$0
$0$0
$0$0
$0$0
$0
Re
new
able
Ene
rgy
Cert
ifica
tes
$77,
368
$0$0
$0$0
$0$0
$0$0
$0$0
W
ashi
ngto
n St
ate
Rene
wab
le E
nerg
y In
cent
ive
$5,0
00$0
$0$0
$0$0
$0$0
$0$0
$0
Su
btot
al E
lect
ricity
Rev
enue
s$5
88,5
12$0
$0$0
$0$0
$0$0
$0$0
$0
Rene
wab
le N
atur
al G
as
N
atur
al G
as P
rodu
ced
(MM
BTU
per
yea
r)0
158,
341
158,
341
158,
341
158,
341
158,
341
158,
341
158,
341
158,
341
158,
341
158,
341
Su
mas
Cas
cade
Pric
e (p
er M
MBT
U)
$3.2
7$3
.27
$3.2
7$3
.27
$3.2
7$3
.27
$3.2
7$3
.27
$3.2
7$3
.27
$3.2
7
Su
btot
al N
atur
al G
as R
even
ues a
t Com
mod
ity P
rice
$0$5
17,7
75$5
17,7
75$5
17,7
75$5
17,7
75$5
17,7
75$5
17,7
75$5
17,7
75$5
17,7
75$5
17,7
75$5
17,7
75
N
o. o
f RIN
S0
2,05
6,37
72,
056,
377
2,05
6,37
72,
056,
377
2,05
6,37
72,
056,
377
2,05
6,37
72,
056,
377
2,05
6,37
72,
056,
377
RI
N P
rice
($/R
IN)
$0.0
0$0
.74
$0.7
4$0
.74
$0.7
4$0
.74
$0.7
4$0
.74
$0.7
4$0
.74
$0.7
4
RI
N T
rans
actio
n Fe
e$0
$51,
409
$51,
409
$51,
409
$51,
409
$51,
409
$51,
409
$51,
409
$51,
409
$51,
409
$51,
409
Su
btot
al N
atur
al G
as R
even
ues f
rom
RIN
$0$1
,470
,310
$1,4
70,3
10$1
,470
,310
$1,4
70,3
10$1
,470
,310
$1,4
70,3
10$1
,470
,310
$1,4
70,3
10$1
,470
,310
$1,4
70,3
10
Fibe
r Sal
es
Cu
bic
Yard
s Pe
r Yea
r42
,000
42,0
0042
,000
42,0
0042
,000
42,0
0042
,000
42,0
0042
,000
42,0
0042
,000
Pr
ice
per c
ubic
yar
d (m
ediu
m p
rice)
$7.0
0$7
.00
$7.0
0$7
.00
$7.0
0$7
.00
$7.0
0$7
.00
$7.0
0$7
.00
$7.0
0
Su
btot
al F
iber
Rev
enue
s$2
94,0
00$2
94,0
00$2
94,0
00$2
94,0
00$2
94,0
00$2
94,0
00$2
94,0
00$2
94,0
00$2
94,0
00$2
94,0
00$2
94,0
00
Nut
rien
t Sal
es
To
ns P
er Y
ear
500
1,00
01,
000
1,00
01,
000
1,00
01,
000
1,00
01,
000
1,00
01,
000
Pr
ice/
Ton
(med
ium
pric
e)$7
5.00
$75.
00$7
5.00
$75.
00$7
5.00
$75.
00$7
5.00
$75.
00$7
5.00
$75.
00$7
5.00
Su
btot
al N
utrie
nt R
even
ues
$37,
500
$75,
000
$75,
000
$75,
000
$75,
000
$75,
000
$75,
000
$75,
000
$75,
000
$75,
000
$75,
000
Carb
on C
redi
ts$1
42,4
46$1
63,6
88$1
68,6
88$1
68,6
88$1
68,6
88$1
68,6
88$0
$0$0
$0$0
TOTA
L RE
VEN
UE
$1,0
62,4
57$2
,520
,773
$2,5
25,7
73$2
,525
,773
$2,5
25,7
73$2
,525
,773
$2,3
57,0
85$2
,357
,085
$2,3
57,0
85$2
,357
,085
$2,3
57,0
85
Ope
rati
on C
osts
*$2
83,2
70$2
97,5
51$2
97,5
51$2
97,5
51$2
97,5
51$2
97,5
51$2
97,5
51$2
97,5
51$2
97,5
51$2
97,5
51$2
97,5
51
TOTA
L CO
ST$2
83,2
70$2
97,5
51$2
97,5
51$2
97,5
51$2
97,5
51$2
97,5
51$2
97,5
51$2
97,5
51$2
97,5
51$2
97,5
51$2
97,5
51
NET
REV
ENU
E$7
79,1
88$2
,223
,222
$2,2
28,2
22$2
,228
,222
$2,2
28,2
22$2
,228
,222
$2,0
59,5
34$2
,059
,534
$2,0
59,5
34$2
,059
,534
$2,0
59,5
34*O
per
atio
n c
osts
in
clu
de
labo
r, a
nd
mai
nte
nan
ce a
nd
rep
air
of t
he
dig
este
r an
d s
cru
bbin
g te
chn
olog
y (u
sed
to
rem
ove
imp
uri
ties
fro
m m
eth
ane
to p
rod
uce
pip
elin
e q
ual
ity
gas)
, mai
nte
nan
ce o
f th
e p
ipel
ine,
an
d i
nje
ctio
n o
f R
NG
to
the
pip
elin
e (d
eliv
ery
char
ge).

15
Appe
ndix
Tabl
e 5.
Rev
enue
s and
ope
ratio
nal c
osts
(in
2012
cons
tant
dol
lars
) for
the
anae
robi
c di
gest
er p
roje
ct w
ith a
rene
wab
le n
atur
al g
as (R
NG
) inf
rast
ruct
ure
unde
r RN
G p
rice
scen
ario
2 (r
etai
l pric
e of
com
pres
sed
natu
ral g
as p
lus t
he R
IN v
alue
), se
lect
ed y
ears
.
2012
2014
2016
2018
2020
2022
2024
2026
2028
2030
2032
Elec
tric
ity
Prod
uced
/Rat
e
El
ectr
icity
Gen
erat
ion
(kW
h)8,
409,
600
00
00
00
00
00
El
ectr
icity
Use
d in
Dig
este
r 67
2,76
80
00
00
00
00
0
N
et E
lect
ricity
Ava
ilabl
e fo
r Sal
e7,
736,
832
00
00
00
00
00
El
ectr
icity
Pur
chas
e Pr
ice
(per
kW
h)$0
.065
4$0
.000
0$0
.000
0$0
.000
0$0
.000
0$0
.000
0$0
.000
0$0
.000
0$0
.000
0$0
.000
0$0
.000
0
Re
new
able
Ene
rgy
Cert
ifica
te P
rice
(per
kW
h)$0
.010
0$0
.000
0$0
.000
0$0
.000
0$0
.000
0$0
.000
0$0
.000
0$0
.000
0$0
.000
0$0
.000
0$0
.000
0
Proj
ecte
d Re
venu
e El
ectr
icit
y
El
ectr
icity
Sal
es$5
06,1
44$0
$0$0
$0$0
$0$0
$0$0
$0
Re
new
able
Ene
rgy
Cert
ifica
tes
$77,
368
$0$0
$0$0
$0$0
$0$0
$0$0
W
ashi
ngto
n St
ate
Rene
wab
le E
nerg
y In
cent
ive
$5,0
00$0
$0$0
$0$0
$0$0
$0$0
$0
Su
btot
al E
lect
ricity
Rev
enue
s$5
88,5
12$0
$0$0
$0$0
$0$0
$0$0
$0
Rene
wab
le N
atur
al G
as
Co
mpr
esse
d N
atur
al G
as (G
GE)
01,
190,
503
1,19
0,50
31,
190,
503
1,19
0,50
31,
190,
503
1,19
0,50
31,
190,
503
1,19
0,50
31,
190,
503
1,19
0,50
3
Re
tail
Pric
e ($
/GG
E)$0
.00
$1.8
5$1
.85
$1.8
5$1
.85
$1.8
5$1
.85
$1.8
5$1
.85
$1.8
5$1
.85
Su
btot
al C
ompr
esse
d N
atur
al G
as R
even
ues
$0$2
,202
,430
$2,2
02,4
30$2
,202
,430
$2,2
02,4
30$2
,202
,430
$2,2
02,4
30$2
,202
,430
$2,2
02,4
30$2
,202
,430
$2,2
02,4
30
N
o. o
f RIN
S0
2,05
6,37
72,
056,
377
2,05
6,37
72,
056,
377
2,05
6,37
72,
056,
377
2,05
6,37
72,
056,
377
2,05
6,37
72,
056,
377
RI
N P
rice
($/R
IN)
$0.0
0$0
.74
$0.7
4$0
.74
$0.7
4$0
.74
$0.7
4$0
.74
$0.7
4$0
.74
$0.7
4
RI
N T
rans
actio
n Fe
e$0
$51,
409
$51,
409
$51,
409
$51,
409
$51,
409
$51,
409
$51,
409
$51,
409
$51,
409
$51,
409
Su
btot
al C
ompr
esse
d Na
tura
l Gas
Rev
enue
s fro
m R
IN$0
$1,4
70,3
10$1
,470
,310
$1,4
70,3
10$1
,470
,310
$1,4
70,3
10$1
,470
,310
$1,4
70,3
10$1
,470
,310
$1,4
70,3
10$1
,470
,310
Fibe
r Sal
es
Cu
bic
Yard
s Pe
r Yea
r42
,000
42,0
0042
,000
42,0
0042
,000
42,0
0042
,000
42,0
0042
,000
42,0
0042
,000
Pr
ice
per c
ubic
yar
d (m
ediu
m p
rice)
$7.0
0$7
.00
$7.0
0$7
.00
$7.0
0$7
.00
$7.0
0$7
.00
$7.0
0$7
.00
$7.0
0
Su
btot
al F
iber
Rev
enue
s$2
94,0
00$2
94,0
00$2
94,0
00$2
94,0
00$2
94,0
00$2
94,0
00$2
94,0
00$2
94,0
00$2
94,0
00$2
94,0
00$2
94,0
00
Nut
rien
t Sal
es
To
ns P
er Y
ear
500
1,00
01,
000
1,00
01,
000
1,00
01,
000
1,00
01,
000
1,00
01,
000
Pr
ice/
Ton
(med
ium
pric
e)$7
5.00
$75.
00$7
5.00
$75.
00$7
5.00
$75.
00$7
5.00
$75.
00$7
5.00
$75.
00$7
5.00
Su
btot
al N
utrie
nt R
even
ues
$37,
500
$75,
000
$75,
000
$75,
000
$75,
000
$75,
000
$75,
000
$75,
000
$75,
000
$75,
000
$75,
000
Carb
on C
redi
ts$1
42,4
46$1
63,6
88$1
68,6
88$1
68,6
88$1
68,6
88$1
68,6
88$0
$0$0
$0$0
TOTA
L RE
VEN
UE
$1,0
62,4
57$4
,205
,428
$4,2
10,4
28$4
,210
,428
$4,2
10,4
28$4
,210
,428
$4,0
41,7
40$4
,041
,740
$4,0
41,7
40$4
,041
,740
$4,0
41,7
40
Ope
rati
on C
osts
*$2
83,2
70$7
14,2
27$7
14,2
27$7
14,2
27$7
14,2
27$7
14,2
27$7
14,2
27$7
14,2
27$7
14,2
27$7
14,2
27$7
14,2
27
TOTA
L CO
ST$2
83,2
70$7
14,2
27$7
14,2
27$7
14,2
27$7
14,2
27$7
14,2
27$7
14,2
27$7
14,2
27$7
14,2
27$7
14,2
27$7
14,2
27
NET
REV
ENU
E$7
79,1
88$3
,491
,201
$3,4
96,2
01$3
,496
,201
$3,4
96,2
01$3
,496
,201
$3,3
27,5
13$3
,327
,513
$3,3
27,5
13$3
,327
,513
$3,3
27,5
13
*Op
erat
ion
cos
ts i
ncl
ud
e la
bor,
an
d m
ain
ten
ance
an
d r
epai
r of
th
e d
iges
ter
and
scr
ubb
ing
tech
nol
ogy
(use
d t
o re
mov
e im
pu
riti
es f
rom
met
han
e to
pro
du
ce p
ipel
ine
qu
alit
y ga
s), m
ain
ten
ance
of
the
pip
elin
e, a
nd
in
ject
ion
of
RN
G t
o th
e p
ipel
ine
(del
iver
y ch
arge
).

By Suzette P. Galinato, Research Associate, IMPACT Center, School of Economic Sciences, Washington State University; Chad E. Kruger, Director, Center for Sustaining Agriculture and Natural Resources, Washington State University; and Craig S. Frear, Assistant Professor, Department of Biological Systems Engineering, Washington State University.
Copyright 2015 Washington State University
WSU Extension bulletins contain material written and produced for public distribution. Alternate formats of our educational materials are available upon request for persons with disabilities. Please contact Washington State University Extension for more information.
You may download copies of this and other publications from WSU Extension at http://pubs.wsu.edu.
Issued by Washington State University Extension and the U.S. Department of Agriculture in furtherance of the Acts of May 8 and June 30, 1914. Extension programs and policies are consistent with federal and state laws and regulations on nondiscrimination regarding race, sex, religion, age, color, creed, and national or ethnic origin; physical, mental, or sensory disability; marital status or sexual orientation; and status as a Viet-nam-era or disabled veteran. Evidence of noncompliance may be reported through your local WSU Extension office. Trade names have been used to simplify information; no endorsement is intended. Published February 2015.
EM090E


