o Liquidity Measurement Ratios (LMR) Liquidity ratios attempt to measure a company's ability to pay off its short-term debt obligations. In general, the greater the coverage of liquid assets to short-term liabilities the better as it is a clear signal that a company can pay its debts that are coming due in the near future and still fund its ongoing operations. On the other hand, a company with a low coverage rate should raise a red flag for investors as it may be a sign that the company will have difficulty meeting running its operations, as well as meeting its obligations. o Profitability Indicator Ratios In the income statement , there are four levels of profit or profit margins - gross profit , operating profit , pretax profit and net profit. The term "margin" can apply to the absolute number for a given profit level and/or the number as a percentage of net sales/revenues. Profit margin analysis uses the percentage calculation to provide a comprehensive measure of a company's profitability on a historical basis (3-5 years) and in comparison to peer companies and industry benchmarks. Basically, it is the amount of profit (at the gross, operating, pretax or net income level) generated by the company as a percent of the sales generated. The objective of margin analysis is to detect consistency or positive/negative trends in a company's earnings. Positive profit margin analysis translates into positive investment
Transcript
o Liquidity Measurement Ratios (LMR)
Liquidity ratios attempt to measure a company's ability to pay off its short-term debt obligations.
In general, the greater the coverage of liquid assets to short-term liabilities the better as it is a clear signal that a company can pay its debts that are coming due in the near future and still fund its ongoing operations. On the other hand, a company with a low coverage rate should raise a red flag for investors as it may be a sign that the company will have difficulty meeting running its operations, as well as meeting its obligations.
o Profitability Indicator Ratios
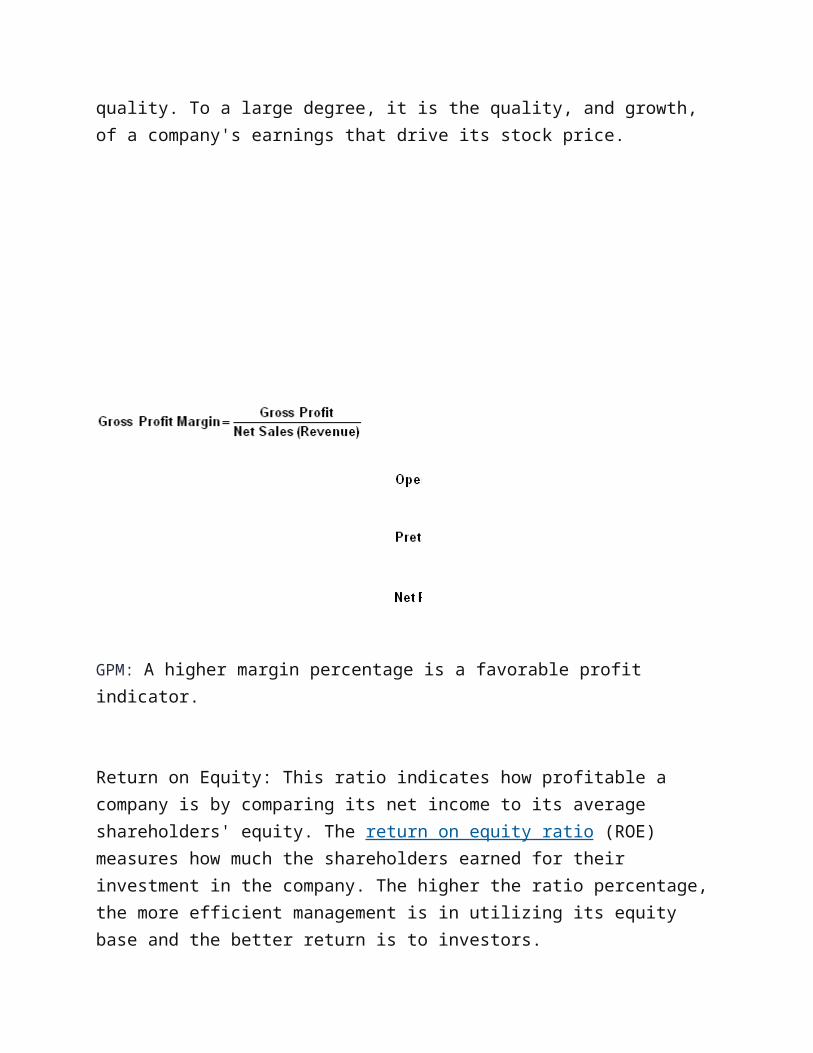
In the income statement, there are four levels of profit or profit margins - gross profit, operating profit, pretax profit and net profit. The term "margin" can apply to the absolute number for a given profit level and/or the number as a percentage of net sales/revenues. Profit margin analysis uses the percentage calculation to provide a comprehensive measure of a company's profitability on a historical basis (3-5 years) and in comparison to peer companies and industry benchmarks.
Basically, it is the amount of profit (at the gross, operating, pretax or net income level) generated by the company as a percent of the sales generated. The objective of margin analysis is to detect consistency or positive/negative trends in a company's earnings. Positive profit margin analysis translates into positive investment quality. To a large degree, it is the quality, and growth, of a company's earnings that drive its stock price.
GPM: A higher margin percentage is a favorable profit indicator.
Return on Equity: This ratio indicates how profitable a company is by comparing its net income to its average shareholders' equity. The return on equity ratio (ROE) measures how much the shareholders earned for their investment in the company. The higher the ratio percentage, the more efficient management is in utilizing its equity base and the better return is to investors.
The debt ratio compares a company's total debt to its total assets, which is used to gain a general idea as to the amount of leverage being used by a company. A low percentage means that the company is less dependent on leverage, i.e., money borrowed from and/or owed to others. The lower the percentage, the less leverage a company is using and the stronger its equity position. In general, the higher the ratio, the more risk that company is considered to have taken on.
What is ratio analysis? The Balance Sheet and the Statement of Income are essential, but they are only the starting point for successful financial management. Apply Ratio Analysis to Financial Statements to analyze the success, failure, and progress of your business.
Ratio Analysis enables the business owner/manager to spot trends in a business and to compare its performance and condition with the average performance of similar businesses in the same industry. To do this compare your ratios with the average of businesses similar to yours and compare your own ratios for several successive years, watching especially for any unfavorable trends that may be starting. Ratio analysis may provide the all-important early warning indications that allow you to solve your business problems before your business is destroyed by them.
Balance Sheet Ratio Analysis Formula
Important Balance Sheet Ratios measure liquidity and solvency (a business's ability to pay its bills as they come due) and leverage (the extent to which the business is dependent on creditors' funding). They include the following ratios:
Liquidity Ratios
These ratios indicate the ease of turning assets into cash. They include the Current Ratio, Quick Ratio, and Working Capital.
Current Ratios. The Current Ratio is one of the best known measures of financial strength. It is figured as shown below:
Current Ratio =
Total Current Assets____________________Total Current Liabilities
The main question this ratio addresses is: "Does your business have enough current assets to meet the payment schedule of its current debts with a margin of safety for possible losses in current assets, such as inventory shrinkage or collectable accounts?" A generally acceptable current ratio is 2 to 1. But whether or not a specific ratio
is satisfactory depends on the nature of the business and the characteristics of its current assets and liabilities. The minimum acceptable current ratio is obviously 1:1, but that relationship is usually playing it too close for comfort.
If you decide your business's current ratio is too low, you may be able to raise it by:
Paying some debts. Increasing your current assets from loans or other borrowings
with a maturity of more than one year. Converting non-current assets into current assets. Increasing your current assets from new equity contributions. Putting profits back into the business.
Quick Ratios. The Quick Ratio is sometimes called the "acid-test" ratio and is one of the best measures of liquidity. It is figured as shown below:
Quick Ratio =
Cash + Government Securities + Receivables______________________________________ Total Current Liabilities
The Quick Ratio is a much more exacting measure than the Current Ratio. By excluding inventories, it concentrates on the really liquid assets, with value that is fairly certain. It helps answer the question: "If all sales revenues should disappear, could my business meet its current obligations with the readily convertible `quick' funds on hand?"
An acid-test of 1:1 is considered satisfactory unless the majority of your "quick assets" are in accounts receivable, and the pattern of accounts receivable collection lags behind the schedule for paying current liabilities.
Working Capital. Working Capital is more a measure of cash flow than a ratio. The result of this calculation must be a positive number. It is calculated as shown below:
Working Capital = Total Current Assets - Total Current Liabilities
Bankers look at Net Working Capital over time to determine a company's ability to weather financial crises. Loans are often tied to minimum working capital requirements.
AÂ general observation about these three Liquidity Ratios is that the higher they are the better, especially if you are relying to any significant extent on creditor money to finance assets.
Leverage Ratio
This Debt/Worth or Leverage Ratio indicates the extent to which the business is reliant on debt financing (creditor money versus owner's equity):
Debt/Worth Ratio =
Total Liabilities _______________ Net Worth
Generally, the higher this ratio, the more risky a creditor will perceive its exposure in your business, making it correspondingly harder to obtain credit.
Income Statement Ratio Analysis
The following important State of Income Ratios measure profitability:
Gross Margin Ratio
This ratio is the percentage of sales dollars left after subtracting the cost of goods sold from net sales. It measures the percentage of sales dollars remaining (after obtaining or manufacturing the goods sold) available to pay the overhead expenses of the company.
Comparison of your business ratios to those of similar businesses will reveal the relative strengths or weaknesses in your business. The Gross Margin Ratio is calculated as follows:
Gross Margin Ratio =
Gross Profit_______________Net Sales
(Gross Profit = Net Sales - Cost of Goods Sold)
Net Profit Margin Ratio
This ratio is the percentage of sales dollars left after subtracting the Cost of Goods sold and all expenses, except income taxes. It provides a good opportunity to compare your company's "return on sales" with the performance of other companies in your industry. It is calculated before income tax because tax rates and tax liabilities vary from company to company for a wide variety of reasons, making comparisons after taxes much more difficult. The Net Profit Margin Ratio is calculated as follows:
Net Profit Margin Ratio =
Net Profit Before Tax_____________________Net Sales
Management Ratios
Other important ratios, often referred to as Management Ratios, are also derived from Balance Sheet and Statement of Income information.
Inventory Turnover Ratio
This ratio reveals how well inventory is being managed. It is important because the more times inventory can be turned in a given operating cycle, the greater the profit. The Inventory Turnover Ratio is calculated as follows:
Inventory Turnover Ratio =
Net Sales___________________________Average Inventory at Cost
Accounts Receivable Turnover Ratio
This ratio indicates how well accounts receivable are being collected. If receivables are not collected reasonably in accordance with their terms, management should rethink its collection policy. If receivables are excessively slow in being converted to cash, liquidity could be severely impaired. The Accounts Receivable Turnover Ratio is calculated as follows:
Net Credit Sales/Year__________________ = Daily Credit Sales365 Days/Year
This measures how efficiently profits are being generated from the assets employed in the business when compared with the ratios of firms in a similar business. A low ratio in comparison with industry averages indicates an inefficient use of business assets. The Return on Assets Ratio is calculated as follows:
Return on Assets =
Net Profit Before Tax________________________Total Assets
Return on Investment (ROI) Ratio.
The ROI is perhaps the most important ratio of all. It is the percentage of return on funds invested in the business by its owners. In short, this ratio tells the owner whether or not all the effort put into the business has been worthwhile. If the ROI is less than the rate of return on an alternative, risk-free investment such as a bank savings account, the owner may be wiser to sell the company, put the money in such a savings instrument, and avoid
the daily struggles of small business management. The ROI is calculated as follows:
Return on Investment =
Net Profit before Tax____________________Net Worth
These Liquidity, Leverage, Profitability, and Management Ratios allow the business owner to identify trends in a business and to compare its progress with the performance of others through data published by various sources. The owner may thus determine the business's relative strengths and weaknesses.
Analyzing Your Financial Ratios
Overview
Any successful business owner is constantly evaluating the performance of his or her company, comparing it with the company's historical figures, with its industry competitors, and even with successful businesses from other industries. To complete a thorough examination of your company's effectiveness, however, you need to look at more than just easily attainable numbers like sales, profits,
and total assets. You must be able to read between the lines of your financial statements and make the seemingly inconsequential numbers accessible and comprehensible.
This massive data overload could seem staggering. Luckily, there are many well-tested ratios out there that make the task a bit less daunting. Comparative ratio analysis helps you identify and quantify your company's strengths and weaknesses, evaluate its financial position, and understand the risks you may be taking.
As with any other form of analysis, comparative ratio techniques aren't definitive and their results shouldn't be viewed as gospel. Many off-the-balance-sheet factors can play a role in the success or failure of a company. But, when used in concert with various other business evaluation processes, comparative ratios are invaluable.
This discussion contains descriptions and examples of the eight major types of ratios used in financial analysis: Income, Profitability, Liquidity, Working Capital, Bankruptcy, Long-Term Analysis, Coverage, and Leverage.
Outline:I. Purposes and Considerations of Ratios and Ratio Analysis
II. Types of Ratios
III. Income Ratios
IV. Profitability Ratios
V. Net Operating Profit Ratios
VI. Liquidity Ratios
VII. Working Capital Ratios
VIII. Bankruptcy Ratios
IX. Long-Term Analysis
X. Coverage Ratios
XI. Total Coverage Ratios
XII. Leverage Ratios
XIII. Common-Size Statement
1. Purposes and Considerations of Ratios and Ratio Analysis
Ratios are highly important profit tools in financial analysis that help financial analysts implement plans that improve profitability, liquidity, financial structure, reordering, leverage, and interest coverage. Although ratios report mostly on past performances, they can be predictive too, and provide lead indications of potential problem areas.
Ratio analysis is primarily used to compare a company's financial figures over a period of time, a method sometimes called trend analysis. Through trend analysis, you can identify trends, good and bad, and adjust your business practices accordingly. You can also see how your ratios stack up against other businesses, both in and out of your industry.
There are several considerations you must be aware of when comparing ratios from one financial period to another or when comparing the financial ratios of two or more companies.
If you are making a comparative analysis of a company's financial statements over a certain period of time, make an appropriate allowance for any changes in accounting policies that occurred during the same time span.
When comparing your business with others in your industry, allow for any material differences in accounting policies between your company and industry norms.
When comparing ratios from various fiscal periods or companies, inquire about the types of accounting policies used. Different accounting methods can result in a wide variety of reported figures.
Determine whether ratios were calculated before or after adjustments were made to the balance sheet or income statement, such as non-recurring items and inventory or pro forma adjustments. In many cases, these adjustments can significantly affect the ratios.
Carefully examine any departures from industry norms.
2. Types of Ratios
Income Profitability Liquidity Working Capital Bankruptcy Long-Term Analysis Coverage Leverage
3. Income Ratios
Obviously, an increase in sales will necessitate more operating assets at some point (sales may rise without additional investment within a given range, however); conversely, an inadequate sales volume may call for reduced investment. Turnover of Total Operating Assets or sales to investment in total operating assets tracks over-investment in operating assets.
Note: This ratio does not measure profitability. Remember, over-investment may result in a lack of adequate profits.
Net Sales to Tangible Net Worth
This ratio indicates whether your investment in the business is adequately proportionate to your sales volume. It may also uncover potential credit or management problems, usually called "overtrading" and "undertrading."
Overtrading, or excessive sales volume transacted on a thin margin of investment, presents a potential problem with creditors. Overtrading can come from considerable management skill, but outside creditors must furnish more funds to carry on daily operations.
Undertrading is usually caused by management's poor use of investment money and their general lack of ingenuity, skill or aggressiveness.
*Tangible Net Worth = owner's equity - intangible assets
Gross Margin on Net Sales
By analyzing changes in this figure over several years, you can identify whether it is necessary to examine company policies relating to credit extension, markups (or markdowns), purchasing, or general merchandising (where applicable).
*Gross Margin = net sales - cost of goods sold
Note: An increase in gross margin may result from higher sales, lower cost of goods sold, an increase in the proportionate volume of higher margin products, or any combination of these variables.
Operating Income to Net Sales Ratio
This ratio reveals the profitability of sales resulting from regular business as well as buying, selling, and manufacturing operations.
Note: Operating income derives from ordinary business operations and excludes other revenue (losses), extraordinary items, interest on long-term obligations, and income taxes.
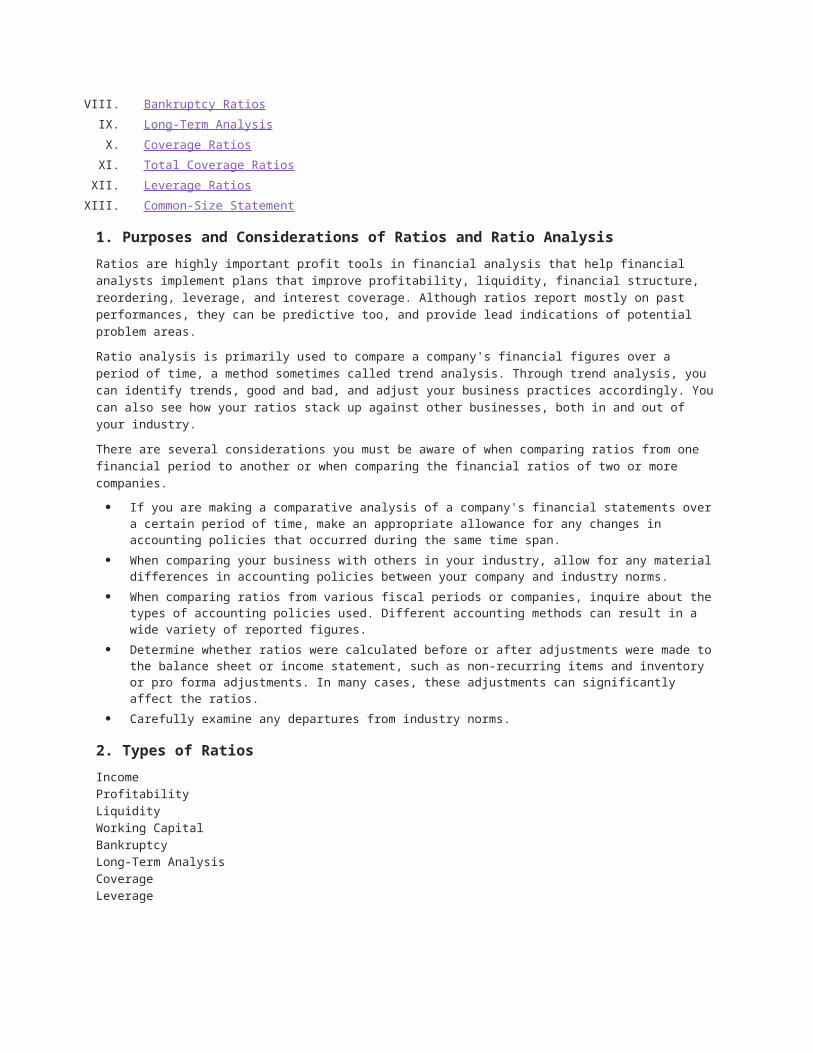
Acceptance Index
Obviously, a high sales volume that comes from just two or three major accounts is much riskier than the same volume coming from a large number of customers. Losing one out of three major accounts is disastrous, while losing one out of 150 is routine. A growing firm should try to spread this risk of dependency through active sales, promotion, and credit departments. Although the quality of customers stems from your general management policy, the quantity of newly opened accounts is a direct reflection on your sales and credit efforts.
Note: This index of effectiveness does not apply to every type of business.
4. Profitability Ratios
Closely linked with income ratios are profitability ratios, which shed light upon the overall effectiveness of management regarding the returns generated on sales and investment.
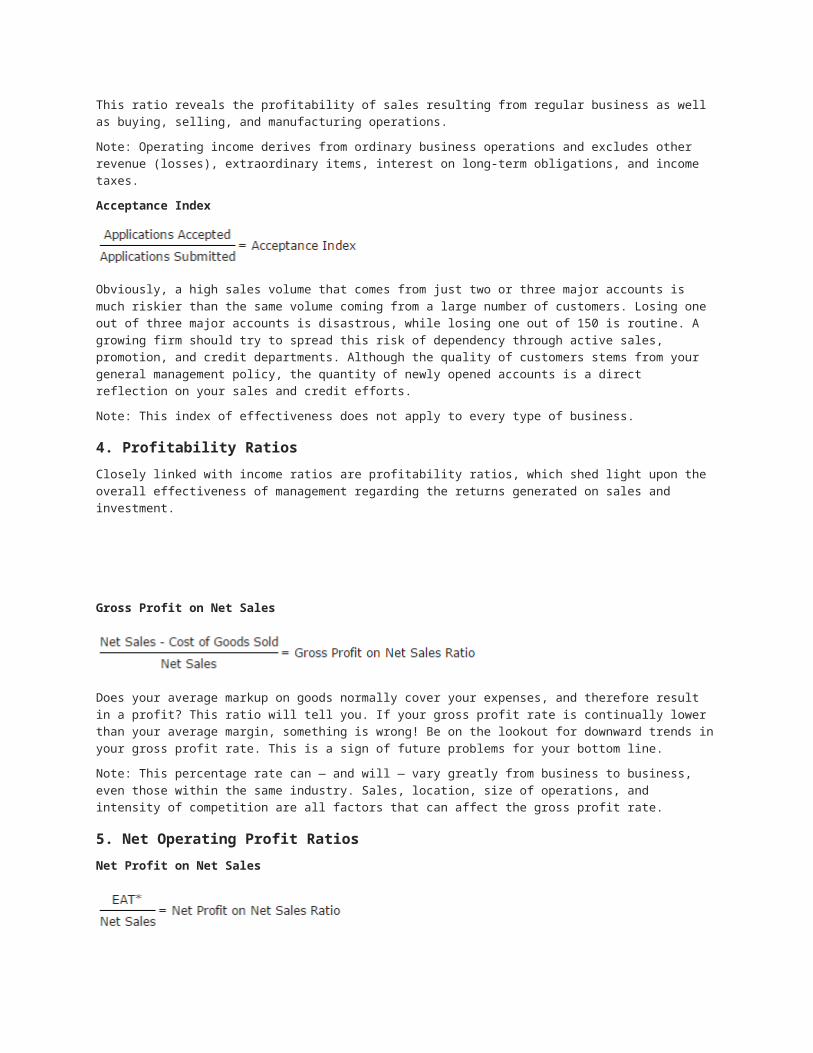
Gross Profit on Net Sales
Does your average markup on goods normally cover your expenses, and therefore result in a profit? This ratio will tell you. If your gross profit rate is continually lower than your average margin, something is wrong! Be on the lookout for downward trends in your gross profit rate. This is a sign of future problems for your bottom line.
Note: This percentage rate can — and will — vary greatly from business to business, even those within the same industry. Sales, location, size of operations, and intensity of competition are all factors that can affect the gross profit rate.
5. Net Operating Profit Ratios
Net Profit on Net Sales
This ratio provides a primary appraisal of net profits related to investment. Once your basic expenses are covered, profits will rise disproportionately greater than sales above the break-even point of operations.
*EAT= earnings after taxes
Note: Sales expenses may be substituted out of profits for other costs to generate even more sales and profits.
Net Profit to Tangible Net Worth
This ratio acts as a complementary appraisal of net profits related to investment. This ratio sizes up the ability of management to earn a return.
Net Operating Profit Rate Return
Your Net Operating Profit Rate of Return ratio is influenced by the methods of financing you utilize. Notice that this ratio employs earnings before interest and taxes, not earnings after taxes. Profits are taken after interest is paid to creditors. A fallacy of omission occurs when creditors support total assets.
Note: If financial charges are great, compute a net operating profit rate of return instead of return on assets ratio. This can provide an important means of comparison.
Management Rate Return
This profitability ratio compares operating income to operating assets, which are defined as the sum of tangible fixed assets and net working capital.
This rate, which you may calculate for your entire company or for each of its divisions or operations, determines whether you have made efficient use of your assets. The percentage should be compared with a target rate of return that you have set for the business.
Earning Power
The Earning Power Ratio combines asset turnover with the net profit rate. That is, Net Sales to Tangible Net Worth (see "Income Ratios") multiplied by Net Profit on Net Sales (see ratio above). Earning power can be increased by heavier trading on assets, by decreasing costs, by lowering the break-even point, or by increasing sales faster than the accompanying rise in costs.
Note: Sales hold the key.
6. Liquidity Ratios
While liquidity ratios are most helpful for short-term creditors/suppliers and bankers, they are also important to financial managers who must meet obligations to suppliers of credit and various government agencies. A complete liquidity ratio analysis can help uncover weaknesses in the financial position of your business.
Current Ratio
Popular since the turn of the century, this test of solvency balances your current assets against your current liabilities. The current ratio will disclose balance sheet changes that net working capital will not.
*Current Assets = net of contingent liabilities on notes receivable
*Current Liabilities = all debt due within one year of statement data
Note: The current ratio reveals your business's ability to meet its current obligations. It should be supplemented with the other ratios listed below, however.
Quick Ratio
Also known as the "acid test," this ratio specifies whether your current assets that could be quickly converted into cash are sufficient to cover current liabilities. Until recently, a Current Ratio of 2:1 was
considered standard. A firm that had additional sufficient quick assets available to creditors was believed to be in sound financial condition.
Note: The Quick Ratio assumes that all assets are of equal liquidity. Receivables are one step closer to liquidity than inventory. However, sales are not complete until the money is in hand.
Absolute Liquidity Ratio
A subsequent innovation in ratio analysis, the Absolute Liquidity Ratio eliminates any unknowns surrounding receivables.
Note: The Absolute Liquidity Ratio only tests short-term liquidity in terms of cash and marketable securities.
Basic Defense Interval
If for some reason all of your revenues were to suddenly cease, the Basic Defense Interval would help determine the number of days your company can cover its cash expenses without the aid of additional financing.
Receivables Turnover
Another indicator of liquidity, Receivables Turnover Ratio can also indicate management's efficiency in employing those funds invested in receivables. Net credit sales, while preferable, may be replaced in the formula with net total sales for an industry-wide comparison.
Note: Closely monitoring this ratio on a monthly or quarterly basis can quickly underscore any change in collections.
Average Collection Period
The Average Collection Period (ACP) is another litmus test for the quality of your receivables business, giving you the average length of the collection period. As a rule, outstanding receivables should not exceed credit terms by 10-15 days. If you allow various types of credit transactions, such as a retail outlet selling both on open credit and installment, then the ACP must be calculated separately for each category.
Note: Discounted notes which create contingent liabilities must be added back into receivables.
Inventory Turnover
Rule of Thumb: Multiply your inventory turnover by your gross margin percentage. If the result is 100 percent or greater, your average inventory is not too high.
7. Working Capital Ratios
Many believe increased sales can solve any business problem. Often, they are correct. However, sales must be built upon sound policies concerning other current assets and should be supported by sufficient working capital.
There are two types of working capital: gross working capital, which is all current assets, and net working capital, which is current assets less current liabilities.
If you find that you have inadequate working capital, you can correct it by lowering sales or by increasing current assets through either internal savings (retained earnings) or external savings (sale of stock). Following are ratios you can use to evaluate your business's net working capital.
Working Capital Ratio
Use "Current Ratio" in the section on "Liquidity Ratios."
This ratio is particularly valuable in determining your business's ability to meet current liabilities.
Working Capital Turnover
This ratio helps you ascertain whether your business is top-heavy in fixed or slow assets, and complements Net Sales to Tangible Net Worth (see "Income Ratios"). A high ratio could signal overtrading.
Note: A high ratio may also indicate that your business requires additional funds to support its financial structure, top-heavy with fixed investments.
Current Debt to Net Worth
Your business should not have debt that exceeds your invested capital. This ratio measures the proportion of funds that current creditors contribute to your operations.
Note: For small businesses a ratio of 60 percent or above usually spells trouble. Larger firms should start to worry at about 75 percent.
Funded Debt to Net Working Capital
Funded debt (long-term liabilities) = all obligations due more than one year from the balance sheet date
Note: Long-term liabilities should not exceed net working capital.
8. Bankruptcy Ratios
Many business owners who have filed for bankruptcy say they wish they had seen some warning signs earlier on in their company's downward spiral. Ratios can help predict bankruptcy before it's too late for a business to take corrective action and for creditors to reduce potential losses. With careful planning, predicted futures can be avoided before they become reality. The first five bankruptcy ratios in this section can detect potential financial problems up to three years prior to bankruptcy. The sixth ratio, Cash Flow to Debt, is known as the best single predictor of failure.
Working Capital to Total Assets
This liquidity ratio, which records net liquid assets relative to total capitalization, is the most valuable indicator of a looming business disaster. Consistent operating losses will cause current assets to shrink relative to total assets.
Note: A negative ratio, resulting from negative net working capital, presages serious problems.
Retained Earnings to Total Assets
New firms will likely have low figures for this ratio, which designates cumulative profitability. Indeed, businesses less than three years old fail most frequently.
Note: A negative ratio portends cloudy skies. However, results can be distorted by manipulated retained earnings (earned surplus) data.
EBIT to Total Assets
How productive are your business's assets? Asset values come from earning power. Therefore, whether or not liabilities exceed the true value of assets (insolvency) depends upon earnings generated.
Note: Maximizing rate of return on assets does not mean the same as maximizing return on equity. Different degrees of leverage affect these separate conclusions.
Sales to Total Assets
See "Turnover Ratio" under "Profitability Ratios."
This ratio, which uncovers management's ability to function in competitive situations while not excluding intangible assets, is inconclusive if studied by itself. But when viewed alongside Working
Capital to Total Assets, Retained Earnings to Total Assets, and EBIT to Total Assets, it can confirm whether your business is in imminent danger.
Note: A result of 200 percent is more reassuring than one of 100.
Equity to Debt
This ratio shows you by how much your business's assets can decline in value before it becomes insolvent.
Note: Those businesses with ratios above 200 percent are safest.
Cash Flow to Debt
Also, refer to "Debt Cash Flow Coverage Ratio" in the section on "Coverage Ratios."
Since debt does not materialize as a liquidity problem until its due date, the closer to maturity, the greater liquidity should be. Other ratios useful in predicting insolvency include Total Debt to Total Assets (see "Leverage Ratios" below) and Current Ratio (see "Liquidity Ratios").
*Cash flow = Net Income + Depreciation
Note: Because there are various accounting techniques of determining depreciation, use this ratio for evaluating your own company and not to compare it to other companies.
9. Long-Term Analysis
Current Assets to Total Debt
This ratio determines the degree of protection linked to short- and long-term debt. More net working capital protects short-term creditors.
Note: A high ratio (significantly above 100 percent) shows that if liquidation losses on current assets are not excessive, long-range debtors can be paid in full out of working capital.
Stockholders' Equity Ratio
Relative financial strength and long-run liquidity are approximated with this calculation. A low ratio points to trouble, while a high ratio suggests you will have less difficulty meeting fixed interest charges and maturing debt obligations.
Total Debt to Net Worth
Rarely should your business's total liabilities exceed its tangible net worth. If it does, creditors assume more risk than stockholders. A business handicapped with heavy interest charges will likely lose out to its better financed competitors.
10. Coverage Ratios
Times Interest Earned
EBIT = earnings before interest and taxes I = dollar amount of interest payable on debt
The Times Interest Earned Ratio shows how many times earnings will cover fixed-interest payments on long-term debt.
11. Total Coverage Ratios
I = interest payments s = payment on principal figured on income after taxes (1 - h)
This ratio goes one step further than Times Interest Earned, because debt obliges the borrower to not only pay interest but make payments on the principal as well.
12. Leverage Ratios
This group of ratios calculates the proportionate contributions of owners and creditors to a business, sometimes a point of contention between the two parties. Creditors like owners to participate to secure their margin of safety, while management enjoys the greater opportunities for risk shifting and multiplying return on equity that debt offers.
Note: Although leverage can magnify earnings, it exaggerates losses.
Equity Ratio
The ratio of common stockholders' equity (including earned surplus) to total capital of the business shows how much of the total capitalization actually comes from the owners.
Note: Residual owners of the business supply slightly more than one half of the total capitalization.
Debt to Equity Ratio
A high ratio here means less protection for creditors. A low ratio, on the other hand, indicates a wider safety cushion (i.e., creditors feel the owner's funds can help absorb possible losses of income and capital).
Total Debt to Tangible Net Worth
If your business is growing, track this ratio for insight into the distributive source of funds used to finance expansion.
Debt Ratio
What percentage of total funds are provided by creditors? Although creditors tend to prefer a lower ratio, management may prefer to lever operations, producing a higher ratio.
Times Interest Earned
13. Common-Size Statement
When performing a ratio analysis of financial statements, it is often helpful to adjust the figures to common-size numbers. To do this, change each line item on a statement to a percentage of the total. For example, on a balance sheet, each figure is shown as a percentage of total assets, and on an income statement, each item is expressed as a percentage of sales.
This technique is quite useful when you are comparing your business to other businesses or to averages from an entire industry, because differences in size are neutralized by reducing all figures to common-size ratios. Industry statistics are frequently published in common-size form.
When comparing your company with industry figures, make sure that the financial data for each company reflect comparable price levels, and that it was developed using comparable accounting methods, classification procedures, and valuation bases.
Such comparisons should be limited to companies engaged in similar business activities. When the financial policies of two companies differ, these differences should be recognized in the evaluation of comparative reports. For example, one company leases its properties while the other purchases such items; one company finances its operations using long-term borrowing while the other relies primarily on funds supplied by stockholders and by earnings. Financial statements for two companies under these circumstances are not wholly comparable.