144

Analysis and Design of Active Queue Management for
TCP-RED Congestion Control Strategies
By
Nabhan Hamadneh
A thesis submitted for the degree of
Doctor of Philosophy
School of Information Technology,
Murdoch University.
November 2012

Declaration
I declare that this thesis is my own account of my research and contains
as its main content work which has not previously been submitted for a
degree at any tertiary education institution.
Signed:
Abstract
This thesis investigates the problems of the Active Queue Management
(AQM) techniques for congestion control in TCP networks. Random Early
Detection (RED) and the RED-based stratgies, which adopt the AQM ap-
proach, are evaluated through simulation. Two main problems of RED, and
its variants, are considered. The �rst problem is the mismach between the
average and actual queue sizes. The second problem is the parameter con�g-
uration. This thesis proposes three new RED-based strategies and simulates
them using the NS-2 simulator. These novel strategies are evaluated and com-
pared with current RED based strategies. The proposed strategies are: Queue
Sectors RED (QSRED), Risk Threshold RED (RTRED) and Weighted RED
(WTRED). The performance of these strategies is evaluated using performance
indicators such as: throughput, link utilization, packet loss and delay.
QSRED divides the router bu�er into equal subsectors and monitors the
queue dynamics. The actual drop probability pa and maximum drop proba-
bility maxp are adjusted depending on the position of the actual and average
queue sizes; q and avg respectively.
Currently, RED maintains a maximum threshold maxth and minimum
threshold minth. The second RED modi�cation, RTRED, adds a third drop-
ping level. This new dropping level is the risk threshold riskth which works
with the actual and average queue sizes to detect the immediate congestion in
gateways. Congestion reaction by RTRED is on time. The reaction to con-
gestion is neither too early, to avoid unfair packet losses, nor too late to avoid
packet dropping from time-outs.
The third proposed RED modi�cation, WTRED, adjusts the weight pa-
rameter wq dynamically, to reduce the mismatch between the average and ac-
i

ABSTRACT ii
tual queue size. WTRED also adjusts the maximum and minimum thresholds,
to increase network throughput and link utilization.
The simulation results demonstrate the shortcomings of RED and RED-
based strategies. The results also show that QSRED, RTRED and WTRED
achieve greater network performance over other strategies.

Contents
Abstract i
List of Figures v
List of Tables vii
Dedication viii
Acknowledgement ix
Publications x
Chapter 1. Introduction 1
1.1. Overview of the congestion problem 1
1.2. Queue management and congestion control 3
1.3. Organization of the thesis 6
Chapter 2. Literature Review 7
2.1. What is congestion? 8
2.2. TCP performance parameters 12
2.3. Acknowledgments 13
2.4. Flow control and sliding window 14
2.5. Traditional source congestion control 14
2.6. TCP variants 16
2.7. Queue management and congestion control 21
2.8. Intermediate router congestion control 22
2.9. Random Early Detection (RED) 23
2.10. RED-based strategies 31
2.11. Problems with AQM 34
2.12. Congestion control approaches other than AQM 35
2.13. Summary 37
Chapter 3. Queue Sectors RED (QSRED) Strategy 38
3.1. Background 38
3.2. The queue sizes mismatch and bu�ers over�ow 40
3.3. E�ective RED (ERED) Strategy 43
iii

CONTENTS iv
3.4. Gaps in ERED's evaluation 54
3.5. QSRED Algorithm 62
3.6. Network Topology 66
3.7. Simulation Results 67
3.8. Summary 71
Chapter 4. A Third Drop Level For RED 73
4.1. Background 74
4.2. Lock Out and Full Queue problems 75
4.3. Adaptive RED 78
4.4. RTRED strategy 80
4.5. Network topology 83
4.6. Simulation and analysis 84
4.7. Summary 94
Chapter 5. RED Performance Enhancement Using The Weight Parameter 95
5.1. Background 96
5.2. RED performance over TD 98
5.3. Flow RED 102
5.4. Re�ned design of RED (FRED) 103
5.5. WTRED design guidelines 108
5.6. Simulation and Discussion 113
5.7. Summary 117
Chapter 6. Conclusions 119
6.1. Proposed solutions 120
6.2. Simulation results 121
6.3. Future work 122
References 124

List of Figures
2.1 Throughput as a function of the o�ered load. 10
2.2 Example of a sliding window in TCP networks. 14
2.3 Slow start and congestion avoidance. 16
2.4 TCP Vegas algorithm. 20
3.1 The mismatch between macroscopic and microscopic of queue length dynamics. 44
3.2 Simulation network topology to evaluate ERED's performance [1]. 49
3.3 Packet loss rate versus number of �ows for 50s simulation time [1]. 51
3.4 Packet loss rate versus number of �ows for 100s simulation time [1]. 51
3.5 Queue length dynamics for ERED [1]. 53
3.6 Queue length dynamics for RED [1]. 53
3.7 Queue length dynamics for SRED [1]. 53
3.8 Queue length dynamics for REM [1]. 53
3.9 Queue length dynamics for LCD [1]. 54
3.10Queue length dynamics for FRED [1]. 54
3.11Compression between ERED's delay and other AQM algorithms [1]. 55
3.12Compression between ERED's jitter and other AQM algorithms [1]. 55
3.13RED gateway sectors 59
3.14ERED sectors 63
3.15The simulator network topology. 66
3.16Network throughput. 67
3.17Network link utilization. 68
3.18Average network delay. 68
3.19Packet loss rate. 68
3.20Network jitter. 69
4.1 Time out and unfair drop scenarios. 81
4.2 RTRED algorithm. 83
v

LIST OF FIGURES vi
4.3 Network topology. 84
4.4 Total percentage of packets dropped for three scenarios. 85
4.5 Percentage values for packets dropped in each drop area. 87
4.6 Drop probability and maxp parameters for scenario I. 88
4.7 Average and actual queue sizes for scenario I. 89
4.8 Drop probability and maxp parameters for scenario II. 90
4.9 Average and actual queue sizes for scenario II. 91
4.10Drop probability and maxp parameters for scenario III. 92
4.11Average and actual queue sizes for scenario III. 93
5.1 Full queue problem of TD strategy. 96
5.2 Lock out problem of TD strategy. 96
5.3 TD global synchronization. 99
5.4 TD global synchronization (x 50 zoom in). 99
5.5 Average and actual queue sizes on a RED gateway. 101
5.6 Congestion window size on a RED gateway. 101
5.7 Congestion window size on a RED gateway without global synchronization. 102
5.8 Dynamic adjustment of FRED's maximum drop probability. 105
5.9 Throughput for a range of weight parameters from 0.001 - 0.1. 112
5.10 Loss rate for a range of weight parameters from 0.001 - 0.1. 112
5.11Delays for a range of weight parameters from 0.001 - 0.1. 113
5.12 Link utilization for a range of weight parameters from 0.001-0.1. 113
5.13WTRED algorithm. 114
5.14 Simulation network topology. 115
5.15Network throughput for RED, FRED and WTRED. 115
5.16Packet loss rate for RED, FRED and WTRED. 116
5.17Average delay for RED, FRED and WTRED. 116
5.18 Link utilization for RED, FRED and WTRED. 117

List of Tables
2.1 Detailed Algorithm of RED. 26
2.2 Blue-RED algorithm. 33
3.1 Detailed algorithm of ERED. 49
3.2 Parameter con�guration for ERED evaluation 50
3.3 Performance evaluation for ERED and other RED variants 50
3.4 Sample of ERED's sectors 63
3.5 QSRED algorithm 65
3.6 Parameter con�guration for ERED and QSRED 66
4.1 Adaptive RED algorithm. 80
4.2 Simulation and analysis (drop levels in packets) 84
4.3 Network performance for the three scenarios. 86
5.1 The maximum drop probability for FRED's sub-phases. 100
5.2 The weight parameter for FRED's sub-phases. 103
5.3 Dynamic adjustment of FRED's weight parameter. 106
5.4 Bu�er sizes for FRED's sub-phases. 114
vii

Dedication
�...My Lord, enable me to be grateful for Your favor which you have
bestowed upon me and upon my parents and to do righteousness of which You
approve. And admit me by Your mercy into (the ranks of) Your righteous
servants.�[An'naml, 19].
I lovingly dedicate this thesis to my brothers, sisters and my �ancee
Sheraz for their love and support. Deepest appreciation to my eldest brother
Safwan for his �nancial support.
viii
Acknowledgement
I owe an immense debt of gratitude to my principle supervisor Dr. David
Murray for his encouragment and advice in preparing my publications and
writing this thesis. I would like to thank my second supervisor Prof. Michael
Dixon who agreed to cooperate; in which supervision of this thesis was greatly
needed. I would like also to thank my third supervisor Assoc/Prof. Peter Cole
for his support from the earliest stage of my Ph.D course.
ix

Publications
• Nabhan Hamadneh, David Murray, Michael Dixon, and Peter Cole:
Dynamic Weight Parameter for the Random Early Detection (RED)
in TCP Networks, International Journal of New Computer Architec-
tures and their Applications, Vol. 2 No. 2, (2012).
This paper presents a new con�guration for the weight parameter in RED. The
dynamic weight parameter enhances the performance of RED. This paper is
edited in Chapter 5.
• Nabhan Hamadneh, David Murray, Michael Dixon, and Peter Cole:
Weighted RED (WTRED) strategy for TCP congestion control, Com-
munications in Computer and Information Science, Vol. 252 No. 2
pp. 421-434, (2011).
This paper presents WTRED strategy for congestion handling. The strategy
uses adjustable weight parameter to avoid the mismatch between the micro-
scopic and macroscopic behaviours of AQM strategies. This paper is edited in
Chapter 5. The paper also won the prize of the best paper in the ICIEIS 2011
conferance, Kuala Lumpur, Malaysia.
• Nabhan Hamadneh, Michael Dixon, Peter Cole, and David Murray: A
third drop level for TCP-RED congestion control strategy, Proceedings
of World Academy of Science, Engineering and Technology, Vol. 81
No. 57 pp. 892-898, (2011).
This paper presents RTRED congestion control strategy. The strategy adds a
third threshold to enhance the performance of RED. This paper is edited as
Chapter 4.
x

PUBLICATIONS xi
• Nabhan Hamadneh, David Murray, Michael Dixon, and Peter Cole:
QSRED, An Algorithm To Solve The Mismatch Between The Mi-
croscopic and Macroscopic Behavior of RED Gateways, International
Journal of Computer Science and Network Security, Vol. 10 No. 11
pp. 63-70, (2010).
This paper presents QSRED congestion control strategy. The strategy adjusts
the algorithm of ERED to enhance the network performance. This paper is
edited as Chapter 3.

CHAPTER 1
Introduction
Transmission Control Protocol (TCP) is the transport layer protocol that
governs 90% of data transfer in the Internet [10] [81] [32]. As the Internet has
evolved and the number of users have dramatically increased, new techniques
should be developed to grant fair resource allocation between users.
Congestion is created when demand exceeds the available capacity. Due
to uncoordinated resource sharing, the Internet has su�ered from the problems
of long delays in data delivery, wasted resources due to lost or dropped packets,
and even possible congestion collapse, which appears when the entire network
stalls [38].
Congestion can be solved by numerous approaches. Traditionally, In-
ternet routers used the First In First Out (FIFO) system, dropping from the
tail of queues to control congestion. Queue management has evolved over the
years and become an active area of research. This thesis proposes new queue
management strategies.
1.1. Overview of the congestion problem
The main data streaming unit in TCP is the byte. TCP assigns a se-
quence number to each byte transmitted; this is then used for �ow control
and data acknowledgment. In the Internet, however, data transferred in seg-
ments (packets). Upon data segment arrival, the destination acknowledges the
receipt of the segment by sending an acknowledgment (ACK) with the next
expected data segment number. If the ACK is not received within a time-
out interval, the data is retransmitted. The receiver advertises the number
of bytes it can receive beyond the last received TCP segment. This prevents
over�ows in the receiver's internal bu�er. The advertised number of bytes is
1

1.1. OVERVIEW OF THE CONGESTION PROBLEM 2
called the advertised window and is included in the header of each ACK sent
to the source.
The Round Trip Time (RTT) is the time spent between sending a seg-
ment and its ACK received by the sender. This includes the propagation,
transmission, queuing, and processing delays over all intermediate routers.
In TCP networks, segments traverse the queues of routers. A character-
istic of TCP tra�c is that segments may arrive in bursts from one or more
sources. Bu�ers help routers absorb bursts until they can recover. In the
case of excessive tra�c, bu�ers are overloaded, and new incoming packets are
dropped. Statistical solutions such as: increasing the bu�ers size or adding
more bu�ers are ine�ective [64] because excessive bu�erring can cause lengthy
delays [65]. Thus, the congestion window cwnd is used to prevent the gateway
bu�er being overwhelmed.
Network congestion is indicated by two events: the �rst is the packet loss
which is detected by a time out [38]; while the second is the duplicated ac-
knowledgment [67]. In case of congestion, TCP reduces the window size (cwnd)
which represents the data sending rate. This adjustment depends on the rate
of acknowledgments arriving at the source. The TCP source node adjusts
the congestion window based on congestion signals. It decreases it when the
level of congestion goes up and increases it when the level of congestion goes
down. This mechanism is commonly called Additive-Increase/Multiplicative-
Decrease (AIMD) [12]. It is clear that the increment/decrement of the ACK
arrival depends on the state of intermediate routers. In other words, the ACK's
arriving and data sending rates will be matched, unless there is a congested
router. This automated TCP congestion detection exists according to three
main modes:
• Slow start and congestion avoidance: TCP-Tahoe [38].
• Fast Retransmit and Fast Recovery: TCP-Reno [67] [2].
• TCP-Vegas [8].

1.2. QUEUE MANAGEMENT AND CONGESTION CONTROL 3
These TCP modes and other implementations are further investigated in sec-
tion 2.6 on page 16.
1.2. Queue management and congestion control
The Internet is a packet delivery system. Congestion can cause high
packet losses and increase delays; which reduce network performance. Hence,
congestion control is the most essential element of TCP. Any discussion of con-
gestion would naturally involve queuing. A variety of queuing techniques are
used for network bu�er management. Proper queue management minimizes the
number of dropped packets and network congestion, as well as improving net-
work performance. TCP sources detect congestion through duplicate ACKs.
Intermediate routers use Active Queue Management (AQM) approaches to de-
tect network congestion. These techniques operate directly on the router bu�er
by measuring and monitoring the average queue size.
Current internet congestion handling strategies are used to improve per-
formance, generally indicated by high throughput, high link utilization, low
loss rate and low end-to-end average delay. Accordingly, many congestion
control approaches have been proposed. Congestion can be controlled using
strategies applied by the TCP sender. These strategies are source algorithms,
for example, Vegas [8] and Tahoe [38]. Another type of strategy applied by in-
termediate routers is called the network algorithm, such as, Tail Drop [7] and
RED [29]. Source algorithms and network algorithms are required to work
together to control congestion.
1.2.1. Congestion recovery
Classic network routers manage congestion by setting a maximum queue
length (threshold). When the queue size exceeds the allowed threshold, all in-
coming packets are subsequently dropped until bu�er space becomes available.
This technique is called Tail Drop (TD) as packets are dropped from the tail of
the queue. TD was considered an e�ective congestion control technique until

1.2. QUEUE MANAGEMENT AND CONGESTION CONTROL 4
the detection of two serious drawbacks. These shortcomings are the full queue
and lockout; which are described in chapter 5. Tail drop controls congestion
reactively in which congestion is detected after the bu�er is overloaded. It
can also cause global synchronization when all network sources reduce their
sending rate simultaneously. This can lead to low link utilization or lockout
problem where a few sources monopolize the whole link bandwidth [27].
Global synchronization and lockout problems can be solved by apply-
ing a random drop technique in the intermediate router. Whenever a new
packet arrives at a congested gateway, a packet is randomly dropped from the
queue. Therefore, the probability of dropping a packet from a particular �ow
is proportional to the bandwidth share of that �ow. This technique informs
aggressive users that their tra�c contributes to congestion more than other
users in the network. Random Drop (RD) provides fair resource allocation be-
tween connections and improves the network throughput for connections with
longer RTTs [33].
1.2.2. Congestion avoidance
The congestion recovery techniques react slowly to congestion. These
techniques often detect congestion after the bu�er has over�owed. They do
not solve the full queue problem, and for this reason, the congestion avoidance
approach has been proposed.
The full queue phenomenon can be avoided by predicting congestion in
its early stages. Thus, a proactive approach must be implemented in the
intermediate router to detect the initial stages of congestion. This approach is
often referred to as Active Queue Management (AQM). Instead of the actual
packet drops, AQM marks packets at the congested router and informs the
sources to slow down. The marking technique can be implemented by a bit
set in the packet header.
AQM achieves the following goals:

1.2. QUEUE MANAGEMENT AND CONGESTION CONTROL 5
• Prevents global synchronization.
• Determines an average queue size and reduces delays.
• Removes bias against bursty tra�c.
• Determines and penalizes aggressive users causing congestion.
• Reduces the packet drop rate using the marking technique.
Random drop was originally proposed as a congestion recovery approach. How-
ever, with the Early Random Drop (ERD) enhancement, it can be used as a
congestion avoidance technique. The drop rate in ERD is bounded by the
level of congestion in the gateway. The basic design of the ERD is to set a
�xed threshold. Whenever the queue size exceeds this threshold, packets are
dropped randomly from the queue. More sophisticated forms of ERD drop
packets based on an Exponentially Weighted Moving Average (EWMA) in-
stead of the actual queue size. ERD outperforms the traditional TD technique
in terms of �ow segregation, however, the ERD technique does not provide fair
resource allocation or restrain aggressive users. ERD does have bias against
sudden bursts of tra�c [33].
Random Early Detection (RED) was proposed by Floyd and Jacobson
[29] to overcome the drawbacks of ERD. The main goal of RED is to pro-
vide an e�cient mark/drop rate to control the average queue size and avoid
biases against bursty tra�c. Initial stages of congestion are detected by the
average queue size. If the average queue size exceeds a preset threshold, RED
drops/marks arriving packets with a drop probability; this is a function of the
average queue size. RED gateways maintain low average queue size whereas
occasional bursts are allowed to pass through.
RED has been a hugely in�uential strategy in the area of AQM. It main-
tains a set of parameters to control congestion. However, RED is very di�cult
to parametrize, it being possible for RED performance to operate similarly to
tail drop under some tra�c conditions. Parameter measurement and the rec-
ommended values have been subject to change over time. Subsequently, many

1.3. ORGANIZATION OF THE THESIS 6
RED-based strategies have been proposed since the original RED proposal. In
almost all studies, the parametrization of RED depends on simulation obser-
vations and examination under particular tra�c conditions.
This thesis proposes three RED-based strategies with new parameter
con�gurations to increase network performance.
1.3. Organization of the thesis
Chapter 1 has reviewed the fundamentals of congestion control. Chapter
2 presents the TCP source congestion control strategies and the queue man-
agement approaches, with a particular focus on Active Queue Management
(AQM). Chapter 2 also describes the Random Early Detection (RED) and
RED-based strategies for handling router congestion.
After a thorough review of TCP and AQM; three RED-based strategies
along with their performance evaluation are proposed in Chapters 3, 4 and
5. Several problems, associated with the design and implementation of cur-
rent RED-based strategies, are addressed. The performance of the proposed
strategies is compared with RED variants using the NS-2 simulator.
Chapter 3, investigates the mismatch between the microscopic and macro-
scopic behaviours of RED queues. An active queue management strategy called
Queue Sectors RED (QSRED) is proposed to solve this problem. QSRED mon-
itors the queue dynamics in di�erent queue sectors to avoid this mismatch.
Chapter 4 presents a novel active queue management algorithm RTRED. Us-
ing a third drop level, RTRED reduced the unfair packet drops. Similarly,
more disadvantages of current RED-based strategies are described in Chap-
ter 5 and a novel RED-based strategy (WTRED) is proposed to overcome
these shortcomings. WTRED uses adjustable weight parameter to reduce the
mismatch between the microscopic and macroscopic behaviours of the queue.

CHAPTER 2
Literature Review
This Chapter presents a literature review of the congestion problem. Sec-
tions 2.1 to 2.6 summarize the history of TCP congestion control. Traditional
TCP variants such as, Tahoe, Vegas and AIMD are described in these sections.
The readers can skip sections 2.1 to 2.6 if they are familiar with these topics.
Sections 2.7 and 2.8 presents congestion control using the queue management
approach in intermediate routers. Section 2.9 describes the Random Early
detection (RED). RED-based strategies are described in section 2.10. The
problems associated with Active Queue Management (AQM) are described in
section 2.11. Section 2.12 describes some non AQM based congestion control
techniques. Finally, the Chapter is summarized in section 2.13.
Network congestion is a phenomenon caused by the overloading demand
for �nite network resources. When demand exceeds the available capacity of
the network, performance will be reduced resulting in long delays and higher
packet losses. The most severe result of congestion is the collapse of a network,
in which the entire network stalls [64].
It is very important to design congestion control strategies that keep the
network operating optimally. Congestion control strategies should decrease
the demand by adjusting the sending rate to the congested links. Allocating
more bu�ers or providing faster links, which are the features of many statistical
solutions, do not prevent the network from congestion [64]. Theses statistical
solutions can cause severe congestion resulting in poor performance.
The term �ow control is sometimes confused with congestion control.
Flow control is a window-based technique used by TCP sources to prevent
slow receiver bu�ers from being overwhelmed by fast senders. Thus, these
strategies are called source algorithms. The congestion window (cwnd) is the
7

2.1. WHAT IS CONGESTION? 8
amount of data that can be sent before receiving an acknowledgment. In the
absence of congestion, the window is increased to increase the sending rate. In
case of congestion, the window is decreased to reduce the sending rate until
congestion is reduced.
TCP �ow control techniques, such as TCP-Tahoe and TCP-Reno, have
been in use for long period of time. However, bu�er space in the routers is
�nite, and therefore techniques are required to manage the queue size. Hence,
various congestion control strategies; such as Random Early Detection (RED),
have been proposed to prevent congestion in the intermediate router. This type
of strategy is a network strategy because it is applied by network components,
such as routers, to control congestion.
Accordingly, there are two approaches to deal with network congestion;
reactive and proactive approaches. The reactive approach, which is applied by
source algorithms such as Tahoe and Reno, starts recovering after a network
bu�er is over�owed. The proactive approach aims to prevent bu�er over�ow
using strategies applied in the intermediate router. RED [64] is an example of
a proactive approach.
2.1. What is congestion?
It is normal for several IP packets to arrive simultaneously at the inter-
mediate router; waiting to be forwarded over a congested link. Hence, interme-
diate routers use bu�er space to queue packets until they can be serviced. In
some stages, the sending rate of network sources exceeds the available bu�er
space in routers and a packet has to be dropped. In this case, traditional
routers, which use a First In First Out (FIFO) queue management technique,
drop packets from the tail of the queue.
An in�nite bu�er would not solve congestion; because the generated
queue will be unlimited which increases the end-to-end delay. A packet ex-
posed to long delays may have already timed out and been retransmitted by

2.1. WHAT IS CONGESTION? 9
the source [55]. A small bu�er size is better than a large one; because this will
reduce delays and save memory resources.
2.1.1. Congestion collapse
Congestion increases delays in data delivery and wastes network resources
through lost packets. It could also lead to congestion collapse when all net-
work connections cease. Congestion collapse dramatically degrades network
throughput as illustrated in Fig. 2.1. Congestion collapse has appeared in
di�erent forms since the early days of the Internet. The �rst instance was
described in 1984 [54]. Nagle noticed duplicated retransmissions for packets
already received or still in transit. This form of congestion collapse reduced
network throughputs.
The severe form of congestion collapse is caused by undelivered packets.
This form of congestion collapse wastes the network bandwidth, due to drop-
ping packets, before they reach the end destination. The solution to this form
of congestion collapse is to reduce the o�ered load. There are also two forms
of congestion collapse described by Sally Floyd [23], which are fragmentation-
based congestion collapse and congestion collapse from stale packets. The
former is a result of transmitting packet fragments that will be de�nitely dis-
carded by the receiver, because they cannot be reassembled into a valid packet.
The latter caused through wasting the network bandwidth with packet trans-
missions, which are no longer wanted by the user.
2.1.2. Congestion and misbehaving users
Misbehaving users ignore congestion signals and tend to use more than
their allowed bandwidth. Thus, misbehaving users receive better service than
cooperating users and degrade the stability and operation of the network.
TCP tra�c is responsive tra�c, which reduces the sending rate in re-
sponse to congestion signals. TCP is designed to share the network with other

2.1. WHAT IS CONGESTION? 10
Figure 2.1. Throughput as a function of the o�ered load.
types of tra�c, such as UDP, which is unresponsive to congestion signals. In
the absence of proper congestion control techniques; misbehaving UDP tra�c
users will use more than their fair share of network resources such as band-
width. Therefore, it has been suggested [54] that misbehaving users should be
disconnected. It has been also suggested by Floyd in [23] that the best place
to detect misbehaving users is in the network itself.
Stability is measured by the level of cooperation in the network [4] be-
cause it allows for fair resource allocation.
2.1.3. Fair resource allocation
Fairness becomes a problem when users compete for their resource share
with unsatis�ed demands. Fair resource allocation is satis�ed when each user's
throughput matches all other users that share the same bottleneck link [39].
Hence, the Internet Engineering Task Force (IETF) has considered the opera-
tion of fairness as follows [58]:
• Resources are allocated in increasing order of demand.
• A user is never allocated a share higher than its demand.
• All users with unsatis�ed demands are allocated equal shares.

2.1. WHAT IS CONGESTION? 11
2.1.4. Congestion Control approaches
Resource allocation consists of two parts; end-to-end and per-link man-
agement [60]. Therefore, congestion control is classi�ed as host-based and
router-based techniques; relating to the place in which these techniques are
implemented.
Flow control is implemented in the end hosts. Network sources are re-
sponsible for end-to-end �ow control depending on routers feedback. When
the gateway is about to be overloaded, TCP sources reduce the sending rate
until the gateway recovers from congestion. Feedback can be implemented by
the end host to avoid local bu�er over�ow in the case that a fast sender is
overwhelming a slow receiver bu�er. However, feedback can be implemented
separately by intermediate routers; in which packet drops are the main signal
of congestion. TCP responds implicitly to packet drops by reducing the send-
ing rate, which is the simplest form of congestion control. However, treating
the router as a black box has some limitations on resource allocation control
and reduces the services provided by the network.
Routers are aware of the initial stages of congestion; thus they have to
play a greater role in congestion control. There are two techniques used by
routers for bu�er and bandwidth management. The �rst option is to make
direct bandwidth allocation on an output link. The second option is to make
indirect bandwidth allocation by managing the router queue size.
There are two approaches for congestion control: the �rst is the conges-
tion recovery which is often confused with the term congestion control. The
second approach is congestion avoidance. Congestion recovery approach starts
controlling congestion after the gateway is overloaded. Conversely, congestion
avoidance applies measures to reduce congestion before the gateway is over-
loaded. In the literature, the term congestion control is used to denote both
approaches.

2.2. TCP PERFORMANCE PARAMETERS 12
2.2. TCP performance parameters
The literature has used di�erent parameters, with di�erent de�nitions,
to measure the performance of TCP networks. Five parameters are commonly
used for this purpose [25] [16] [1] [29] which are: throughput, link utilization,
packet loss, delay and jitter. Following are some of the other parameters that
are used to measure network performance [34]:
Round trip delay: The time required for an IP datagram to travel
from source to destination and back. This parameter includes propa-
gation time and queuing delay.
One way delay: Due to network characteristics such as routing and
bandwidth limitations; the one way delay is not always half of the
round trip delay. The estimation of this parameter is very important
in highly interactive applications, such as voice over IP.
Maximum delay: It represents the maximum allowed one way delay
for high network performance rate.
Delay jitter: Re�ects the variability of one way delay between IP data-
grams. Higher jitter indicates lower network performance, especially
for multimedia applications.
Packet loss rate: Packets can be dropped by intermediate routers due
to bu�er over�ow. They can be also lost at bu�ers due to physical
errors. The loss rate is the ratio of correctly received packets to the
number of propagated packets.
E�ective bandwidth: It is also called the e�ective throughput which
is the number of bytes that transferred in one second through the
network.
Throughput variation: The variability of throughput over a given
time scale.
File transfer time: The time taken by a �le or object to be trans-
mitted from source to destination. This can be estimated using the

2.3. ACKNOWLEDGMENTS 13
connection e�ective throughput.
Fairness: This parameter re�ects the fairness of resource allocation be-
tween network clients.
Resource consumption: TCP techniques that consume fewer network
resources re�ect high network performance.
2.3. Acknowledgments
Four types of acknowledgments are used to con�rm data delivery at the
destination. These acknowledgments are [34]:
ACK-only segment and piggybacking: The receiver sends ACKs packet
by packet. The ACK can contain a zero payload; which is called the
ACK-only technique. Another option to include the ACK number
within a data packet, is called the Piggybacking.
Delayed ACK: Instead of acknowledging packets one by one; a delayed
acknowledgment can be sent for a group of segments.
Duplicate ACK: A duplicate ACK can be used to indicate missing
packets implicitly in TCP networks. For example, if n − 1, n and
n+1 are subsequent packets. When packet number n− 1 is received,
the receiver sends ACK number n. This is to inform the reciever that
packet number n − 1 is received safely and the next expected packet
is number n. If packet number n is lost in the network and packet
number n + 1 is arrived then it is implicitly known by the receiver
that packet number n is missing. In this case, the receiver sends
ACK number n + 2 to con�rm the recipient of packet number n + 1
and to inform the sender of the next expected packet which is n+ 2.
Even though the ACK number n has been previously triggered to the
sender, a duplicated ACK with number n is resent to the sender to
reorder segment number n. Some TCP variants take bene�ts out of
this technique to control congestion.

2.5. TRADITIONAL SOURCE CONGESTION CONTROL 14
Figure 2.2. Example of a sliding window in TCP networks.
2.4. Flow control and sliding window
Time out or triple acknowledgment are used as signals of congestion in
TCP networks. When congestion occurs, a TCP congestion control algorithm
informs the TCP sender to reduce the sending rate, by halving the congestion
window size. The self-clocking behavior is a method used by network sources
to regulate the sending rate. Section 2.5 describes this behaviour. The maxi-
mum number of bytes that can be released unacknowledged by TCP senders
is called the window size. As this window increases and decreases to regulate
bandwidth, it is known as the sliding window and is shown in Fig. 2.2.
In this example, the window size is �ve bytes and the bytes numbered 1
to 5 have been sent. Technically, the next window would contain bytes 6 to
10, but the actual operation is slightly more complex. Since bytes 1 to 3 have
been acknowledged but 4 and 5 have not been acknowledged yet, they would
not be excluded from the next window; unless they are acknowledged. Instead
of that, the next window would contain bytes 4 and 5 before it slides to cover
the bytes 6, 7 and 8. This technique is helpful in case bytes 4 and 5 are lost
and have to be retransmitted by the sender.
2.5. Traditional source congestion control
Flow control techniques in TCP are used to dynamically adjust the
senders advertised window. The available bu�er space at the receiver is the
criteria to do this adjustment. Due to the design principles of TCP, inter-
mediate routers would not send acknowledgments to the sender. It is, also,
not permitted for them to adjust the congestion window cnwd. Thus, another

2.5. TRADITIONAL SOURCE CONGESTION CONTROL 15
set of mechanisms are applied to indicate congestion at intermediate routers.
These mechanisms depend on packet loss or time out to adjust the conges-
tion window. The actual transmission window is set to the minimum of the
advertised window and congestion window. The following sections describe
three of the traditional source techniques that are used to control congestion
in intermediate routers.
2.5.1. Slow start
Slow start mechanism requires a sender to start transmissions slowly and
then increase the sending rate. The maximum number of packets that can
be sent is not predetermined. Hence, the Slow Start mechanism transmits
packets slowly to probe the capacity of the network. The sender starts by
sending one packet. When the ACK returns, the sender increases the window
size by one. Window growth is exponential during this phase [65]. When
ACKs stop arriving, the sender determines that it has reached the network
capacity. Consequently, the window is degraded to one packet which takes the
sender back to the slow start phase.
Slow start is not a congestion prevention technique. It smooths out
the sending rate to prevent immediate congestion. Gateway overloading is
unavoidable, and eventually, a segment has to be dropped. Therefore, this
technique would not be an e�cient way to avoid congestion collapse or to
avoid long delays in data delivery [38].
2.5.2. Congestion avoidance
As an e�ort to prevent gateway overloading, this technique bounds the
exponential increase of the slow-start congestion window. When the window
size reaches a threshold that is called the slow start threshold (ssthresh) the
window is increased linearly, one packet per ACK. Fig. 2.3 illustrates this
technique.

2.6. TCP VARIANTS 16
Figure 2.3. Slow start and congestion avoidance.
2.5.3. Additive-Increase/Multiplicative-Decrease(AIMD)
The classic TCP variants used to maintain pre�xed cwnd and ssthresh
parameters. Newer variants of TCP, such as Reno, adjust these two parame-
ters dynamically. At the congestion avoidance phase, the cwnd parameter is
increased by �xed amount of data, normally one packet. This increment is
called the Additive Increase. Time outs or duplicate Acks halves the ssthresh
and reduces the cwnd, normally to one packet, returning the sender back to
the slow start phase. These two decrements of the cwnd and ssthresh are
called the Multiplicative Decrease. In case of successive time out events, the
parameter ssthresh will be reduced exponentially until it reaches the value
two.
2.6. TCP variants
Some drawbacks were discovered in the congestion control algorithms of
the classic TCP implementations. As discussed in previous sections, congestion
collapse [41] was one of the serious troubles caused by these shortcomings.
Therefore, many TCP modi�cations, such as TCP-Tahoe [38], were proposed

2.6. TCP VARIANTS 17
to overcome these problems. The following section reviews the most common
TCP variants:
2.6.1. TCP-Tahoe
A time out event in traditional TCP variants is interpreted as a packet
lost causing the sender to retransmit lost packets. TCP-Tahoe uses di�erent
techniques to retransmit the lost packet [38]. Duplicate ACKs are used to
speed up packet retransmission before the timer expires. TCP-Tahoe reacts
to duplicate ACKs by reducing the ssthresh parameter to half of the current
cwnd and the cwnd itself is reduced to one packet; which means that the
network has entered the slow start phase. As the tra�c is accumulated and the
sending rate is heavily increased, the network enters the congestion avoidance
phase.
2.6.2. TCP-Reno
TCP-Tahoe and TCP-Reno [67] [2] use duplicate ACKs to indicate packet
loss. Instead of returning to the slow start phase in TCP-Tahoe, TCP-Reno
goes into the congestion avoidance phase by halving the parameter cwnd and
assigning the new cwnd to the parameter ssthresh; (cwnd = ssthresh). This
new phase of TCP-Reno is called the fast recovery phase. TCP-Reno keeps
track of all lost packets and tries to retransmit them during this phase. TCP-
Reno does not enter the slow start phase unless the congestion window becomes
very small due to multiple packet losses.
2.6.3. TCP-Newreno
TCP NewReno does not leave the fast recovery phase due to multiple
packet losses [13] [26] [36]. It reduces the congestion window by the number of
acknowledged packets minus one, then assumes that the packet after the most
recently acknowledged one is lost and retransmit it.

2.6. TCP VARIANTS 18
2.6.4. TCP-SACK
Selective ACK (SACK) is an extension that can be enabled alongside
NewReno. SACK is sent to the sender when multiple packets are lost. The
sender uses this SACK as an image of the receiver queue, then detects and
retransmits the lost packets without waiting for a time out [13] [49]. New
packets cannot be sent unless all outstanding packets are acknowledged. If
ACKs are not received on time, TCP-SACK uses Reno's time out technique
to retransmit lost packets.
During the fast recovery phase, a parameter called pipe is set to the
number of outstanding packets in transit. The sending rate should be less
than the cwnd. Therefore, the sender sends data only when the pipe value
is less than the cwnd. The pipe value is increased by one with every sent
packet and decreased by one with every ACK included in a SACK. The pipe
is reduced by two only with multiple packet losses.
2.6.5. TCP-FACK
TCP Forward Acknowledgment (FACK) is designed to retransmit mul-
tiple lost packets. This technique maintains information about the highest se-
quence number of acknowledged packets using two parameters which are fack
and retran − data. The �rst maintains the sequence number of the last con-
�rmed packet by SACK. The second, maintains the number of retransmitted
but not yet con�rmed packets. The amount of outstanding data is estimated
using Eq. 2.1.
(2.1) OSD = EFDS − fack + retran− data
Where:
OSD: The amount of outstanding data.
EFDS: Estimated forward data sent.

2.6. TCP VARIANTS 19
FACK does not change the value of the cwnd during the fast recovery
phase. Instead, it keeps the rate of outstanding data to be one segment within
a cwnd. Thus, the fast retransmit in TCP-FACK is more promptly [48].
2.6.6. TCP-Vegas
Vegas [8] is a TCP variant that does not reduce the congestion window
relating to segment loss. Vegas pipe is assigned the value of the expected
throughput. When the network becomes congested, the actual throughput
will be less than the expected throughput and the cwnd is adjusted relating
to this event.
The sending time of each segment is recorded and the related round trip
time is estimated upon ACK arrival. A base round trip time (BaseRTT )
is maintained for each connection. This parameter is assigned the value of
the lowest recorded round trip time among the packets that have been sent
through the same connection. The expected throughput is estimated using Eq.
2.2.
(2.2) Exth = WZ/BaseRTT
Where:
Exth: The expected throughput.
WZ: The current congestion window size.
The actual throughput is calculated per round trip time. Fig. 2.4 illus-
trates the algorithm of Vegas, where Diff is the di�erence between the actual
and the expected throughput. Two parameters, α and β are normally used to
represent the heavy weight and the light weight of network data respectively.

2.6. TCP VARIANTS 20
Figure 2.4. TCP Vegas algorithm.
2.6.7. TCP Vegas modi�cations
A modi�cation of slow start independent from packet loss was proposed
with TCP-Vegas. The congestion window is adjusted exponentially every sec-
ond round trip time and the other round trip time is used to calculate the
Diff parameter. If Diff is less than a preset parameter α then Vegas jumps
from the slow start phase to the congestion avoidance phase. This provides
better estimation of the available bandwidth of the connection.
As a new retransmission technique, Vegas retransmits packets for each
duplicate ACK, instead of waiting three duplicate ACKs. This new technique
is only applicable if the estimated RTT is greater than the time out value. If
lots of packets are lost in the same block, or if the window size is small, then
the triple ACK becomes an impossible condition. This problem can be �xed

2.7. QUEUE MANAGEMENT AND CONGESTION CONTROL 21
using the modi�ed Vegas.
2.7. Queue management and congestion control
TCP networks apply queue management algorithms to control congestion
in intermediate routers. There are two main approaches to control congestion.
The �rst approach is the Passive Queue Management (PQM). The second is the
Active Queue Management (AQM). PQM is a congestion recovery approach
which starts congestion control after the gateway bu�er is overloaded. AQM
is a congestion prevention approach in which congestion control starts before
the gateway bu�er is overload.
In PQM, if a packet is dropped at the intermediate router due to bu�er
over�ow, then senders have to wait for time out event before they reduce
their sending rate. In this case, congestion is detected by senders implicitly.
This reaction by senders is called the Implicit Congestion Noti�cation (ICN).
In contrast, the Explicit Congestion Noti�cation (ECN) is a technique that
allows intermediate routers to mark the congestion bit in a packet header
rather than dropping it. When ECN marked packet arrives at the destination,
the receiver sets the congestion bit in the ACK's header before it is replayed
to the sender. ECN is very e�ective with moderate cases of congestion. If
congestion is excessive then dropping packets is considered to be more e�cient
solution [62].
Normally, PQM threshold is the bu�er limit, but AQM threshold is suf-
�ciently less than the bu�er limit. This makes a di�erence between AQM and
PQM approaches. In PQM, when the queue size reaches a pre�xed threshold,
all incoming packets are dropped in order. Conversely, AQM drops packets
randomly.
A lot of strategies have adopted the PQM approach. Drop-From-Front
(DFF) is a PQM strategy that drops packets from the front of the queue to
make space for recently arrived packets. Push-Out (PU) is another implemen-
tation of PQM in which the packets are dropped from the end of the queue

2.8. INTERMEDIATE ROUTER CONGESTION CONTROL 22
to make space for the new arrived packets. The well known Tail Drop (TD)
strategy drops all arriving packets from the tail of the queue. Despite the ben-
e�ts of queue management and congestion handling, PQM su�ers from some
problems. Full Queue problems occur when the gateway continually sends
full queue signals to sources for a long period of time. Lock out occurs when
TD allows a few connections to monopolize the whole bu�er space. Global
Synchronization occurs when all TCP senders reduce their sending rate simul-
taneously; resulting in low network throughput. These problems are further
described in subsequent chapters.
Active Queue Management (AQM) strategies, such as Random Early De-
tection RED [29], were proposed to solve the problems of the Passive Queue
Management (PQM) strategies. AQM improves network throughput by reduc-
ing the number of dropped packets in the intermediate router. Moreover, the
small queue size which is maintained by AQM reduces the average network
delay [34].
2.8. Intermediate router congestion control
Prior to the introducton of DECbit in 1988, routers maintained large
bu�ers to accommodate transient congestion caused by high speed networks.
These large bu�ers resulted in large delays. Thus, it was necessary to minimize
the queue size without degrading throughput.
Instead of using packet loss to indicate congestion, it was proposed to
detect congestion using other indicators. These indicators include: the esti-
mated bottleneck link service time, changes in throughput as well as changes
in end-to-end delay. However, it has been shown that the most e�cient place
to detect congestion is in the intermediate router itself [29].
DECbit [40] is one of the earliest congestion control strategies that was
applied to intermediate routers. When the average queue size exceeds a pre-
�xed threshold, DECbit informs senders of congestion explicitly. It sets a
congestion bit in the packet header to inform senders of congestion. For every

2.9. RANDOM EARLY DETECTION (RED) 23
packet arrival, the average queue size is calculated for the current gateway
busy period. Also, the overhead of the previous busy and idle periods will af-
fect the calculation of the current average queue size. If the calculated average
is more than one, the congestion bit is set in the packet header. For every
second round trip time, if half or more of the packets from the last window
were marked then the source reduces its sending window size exponentially.
Otherwise, the window is increased linearly.
Early Random Drop (ERD) [33] is an intermediate router strategy. When
the queue size exceeds a prede�ned level, packets are dropped with a �xed drop
probability. It was suggested as a future work in ERD's proposal to maintain
adjustable threshold and drop probability [33]. The subsequent sections shows
that this enhancement was achieved by the Random Early Detection (RED)
[29].
Research shows that ERD solves the global synchronization problems
caused by TD [33]. However, ERD is unable to control misbehaving users [78].
This might enable misbehaving users to be assigned an unfair proportion of
the bandwidth.
IPSource Quench [61] is a congestion control strategy that revealed the
use of two dropping levels or thresholds. The gateway sends a source quench
message when the average queue size exceeds the �rst threshold [60]. If the
queue size exceeds the second threshold, the gateway could discard arriving
packets other than ICMP packets.
2.9. Random Early Detection (RED)
Random Early Detection (RED) [29] is a gateway congestion control
strategy that adopts the active queue management approach. RED main-
tains two dropping levels and uses an Exponentially Weighted Moving Aver-
age (EWMA) to control congestion. This section evaluates the design and
performance of RED.

2.9. RANDOM EARLY DETECTION (RED) 24
2.9.1. RED design guidelines
RED controls the average queue size to avoid congestion in intermediate
routers. It was designed to avoid global synchronization and bias against
bursty tra�c. It also provides techniques to bound the average queue size
without transport layer support [29].
The main goal of designing new congestion avoidance techniques is to
maintain low delay, high throughput, as well as to detect the initial stages of
congestion. Congestion avoidance strategies should also reduce queue sizes to
reduce delays. Some queue �uctuation should be permitted to accommodate
bursty tra�c and transient congestion [64].
As the gateway has direct control over the queue, congestion is easily
detected in the gateway itself. This gives the gateway the ability to warn
individual senders that are overwhelming the bu�er.
Connections are set with di�erent round trip times, throughput require-
ments and delay sensitivity. The average queue size in RED is estimated using
a low pass �lter. The gateway is able to determine the appropriate short-lived
bursts that can be accommodated by the queue. RED achieves this by con-
trolling the time constants used by the low-pass �lter. Thus, RED is able to
detect congestion that lasts multiple round trip times [29].
Congestion avoidance schemes must decide which connections are to be
noti�ed of congestion. If congestion is detected and the gateway is not yet full
then the packet drop technique is an inappropriate option to notify sources of
initial congestion. Instead, RED marks packets and the corresponding source
reduces its window size. Legacy TCP variants do not provide a congestion
bit in packet header. In this case, the packet must be dropped to inform the
source of congestion [29].
If many connections were simultaneously noti�ed of congestion via packet
loss, they will reduce their sending rate simultaneously; resulting in low through-
put [30] [79]. This problem, which exists in Tail Drop gateways, has been

2.9. RANDOM EARLY DETECTION (RED) 25
alleviated using RED because RED drops packets randomly from the queue.
Tail Drop and Early Random Drop gateways su�er from bias against
bursty tra�c [28]. When a particular burst connection is overwhelming the
gateway, eventually a packet has to be dropped due to bu�er over�ow. RED
also addressed bias against bursty tra�c.
2.9.2. RED algorithm
RED maintains an Exponentially Weighted Moving Average (EWMA) of
the bu�er size on Internet routers [29]. Equations 2.3, 2.4 and 2.5 illustrate
how the drop rate of packets is calculated. Table 2.1 illustrates the RED
algorithm.
(2.3) avg = (1− wq) ∗ avg + wq ∗ q
(2.4) pb = maxp(avg −minth
maxth −minth
)
(2.5) pa = pb(1
1− count ∗ pb)
Where:
avg : average queue size.
wq : a weight parameter, 0 ≤ wq ≤ 1.
q : current queue size.
pb : immediately marking probability.
maxp : maximum value of pb.
minth : minimum threshold.
maxth : minimum threshold.
pa : accumulative drop probability.
count : number of packets since the last marked packet.

2.9. RANDOM EARLY DETECTION (RED) 26
Table 2.1. Detailed Algorithm of RED.
Initialization :avg = 0count = −1
for each packet arrivalcalculate the new average queue size avg :
if the queue is nonemptyavg = (1− wq)avg + wq
elsem = f(time− qtime)avg = (1− wq)
mavgifminth ≤ avg ≤ maxth
increment countcalculate probability pa :pb = maxp(avg −minth)/(maxth −minth)pa = pb/(1− count. ∗ p)
with probability pa :mark the arriving packetcount = 0
else if maxth ≤ avgmark the arriving packetcount = 0else count = −1
when queue becomes emptyqtime = time
time :current time.
qtime : start of the queue idle time.
f(x) : a linear function of the time t.
The RED gateway has two preset thresholds, the maximum and the
minimum thresholds. Every time a new packet arrives at the gateway, the
avg value is calculated. If this value is greater than the maximum threshold,
then all incoming packets must be marked or dropped. If it is less than the
minimum threshold, the arriving packet enters the queue without marking or
dropping. When this avg value is in between the minimum and the maximum
thresholds, then incoming packets will be dropped or marked with probability
pa [22].
In this way, RED achieves the following:

2.9. RANDOM EARLY DETECTION (RED) 27
• Connections with higher input rates receive proportionally more drops
or marks than connections with lower input rate
• Maintains an equal rate allocation
• Removes biases against bursty tra�c
• Eliminates global synchronization
For more details of the RED design principles see [20] [24].
2.9.3. Calculating RED's average queue size
A low pass �lter is used to estimate the average queue size in RED. The
use of this low pass �lter prevents transient congestion and short-term bursty
tra�c from a�ecting the average queue size. The time constant of the low
pass �lter is represented by the parameter wq in Eq. 2.3 which is the weight
parameter used to calculate the average queue size. This parameter can be
assigned a value between 0 and 1. The recommended default value is 2× 10⁻³
[29]. The upper and lower bounds of this parameter are described in the next
section.
2.9.4. Bounds for the weight parameter
RED gateways do not �lter transient congestion if the value of wq is
very large [29]. The weight parameter is bounded by the desirable average
queue size. The minimum threshold and maximum threshold are also taken
into account when estimating the average queue size. Chapter 5 proposes a
new parameter con�guration for the weight, minimum threshold and maximum
threshold parameters.
Eq. 2.6 is used to estimate the desirable average queue size. This average
represents the increase of an empty queue from zero to L packets over L packet
arrivals. For example, if the queue has increased from 0 to 100 packets and
the desirable average, avgd, is 4.88 then the weight parameter to achieve this
average is 0.001. The minimum threshold must be always greater than the

2.9. RANDOM EARLY DETECTION (RED) 28
avgd. If the weight parameter is set too low then it would not re�ect the
changes of the average queue size; delaying the initial detection of congestion
[29].
(2.6) avgd = L+ 1 +(1− wq)
L+1 − 1
wq
Floyd and Jacbson assumed that if a packet arrives at an empty queue
with avg equals zero then the desirable average queue size is 0.63 [29].
During steady state, the packet arrival rate will be equal to the departure
rate. Thus, for the previous assumption, the actual queue size will be one
packet as long as the gateway is in the steady state. Now, the question is how
many packets are required to increase the average from zero to 0.63. RED,
uses the formula −1/ ln(1−wq) to estimate this number [77]. For wq = 0.001,
it takes the gateway 1000 packet arrivals to increase the average from zero to
0.63. With wq = 0.002, the number of packet arrivals is 500. For wq = 0.003
this number is reduced to 333 packet arrivals. Thus, it is again the desirable
average that determines the lower bound of the weight parameter.
2.9.5. Con�guration of the maximum and the minimum thresholds
The optimal values of the minimum and maximum thresholds also depend
on the desirable average queue size. In order to increase the link utilization, the
minimum and maximum thresholds should be su�ciently large, especially, for
bursty tra�c [29]. The maximum threshold parameter should be based on the
maximum average delay permitted by the gateway. It is recommended to set
the di�erence between the maximum and minimum thresholds larger than the
typical increase in the calculated average queue size. It is also recommended
to set the maximum threshold to at least twice the minimum threshold. The
strategy Weighted RED (WTRED), which is presented in Chapter 5, suggests
an alternative con�guration of these parameters.

2.9. RANDOM EARLY DETECTION (RED) 29
2.9.6. Calculating the packet marking probability
The initial mark probability pb is a linear function of the average queue
size which is illustrated in Eq. 2.4. This probability determines the num-
ber of packet arrivals between two marked packets. The parameter maxp in
Eq. 2.4 represents the maximum value for pb that is allowed before the av-
erage queue size reaches the maximum threshold. The RED proposal [29]
recommends packet marking at regular intervals. If many marked packets
have short or long intervals between them then this will cause global synchro-
nization. Hence, RED uses a uniform random variable to determine the gaps
between two marked packets [29].
2.9.7. Evaluation of RED
RED has been evaluated against the following aspects [29]:
Congestion avoidance: If RED uses the packet drop mode to indicate
congestion then RED grants average queue size less than the maxi-
mum threshold. If the packet mark mode is used then RED will use
ECN to mark packets. In addition, the average queue size can be
e�ectively controlled if RED uses the optimal weight parameter.
Appropriate time scales: When using ECN, it takes at least one round
trip time for the gateway to recognize the reduction in the arrival rate.
In RED, the time scales for congestion detection and source to respond
are roughly matched. Connections would not reduce the window size
as a result of transient congestion at RED gateways.
No global synchronization: Packet marking rate in RED is bounded
by the level of congestion. The probability of marking packets is
increased with the congestion level. Thus, RED avoids global syn-
chronization by marking packets at low levels of congestion.
Simplicity: Due to the simplicity of the algorithm, RED can be imple-
mented with moderate overhead in current networks.

2.9. RANDOM EARLY DETECTION (RED) 30
Maximizing global power: Network power is the ratio of throughput
to delay. RED using the marking technique has full control over the
average queue size. It was shown that the global power in RED is
higher than TD with high link utilization.
Fairness: In contrast to Drop Tail, RED does not discriminate against
particular connections [28], because connections receive marking sig-
nals proportional to their share of the bandwidth. However, RED
does not grant equal throughput. Also, misbehaving users are not
fully controlled. The level of congestion is identi�ed easily by RED.
Connections that use large bandwidth are also identi�ed. Therefore,
these connections can be controlled to organize the throughput during
congestion.
RED is appropriate for a wide range of environments: RED drops
packets randomly from the queue. This makes RED applicable for
connections with di�erent round trip times, throughput and number
of active connections. The average queue size re�ects the tra�c load
allowing the marking rate to be adjusted correspondingly. Even with
mixed networks (TCP and UDP), RED is able to control conges-
tion by dropping packets. If packet dropping is not recognized by the
transport layer in sources then congestion, eventually, will be detected
when the average queue size hits the maximum threshold.
2.9.8. Parameter sensitivity
The only parameter that must be set in TD is the bu�er size. RED
maintains a set of parameters that work together to control the average queue
size. Also, to control the time intervals to compute the average queue size and
maximum rate of packet marking. Congestion avoidance mechanisms should
have parameters that are less sensitive and they should be applicable for a
wide range of networks with di�erent bandwidths.

2.10. RED-BASED STRATEGIES 31
The parameters wq, minth and maxth are set according to the desirable
queue size and the duration of bursts allowed in the queue. The parameter
maxp is the maximum bound of the actual drop probability pb which has a
wide range of settings. In the presence of moderate congestion, RED marks one
packet out of 1/maxp packets. When congestion becomes heavy, the marking
technique cannot control the average queue size. When the average queue
size reaches the maximum threshold, RED drops every arriving packet until
congestion is controlled.
Parameter con�guration in RED is a complex procedure. However, there
are few tips in how to con�gure RED's parameters to increase network per-
formance under a wide range of tra�c conditions. Adequate calculation of
the average queue size requires the weight parameter to be set greater than
or equal to 0.001. Weight parameters set below 0.001 will obstruct RED from
recognizing the actual changes in the queue size [29].
Large minimum threshold maximizes the network power parameter, which
is the ratio of throughput to delay. The optimal minimum and maximum
thresholds is an area that requires further research. Due to the bursty na-
ture of network tra�c; �uctuations in network queues becomes a common
behaviour. If the minimum threshold is set too low then the average queue
size will be too low as well, resulting in poor link utilization.
In order to avoid global synchronization, the di�erence between the min-
imum and maximum thresholds must be large enough to avoid marking too
many packets at the same time. The di�erence should be larger than the typi-
cal increase in the average queue size during a round trip time. It is suggested
by the RED proposal [29] to set the maximum threshold twice the minimum
threshold.
2.10. RED-based strategies
RED was proposed by Sally Floyd and Van Jacobson in 1993 [29]. Since
then, many RED-based strategies were proposed to increase network perfor-

2.10. RED-BASED STRATEGIES 32
mance. Some variants propose new parameter con�guration for the original
RED proposal. Other strategies add extra parameters to enhance RED's func-
tionality.
2.10.1. Blue RED
RED relies on the average queue size to detect congestion. Blue-RED
[16], uses the history of packet loss and link utilization to manage congestion.
In Blue-RED, arriving packets are marked or dropped using a single prob-
ability. In case of bu�er over�ow and continuous packet drops, Blue RED
increases the sending rate of congestion noti�cation by increasing the marking
probability. In case of empty queue or idle link, the marking probability is de-
creased. For optimal operation of RED, it must be con�gured with su�cient
bu�er space to accommodate bursty tra�c. Also, the congestion noti�cation
rate must suppress the transmission rate without reducing the link utilization.
When the number of active connections is large, the generated tra�c is ex-
tremely bursty [15] [17]. Bursty tra�c causes rapid increases and decreases in
the active queue size which defeat RED's reaction [16].
It is recommended, for ideal RED performance, to set the bu�er space
in the intermediate router twice the delay bandwidth product [70]. Large
bandwidth delay products, considerably, increase the end-to-end delay and
jitter which a�ect the running of the interactive applications.
Comparing with RED, Blue-RED maintains a single drop probability pm
which is increased when the gateway bu�er is over�owed and decreased when
the queue is empty or the link is idle. Table 2.2 illustrates the Blue-RED
algorithm.
A variant of Blue-RED updates the drop probability when the queue
size exceeds a certain value L. This adjustment provides more free space in
the bu�er for transient bursts of tra�c. It also allows the queue management
technique to control the delay when the queue size becomes large [16]. In

2.10. RED-BASED STRATEGIES 33
Table 2.2. Blue-RED algorithm.
Upon packet loss (or q > L) event:if ( (now � last_update) > freeze_time ) then
pm = pm + d1last-update = nowUpon link idle event:
if ( (now - last_update) > freeze time ) thenpm = pm − d2
last_update = now
order to control the frequency of changing the drop probability, Blue-RED
uses extra parameters. The freeze−time parameter determines the minimum
time interval between two subsequent adjustments of pm. Constant values of
the freeze�time cause global synchronization [28]. Thus, the value of the
freeze�time must be randomized. The parameters d1 and d2 determine the
amount to increase and decrease the drop probability respectively. It is also
recommended to set d1 signi�cantly larger than d2 because the link utilization
will be reduced whenever the queue management technique becomes aggressive
or conservative.
2.10.2. Other RED variants
Many RED-based strategies were proposed with di�erent parameter con-
�guration. RED was originally designed to work with TCP/IP best-e�ort
services. However, some RED variants were proposed and evaluated for dif-
ferentiated services [11] such as multimedia UDP tra�c [59] and ATM tra�c
control [63]. This section describes other RED-based strategies proposed in
the literature. Some of these strategies have been evaluated in [10] [50] [52].
Dynamic RED (DRED): [3], tries to stabilize the queue size around
a desired length (Qref ) which is expected to stabilize link utilization
at a preset level. The packet drop probability is adjusted according
to the deviation of the queue length from Qref .
Stabilized RED (SRED): [56], drops packets according to the calcu-
lated number of �ows and the current queue size. The number of �ows

2.11. PROBLEMS WITH AQM 34
is calculated without maintaining a per-�ow account. Bu�er utiliza-
tion in SRED is stabilized at a level which is independent from the
load level.
Adaptive Virtual Queue (AVQ): [42], a modi�ed packet model is
used as a Virtual Queue (VQ), instead of the queue length to regulate
bu�er utilization. In case of VQ over�ow, the size and the link capacity
of the VQ are adjusted proportional to the estimated input rate and
dropped packets.
2.11. Problems with AQM
Most of the Active Queue Management strategies use the average queue
size to determine congestion. This causes some problems like the mismatch
between macroscopic and microscopic behavior of queue length, insensitivity
to the input tra�c variations and some con�guration problems.
2.11.1. The mismatch between macroscopic and microscopic behav-
ior of queue length
The microscopic behavior of a router is the stable dynamics of the average
queue size. These stable dynamics re�ect the long term behavior of a router.
In contrast, the short-term dynamics of the actual queue size are called the
microscopic behavior of a router.
Some studies have shown varied dynamics between the average and actual
queue sizes [10] [50] [56]. For instance, when a large number of bursts arrive at
a RED gateway, the actual queue size is rapidly increased, resulting in bu�er
over�ow. If the queue weight parameter is too small then the average queue
size will be increased slowly, despite accumulating congestion. Sources will
reduce their sending rate after a congestion signal is triggered due to packet
drop at the gateway. After congestion problems have been recti�ed and the
actual queue size is decreased, the average queue size will be high due to

2.12. CONGESTION CONTROL APPROACHES OTHER THAN AQM 35
previous peaks in the actual queue size. Therefore, packet dropping will be
continued even after congestion problems have been recti�ed, which unfairly
penalizes packets recieved after the congestion event.
2.11.2. Insensitivity to the input tra�c load variations
The actual queue size is the best early indicator of congestion. Due to
the use of the average queue size, the current variations in the tra�c are not
recognized by AQM strategies. This leads to unfair packet drops between
connections. However, AQM strategies that tend to use the actual queue size
to indicate congestion, instead of using the average queue size su�er from worst
cases of unfair packet drops. Chapter 4 proposes a solution for this problem.
2.11.3. Con�guration problem
Parameter con�guration in AQM strategies is a di�cult task, especially
for RED. AQM modi�cations have been proposed to increase network perfor-
mance which are evaluated using analytic modeling and simulation [15] [16]
[44] [56] [19]. Unfortunately, these modi�cations work only for speci�c tra�c
conditions but not for realistic IP tra�c [10] or a heterogeneous tra�c environ-
ment [81]. Parameter con�guration problems arise from the tradeo� between
the design goals of AQM and the nature of the real IP tra�c [64]. RED was
proposed to accommodate excessive tra�c load.
2.12. Congestion control approaches other than AQM
Active Queue Management is not the only approach that is employed
to control congestion in current TCP networks. A few more approaches are
also applied to solve this problem. Some of these approaches are architectural
approaches, others are economic approaches.
Architectural approaches tend to enhance the source algorithm, network
algorithm or both of them to provide better congestion control. These kinds

2.12. CONGESTION CONTROL APPROACHES OTHER THAN AQM 36
of approaches do not a�ect the design principles of TCP. Source algorithms
use the implicit congestion noti�cation without any assistance from the inter-
mediate router. Network algorithms use the Explicit Congestion Noti�cation
(ECN). However, source and network algorithms can cooperate between each
other to improve the network resource allocation as well as e�ective congestion
control [31].
Using mathematical modeling and analysis, economic approaches have
been proposed to provide better congestion control. The pricing-based ap-
proaches and the optimization approaches are subsets of the economic ap-
proaches. In the pricing-based approaches, packets or bandwidths are priced
and used as congestion control devices for di�erentiation of services. The
optimized-based approaches use game-theoretic techniques or mathematical
programming to evaluate the behavior of users or networks. The following
section describes one example for each set of approaches.
Dynamic Adaptive Window (DAW) [53] is an Architectural approach
that provides a distributed algorithm to calculate end-to-end window size using
analysis of closed queuing networks. The window size in DAW is adjusted ac-
cording to packet-delay estimations instead of packet drop events. Congestion
is determined by comparing the end-to-end delay to the range of acceptable
delay.
Smart Market (SM) [47] is a pricing-based approach that allocates net-
work resources based on packet prices. The prices of the packets are deter-
mined using the level of demand for link bandwidth. The network accepts
packets with bid price that exceeds the instant cut-o� amount. This amount
is bounded by the marginal congestion cost imposed by the next additional
packet. Unaccepted packets are returned back to the source or forwarded to
another slow link.
Low [46] proposed an optimized based approach which considers links and
sources as processors of distributed system. Data sending rates are selected by
sources. Accordingly, network links determine the prices of the bandwidth to

2.13. SUMMARY 37
organize the decisions that are made by sources. In addition, a Random Early
Marking (REM) algorithm was proposed to use probabilistic packet marking
using the explicit congestion noti�cation bit in IP header [62] [18].
Economic approaches unlike architectural approaches require main changes
in the design principles of TCP. Architectural approaches replace the packet
drop event by ECN technique to indicate congestion. This thesis investigates
network congestion control strategies that preserve the design principles of the
TCP protocol. The thesis also investigates strategies that use the packet drop
event to indicate congestion in intermediate router, such as TD and RED.
Hence, architectural and economic approaches are out the scope of this study.
2.13. Summary
This Chapter presented the principles of TCP congestion control. The
congestion control strategies are described from TD to the current state of the
art AQM strategies. RED-based strategies su�er from three problems: the
mismatch between macroscopic and microscopic behavior of queue length, pa-
rameter con�guration and the insensitivity to the input tra�c load variations.
The �rst two problems are investigated in the subsequent chapters, and some
solutions are proposed and evaluated.

CHAPTER 3
Queue Sectors RED (QSRED) Strategy
Traditional congestion control strategies use the actual queue size to
control congestion in TCP gateways. In contrast, RED uses an Exponentially
Weighted Moving Average (EWMA) of the queue size to control congestion.
Some research suggests that there is a mismatch between the microscopic and
macroscopic behavior in RED's queue management mechanism. This Chapter
investigates this problem and proposes Queue Sectors RED (QSRED) strat-
egy to enhance performance. QSRED is simulated against RED and ERED
(E�ective RED) by measuring: throughput, link utilization, packet loss and
average delay using the NS2 simulator. The results suggest that Queue Sectors
RED (QSRED) helps RED overcome the mismatch between microscopic and
macroscopic behavior of queue length dynamics.
This Chapter is organized as follows: Section 3.1 presents a background
about the use of the average and actual queue size parameters in TCP conges-
tion control. Section 3.2 describes the relationship between the queue dynam-
ics and bu�er over�ow. Section 3.3 describes the limitations of E�ective RED
(ERED). Section 3.4 presents some of the gaps in ERED's implementation. A
novel strategy QSRED is proposed in Section 3.5. The network topology and
simulation results are presented in Sections 3.6 and 3.7 respectively. Section
3.8 summarizes this Chapter.
3.1. Background
Abbasov and Korukoglu proposed ERED [1] and claimed that it provides
greater throughput and packet send capability when compared with other RED
variants. This research also states that other RED variants reduce their queue
38

3.1. BACKGROUND 39
size to zero when the bu�er over�ows, lowering network performance. In con-
trast, ERED only reduces the packet drops in case of bu�er over�ow. Abbasov
and Korukoglu also state that other RED variants cause bu�er over�ows in
the presence of bursty tra�c. This Chapter investigates the algorithm and
simulation scenarios of ERED and proposes enhancements.
Modern TCP routers implementing RED play a major role in queue
management and congestion control. As described in Chapter 2, TCP routers
dropped packets from the tail of the queue; hence called TD routers. TCP
uses packet drops in intermediate routers as a signal of congestion. When a
TD gateway over�ows due to persistant congestion; all network sources reduce
their sending rate simultaneously, reducing the link utilization. This problem
is called global synchronization. ERED adds functionality to the classic RED
algorithm to avoid this problem. This function is achieved by monitoring the
actual queue size in the gateway.
Congestion control is subject to design strategies and algorithms that
can dynamically control tra�c sources when demand exceeds the available ca-
pacity. Enhancements to TD were proposed to avoid global synchronization.
Therefore, new queue management approaches avoid the direct use of the ac-
tual queue length in estimating the drop level. Also, the new congestion control
strategies aim to inform TCP senders of congestion before the bu�er over�ows.
Newer congestion control mechanisms use the average queue size instead of the
actual queue size to estimate the drop level. In addition, the drop probability
is calculated to determine the drop rate which is increased/decreased whilst
the average queue size traverses from low to high levels in the gateway bu�er.
Queue management algorithms drop packets from the gateway bu�er de-
pending on a preset queue level (threshold). When the queue size exceeds this
threshold, the gateway starts dropping packets to avoid congestion. Classic
congestion control strategies monitor the actual queue size to handle conges-
tion. Instead of the actual queue size check, the Random Early Detection
(RED) maintains an Exponentially Weighted Moving Average (EWMA) to

3.2. THE QUEUE SIZES MISMATCH AND BUFFERS OVERFLOW 40
monitor the queue dynamics. When the average queue size exceeds the thresh-
old, RED drops packets randomly from the queue.
Research showed that there is a di�erence between the behaviours of the
actual queue size and the average queue size [10] [56] [50]. It is possible for
RED gateway to maintain a low average queue size whilst a peak in the actual
queue size is exceeding the threshold and approaching the bu�er limit. Hence,
the average queue size dynamics are referred by the macroscopic behavior of the
queue. Similarly, the microscopic behavior of the queue denotes the dynamics
of the actual queue size. This Chapter discusses the mismatch between the
microscopic and macroscopic behaviour of queue length dynamics in AQM
strategies, particularly RED-based strategies.
3.2. The queue sizes mismatch and bu�ers over�ow
Historically, congestion used to be controlled by network source mech-
anisms. When the intermediate router over�ows and a packet is dropped,
the source algorithm detects congestion and reduces the sending rate. As the
�eld of congestion control evoloved, researchers noticed that the best place
to control congestion is the gateway itself; because the gateway recognizes
the dynamics of the actual queue size. Therefore, many gateway algorithms
have been developed to detect the initial stages of congestion and avoid bu�er
over�ow.
3.2.1. Source algorithms and bu�ers over�ow
When router bu�ers become full, packets are dropped. TCP senders
detect lost packets with duplicate acknowledgements. This means that the
source algorithm detects congestion after the intermediate router is over�owed
and a packet is already dropped.
Source algorithms are very useful for congestion control in TCP networks.
However, there must be a strategy to manage the intermediate router queue

3.2. THE QUEUE SIZES MISMATCH AND BUFFERS OVERFLOW 41
and inform the source of congestion implicitly or explicitly. Thus, TCP source
algorithms works in conjunction with the intermediate router algorithms.
As mentioned in Chapter 2, traditional queue management strategies
were simple. The gateway de�nes a drop level (threshold) which is normally
the queue limit. Whenever the queue size exceeds this drop level, the gateway
starts dropping packets in the order they arrive which is First-In First-Out
queue management. One of the simplest and oldest implementations for queue
management is the Tail Drop (TD); in which the packets are dropped from
the tail of the queue. A packet has to be dropped �rst due to bu�er over�ow,
then TCP source detects congestion implicitly.
The TD algorithm has three major problems. The �rst is the lock out
problem. This occurs when a few nodes monopolize the whole network band-
width [64]. The second problem is the full queue problem which occurs when
a gateway continually sends full queue signals to sources for an extended pe-
riod of time [64]. The third problem is the global synchronization when all
TCP sources reduce their sending rate at the same time [29]; resulting in low
throughput. Global synchronization is investigated in Chapter 5. Lock out
and full queue problems are described further in Chapter 4.
3.2.2. Gateway algorithms and the avoidance of bu�er over�ow
As illustrated in section 3.2.1, gateways used to su�er from the bu�er
over�ow problem. There was a need to detect the initial stages of congestion
and inform the TCP source before bu�er over�ow. This approach is called
the Active Queue Management (AQM). The Random Early Detection (RED)
adopts the active queue management approach by maintaining an Exponen-
tially Weighted Moving Average (EWMA) of the queue size on intermediate
routers [29]. Instead of dropping packets based on the actual queue size, RED
drops packets based on the average queue size avg. The drop rate of RED
is increased/decreased using a drop probability pa. Equations 2.3, 2.4 and

3.2. THE QUEUE SIZES MISMATCH AND BUFFERS OVERFLOW 42
2.5 illustrate how RED calculates the average queue size avg, the initial drop
probability pb and the accumulative drop probability pa respectively.
By maintaining two drop levels (the maximum and minimum thresholds),
RED overcomes the drawbacks of TD. In order to control congestion e�ciently,
these two drop levels should work in conjunction with other parameters, such
as the weight parameter wq and the maximum drop probability maxp. How-
ever, parameter con�guration in RED is di�cult because it is dependent on the
tra�c type [51]. Parameter setting also depends on the number of active con-
nections, bu�er space limitations and the severity of congestion. For example,
if the di�erence between the maximum and minimum thresholds is too small
then the strategy operates similarly to the TD implementation. Conversely, if
this di�erence is too big, then RED would mismatch the average and actual
queue sizes; resulting in bu�er over�ow. It is the same for parameter wq in Eq.
2.3. Small values for this parameter lead to a mismatch between the average
and actual queue length dynamics.
RED also has a problem with the setting of the drop probability pa which
is a function of the parameter maxp. The parameter maxp is a constant in
the traditional RED implementation. If the maxp parameter is assigned high
value, then the drop probability pa will be high; resulting in unfair packet
drops. Therefore, some RED variants have proposed to use a dynamic maxp
parameter [64] [15].
The estimated average queue size in RED does not re�ect the mean
of the actual queue size; rather it is a function of the weight parameter in
Eq. 2.3. Smaller weight parameters exacerbate the mismatch between the
average and actual queue sizes. When the mismatch happens, the actual queue
size exceeds the available bu�er size and a packet is dropped. For example,
RED may not recognize a current peak in the actual queue size because it
is working with the average queue size which is kept low. Immediately, the
congestion is detected by the source algorithm due to packet drop using the
TCP self-clocking technique. In this case, network performance under RED

3.3. EFFECTIVE RED (ERED) STRATEGY 43
may be similar to TD. Therefore, the mismatch between the microscopic and
macroscopic behaviour of queue length dynamics causes three problems:
(1) The congestion avoidance technique used by RED will be switched
back to congestion recovery by the source algorithm.
(2) Same as TD, RED will su�er from lock out, full queue and global
synchronization.
(3) Higher drop rate is expected due to bu�er over�ow.
Figure 3.1 depicts the mismatch between the average and actual queue sizes.
The average queue size, in RED gateways, is the macroscopic behavior of
that queue because it re�ects the long term dynamics of the queue length.
Conversely, the microscopic behavior of queue re�ects the short term dynamics
or the actual queue size. Prior research has shown large di�erences between
the average and the actual queue dynamics [10][50] [56].
Problems occur when tra�c bursts arrive at an already congested gate-
way. If RED maintains a small weight parameter then the average queue size
will be increased slowly. As a result, the gateway bu�er over�ows and packets
are dropped. Congestion will be only detected by TCP sources. After con-
gestion returns to the normal level, the average queue size will be increased.
This can lead to unnecessary packet drops. These unnecessary drops cause the
congestion window to be reduced after congestion has been alleviated and well
be below the optimal level.
E�ective RED (ERED) [1] strategy is a modi�cation of RED. In this
strategy, two drop levels max‘th and min‘th have been added to the normal
RED algorithm. The strategy monitors both the average and actual queue
sizes to avoid the mismatch between the average and actual queue sizes. This
has the bene�t of reduced bu�er over�ows and drop rates.
3.3. E�ective RED (ERED) Strategy
E�ective RED provides some enhancements to the classic RED. In small
or empty queue stages, RED drops packets when the average queue size exceeds
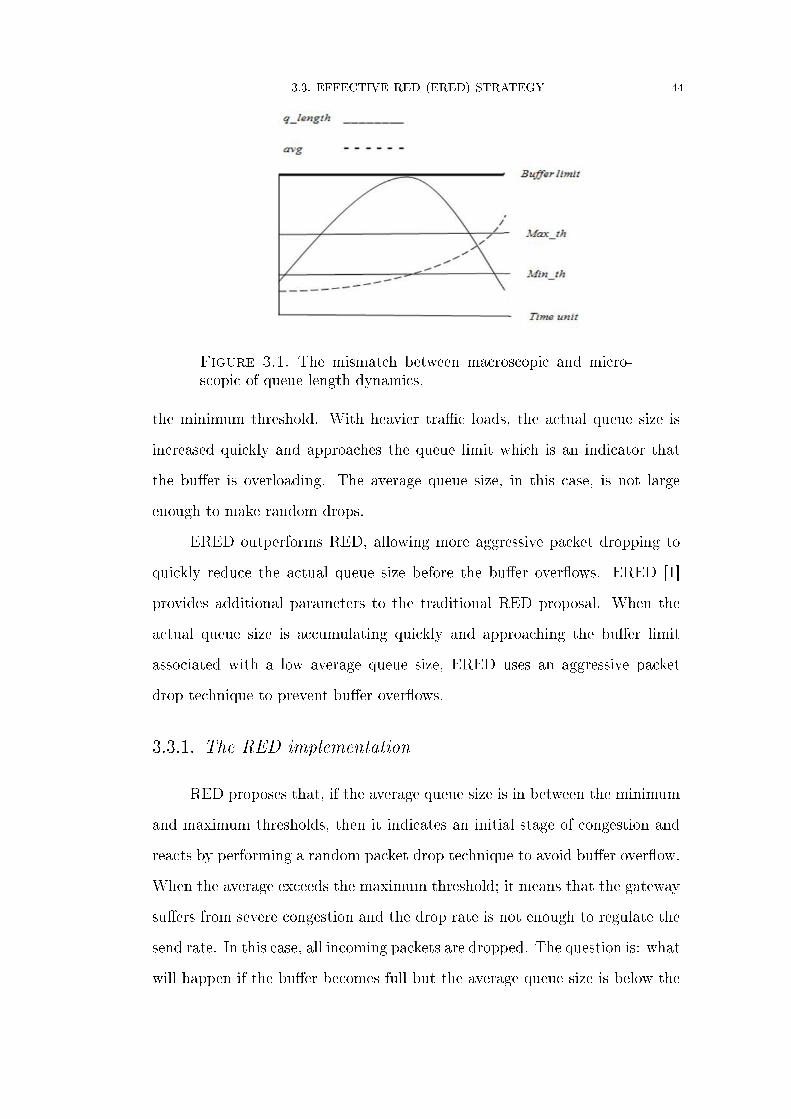
3.3. EFFECTIVE RED (ERED) STRATEGY 44
Figure 3.1. The mismatch between macroscopic and micro-scopic of queue length dynamics.
the minimum threshold. With heavier tra�c loads, the actual queue size is
increased quickly and approaches the queue limit which is an indicator that
the bu�er is overloading. The average queue size, in this case, is not large
enough to make random drops.
ERED outperforms RED, allowing more aggressive packet dropping to
quickly reduce the actual queue size before the bu�er over�ows. ERED [1]
provides additional parameters to the traditional RED proposal. When the
actual queue size is accumulating quickly and approaching the bu�er limit
associated with a low average queue size, ERED uses an aggressive packet
drop technique to prevent bu�er over�ows.
3.3.1. The RED implementation
RED proposes that, if the average queue size is in between the minimum
and maximum thresholds, then it indicates an initial stage of congestion and
reacts by performing a random packet drop technique to avoid bu�er over�ow.
When the average exceeds the maximum threshold; it means that the gateway
su�ers from severe congestion and the drop rate is not enough to regulate the
send rate. In this case, all incoming packets are dropped. The question is: what
will happen if the bu�er becomes full but the average queue size is below the

3.3. EFFECTIVE RED (ERED) STRATEGY 45
maximum threshold?. This scenario is an example of the mismatch problem
between the macroscopic and microscopic beviours of the average and actual
queue sizes. ERED is proposed by Babek Abbasov and Serdar Korukoglu to
avoid this problem. Section 3.3.3 describes the ERED's algorithm.
Abbasov and Korukoglu noticed that RED avoids overreacting to tempo-
rary tra�c bursts and instead reacts to longer-term trends. They also noticed
that, when RED thresholds are compared to the weighted average with a typ-
ical weighting factor (wq of 1/512 ), it is possible that no forced drops will
occur, even when the instantaneous queue length is quite large.
The random drop technique is triggered by RED when the average queue
size exceeds the minimum threshold up to the maximum threshold. In contrast,
forced drop technique for every arriving packet is performed by RED when the
average exceeds the maximum threshold. The drop probability in the random
drop area is calculated depending on other parameters which are: the initial
drop probability pb, maxp and avg.
When a new packet arrives and the average queue size is in between
the minimum and maximum threshold, a random number R ∈ [0, 1] from
the uniform distribution on [0,1] is assigned to that packet. RED algorithm
marks/drops the arriving packet if R < pa. Abbasov and Korukoglu have an-
other comment about this technique. The impact of a given average queue size
is bounded by the value of minth which depends on both maxp and maxth.
All these parameters are preset by RED and the criteria of setting those pa-
rameters is not clearly determined. This means that one may �nd a value for
minth that results in good performance, but it may only be in combination
with particular values ofmaxp andmaxth. This can be generalized for all RED
parameters. See section 2.9 for more details on RED.

3.3. EFFECTIVE RED (ERED) STRATEGY 46
3.3.2. RED's shortcomings
It has been shown that RED outperformed TD in many aspects. Ab-
basov and Korukoglu [1] discuss that there are some drawbacks in RED's per-
formance. Using the NS2 simulator, they highlighted some weakness in RED's
algorithm through analysis of simulation results for RED's parameters. They
noticed the following malfunctions in RED performance:
• In the case of extreme congestion, RED still only marks a fraction
(maxp) of the arriving packets and the gateway will fail to control
the average queue size until it exceeds the maximum threshold. As
a result, RED will drop every arriving packet until congestion is con-
trolled.
• When the average queue length traverses from the minimum threshold
to the maximum threshold, RED keeps marking/dropping the arriving
packets with probability pa, where pa is a function of the average queue
size. In this case, RED keeps dropping packets, even though the actual
queue size is small or the bu�er is empty.
• In case of congestion detection, connections reduce their sending rate
immediately; resulting in quick decrease in the actual queue size whilst
the average queue size is decreased slowly. Therefore, arriving pack-
ets will be unfairly dropped with higher drop probability due to the
high average queue size. This problem is caused by false congestion
noti�cation.
• In case of heavy tra�c loads, the queue will accumulate quickly and
exceed the bu�er limit whilst the average queue size is less than the
minimum threshold, causing bu�er over�ow before the activation of
the random drop technique.
• RED performance is reduced when the number of active connections
increases.

3.3. EFFECTIVE RED (ERED) STRATEGY 47
• RED is very sensitive to tra�c load variations and many queue oscil-
lations are observed.
• RED performance is negatively a�ected by large packet sizes.
• RED behavior is determined by four parameters: minth, maxth, maxp
and wq. Erroneous con�guration for one of these parameters will
reduce RED performance.
3.3.3. ERED's algorithm
ERED proposes some changes to the original RED algorithm to avoid
the drawbacks in section 3.3.2 without changing the queue weight parameter
wq. ERED strategy adjusts the maximum threshold maxth and the minimum
threshold minth parameters. Eq. 3.7 and Eq. 3.8 illustrate how ERED sets
these parameters.
(3.7) max′th = 2 ∗maxth
(3.8) min′th =maxth +minth
2+minth
If ( min′th < avg < max′th ) & (qlen > min′th), ERED drops each arriving
packet with probability pa to match the current queue size with the average
queue size. If (avg < min′th) & (qlen > 1.75maxth) the strategy drops the
arriving packets with probability pb. This technique is used by ERED to avoid
bu�er over�ow due to a peak in the actual queue size whilst the average queue
size is less than the minimum threshold. Thus, ERED de�ers from RED by
applying the actual queue size check in addition to the value of the average
queue size. If (avg > K) & (qlen < T ) then avg = N , this is to avoid the
misleading congestion noti�cation. K , T and N are calculated by Eq. 3.9,
Eq. 3.10 and Eq. 3.11 respectively. Table 3.1 illustrates the ERED algorithm.

3.3. EFFECTIVE RED (ERED) STRATEGY 48
Section 3.5 proposes the Queue Sectors RED (QSRED) which is a modi�cation
to overcome some of ERED's disadvantages.
(3.9) K =maxth −minth
2+minth
(3.10) T =maxth +minth
2+maxth
(3.11) N =2(maxth +minth)
3+minth
3.3.4. ERED evaluation
ERED was evaluated [1] using the NS2 simulator. The network per-
formance under ERED has been compared with the performance of BLUE,
REM, SRED, LDC and FRED which are all AQM strategies. RED variants
are normally tested using a bottleneck link topology, which is the same topol-
ogy used by Abbasov and Korukoglu to evaluate ERED. Figure 3.2 illustrates
this topology. In this topology, n TCP sources feed an intermediate router
which is connected to a sink using a bottleneck link. In order to evaluate the
impact of the tra�c load variations, TCP sources produce di�erent levels of
tra�c loads and hence di�erent levels of congestion on the bottleneck link will
be generated. The maximum size allowed for gateway queue is 50 packets.
Table 3.2 illustrates the parameters that are used for ERED evaluation.
TCP sources used the exponential distribution for packet propagation with
mean of 0.3s. Pareto distribution is used for �le sizes with mean 10,000 and
shape 1.5. Table 3.3 shows the performance evaluation for ERED and the
other strategies included in the study.
Abbasov and Korukoglu have tested ERED under a per-�ow congestion

3.3. EFFECTIVE RED (ERED) STRATEGY 49
Table 3.1. Detailed algorithm of ERED.
Initialization:avg = 0
count = −1for each packet arrival
calculate the new average queue size avg:if the queue is nonemptyavg = (1− wq)avg + wqq
elsem = f(time− qtime)avg = (1− wq)
mavgif (min′th ≤ avg < max′th) && (q ≥ min′th)
increment countcalculate probability pa:
pb = maxp(avg −minth)/(maxth −minth)pa = pb/(1− count.pb)with probability pa:
mark the arriving packetcount = 0
else if (avg < min′th) && (q > 1.75 ∗maxth)calculate probability pd:
pc = maxppa = pc/(1− count.pc)with probability pd:
mark the arriving packetcount = 0
else if (max′th ≤ avg )mark the arriving packet
count = 0else count = −1
when queue becomes emptyqtime = time
for each packet departureif (avg > K) & (q < T )
avg = N
Figure 3.2. Simulation network topology to evaluate ERED'sperformance [1].

3.3. EFFECTIVE RED (ERED) STRATEGY 50
Table 3.2. Parameter con�guration for ERED evaluation
Strategy Parameter setting
RED minth=5, maxth=15, , wq=0.002, maxp=1/150, gentle = true
SRED maxp = 0.15, p = 0.25FRED minq = 4BLUE d1 = 0.00025, d2 = 0.0025,
freeze− time = 100msREM φ=1.001, γ=0.001, wq =0.002LDC Dtarget= 4s, wq=0.002, wr=0.998, n =3,
Rtarget=0.95, τ=0.002 s, weights of 3/4and 1/4 for the delay and load
components respectivelyERED minth=5, maxth=15, wq=0.002, maxp
=1/150
Table 3.3. Performance evaluation for ERED and other REDvariants
Strategy Packetsreceived
Packetssent
Packetsdropped
Packet lossrate
Throughput
ERED 8370.143 8155.071 206.3571 0.0235 1.192354
SRED 8521.571 8149.929 324.7143 0.0352 1.192310
RED 8487.000 8018.6 43 463.4286 0.0612 1.170581
REM 8459.64 3 8144.214 304.4286 0.0356 1.190913
BLUE 8358.357 8055.500 295.2857 0.0362 1.176324
LDC 8448.357 8068.214 371.8571 0.0455 1.17936 8
FRED 8631.714 7280.500 1350.2860 0.1755 1.054913
control model. They ran their simulator for 50s and 100s and compared the
loss rate, delay and jitters of ERED with other AQM strategies. Figure 5.16
illustrates the packet loss rate produced by 50s simulation time. In Fig. 3.4
they increased the simulation time to 100s and monitored the loss rate. In
Fig. 3.11 and Fig. 3.12 they plot the network delay and jitter. Figures 3.5
to 3.10 depicts the actual queue length dynamics for all strategies included in
their study.
Abbasov and Korukoglu claimed that ERED is the most conservative
strategy. As the number of active �ows increases ERED achieves the lowest
loss rate, which is depicted in Fig. 3.4. The rest of the strategies were judged

3.3. EFFECTIVE RED (ERED) STRATEGY 51
Figure 3.3. Packet loss rate versus number of �ows for 50ssimulation time [1].
Figure 3.4. Packet loss rate versus number of �ows for 100ssimulation time [1].

3.3. EFFECTIVE RED (ERED) STRATEGY 52
against the loss rate and sorted from lowest to highest as: SRED, REM, BLUE,
LDC, RED and FRED. This study [1] also shows that the re�nements produced
by ERED help RED reduce the packet lost rate.
Other performance parameters, such as ``total received packets'', ``total
sent packets'', ``total number of dropped packets'', are demonstrated in Table
3.3. ERED dropped 206 packets out of the 8370 packets that arrived at the
gateway during simulation time. The average throughput and average packet
loss rate are 1.192354 and 0.23500 respectively. Thus, ERED outperformed
the other strategies and produced superior network performance. Abbasov
and Korukoglu also monitored the bu�er queue size and claimed that ERED
produces steady queue sizes, as illustrated in Fig. 3.5. The results in Fig. 3.5
suggest that strategies other than ERED produce more elastic queues. The
packets are also dropped due to bu�er over�ow, as illustrated in Fig. 3.6 to
Fig. 3.9.
In the same study, Abbasov and Korukoglu claimed that RED variants
such as FRED often reduce the queue size to zero in case of heavy tra�c loads
to avoid bu�er over�ow. This technique could be successful to avoid bu�er
over�ow as depicted in Fig. 3.10, has the negatve a�ect of reducing the link
utilization and throughput and increasing packet loss. This is also illustrated
in Table 3.3.
The authors in [1] proposed ERED as a compromise between aggressive
AQM algorithms such as FRED and conservative strategies such as SRED.
Congestion detection is more accurate in ERED by avoiding the misleading
congestion noti�cations. In addition, ERED is more sensitive to the earlier
stages of congestion. Section 3, describes ERED's implementation.
The delay and jitter under the ERED-AQM strategy are illustrated in
Figures 3.11 and 3.12 respectively. As the number of �ows increases, FRED
shows the lowest delay and jitter values because of the high packet drop rate.
RED and FRED were both considered as aggressive strategies by the authors
of ERED [1]. The results suggest that RED and FRED produce low delay and

3.3. EFFECTIVE RED (ERED) STRATEGY 53
Figure 3.5. Queue length dynamics for ERED [1].
Figure 3.6. Queue length dynamics for RED [1].
Figure 3.7. Queue length dynamics for SRED [1].
Figure 3.8. Queue length dynamics for REM [1].

3.4. GAPS IN ERED'S EVALUATION 54
Figure 3.9. Queue length dynamics for LCD [1].
Figure 3.10. Queue length dynamics for FRED [1].
jitter values.
3.4. Gaps in ERED's evaluation
The performance of ERED was evaluated against the loss rate. Simula-
tions have shown that ERED reduces the loss rate. This section investigates
the parameter con�guration that was used to evaluate ERED, particularly the
maximum drop probability maxp and the actual queue size check.
3.4.1. Parameter con�guration
The maximum drop probability maxp is one of the main parameters
that a�ect the overall performance of RED variants. Table 3.2 illustrates
the parameter con�guration used in [1]. The following sections consider the
accuracy of the maxp parameter. Also the con�gurations of the maximum
threshold, minimum threshold and the drop probability are investigated.

3.4. GAPS IN ERED'S EVALUATION 55
Figure 3.11. Compression between ERED's delay and otherAQM algorithms [1].
Figure 3.12. Compression between ERED's jitter and otherAQM algorithms [1].

3.4. GAPS IN ERED'S EVALUATION 56
3.4.1.1. Maximum drop probability maxp: The role of maxp is active when
the average queue size is in between the minimum threshold and maximum
threshold. When the average queue size is halfway between minth and maxth,
the gateways drops roughly one out of 1/maxp packets. For example, if the
maximum drop probability is preset to 0.1, the gateway drops on average, one
out of 10 of the arriving packets. When the average queue size approaches the
maximum threshold, RED will mark or drop nearly one �fth of the arriving
packets. Thus, the robustness of RED lies in the slow changes in the drop
probability depending on the average queue size changes. In case of heavy
congestion, the average queue size will be preemptively increased. When the
average queue size exceeds the maximum threshold, the drop probability will
be set to one. In other words, the gateway marks/drops every arriving packet.
Floyd and Jacobsen in [29] recommend that setting maxp greater than
0.1 will increase the drop rate and make RED too aggressive against bursty
tra�c. Conversely, maxp values less than 0.01 will unfairly reduce the drop
probability. Abbasov and Korukoglu set maxp to 1/150 in Table 3.2 which is
nearly equal to 0.0067. This was compared with SRED where the maxp was
set to 0.15. The con�guration for this parameter is not clear for the rest of the
strategies in the same table, except for RED which was set to 1/150. However,
the parameter gentle is set to true for RED and this option multiplies maxp
when the average queue size exceeds a prede�ned threshold. This explains the
low drop rate for ERED comparing with the other strategies included in the
study.
3.4.1.2. Maximum and minimum thresholds (maxthandminth). RED works
e�ectively when the di�erence between the maximum threshold and minimum
threshold is larger than the typical increase in the calculated average queue
size in one round-trip time [29]. The most e�cient values for the maximum
and minimum thresholds are estimated relating to the desired average queue
size. The authors in [1] set the maximum threshold to twice the minimum
threshold which is just a rule-of-thumb recommended for normal tra�c in [29].

3.4. GAPS IN ERED'S EVALUATION 57
For bursty tra�c, it is suggested to set a large minimum threshold to increase
link utilization. For tra�c in ERED's simulations, the minimum threshold of
�ve packets would result in low link utilization. The minth parameter was not
investigated in [1].
The maximum threshold parameter should be set depending on the max-
imum average delay permitted by the gateway. In addition there should be
enough space between the maximum threshold and minimum threshold in or-
der to absorb the short-lived bursty tra�c and transient congestion. Hence,
it would be better to set the maximum threshold, depending on the gateway
bu�er space, for heavy tra�c loads simulated in [1].
3.4.1.3. Actual and initial drop probabilities (pa and pb). ERED applies a
technique to check the mismatch between the behaviours of the actual queue
size and the average queue size. When the average queue size is less than
the min′th and the actual queue size is nearly twice the maximum threshold
(1.75maxth), then ERED drops the arriving packets with probability pb instead
of probability pa. In this case, ERED gateway considers the peak in the actual
queue size as a congestion indication and replaces the actual drop probability
with the initial drop probability to avoid bu�er over�ow. This scenario has
more than one drawback:
First, the maximum threshold used to evaluate ERED in Table 3.2 is
15 packets. Abbasov and Korukoglu used Eq. 3.8 to calculate the parameter
min′th, also 15 packets. RED drop technique is disabled when the average
queue size is less than the actual minimum threshold (minth). The actual
queue size check is applied by ERED when the average queue size is in between
the normal minimum and maximum thresholds (minth and maxth). In this
situation, ERED will work same as the classic RED strategy.
Second, it has been shown in section 3.4.1.1 that the parameter maxp
used in [1] was too small. The study also shows that the lower maximum drop
probability is the lower drop rate for the RED variant. This explains the low
loss rate achieved by ERED in Table 3.3.

3.4. GAPS IN ERED'S EVALUATION 58
Third, when the average queue size traverses between the minimum and
maximum thresholds, RED uses Eq. 2.4 to calculate the initial drop probability
pb. The parameter count represents the number of dropped packets since the
last dropped packet. The count parameter has to be included in the calculation
of the �nal drop probability pa, in Eq. 2.5. By doing so, RED fairly distribute
the intervals between dropped packets to avoid global synchronization [29]. It
is recommended in [29] that the number of arriving packets between succes-
sive marked packets should be a uniform random variable. Hence, the use of
the initial drop probability pb instead of the accumulative drop probability pa
in ERED will cause global synchronization. Also, the value of pb is always
less than the value of pa. Therefore, ERED is always less aggressive than
other RED variants and drops fewer packets, with the higher risk of global
synchronization.
3.4.2. Actual queue size check
RED divides the gateway bu�er into three sectors and calculates the
average queue size. Figure 3.13 illustrates RED's sectors. Sector one covers
the area between the empty queue and the minimum threshold. If the average
queue size is in this area, RED does not apply any action. The second sector
covers the area between the minimum threshold and maximum threshold. If
the average is in this sector then RED calculates the initial and accumulative
drop probabilities and starts dropping packets using the accumulative drop
probability. If the average queue size exceeds the maximum threshold then
all arriving packets will be dropped. In contrast, ERED divides the gateway
bu�er into seven sectors which are illustrated in Fig. 3.14. ERED monitors
both the average and actual queue sizes in three positions. Following is a
comparison between the functions of RED and ERED in the permutations of
actual and average queue lengths:
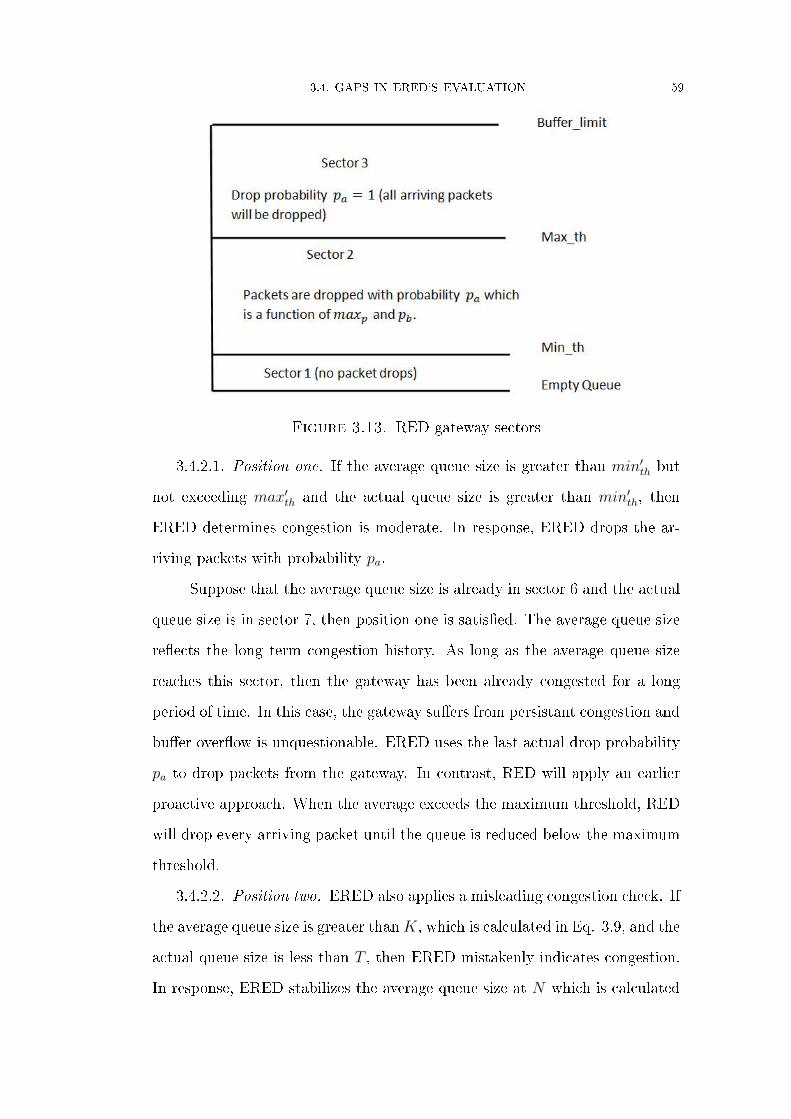
3.4. GAPS IN ERED'S EVALUATION 59
Figure 3.13. RED gateway sectors
3.4.2.1. Position one. If the average queue size is greater than min′th but
not exceeding max′th and the actual queue size is greater than min′th, then
ERED determines congestion is moderate. In response, ERED drops the ar-
riving packets with probability pa.
Suppose that the average queue size is already in sector 6 and the actual
queue size is in sector 7, then position one is satis�ed. The average queue size
re�ects the long term congestion history. As long as the average queue size
reaches this sector, then the gateway has been already congested for a long
period of time. In this case, the gateway su�ers from persistant congestion and
bu�er over�ow is unquestionable. ERED uses the last actual drop probability
pa to drop packets from the gateway. In contrast, RED will apply an earlier
proactive approach. When the average exceeds the maximum threshold, RED
will drop every arriving packet until the queue is reduced below the maximum
threshold.
3.4.2.2. Position two. ERED also applies a misleading congestion check. If
the average queue size is greater thanK, which is calculated in Eq. 3.9, and the
actual queue size is less than T , then ERED mistakenly indicates congestion.
In response, ERED stabilizes the average queue size at N which is calculated

3.4. GAPS IN ERED'S EVALUATION 60
using Eq. 3.11. Stabilizing the average queue size at a particular level, grants
a uniform distribution for packet dropping which reduces the risk of global
synchronization. This stabilization is perfect when the average queue size is
roughly halfway between the minimum and maximum threshold with adequate
setting for the maximum drop probability [29]. ERED in this position will
maintain high average queue size. For example, the minimum threshold and
maximum thresholds used to evaluate ERED in [1] were 5 and 15 respectively.
Thus, ERED will assign the value 18 for N using Eq. 3.11. In this case,
the average queue size will be greater than the maximum threshold and every
arriving packet will be dropped. Therefore, ERED would not outperform RED
in this position unless inequality 3.12 is satis�ed.
(3.12) minth ≤ N ≤ maxth
3.4.2.3. Position three. The �nal check for ERED is when the average
queue size is less than K (sectors 1 and 2) and the actual queue size is greater
than 1.75maxth (approaching sector 7). In this case, ERED drops packets with
probability pb. The average queue size is very low whilst a peak in the actual
queue size is approaching the queue limit. Sector one should not be investi-
gated in this position because RED variants do not drop packets when the
average queue size is less than the minimum threshold. Sector two belongs to
the area between the minimum and maximum thresholds. In this area, RED
normally drops packets with the accumulative drop probability pa which is al-
ways higher than the initial drop probability pb that is used by ERED. Apart
from the global synchronization that can be incurred by using the initial drop
probability pb the drop rate of ERED will be less than the drop rate of RED.
This was illustrated in section 3.4.1.3.
There are three possible scenarios for ERED's performance depending on
the nature of the peak in the actual queue size:

3.4. GAPS IN ERED'S EVALUATION 61
(1) Short lived bursty tra�c: if the peak is generated by short lived bursty
tra�c, then RED will be more aggressive than ERED and unneces-
sarily drop packets.
(2) Transient congestion: if the peak in the actual queue size is generated
by transient congestion, then there is no need to increase the drop
rate. Therefore, ERED with low drop probability pb will outperform
RED with high drop probability pa.
(3) Persistent congestion: the average queue size re�ects the long-term
queue dynamics. The gateway will be misled in detecting the long-
term congestion due to the previous history of the queue. This means
that the gateway has not su�ered from any serious congestion prob-
lems for long period of time and the queue will continue in steady
state. When the persistent congestion starts with a peak in the ac-
tual queue length, the gateway would not recognize the congestion.
To solve this mismatch between the average queue size and the actual
queue size, the drop rate must be increased quickly before the bu�er
over�ows. There are two options to increase the drop rate.
The �rst option is to increase the drop probability. In this case, the drop
rate of RED will be higher than the drop rate of ERED. Hence, RED will
be better than ERED in controlling the persistent congestion. The parameter
maxp can play a main role in increasing and decreasing the drop probability.
If the gateway maintains adjustable maxp parameter, then the drop rate can
be increased and decreased depending on the state of congestion. Abbasov
and Korukoglun used small maxP value to evaluate ERED which makes the
problem of the persistent congestion worse. Section 3.5 proposes new dynamic
maximum drop probability (maxP ) to solve this problem.
The second option is to increase the average queue size itself, because the
drop rate in upper sectors is higher than the drop rate in lower sectors. Some
RED variants maintain preset parameters to increase and decrease the average

3.5. QSRED ALGORITHM 62
queue size. Chapter 5 proposes a new technique to increase the sensitivity of
the average queue size to changes in the actual queue size. This is achieved by
controlling the the weight parameter (wq) in Eq. 2.3.
3.4.3. Queue Sectors
There are some drawbacks in ERED's drop levels (sectors). Table 3.4
illustrates a sample of the possible con�guration for ERED drop levels. The
problem with these thresholds that they mainly depend on the actual maxi-
mum threshold (maxth) and minimum threshold (minth). It has been shown
that the setting of these parameters is problematic [29], complicating the de-
sign of ERED. Suppose, for example, that the bu�er limit in ERED gateway
is 60 packets. It is easy then to �nd some scenarios in Table 3.4 where some
of the drop levels exceed the bu�er limit. In this case, the gateway will not
apply the ERED algorithm for congestion control; rather it goes back to the
normal RED algorithm.
The job of the thresholds is very critical, because they determine the
time and rate of packets drop. Thus, any erroneous con�guration for the drop
level will a�ect the overall performance of the network. Regardless of the
even distribution for ERED sectors in Fig. 3.14, the real distribution could be
inconsistent. The drop levels can be intersected in the current con�guration of
ERED. For example, in scenario 1, Table 3.4, the parameters maxth and min′th
intersect which will disable the function of one of the thresholds. Section 3.5
presents more consistent distribution for ERED sectors.
3.5. QSRED Algorithm
The novel approach in QSRED is to divide the gateway bu�er into six
equal sectors. The drop probability and maxp parameters are to be adjusted
when the actual and average queue sizes traverse between these sectors. This
section shows how this approach improves network performance and stability.

3.5. QSRED ALGORITHM 63
Figure 3.14. ERED sectors
Table 3.4. Sample of ERED's sectors
Scenario minth K maxth min‘th T max‘th N
1 5 10 15 15 25 30 18.333332 10 15 20 25 35 40 30.000003 17 21 25 38 46 50 45.000004 25 27.5 30 52.5 57.5 60 61.666665 30 35 40 65 75 80 76.666666 50 75 100 125 175 200 150.000007 60 100 140 160 240 280 193.33333
ERED added adjustable maxth and minth parameters; which matches
the microscopic and macroscopic behaviours of the queue in two situations.
However, ERED still has some drawbacks:
(1) ERED uses the normal parameters of the original RED. It is clear from
Eq. 3.7 and Eq.3.8 that max′th and min′th are functions of the normal
maxth and minth. Those parameters have the same con�guration
problem as RED [51].
(2) The strategy would be more powerful if the maxth and minth are
adjustable during the simulation run time in response to the tra�c
load dynamics.
(3) ERED proposed to keep low loss rate values but does not make any

3.5. QSRED ALGORITHM 64
calculation for the other three performance factors: throughput, link
utilization and delay.
(4) In Eq. 3.13, if the inequality is satis�ed then ERED uses the im-
mediate marking probability, which is a function of avg and maxp.
The value of maxp in this case, is minimally smaller, resulting in a
lower dropping rate. Hence, the risk of bu�er over�ows is high. In
such a serious situation, congestion control strategy should increase
the dropping probability to a value approaching 1. This will allow the
bu�er to be drained before it becomes overloaded.
(5) Equally, if the queue length is greater than the drop level (1.75maxth)
then it drops the arriving packets with probability pb. It is also clear
from the previous literature that there are no suggestions about the
optimal setting of this drop level.
Accordingly, we propose the following parameter con�guration to enhance
ERED's functionality:
Firstly, one of the best ways to avoid using max′th and min′th as func-
tions of the actual maxth and minth is to choose some parameters relating
to the bu�er size. There is no adequate way to set the maxth and minth of
a queue. However, if the gateway operates ERED, it is advantageous to use
smaller maxth and minth parameters to avoid exceeding the bu�er size when
calculating max′th and min′th parameters.
Secondly, there is an option to divide the bu�er into 6 equal sectors.
Then, a reasonable value for the max′th could be 4/6 bu�er size, keeping the
remaining 2/6 bu�er size for short lived bursty tra�c. The parameter maxth
can be equal to 3/6 (half of the bu�er size). The parameters min′th and minth
can be 2/6 and 1/6 bu�er size respectively.
Finally, to avoid the drawbacks (3) and (5) of ERED, it is advisable to
increase the drop probability to help the gateway drop the overloading packets.
If the inequalities in equations 3.13 and 3.14 are satis�ed then it is suggested to

3.5. QSRED ALGORITHM 65
Table 3.5. QSRED algorithm
** for every arriving packetif ( q_size >= Sec.5 and avg <= Sec.2)
Thenmaxp= 2 ∗maxp
ElseGo To: Traditional RED Implementation
set maxp to 2∗maxp. In addition, the inequality in Eq. 3.13 is replaced by the
inequality in Eq. 3.15 to execute the actual queue size check. Consequently,
the parameter (1.75maxth ) in inequality 3.14 of ERED is replaced by the
parameter (5/6 ∗ buffer− size). Also, the normal drop probability pa is used
instead of using the current small dropping probability pb. This has the e�ect
of speeding up the queue drain process in case of congestion. Table 3.5 shows
the algorithm of QSRED.
(3.13) (qlen > 1.75maxth)
(3.14) (avg < min′th)
(3.15) (ERED−Q > 5/6 ∗ buffer − size)
Consider, as an example, a bu�er with size 90 packets. Suppose that,
avg = 25, qlen = 80 and the initialmaxp = 0.01. Then, both of the inequalities
3.13 and 3.14 are satis�ed. ERED's parameter con�guration will be as in Table
3.2. In this situation, the queue is rapidly accumulating and the bu�er is about
to be overloaded while ERED keeps a small maxp value. This value is not big
enough to regulate the queue size. For better queue management performance,
the drop probability parameter is increased by a value that allows the queue
to return to the normal level (see pb, for the QSRED).

3.6. NETWORK TOPOLOGY 66
Table 3.6. Parameter con�guration for ERED and QSRED
ERED QSRED
minth 20 15maxth 40 45min′th 50 30max′th 80 60pb 0.25maxp 0.67maxppa 0.0025 0.00745
Figure 3.15. The simulator network topology.
QSRED monitors the actual and the average queue size values. If the
actual queue size is below sector �ve and the average queue size is below
sector two, the maximum drop probability parameter maxp is duplicated and
the accumulative drop probability pa is used instead of using the current drop
probability pb to drop the arriving packets. In this scenario, pa is the best drop
probability because its value is higher than pb. This helps to shrink the queue
quickly.
3.6. Network Topology
Fig. 3.15 illustrates the network topology used to test QSRED with four
network performance parameters. In this topology, six sources send packets
with a maximum window size equal to 2000 Bytes. The TCP version used here
is TCP-Reno. A sink immediately sends an acknowledgment packet when it
receives a data packet. Arrivals of sessions follow a Poisson distribution.
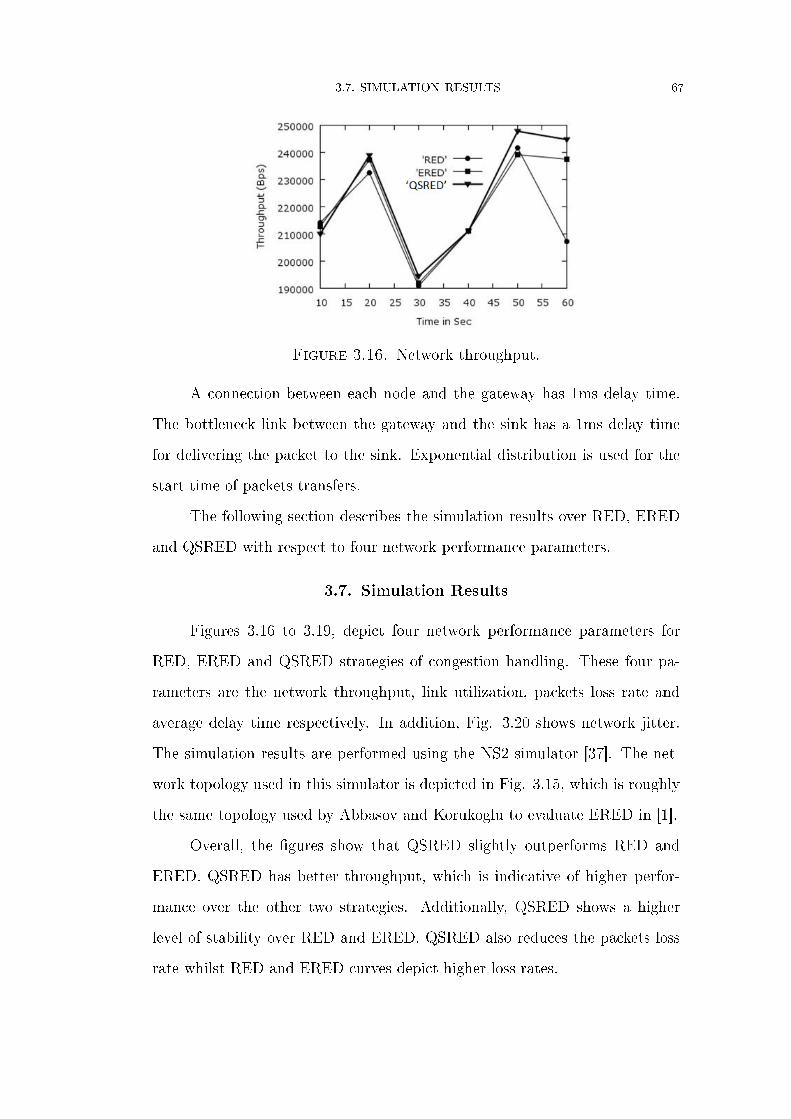
3.7. SIMULATION RESULTS 67
Figure 3.16. Network throughput.
A connection between each node and the gateway has 1ms delay time.
The bottleneck link between the gateway and the sink has a 1ms delay time
for delivering the packet to the sink. Exponential distribution is used for the
start time of packets transfers.
The following section describes the simulation results over RED, ERED
and QSRED with respect to four network performance parameters.
3.7. Simulation Results
Figures 3.16 to 3.19, depict four network performance parameters for
RED, ERED and QSRED strategies of congestion handling. These four pa-
rameters are the network throughput, link utilization, packets loss rate and
average delay time respectively. In addition, Fig. 3.20 shows network jitter.
The simulation results are performed using the NS2 simulator [37]. The net-
work topology used in this simulator is depicted in Fig. 3.15, which is roughly
the same topology used by Abbasov and Korukoglu to evaluate ERED in [1].
Overall, the �gures show that QSRED slightly outperforms RED and
ERED. QSRED has better throughput, which is indicative of higher perfor-
mance over the other two strategies. Additionally, QSRED shows a higher
level of stability over RED and ERED. QSRED also reduces the packets loss
rate whilst RED and ERED curves depict higher loss rates.

3.7. SIMULATION RESULTS 68
Figure 3.17. Network link utilization.
Figure 3.18. Average network delay.
Figure 3.19. Packet loss rate.

3.7. SIMULATION RESULTS 69
Figure 3.20. Network jitter.
One of the main goals of the RED proposal is to overcome the global
synchronization problem. In the presence of bursty tra�c, like the one used
in this simulator, global synchronization is still possible. It is clear from the
throughput �gure (Fig. 3.16) that the network su�ered from global synchro-
nization problem at time 20s. All sources reduced their sending rates at the
same time for RED, ERED and QSRED. In this case, the gateway su�ered
from congestion. The gateway starts to recover at time 30s. Again, the gate-
way su�ered from serious congestion level at time 50s which is the best time
to examine the performance of each strategy.
All strategies started propagation at the normal rate and the network was
steady until time 20s when the �rst congestion was occurred. The loss rate,
shown in Fig. 3.19, illustrates which strategy predicted congestion earlier.
The period of time that must be investigated, for this purpose, is the time
from 10s to 20s. During this period, the drop rate was steady for RED's
�gure which is followed by a sudden reduction in drop rate at time 20s. This
indicates that the average queue size was moving from the minimum threshold
to the maximum threshold in this period. All strategies intersected at time
15s which means that ERED and QSRED have already detected congestion
at time 15s and reduced their sending rate while RED continues dropping
at normal drop rate. At time 20s the average queue size hits the maximum

3.7. SIMULATION RESULTS 70
threshold. Hence, all strategies have to reduce the sending rate. It is clear
that QSRED outperformed both RED and ERED in this stage and achieved
higher throughput with fewer packet losses.
The gateway started to recover between the 30 and 50 seconds interval.
The congestion at this time is less aggressive than the previous one. However,
RED has dramatically increased the drop rate and the throughput reduced
as a result. This happened because of the high average queue size from the
previous history of the gateway. ERED and QSRED maintain low queue size
with conservative throughput.
With respect to the average delay time parameter, there were a few
intersections in the curves of the three strategies. Despite these intersections,
QSRED lowerd overall delay during the simulation. This has been re�ected in
Fig. 3.20. QSRED appears the most stable whereas RED and ERED results
show greater variance.
Figure 3.16 shows the throughput parameter for RED, ERED and QSRED
in bytes per second (Bps). The QSRED strategy has shown the best through-
put values. It is clear that RED achieved the lowest throughput values, partic-
ularly at the end of the simulation when throughput reached 207,000 Bps. It
was observed that ERED throughput is higher than RED but it is still smaller
than QSRED.
Figure 3.17 plots the link utilization parameter. It demonstrates that
QSRED link utilization is almost stable with the number of connections. In
contrast, ERED and RED link utilization �uctuate dramatically. It is also
noticeable that QSRED shows the highest link utilization with variant number
of connections.
Another important performance parameter, demonstrated in Fig. 3.19,
is the packet loss rate. QSRED reduced the packet loss rate to 4% of the
total number of packets propagated at time 30s. For RED, the loss rate was
very high and reached 30% of the total propagated packets at the end of the
simulation.

3.8. SUMMARY 71
Figure 3.18 illustrates the average network delay. Despite the oscillations
with increasing number of connections, the results suggest that QSRED adds
the lowest amount of delay. This suggests that QSRED maintains shorter
average queue sizes. The �gure shows that the maximum delay of RED exceeds
0.019s. For ERED this value exceeds 0.013s but with QSRED this value did
not exceed 0.007s. Furthermore, QSRED delay time has been kept below
0.001s for the majority of simulation time.
Figure 3.20 shows the amount of jitter introduced by the AQM strategies.
Although the results appear similar, QSRED expressed the best network jitter
results. The results, show that the minimum value for QSRED approaches
-0.35ms and the maximum value is close to 0.13ms. Conversely, the values
for ERED and RED ranged between -0.7ms to 0.33ms and -0.31ms to 0.33ms
respectively. A qualitative analysis shows that the QSRED curve is the least
erratic.
3.8. Summary
This Chapter introduced an e�cient way to overcome the mismatch be-
tween the microscopic and macroscopic behaviors of queue length dynamics in
RED gateways. The Chapter introduced a new algorithm, QSRED, that en-
hanced the implementation of the original RED strategy. RED has di�culties
detecting this mismatch. This can result in RED continuing to drop packets
after congestion event has subsided. This work provides a new technique that
helps the gateway manage network congestion and increase TCP performance.
The new algorithm, Queue Sectors RED (QSRED), divides the bu�er
into six equal sectors. These sectors represent new dropping levels added to
the original RED implementation. It uses the actual and the average queue
size parameters to help RED absorb short lived bursty tra�c and control TCP
congestion e�ciently. Since RED uses probabilistic packet dropping, QSRED
dynamically adjusts the maxp value of RED to maintain network stability
and smooth tra�c. This chapter compared QSRED with ERED and RED

3.8. SUMMARY 72
strategies in NS2. The results show that QSRED o�ers higher throughput and
link utilization with lower packet loss and delays.

CHAPTER 4
A Third Drop Level For RED
A new strategy called Risk Threshold RED (RTRED) is proposed in this
Chapter. In addition to the maximum threshold and minimum threshold in
RED, RTRED adds an extra threshold (the risk threshold) and applies average
and actual queue size check. Instead of swapping between the accumulative
drop probability pa and the initial drop probability pb to control the drop rate in
ERED, RTRED adjusts the drop rate dynamically by maintaining adjustable
maximum drop probability maxp. RTRED algorithm is expected to avoid the
unnecessary packet drops in RED gateways. Packet drops due to lock out and
full queue problems are further investigated in this chapter.
The key idea of congestion control is to determine an appropriate con-
gestion level to start packet dropping. Unfortunately, there is no strategy that
provides perfect balance. This Chapter shows how RTRED solves some of the
imbalances in previous strategies. The Chapter also shows how RTRED bet-
ter balances packet loss, average delay and queue space utilization. The new
dropping level is the risk threshold which works with the actual and average
queue sizes to detect the immediate congestion in gateways. RTRED aims to
react to congestion neither too early, to avoid unfair packet losses, nor too
late to avoid packet dropping from time-outs. This novel strategy is compared
with RED and ARED strategies for TCP congestion handling using a NS-2
simulation script.
Chapter 4 is organized as follows: section 4.2 describes the lock out and
full queue problems. Sections 4.3 and 5.4 describes ARED and FRED strate-
gies respectively. Section 4.4 proposes the Risk Threshold RED (RTRED).
The network topology and simulation results are presented in sections 4.5 and
4.6 respectively. The chapter is summarized in section 4.7.
73

4.1. BACKGROUND 74
4.1. Background
Chapter 2 describes how current high speed network gateways are likely
to be congested due to the increased demand for bandwidth. Early TCP
congestion control strategies attempted to manage congestion by manipulating
the congestion window size cwnd; which is a parameter that regulates the
sending rate [64].
The goals of any congestion control strategy are: (I) Fair resource al-
location (II) Reasonable queuing delay (III) minimal packet loss and (IV)
Low resource consumption. These four goals are con�icting. For example, if a
strategy is designed to reduce the packet loss rate at the gateway, higher queue
sizes will be produced. Higher queues on routers increase end-to-end delays.
This Chapter, proposes the Risk Threshold RED (RTRED) strategy to better
balance these con�icting goals.
Traditional congestion control strategies, such as TD, used the actual
queue size to check congestion in intermediate routers. If the actual queue size
exceeds a preset threshold, then all incoming packets are dropped until the
congestion has been alleviated. This technique causes many problems, such as
global synchronization, lock out and full queue. These problems increase the
drop rate to an unacceptable level and packets will be dropped unfairly in the
gateway.
To solve these problems, congestion control strategies, such as RED,
replace the actual queue size check with the average queue size check. Chapter
3 addressed the drawbacks associated with the implementation of Random
Early Detection (RED) for congestion handling in TCP networks. It has been
shown that there is a mismatch between the behaviours of the average and
actual queue sizes; resulting in serious problems in the gateway. Even with the
average queue size check, it has been shown in [1] that RED gateways still su�er
from lock out and full queues due to the mismatch between the average and
actual queue sizes. Abbasov and Korukoglu proposed E�ective RED (ERED)

4.2. LOCK OUT AND FULL QUEUE PROBLEMS 75
[1] strategy to reduce packet loss caused by this mismatch. The gateway is
divided into seven sectors and both of the average and actual queue sizes are
monitored. If the mismatch is caused by the average queue size then, ERED
adjusts the average queue size to match the actual queue size. Otherwise, the
mismatch is caused by the actual queue size and ERED adjusts the drop rate.
It has been also shown in [1] that ERED enhances the performance of
RED by reducing the drop rate. Congestion control literature questions the
use of the actual queue size for congestion detection [29] [33]. Also the con-
�guration and number of queue sectors are problematic in ERED. Erroneous
con�guration for these sectors can reduce network performance. Chapter 3
highlighted some of the shortcomings associated with ERED. A new strategy
called Queue Sectors RED (QSRED) was proposed in Chapter 3 to enhance
the functionality of ERED. Through simulation, QSRED shows preference over
RED and ERED. However, the mismatch is still problematic and packets are
unfairly dropped in the gateway.
4.2. Lock Out and Full Queue problems
As illustrated in previous chapters, congestion control in TCP networks
consists of two approaches. The �rst approach is congestion recovery and the
second is congestion avoidance.
Congestion recovery works after the gateway is overloaded and a packet
is already dropped at the gateway. Strategies that use this approach are source
algorithms. These algorithms adjust the sending rate upon congestion signals,
such as triple acknowledgments, time-out or Explicit Congestion Noti�cation
(ECN). TCP Tahoe [38], TCP Reno [67], and TCP Vegas [8] are examples of
these strategies.
Source algorithms operate end-to-end to send packets at the perfect rate
using the congestion window size (cwnd). Additive Increase/Multiplicative
Decrease (AIMD) is a technique to adjust the sending rate by modifying the

4.2. LOCK OUT AND FULL QUEUE PROBLEMS 76
congestion window size. When a transmitted segment is successfully acknowl-
edged then the window is additively increased. Conversely, the window is
decreased in a multiplicative manner upon packet loss signal.
TD uses a technique to drop packets depending on the actual queue
size. This technique has two main problems which are: the Lock Out and Full
Queue problems. The �rst problem occurs when a few connections monopolize
the whole queue space. The second problem occurs when the gateway keeps
sending full queue signals to the sources for a long period of time [64]. Hence,
there was a need to �x these two drawbacks of TD strategy using congestion
avoidance approach.
In the congestion avoidance approach, some arrangements are made be-
fore the gateway is overloaded. The strategies that apply this approach are
called network algorithms because they are applied by network components.
Active Queue Management (AQM) is one of the algorithms that implements
this approach [7]. Random Early Detection (RED) and its variants are the
most popular strategies that adopted the AQM algorithm for congestion avoid-
ance [29].
The congestion recovery and congestion avoidance algorithms work to-
gether to handle congestion. This Chapter questions the extent to which RED
and the derivative approaches actually �xed the lock out and full queue prob-
lems. This Chapter also questions the cost of this solution.
4.2.1. Early Congestion Control Strategies
Traditional congestion control policies including; Source Quench, Fair
Queuing, No Gateway Policy and Congestion Indication drop packets in the
order they arrive. This is similar to the TD strategy and has similar prob-
lems, like full queue and lock out [33]. Aggressiveness against bursty tra�cs
is another problem that result from these classic congestion control strategies
[29] [33]. This happens because burstiness is one of the TCP tra�c charac-

4.2. LOCK OUT AND FULL QUEUE PROBLEMS 77
teristics and bursty connections always need more bu�er size to absorb their
tra�c. In addition, these connections always try to monopolize more than
their permitted share of bandwidth and bu�er size. When a TCP window of
n packets arrives at a TD congested gateway, all the packets of this window
will be dropped in the order they arrive. Consequently, n congestion signals
will be sent to the same source; lowering the sending rate of that connection.
Random Drop (RD) was designed by IETF to avoid these shortcomings
of TD. The method of RD is to drop packets randomly rather than from
the tail of a queue. In RD, the probability of a TCP �ow losing a packet
is proportional to the percentage of packets currently occupying the bu�er.
RD also has a number of shortcomings. It chooses packets to be dropped by
inspecting the bu�er distribution only at the time of over�ow, disregarding
all previous history. Therefore, it unfairly favors the connections with large
packets [33].
Early Random Drop (ERD) strategy was designed to �x the problems
of RD [33]. At imminent congestion, the gateway begins to drop packets at
a rate that is derived from the current network congestion level. If the queue
length is greater than the drop level � which is the threshold in RED � then
ERD chooses packets randomly. If the probability of this packet is less than a
preset drop probability then the packet is to be dropped.
4.2.2. RED-Based Congestion Control Strategies
To avoid inspecting the bu�er distribution only at the time of over�ow,
which is a problem of RD, Random Early Detection (RED) inspects the average
queue size for the previous history. Also, RED keeps two threshold parameters
rather than one in ERD. In addition, the drop probability is dynamically
adjusted during the network operation time.
The network �ows which react to congestion, such as TCP �ows, are
responsive �ows. Flows that do not adapt the sending rate based on conges-

4.3. ADAPTIVE RED 78
tion conditions are unresponsive; such as UDP �ows [71]. Unresponsive �ows
can occupy more than their allowed share of network resources, which causes
aggressiveness against TCP connections. Thus, some RED variants were pro-
posed to avoid this problem.
Flow Random Early Detection (FRED) preferentially discards packets
from responsive and unresponsive �ows. RED-DT [45] and Logest Queue Drop
(LQD) [69] are per-�ow strategy that distributes the bu�er space fairly between
responsive and unresponsive �ows.
Dynamic And Self-Adaptive TCP-Friendly Congestion Control Mecha-
nism (DATFCC) [73] adjusts the drop probability relating to the type of �ow
and the bu�er usage ratio. It uses the TCP friendly approach [57], [5] to main-
tain fairness between TCP �ows and real-time UDP �ows. RED Optimized
Dynamic Threshold (RED-ODT) uses the DT Scheme for shared bu�er man-
agement [9] to adjust the maximum threshold and minimum threshold relating
to the actual queue size and the bu�er size in multi-queue gateways. Adaptive-
RED (ARED) increases and decreases the maxp parameter. When the average
queue size is greater than the maximum threshold, maxp is increased. When
the average queue size is less than the minimum threshold, maxp is decreased
[15].
The previously mentioned strategies attempt to increase network perfor-
mance and avoid unnecessary drops in the gateway queue. However, because
of the mismatch between the average and actual queue sizes, unfair drops are
expected in RED gateways [64].
4.3. Adaptive RED
Adaptive RED (ARED) [25] [15] claims that there are two problems
associated with RED's proposal. First, congestion control in RED does not
keep track of the number of connections multiplexed across the link. Second,
the bene�ts of RED are signi�cantly reduced due to the packet drop technique
that is used to indicate congestion.

4.3. ADAPTIVE RED 79
Early detection of congestion in RED depends on the rate at which con-
gestion noti�cation is provided to the source and the network load. In the case
of aggressive congestion noti�cation, packet loss can be ignored at the price
of low link utilization. If the congestion noti�cation rate is conservative, link
utilization will be increased at the price of high packet loss rate.
ARED proposed an ECN technique that is cognizant to the number of
active connections multiplexed. The proposal provides an auto-con�guration
mechanism that determines the optimal parameters based on the tra�c load.
The strategy helps the gateway reduce packet loss and increase link utilization
[25]. In addition, ARED maintains the main bene�ts of RED without any
per-�ow accounting. However, this additional functionality comes at the cost
of additional complexity.
The main goal of ARED is to avoid packet loss due to bu�er over�ow.
In the presence of heavy congestion, ARED marks packets from a large num-
ber of sources to reduce the o�ered load. Excessive congestion noti�cation
leads to under-utilization of the network bandwidth. Chapter four proposes
the Risk Threshold RED (RTRED) mechanism, which provides techniques to
reduce packet loss caused by bu�er over�ow or arbitrary congestion noti�ca-
tions. The Chapter also argues that the aggressiveness of ARED causes global
synchronization.
According to ARED proposal [25], a 10 Mb/s capacity of a bottleneck
link which is equally shared amongst 100 TCP connections will be reduced to
9.95 Mb/s just after receiving a congestion noti�cation at one connection. If
only two connections share the link then the o�ered load will be reduced to
7.5 Mb/s. Generally, If the bottleneck link is shared between n connections
then one congestion signal arrives at any connection will reduce the o�ered
load by (1 − 1/2n). Thus, large n values reduce the impact of individual
congestion noti�cation. Therefore, RED parameter con�guration should be
more aggressive to prevent degenerating into a simple tail drop queue. Small
values of n will maximize the impact of individual congestion noti�cation,

4.4. RTRED STRATEGY 80
Table 4.1. Adaptive RED algorithm.
Every avg update:if (minth < avg < maxth)
Status = Between;if (avg < minth && status !=Below)
status = Below;maxp= maxp/α;
if (avg > maxth&& status !=Above)status= Above;maxp= maxp*β;
resulting in under-utilization.
ARED parameter con�guration is based on the explicit congestion noti-
�cation and number of active connections. Table 4.1 illustrates the Adaptive
RED algorithm. ARED examines the variations of the average queue size and
makes decisions about when it should be less or more aggressive. If the av-
erage queue size is less than the minimum threshold then the maximum drop
probability parameter maxp is scaled by the constant α. If the average queue
size is greater than the maximum threshold then the parameter maxp is scaled
with the constant β. The ARED proposal recommends the use of values 3 and
2 for α and β respectively.
4.4. RTRED strategy
4.4.1. RTRED Motivations
New congestion control strategies tend to assign the congestion level for
tra�c management and congestion recovery processes. Rather than using the
actual queue size as the congestion level indication, like TD strategy does,
RED and some RED-based strategies keep an Exponentially Weighted Moving
Average (EWMA) queue size to detect the congestion level.
RED was initially designed to minimize packet loss and queuing delays. It
was also designed to maintain high link utilization and to remove biases against
bursty tra�c. Furthermore, it tries to avoid global synchronization which
occurs when all network resources reduce their sending rate simultaneously.

4.4. RTRED STRATEGY 81
(a) scenario I.
(b) scenario II.
Figure 4.1. Time out and unfair drop scenarios.
The problem with RED is the mismatch between the macroscopic and mi-
croscopic behaviors of queue length dynamics. This malfunction occurs when
a peak in the actual queue size (microscopic behavior) exceeds the available
bu�er size. The average queue size is still low (macroscopic behavior) whereas
the actual queue size is very high. This could happen because of small weight
parameter wq. As a result, a congestion signal is detected by network sources
due to time outs caused by packet drops in the router. This means that
TCP source algorithms, such as Reno, are responsible for congestion handling,
whereas the network algorithm, which is a RED-based strategy, behaves like
TD. This problem represent a mismatch between microscopic and macroscopic
behavior of queue length dynamics.
Figures 4.1a and 4.1b illustrate the two possible scenarios of this mis-
match. In phase 1, packets will be dropped due to time out signal. In phase
2 packets will be dropped unfairly because of the high value of avg parameter
whereas the actual queue size is less than the minth.

4.4. RTRED STRATEGY 82
Choosing the drop level and the drop probability is the greatest chal-
lenge of RED and RED-based strategies. ARED proposed to multiply the
maxp parameter by another parameter; α, when avg exceeds the parameter
maxth, and to divide it by β when avg is less than the parameter minth. An
additional strategy named Gentle RED proposed to vary the drop probabil-
ity from maxp to 1 when the average queue size varies from maxth to twice
the maxth parameter [21]. Many RED variants have been proposed and the
mismatch between the microscopic and macroscopic behaviors persist. In the
next section, the Risk Threshold RED (RTRED) strategy is proposed which
provides more timely congestion indication. RTRED reduces the amount of
unfairly dropped or timed out packets.
4.4.2. RTRED Algorithm
The drop level de�nes the safe area of tra�c �uctuation. Hence, drop
level should alert the aggressive connections to slow down before the gateway
is overloaded. It should be small enough for sources to respond before gate-
way over�ow. Conversely, small threshold values would cause false congestion
panic and unnecessary losses. Therefore, the threshold must be dynamically
readjusted depending on the current network tra�c.
The drop probability also, should be chosen carefully. It should be large
enough to detect the misbehaved connections and small enough to protect
the well behaved ones. Therefore, the drop probability should be adjusted
dynamically as well.
TD strategy de�nes the drop level depending on the actual queue size.
In addition to the global synchronization phenomenon, this scenario would
lead to the Lock Out and Full Queue phenomena. RED strategy uses only the
weighted average parameter to de�ne the drop level. This sometimes leads to
unfairly dropped or timed-out packets. In order to remedy the shortcomings
of RED and TD strategies, RTRED uses both the actual and average queue
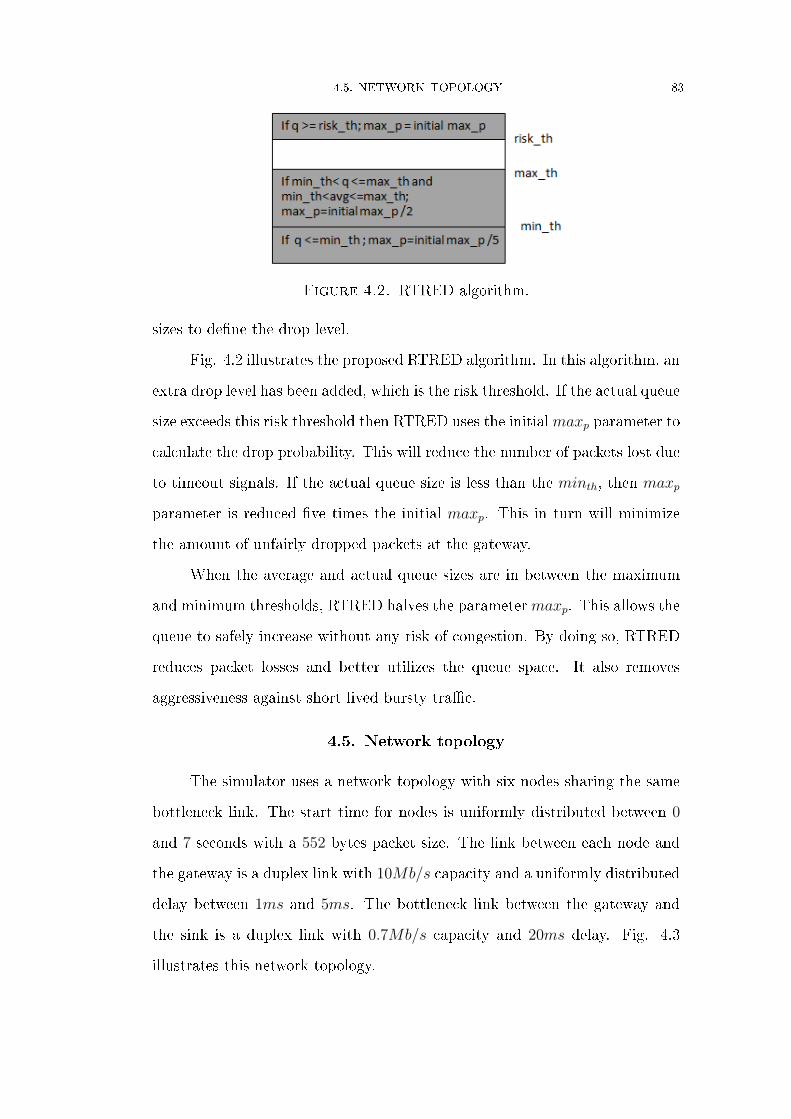
4.5. NETWORK TOPOLOGY 83
Figure 4.2. RTRED algorithm.
sizes to de�ne the drop level.
Fig. 4.2 illustrates the proposed RTRED algorithm. In this algorithm, an
extra drop level has been added, which is the risk threshold. If the actual queue
size exceeds this risk threshold then RTRED uses the initialmaxp parameter to
calculate the drop probability. This will reduce the number of packets lost due
to timeout signals. If the actual queue size is less than the minth, then maxp
parameter is reduced �ve times the initial maxp. This in turn will minimize
the amount of unfairly dropped packets at the gateway.
When the average and actual queue sizes are in between the maximum
and minimum thresholds, RTRED halves the parametermaxp. This allows the
queue to safely increase without any risk of congestion. By doing so, RTRED
reduces packet losses and better utilizes the queue space. It also removes
aggressiveness against short lived bursty tra�c.
4.5. Network topology
The simulator uses a network topology with six nodes sharing the same
bottleneck link. The start time for nodes is uniformly distributed between 0
and 7 seconds with a 552 bytes packet size. The link between each node and
the gateway is a duplex link with 10Mb/s capacity and a uniformly distributed
delay between 1ms and 5ms. The bottleneck link between the gateway and
the sink is a duplex link with 0.7Mb/s capacity and 20ms delay. Fig. 4.3
illustrates this network topology.

4.6. SIMULATION AND ANALYSIS 84
Figure 4.3. Network topology.
Table 4.2. Simulation and analysis (drop levels in packets)
Scenario minth maxth maxp riskth Buf
1 12 25 0.05 28 302 60 90 0.10 95 1003 15 30 0.08 40 50
4.6. Simulation and analysis
NS-2 script is used to simulate three di�erent scenarios for RED, ARED
and RTRED. Table 4.2, illustrates the parameter con�guration for these sce-
narios.
Figure 4.2 divides the gateway queue into four areas. The white area in
the table depicts the safe area in which the queue can �uctuate safely without
any congestion indicator to absorb bursty tra�c. The area between the riskth
and the bu�er limit is the time out area in which the risk of a packet drop due
to time out signal is very high. The normal drop area is the area between the
minth and maxth parameters. RED and its variants normally start dropping
packets in this area. Finally, packet drops in the area between the empty queue
and the minth are referred by unfair drops; hence the area is called the unfair
drop area.
Figure 4.5 traces the percentage of packets that have been dropped in
every area for each scenario separately. It shows that the majority of the
packets have been dropped in the normal area and the time out area. Also,

4.6. SIMULATION AND ANALYSIS 85
Figure 4.4. Total percentage of packets dropped for three scenarios.
some packets have been dropped in the unfair area. That motivates defering
the use of the high initial maxp parameter until the actual queue size exceeds
the riskth, in RTRED. The bar chart in Fig. 4.4 depicts the average percentage
of packets dropped for the three scenarios.
To avoid the mismatch between the microscopic and macroscopic behav-
iors of queue dynamics, RTRED works as a compromise between TD and RED
strategies. It only checks the actual queue size in the Timeout and Unfair ar-
eas to avoid bu�er over�ow and unfair packet losses respectively. In order to
reduce the drop rate and avoid wasting the queue space, it checks the average
and actual queue sizes in the normal area, controlling congestion by reducing
maxp to half of the initial parameter.
Table 4.3, illustrates the network performance for the three scenarios.
It is clear from the table that RTRED strategy has outperformed RED and
ARED strategies. It maintains a higher average queue size; increasing the
gateway queue utilization. In response, this will reduce the packet loss rate
which is not con�icted with the small average delay time values for RTRED.
This technique reduces the total amount of packets propagated by the source
nodes which in turn reduces the overhead of packet retransmission. The av-
erage delay time is calculated for the actual amount of packets queued at the
gateway rather than the average queue size value.
Figures 4.6 and 4.7 illustrate scenario one simulation results. Fig. 4.6,
depicts the drop probability and maxp parameters for the three strategies.

4.6. SIMULATION AND ANALYSIS 86
Table 4.3. Network performance for the three scenarios.
SCENARIO STRATEGY AVE QSIZE
(PACK-ETS)
AVERAGEDELAY(MS)
LOSSRATE(PACK-ETS)
NO. OFPROPA-GATED
PACKETS
RED 20.2920 122.851840 710 181581 Adaptive 16.4690 123.832860 855 18303
RTRED 21.2004 122.594742 668 18120RED 54.4667 119.340434 151 17639
2 Adaptive 60.9756 119.387794 147 17646RTRED 62.1799 119.259245 136 17627RED 21.0212 122.527085 651 18110
3 Adaptive 19.8217 122.804480 698 18151RTRED 24.8899 121.816685 548 18005
In this �gure, the maxp parameter for RTRED �uctuates between the initial
maxp parameter and maxp = 5 value, depending on the queue size dynamics.
In response, the drop probability increases and decreases dynamically to �t the
current congestion level. On the other hand, ARED keeps high maxp param-
eter which is unresponsive to the current congestion level. This is illustrated
in Fig. 4.6a. RED also keeps a �xed maxp parameter, which is unresponsive
to the queue dynamics as Fig. 4.6c shows. Figure 4.7 plots the average and
actual queue sizes for the three strategies.
In Fig. 4.7b, RTRED strategy allows the queue to increase with a lower
dropping rate. It stabilizes the queue size at the safe area with no risk of
unnecessarily drop due to time out signal. Figures 4.7a and 4.7c are the �g-
ures of ARED and RED queue dynamics respectively. The �gures show how
aggressively and unfairly these strategies drop packets to avoid bu�er over�ow
and to minimize the average queue size.
In this scenario, RTRED provides accurate calculation of the drop level
and the drop probability. In fact, it re�ects high trustworthy congestion indi-
cation before network starts recovering.
All AQM strategies involve tradeo�s. The tradeo� between decreasing
delay and increasing throughput is one of the major problems that appears
at the time of con�guring the drop thresholds. Another tradeo� between link

4.6. SIMULATION AND ANALYSIS 87
(a) Scenario I.
(b) Scenario II.
(c) Scenario III.
Figure 4.5. Percentage values for packets dropped in each droparea.
utilization and average delay time will worsen the problem. Larger minth
values will increase link utilization which is a good performance behavior, but
in [29] it is suggested to set maxth twice the minth which will increase delay.
The idea of small queues to reduce delay is proposed in [29]. RTRED
can be sub-optimal, because, the desirable queue size is the size that helps the
gateway reduces the drop rate and the overhead of packet retransmission. The
average and actual queue sizes of RTRED are higher than RED and ARED.
The actual end-to-end delays of RTRED, shown in table 4.3, are lower due to
fewer retransmissions.
Figures 4.8 to 4.11 illustrate how RTRED outperforms RED and ARED
for scenarios II and III respectively. The �gures show the drop probability and
the queue dynamics for each strategy. RTRED provides the most stable queue
length with lower packet drops. It also maintains a dynamic maxp parame-

4.6. SIMULATION AND ANALYSIS 88
(a) Adaptive-RED.
(b) RTRED.
(c) RED.
Figure 4.6. Drop probability and maxp parameters for scenario I.

4.6. SIMULATION AND ANALYSIS 89
(a) Adaptive-RED.
(b) RTRED.
(c) RED.
Figure 4.7. Average and actual queue sizes for scenario I.

4.6. SIMULATION AND ANALYSIS 90
(a) Adaptive-RED.
(b) RTRED.
(c) RED.
Figure 4.8. Drop probability and maxp parameters for scenario II.

4.6. SIMULATION AND ANALYSIS 91
(a) Adaptive-RED.
(b) RTRED.
(c) RED.
Figure 4.9. Average and actual queue sizes for scenario II.

4.6. SIMULATION AND ANALYSIS 92
(a) Adaptive-RED.
(b) RTRED.
(c) RED.
Figure 4.10. Drop probability and maxp parameters for sce-nario III.
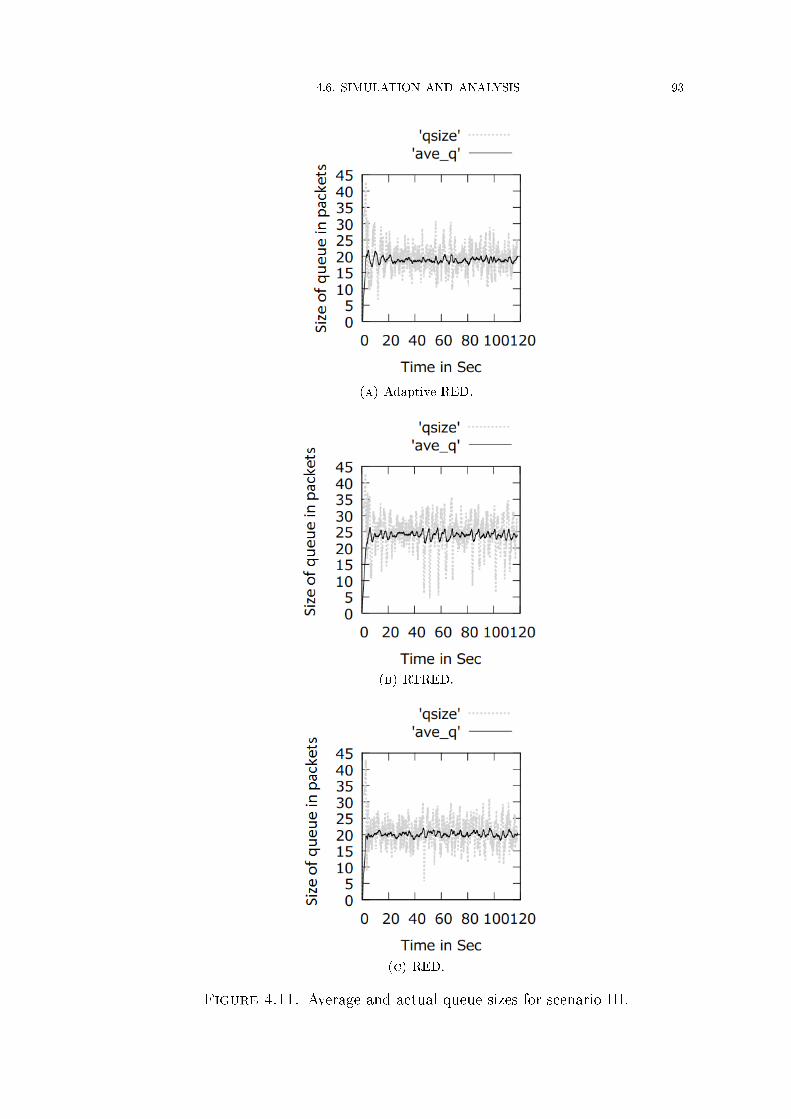
4.6. SIMULATION AND ANALYSIS 93
(a) Adaptive-RED.
(b) RTRED.
(c) RED.
Figure 4.11. Average and actual queue sizes for scenario III.

4.7. SUMMARY 94
ter and drop probability which are more responsive to the queue dynamics.
RTRED does not increase the drop rate unless a strong signal of congestion
is detected. Regardless of ARED's dynamic maxp, the adjustment of this
parameter is problematic.
4.7. Summary
This Chapter presented a novel RED-based strategy; Risk Threshold
RED (RTRED), which is designed to avoid the mismatch between the micro-
scopic and macroscopic behaviors of queue length dynamics. The proposal is
a compromise between the TD and RED strategies for congestion handling in
TCP networks.
TD uses the actual queue size to de�ne the congestion level. RED uses
the Exponentially Weighted Moving Average to de�ne the congestion level.
RTRED uses both the actual and average queue sizes to calculate the drop
probability and the congestion level. These calculations operate in conjunction
with a third drop level; the risk threshold.
Using an NS-2 simulation, The results suggest that RTRED outper-
formed competing strategies; reducing unnecessary packet loss, delays and
packet retransmissions. Furthermore, RTRED avoids wasting the gateway
bu�er size and increases the bu�er utilization.

CHAPTER 5
RED Performance Enhancement Using The Weight
Parameter
The mismatch between the average and actual queue sizes has been pre-
sented in previous chapters and the performance of ERED has been evaluated.
Regardless of the improvement that has been achieved; the simulation results
suggest that the actual queue size check could degrade the performace of RED
and increase the complexity of the congestion control function. This chap-
ter presents new technique to match both the average and actual queue sizes
without applying the actual queue size check. This goal can be achived by
maintaining adjustable weight parameter to increase the sensitivity of the av-
erage queue size to the changes in the actual queue size.
FRED is one of the few strategies that adjusts the weight parameter to
avoid the mismatch between the average and actual queue sizes. This Chapter
proposes the novel Weighted Random Early Detection (WTRED) strategy
for congestion handling in TCP networks. The strategy dynamically adjusts
RED's maximum threshold, minimum threshold and weight parameters to
increase network performance. This Chapter also describes RED and FRED
implementations and highlights their disadvantages. WTRED is compared
with these classic congestion control strategies using an NS-2 simulation script.
The simulation results demonstrate the shortcomings of RED and FRED. In
addition, the results show that WTRED achieves greater link utilization and
throughput than RED and FRED.
This Chapter is organized as follows: Section 5.1 gives a background
about traditional congestion solutions. Section 5.2 reviews the performance
of the Random Early Detection (RED) over TD mechanism. Section 5.3,
95
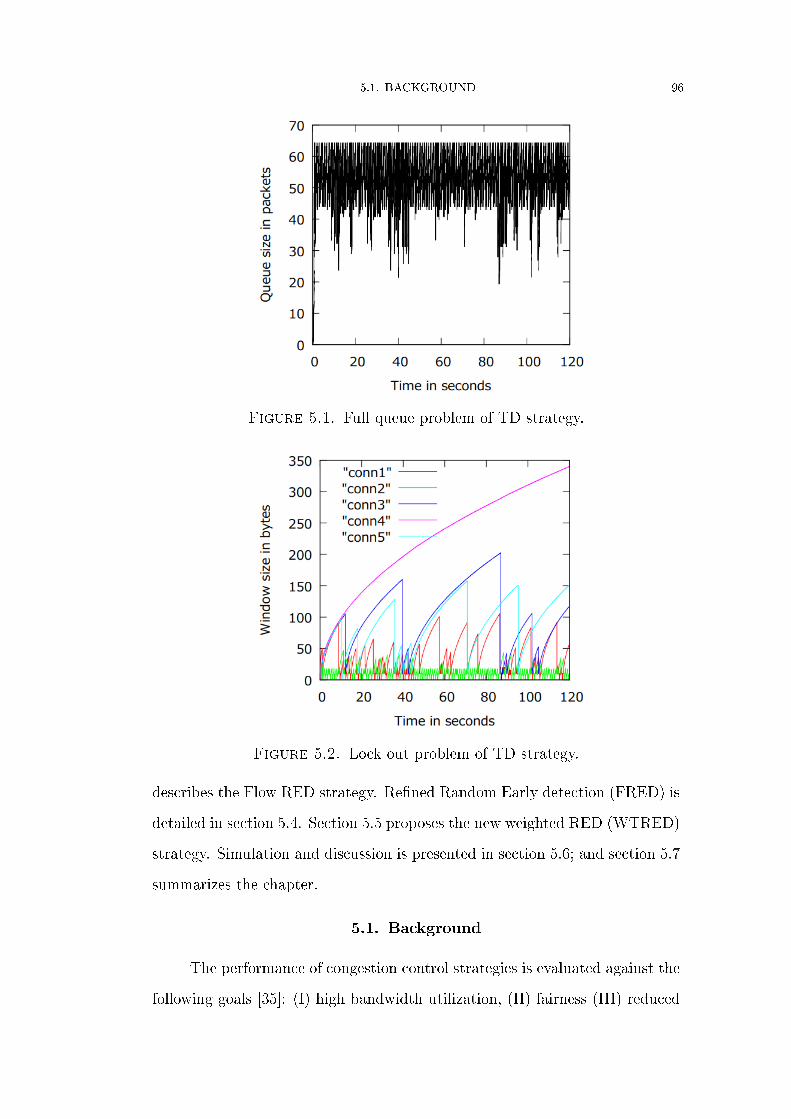
5.1. BACKGROUND 96
Figure 5.1. Full queue problem of TD strategy.
Figure 5.2. Lock out problem of TD strategy.
describes the Flow RED strategy. Re�ned Random Early detection (FRED) is
detailed in section 5.4. Section 5.5 proposes the new weighted RED (WTRED)
strategy. Simulation and discussion is presented in section 5.6; and section 5.7
summarizes the chapter.
5.1. Background
The performance of congestion control strategies is evaluated against the
following goals [35]: (I) high bandwidth utilization, (II) fairness (III) reduced

5.1. BACKGROUND 97
jitter (IV) high responsiveness. (V) Fairness and compatibility with widely
used protocols. Network performance involves four main parameters, which
are: throughput, link utilization, packet loss and average delay. The design of
a new congestion control strategy is subject to enhance one or more of these
parameters.
The Tail Drop (TD) strategy uses a First In First Out (FIFO) queue
management approach to control congestion. When the queue size reaches
the bu�er limit, packets are dropped in the order they arrive. This approach
causes four problems that reduce network performance:
• Full Queue [64]: This problem occurs when a gateway continually
sends full queue signals to sources for an extended period of time. In
Fig. 5.1, a bu�er of size 64 packets is full throughout the majority of
the network operation time. In addition to the long delays associated
with large queues, TD will inequitably drop packets, penalizing some
connections. This will cause unfair resource allocation, which is illus-
trated in Fig. 5.2. In this �gure, connection 2's window size is always
lower than the other connections.
• Lock Out [64]: This problem occurs when TD allows a few connec-
tions to monopolize the whole bu�er space. In Fig. 5.2, connection 4
receives more link bandwidth than the other connections in the net-
work.
• Global Synchronization [33]: This problem occurs when all TCP senders
reduce their sending rate simultaneously, reducing the network through-
put [66] [80]. Fig. 5.3 shows TD algorithm causing global synchro-
nization. Fig. 5.4 shows 5 seconds of global synchronization for the
same scenario between time 20s to 25s.
• Bias against bursty tra�c [28]: The nature of TCP transactions will
often result in data packets being sent and received in groups. When
the source receives acknowledgment of packet delivery from the desti-

5.2. RED PERFORMANCE OVER TD 98
nation node, it increases the number of packets to be sent in the next
group. The maximum number of packets allowed in transit is the
congestion window size cwnd. In network steady state, the conges-
tion window size is increased. When the network becomes congested,
the congestion window size is decreased. Due to the bursty nature of
many transactions, dropping packets in the order that they arrive is
unfair because it is likely that the majority of packets being dropped,
may be from the same source. This will unfairly decrease the sending
rate of that source whilst it needs more bandwidth to send this bursty
tra�c. Resulting in low network throughput.
Another strategy, Early Random Drop (ERD), begins packet drops at a rate
derived from the current network congestion level. For example, if the queue
size exceeds a certain threshold, then every arriving packet will be dropped
with pre�xed drop probability. The following code, illustrates the algorithm
of this strategy:
Early Random Drop (ERD)'s Algorithm, see [33] for more details
if (queue_length > drop_level ) then
if get.random( ) < drop_probablity then
drop(packet)
Random Early Detection (RED) was developed to maintain adjustable
threshold and drop probability. RED solves the problems associated with the
traditional congestion control strategies.
5.2. RED performance over TD
RED solves the problems associated with traditional congestion control
strategies, such as TD. Fig. 5.5 depicts the weighted average and the actual
queue sizes for the same scenario used in Fig. 5.1; in this instance RED rather
than TD is used. Fig. 5.5 shows that RED has no biases against bursty tra�c.
While the average queue size is nearly 17 packets, a few bursts, between size
17 and 26, are allowed. The weighted average de�nes the level of congestion to
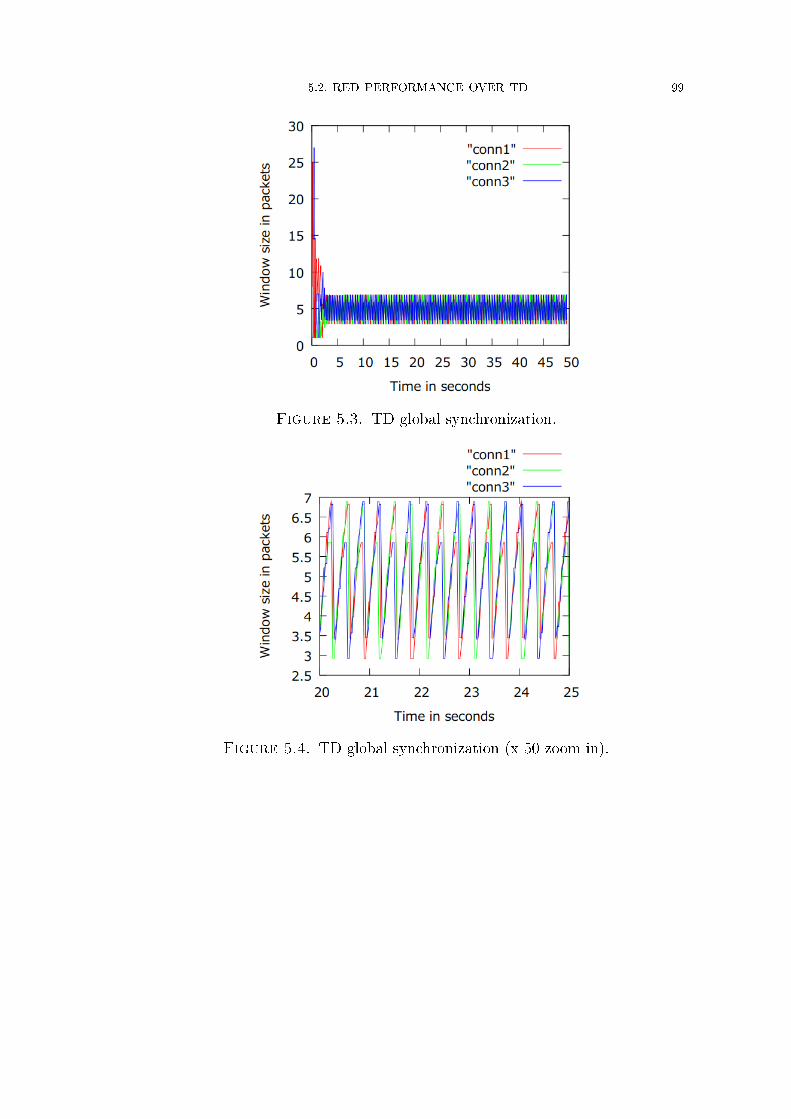
5.2. RED PERFORMANCE OVER TD 99
Figure 5.3. TD global synchronization.
Figure 5.4. TD global synchronization (x 50 zoom in).

5.2. RED PERFORMANCE OVER TD 100
Table 5.1. The maximum drop probability for FRED's sub-phases.
Sub-Phase 1 2 3 4 5 6
maxp maxp 2maxp 4maxp 6maxp 8maxp 10maxp
start packet dropping. In Fig. 5.5, avg is always less than 13 packets and this
helps the gateway detect congestion before the bu�er over�ows. By reducing
the actual and average queue sizes, RED lowers queuing delays, prevents the
full queue problem and provides fair resource allocation.
RED also solves lock out and global synchronization problems. Fig. 5.6
shows the congestion window size for RED. It is the same network used to
plot Fig. 5.2 with TD. It is clear from Fig. 5.6, that the connections receive
fair resource allocation. Lock out problems are also eliminated. The global
synchronization, caused by TD, is also solved. This is evidenced in Fig. 5.7.
Despite the strong design of RED, drawbacks have been revealed in a
number of studies. Parameter con�guration and the recommended values have
been subject to change over time [44]. For example, ARED dynamically ad-
justs the maxp parameter depending on the values of avg , maxth and minth
[15]. Blue-RED is another strategy that dynamically adjusts the drop proba-
bility of RED pa to increase network performance [16]. Other strategies suggest
dynamic thresholds for RED, such as RED-DT [71] and PDT-RED [68]. Dif-
fusion Early Marking (DEM) [6] is a RED based strategy designed to avoid
global synchronization. In order to avoid excessive congestion marking, DEM
has been designed to optimize the distribution of packet marking. For further
details in newly designed congestion control strategies, see [74].
Parameter setting in new RED-based strategies is dynamic. Some studies
suggest optimal values for the weight parameter wq. BF-RED [76], proposes
di�erent weight parameters for di�erent �ows to ensure fair bandwidth alloca-
tion. Also, RT-RED adjusts RED's parameters based on the ratio between the
actual queue size and the average queue size. RED performance evaluations
in real networks are further investigated in [10] [43] [51].

5.2. RED PERFORMANCE OVER TD 101
Figure 5.5. Average and actual queue sizes on a RED gateway.
Figure 5.6. Congestion window size on a RED gateway.

5.3. FLOW RED 102
Figure 5.7. Congestion window size on a RED gateway with-out global synchronization.
5.3. Flow RED
One of the design principles of RED is to maintain low average queue
size and allow �uctuations in the actual queue size in an e�ort to absorb tran-
sient congestion and bursty tra�c. The Re�ned Design of RED (FRED) [72]
dynamically adjusts the weight parameter wq according to the change of the
actual queue size. Another strategy Flow RED which is also denoted by FRED
[44] focused on shared networks. This strategy provides fair resource allocation
between responsive connections, such as TCP, and unresponsive connections,
such as UDP. Responsive connections react to congestion signals by reducing
their window size. Unresponsive connections do not respond to congestion
signals. Thus, unresponsive connections will occupy more bandwidth than re-
sponsive connections. Fairness problem arising from unresponsive connections
are outside the scope of this thesis. It is only described here to remove the
ambiguity between the Flow RED (FRED) and the Re�ned Design of RED
(FRED). For the rest of this chapter, the term FRED is used to refer to the
re�ned design of RED.

5.4. REFINED DESIGN OF RED (FRED) 103
Sub-Phase 1 2 3 4 5 6
wq wq 4wq 8wq 12wq 16wq 20wq
Table 5.2. The weight parameter for FRED's sub-phases.
5.4. Re�ned design of RED (FRED)
Re�ned Random Early Detection (FRED) [72] is a modication of RED
that uses a dynamic weight wq and maxp to control congestion. It divides the
area between the maximum threshold and minimum threshold into six sub-
phases. As the average increases from the minimum threshold to the maximum
threshold, the maxp is increased. A di�erent value is assigned for the di�erent
sub-phases illustrated in Table 5.1.
In addition to a dynamic maxp parameter, FRED maintains a dynamic
weight parameter wq. It, also, makes use of a third threshold, called the warn
threshold. The weight parameter is adjusted whenever the actual queue size
exceeds the warn threshold. FRED normally assigns half of the bu�er size to
this value. After the actual queue size exceeds the warn threshold, it has to go
through another six sub-phases, but this time, with di�erent weight parameters
for each sub-phase. The weight values for these sub-phases are illustrated in
Table 5.2. In order to apply the weight parameter sub-phases, the actual queue
size must be greater than the average queue size.
RED calculates the average queue size for every packet arrival. FRED ex-
tends RED by additionally calculating the average queue size for every packet
departure.
FRED provides a technique to avoid negative feedback of transient con-
gestion. It proposes that transient congestion is harmful when the queue is
almost full. In RED, the weight parameter wq controls changes in the aver-
age queue size. This parameter is constant in the original RED algorithm.
FRED adjusts the weight parameter dynamically according to the changes of
the actual queue size. Recon�guring wq in FRED provides a timely manner to
quench the actual queue size when the bu�er is nearly full.

5.4. REFINED DESIGN OF RED (FRED) 104
In addition, FRED dynamically adjusts the maximum drop probability
maxp with respect to the average queue size. Even though maxp re�ects the
aggressiveness of the active queue management technique, RED maintains a
�xed value for it. FRED uses the surplus between the actual and average
queue size to indicate the aggressiveness of tra�c. If the surplus is high, then
the incoming tra�c is bursty. If the surplus is increased suddenly then the
incoming bursts exceed the gateway capacity and bu�er over�ow is expected.
FRED adds two enhancements to RED's function. The �rst enhancement
is to adjust the weight parameter dynamically according to the changes of
surplus between the average and actual queue sizes. The second enhancement
by FRED is to estimate the average queue size with every packet departure.
This proposal enhances the technique of calculating the average queue
size. Conversely, it could cause severe drawbacks in some situations [72]. The
value of the weight parameter can be maximized to increase the sensitivity
of RED to the initial stages of congestion and bursty tra�c. However, quick
increases in the weight parameter make RED very sensitive to the short-lived
bursty tra�c and transient congestion, which wastes the bu�er space.
5.4.1. FRED algorithm
FRED adjusts the weight parameter wq and the maximum drop probabil-
ity maxp dynamically. The amount of burst tra�c that can be accommodated
by the gateway is bounded by the bu�er size. Large bu�ers can accommodate
large tra�c bursts. The surplus between the average and actual queue size is
estimated according to the bu�er size.
FRED estimates the average queue size for every packet departure as
opposed to every packet arrival. More precisely, FRED calculates the average
queue size for both packet arrival and departure events. In some cases, this
scenario does not work perfectly. If the queue management technique uses
small value for wq then the average queue size is decreased slowly. In this case
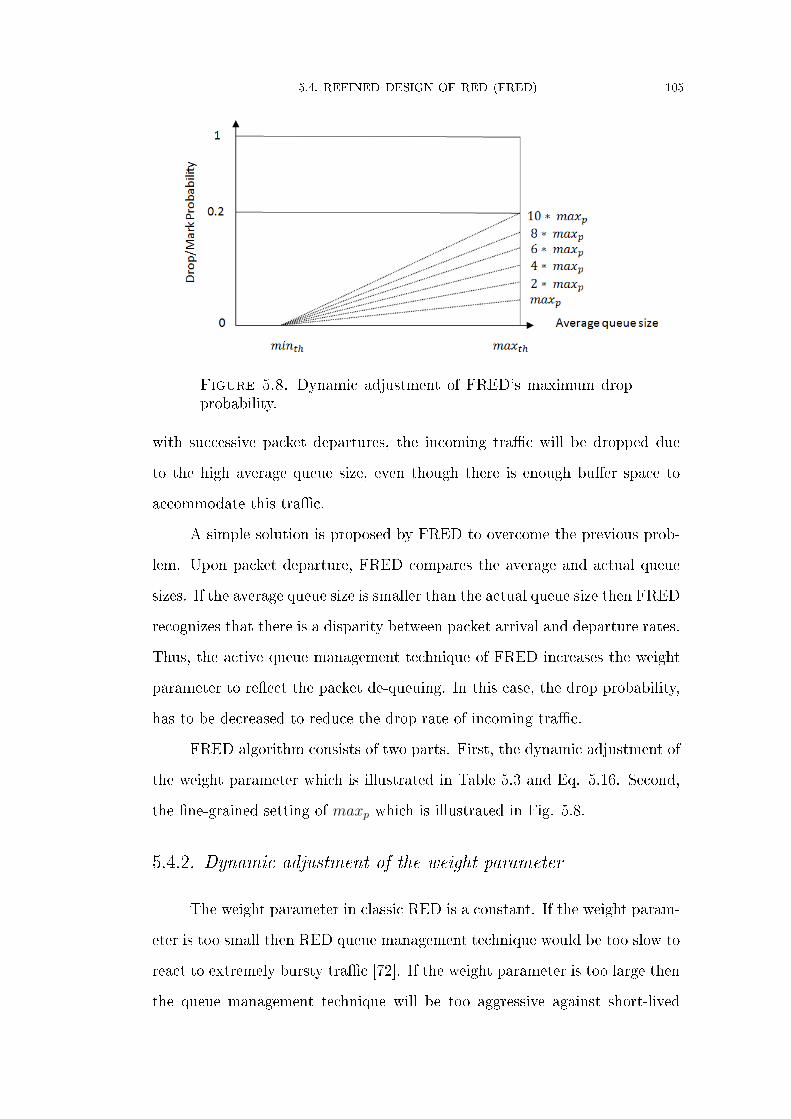
5.4. REFINED DESIGN OF RED (FRED) 105
Figure 5.8. Dynamic adjustment of FRED's maximum dropprobability.
with successive packet departures, the incoming tra�c will be dropped due
to the high average queue size, even though there is enough bu�er space to
accommodate this tra�c.
A simple solution is proposed by FRED to overcome the previous prob-
lem. Upon packet departure, FRED compares the average and actual queue
sizes. If the average queue size is smaller than the actual queue size then FRED
recognizes that there is a disparity between packet arrival and departure rates.
Thus, the active queue management technique of FRED increases the weight
parameter to re�ect the packet de-queuing. In this case, the drop probability,
has to be decreased to reduce the drop rate of incoming tra�c.
FRED algorithm consists of two parts. First, the dynamic adjustment of
the weight parameter which is illustrated in Table 5.3 and Eq. 5.16. Second,
the �ne-grained setting of maxp which is illustrated in Fig. 5.8.
5.4.2. Dynamic adjustment of the weight parameter
The weight parameter in classic RED is a constant. If the weight param-
eter is too small then RED queue management technique would be too slow to
react to extremely bursty tra�c [72]. If the weight parameter is too large then
the queue management technique will be too aggressive against short-lived

5.4. REFINED DESIGN OF RED (FRED) 106
Table 5.3. Dynamic adjustment of FRED's weight parameter.
For very packet arrival:q ++;
if q > avgdiff = q − avg;else diff = 0;
ratio = diff/buffs;R =int(10 ∗ ratio);If (q < warn− line)new − wq = old− wq;
else{switch (R ) {
case 0: new − wq = old− wq;case 1: new − wq = old− wq * 4;case 2: new − wq = old− wq * 8;case 3: new − wq = old− wq* 12;case 4: new − wq = old− wq* 16;default: new − wq = old− wq *20;
}}
For very packet departure:q −−;
if (avg > q)new − wq = old− wq* 10;else new − wq = old− wq;
Where:old− wq:the initial weight parameter,default 0.02.
buffs: bu�er size.warnline:half of the bu�er size.
q: actual queue size.avg: average queue size.
diff : surplus of the actual queue size over the averagequeue size.
ratio: ratio of surplus over the bu�er size.R: the integer part of (10*ratio).
new − wq : the calculated value for the new weight.

5.4. REFINED DESIGN OF RED (FRED) 107
bursty tra�c resulting in under-utilization.
Upon packet arrival, FRED adjust the weight parameter. The changes
in the actual queue size are monitored. A new warning threshold is added to
split the setting of the weight parameter into two phases. If the actual queue
size exceeds the warning line then wq is adjusted using Eq. 5.16.
(5.16) new − wq =
old− wq,
old− wq ∗ 4,
old− wq ∗ 8,
old− wq ∗ 12,
old− wq ∗ 16,
old− wq ∗ 20,
R ∈ [0, 0.1)
R ∈ [0.1, 0.2)
R ∈ [0.2, 0.3)
R ∈ [0.3, 0.4)
R ∈ [0.4, 0.5)
R ∈ [0.5, 1]
Where:
R is the ratio of the surplus of the queue size to the bu�er size.
new − wq is the new value of the weight parameter.
old− wq is the initial value of the weight parameter.
It is recommended by FRED to set the warning line to half of the bu�er
size. Upon packet departure, the weight parameter is set to 0.02. Thus high
value of wq makes the average queue size more sensitive to rapid decreases in
the actual queue size. Table 5.3 illustrates this algorithm.
5.4.3. Fine-grained setting of the maximum drop probability
The maximum drop probability maxp is a very sensitive parameter. The
aggressiveness of RED is determined by this parameter. FRED divides the
area between the minimum and maximum thresholds into several sub-phases.
Each sub-phase is assigned a di�erent maxp value. When the average queue
size increases from the minimum threshold toward the maximum threshold, the

5.5. WTRED DESIGN GUIDELINES 108
maximum drop probability is also increased. The number of maxp sub-phases
is bounded by the actual bu�er size and the space between the minimum and
maximum thresholds. It is recommended by FRED to set each sub-phase to
10% of the actual bu�er size with six sub-phases.
RED does not adjust the maxp value. Hence, RED does not work e�ec-
tively with di�erent tra�c load variations [72]. FRED provides �ne-grained
maxp setting which is illustrated in Fig. 5.8.
5.5. WTRED design guidelines
Before outlining the WTRED algorithm, it is better to highlight some of
the parameter and implementation issues with RED and FRED.
5.5.1. RED's parameters
RED maintains a set of parameters to prevent congestion. Improper
parameter con�guration increases the oscillations in the average queue size
and data packet loss [14]. Thus, RED su�ers from heavy oscillations in the
average queue size, which reduces the network stability. Some RED variants
provide auto parametrization for RED [75], however, parameter con�guration
is problematic. The following section outlines the main parameters of RED:
Average queue size: Rather than using the actual queue to re�ect
congestion in gateways, RED uses an Exponentially Weighted Moving
Average (EWMA) to re�ect historical queue dynamics. This EWMA
helps gateways distinguish between transient and permanent conges-
tion. It also avoids global synchronization and bias against bursty
tra�c [29]. RED uses Eq. 2.3 to calculate the EWMA of the queue
size.
Minimum threshold: The �rst dropping level of RED. When the aver-
age queue size is lower than this threshold, no packets will be dropped.

5.5. WTRED DESIGN GUIDELINES 109
Higher minimum thresholds increase throughput and link utilization
[29].
Current drop probability: The immediate drop probability in Eq.
2.4 which is used to calculate the accumulative drop probability in
Eq. 2.5. As shown in Eq. 2.4, the current drop probability pb is a
function of the maximum drop probability maxp. Consequently, the
accumulative drop probability pa is a function of maxp. A higher
maxp will result in a higher drop rate. Section 5.6.3, shows how this
can cause problems with FRED's implementation.
Accumulative drop probability: This parameter is a value between
zero and one. When the average queue size exceeds the minimum
threshold, a packet is chosen randomly from the queue. If the prob-
ability is less than the drop probability then the packet is dropped.
The calculation of this parameter is illustrated in Eq. 2.5.
Maximum drop probability: This parameter re�ects the maximum
drop rate of RED. For example, if the maximum drop probability is
0.1, the gateway cannot drop more than one packet out of ten which
is calculated using the formula 1 out of 1/maxp.
Weight parameter: This parameter is used to calculate the EWMA
queue size in Eq.2.3. It re�ects the sensitivity of the average to the
actual changes in the queue size. It takes values from zero to one.
Setting the weight parameter to larger values means that fewer packets
are required to increase the average from A to B. For instance: if
a RED gateway with a weight parameter of 0.001 needs 60 packet
arrivals to increase the average queue size from 6 to 10, then the same
gateway with 0.003 weight parameter will need fewer packets (40) to
increase the average from 6 to 10.
Maximum threshold: As the average queue size increases from the
minimum threshold toward the maximum threshold, the drop rate is
increased slowly. As the average queue size hits the maximum thresh-

5.5. WTRED DESIGN GUIDELINES 110
old, the drop probability turns to one and every arriving packet has to
be dropped. This keeps the actual queue size between the minimum
and the maximum threshold. In RED, the values of the minimum and
maximum threshold are assigned depending on the desirable actual
average of the queue size. The new strategy, WTRED, uses di�erent
criteria to con�gure these parameters. This is further detailed in Sec.
5.5.2.
5.5.2. WTRED proposal
The maximum and minimum thresholds in RED divide the bu�er into
three main areas. The area between 0 and the minimum threshold, the area
between the minimum threshold and maximum threshold and the area between
the maximum threshold and bu�er limit. In FRED, these areas are referred
by green, yellow and red respectively. When the average queue size is in the
green area, all tra�c is allowed with no drops. In the yellow area, some of the
tra�c will be dropped. In the red area, no tra�c is allowed and all incoming
packets will be dropped.
In RED, the maximum and minimum thresholds are dependent on the
actual bu�er size which is preset before network operation time. The weight
parameter is also a pre�xed parameter. The default values of the maximum
threshold, minimum threshold and the weight parameter in RED are 5, 15 and
0.002 respectively. It has been suggested that the maximum threshold should
be set to twice the minimum threshold [29].
In FRED, the green area is divided into six equal areas with di�erent
maximum drop probabilities. Also, the area between the warn threshold and
the bu�er limit is divided into another six equal areas, each area with a dif-
ferent weight parameter. The mechanism proposed in this study, WTRED,
uses di�erent weight parameters for each area in RED. Furthermore, WTRED
adjusts the maximum and minimum thresholds based on the actual bu�er size.

5.5. WTRED DESIGN GUIDELINES 111
Figures 5.9 to 5.12 illustrate the network performance for the topology
depicted in Fig. 5.14. NS-2 was used to examine the four network performance
parameters with weight parameters in the range 0.001 to 0.1. The results sug-
gest that RED works most e�ciently when the weight parameter is between
0.001 and 0.003. To be more speci�c, two performance parameters are im-
proved: throughput and link utilization. Loss rate will be at an acceptable
level but delay will increase. These results agree with the original parameter
recommendations for RED [29] that suggest a weight parameter of 0.002.
The new parameter con�guration in WTRED is to assign the weights
0.003, 0.002 and 0.001 to the green, yellow and red areas respectively. Also,
the minimum threshold will be set at 40% of the bu�er size and the maximum
threshold will be 70% of the bu�er size. This high minimum threshold will
grant higher network throughput and link utilization. For the average to re-
spond quickly to the changes in the green area WTRED assigns the value 0.003
to the weight parameter. In case that persistent tra�c bursts accumulate the
queue size, the average will be increased faster to hit the minimum threshold
and initiate congestion recovery.
When the average reaches the yellow area, RED starts dropping packets.
In this area there is no need to have higher value for the weight parameter.
Hence, WTRED assigns the value 0.002 to the weight parameter. Another
reason to use a lower weight parameter in this area is to maintain reasonable
time before the average hits the maximum threshold. When the maximum
threshold is reached, the drop probability will be 1.0 and every arriving packet
will be dropped. Setting the weight parameter to 0.002 in this area is better
than using high values for the maximum drop probability. High maxp values
lead to shorter time to reach the maximum threshold which will reduce the
link utilization.
When the average queue size exceeds the maximum threshold and enters
the red area, RED will drop every packet arriving at the gateway. FRED
uses higher weight parameters to increase the sensitivity to the changes in the

5.5. WTRED DESIGN GUIDELINES 112
Figure 5.9. Throughput for a range of weight parameters from0.001 - 0.1.
Figure 5.10. Loss rate for a range of weight parameters from0.001 - 0.1.
actual queue size. In this case, the actual queue size and the average queue
size will closely follow each other and FRED's behavior may approach the TD
strategy, dropping packets based on the actual queue size. Fig. 5.13 illustrates
the WTRED algorithm.

5.6. SIMULATION AND DISCUSSION 113
Figure 5.11. Delays for a range of weight parameters from0.001 - 0.1.
Figure 5.12. Link utilization for a range of weight parametersfrom 0.001-0.1.
5.6. Simulation and Discussion
WTRED is simulated using the NS-2 simulator. WTRED, RED and
FRED are compared against the four network performance parameters which
are: throughput, link utilization, average delay and packet loss. The network
topology in Fig. 5.14 is used to run 11 di�erent scenarios with di�erent weight
parameters and bu�er sizes. Table 5.4, illustrates the weight and bu�er size
for each scenario used in this simulator.

5.6. SIMULATION AND DISCUSSION 114
wq 0.001 0.0015 0.002 0.0025 0.003 0.0035 0.004 0.0045 0.005 0.0055 0.006
Bu�er(packet)
40 50 60 70 80 90 100 110 120 130 140
Table 5.4. Bu�er sizes for FRED's sub-phases.
Figure 5.13. WTRED algorithm.
5.6.1. Network topology
NS2 simulation script has been used to de�ne �ve FTP sources. A duplex
link with 10Mb/s bandwidth connects each source with the gateway. Connec-
tion delays are uniformly distributed between 1ms and 5ms. Another duplex
link with 10Mb/s bandwidth and 5ms delay connects the gateway with a TCP
sink. The packet size is 552 bytes and the TCP variant is Reno. Fig. 5.14
illustrates the simulation network topology.
5.6.2. Simulation results
RED [29] suggests that, in order to �llter out transient congestion at the
gateway, the weight (wq) must be assigned small values. Low weights mean
that the EWMA will respond slowly to actual queue size changes. This reduces
the gateway's ability to detect the initial stages of congestion. The maximum
and minimum threshold values are restricted by the desired average queue size.
Also, the di�erence between the maximum threshold and minimum threshold
must be su�ciently large to avoid global synchronization. Small di�erences
between maximum threshold and minimum threshold allow the average queue
size to oscillate up to the maximum threshold.

5.6. SIMULATION AND DISCUSSION 115
Figure 5.14. Simulation network topology.
Figure 5.15. Network throughput for RED, FRED and WTRED.
Figures 5.15 to 5.18 depict the throughput, packet losses, average delay
and link utilization respectively. Fig. 5.15 shows that WTRED achieved the
highest throughput among the three strategies. FRED generates very poor
throughput due to the high weight parameter and maximum drop probability.
This also increases the loss rate as shown in Fig. 5.16. FRED also has the
lowest delays among the three strategies as in Fig. 5.17. This comes at the
price of very poor throughput, Fig. 5.15 and link utilization, Fig. 5.18.
The �gures demonstrate that WTRED outperforms RED and FRED.
WTRED improves throughput and link utilization while maintaining accept-
able delays and loss rates.

5.6. SIMULATION AND DISCUSSION 116
Figure 5.16. Packet loss rate for RED, FRED and WTRED.
Figure 5.17. Average delay for RED, FRED and WTRED.
5.6.3. Issues with RED's and FRED's implementations
Erroneous parameter con�guration degrades the performance of RED
[64]. FRED proposed a new parameter conguration for RED in an e�ort to in-
crease network performance. Unfortunately, FRED has numerous drawbacks.
FRED uses a very high maxp value. In some phases this value is ten
times the initial value in RED. Given the same queue conditions, sometimes
FRED will drop ten times as many packets as RED. The maximum threshold in

5.7. SUMMARY 117
Figure 5.18. Link utilization for RED, FRED and WTRED.
this case is actually reduced, resulting in a lower average queue size and lower
average delay. Although FRED lowers delays, its overall performance is poor
due to lower throughput, link utilization and higher loss rates, as demonstrated
in section 5.6.2.
The suggested exponent value of the weight parameter using the normal-
ized notation is -3. For example, the default value for wq in RED is 0.002.
When the actual queue size exceeds the warn threshold, FRED starts to in-
crease the weight parameter. In Table 5.2, sub-phase 6, FRED multiplies the
weight parameter by 20. In this case, wq is not just doubled, it is also shifted
one decimal point.
TD does not maintain an EWMA. RED maintains the average between
the minimum and maximum thresholds while allowing transient bursts of traf-
�c [29]. Higher weights mean that the average queue size will closely follow
the actual queue size. In case of bursty tra�c overwhelming the gateway for
an extended period, FRED will behave like a TD algorithm.
5.7. Summary
Random Early Detection (RED) uses parameters, such as: maximum
threshold, minimum threshold, weight and maximum drop probability to con-
trol congestion in TCP networks. Some RED variants use di�erent parameter

5.7. SUMMARY 118
settings to enhance RED's implementation. FRED dynamically adjusts the
maximum drop probability and the weight parameter to increase network per-
formance. This chapter highlights some of RED's and FRED's drawbacks and
proposes the Weighted RED (WTRED) strategy to overcome these shortcom-
ings.
WTRED uses a dynamic weight parameter and new maximum threshold
and minimum threshold. NS-2 simulations show that FRED reduces loss rates
and delays; but this comes at the cost of dramatically reduced throughput
and link utilization. Comparatively, RED generates higher throughput and
higher link utilization with acceptable delays and losses. WTRED provides
the highest throughput and link utilization. The packet loss rate is slightly
higher than RED, but the bene�t of these slightly higher losses is a lower
average delay. Overall, the results suggest that WTRED provides a better
balance of throughput, loss, delay and network utilization.

CHAPTER 6
Conclusions
Queue management is an approach used to control congestion in TCP
networks. Traditional queue management strategies, including Tail Drop (TD),
used a First In First Out (FIFO) technique to control congestion. These
techniques drop packets from the intermediate router queue depending on a
prede�ned threshold or drop level. Whenever the actual queue size exceeds
the pre�xed threshold; TD drops packets from the tail of the queue. TD
and traditional queue management strategies had served the network for an
extended period of time until the detection of congestion collapse [55] [54].
TD and traditional queue managent strategies are reactive and commonly
referred by the Passive Queue Management (PQM). Lock out, full queue and
global synchronization are the most severe problems incurred by using the TD
strategy.
The subsequent congestion control strategies used a proactive approaches
to avoid congestion before bu�ers over�ow. Hence, these approaches are ref-
fered by the Active Queue Management (AQM). Early Random Drop (ERD) is
one of the earliest implementations of the AQM. ERD proposes a threshold less
than the bu�er limit. Whenever the actual queue size exceeds the threshold,
ERD drops packets randomly from the queue using a pre�xed probability.
Due to the use of �xed drop probability and threshold; ERD is con-
sidered to have bias against bursty tra�c and causes global synchronization
problems. Random Early Detection (RED) was proposed with two thresholds
and a dynamic drop probability. Instead of using the actual queue size check;
RED used a low pass �lter to calculate the average queue size. Thus, RED can
more e�ectively avoid global synchronization and bias against bursty tra�c.
119

6.1. PROPOSED SOLUTIONS 120
Many RED-based strategies have been proposed to enhance the perfor-
mance, however, RED and its variants have some disdvantagies. The mismatch
between the average and actual queue sizes degrades the network performance.
In addition, parameter con�guration in RED is very sensitive. Erroneous con-
�guration makes RED behave like TD. This thesis invistegated the mismatch
and parameter con�guration problems and proposed solutions for RED's draw-
backs.
6.1. Proposed solutions
Traditional congestion control strategies; such as TD, used the actual
queue size check to determine congestion. Instead of the actual queue size
check, RED used the weight parameter to calculate the average queue size
avg in order to determine congestion. Both approaches have disadvantages.
All TD problems are caused by the actual queue size check; such as global
synchronization and lock out. The average queue size check disregards the
actual peaks in the queue; maintaining low avg. This mismatch between the
average and actual queue sizes leads to bu�er over�ow for long period of time.
In this situation, RED behaves same as TD. Thus, the risk of full queue and
global synchronization phenomena is high.
Some RED-based strategies proposed dynamic parameter con�guration
to overcome RED's disadvantages. Adaptive RED (ARED) proposed a tech-
nique to prevent bu�er over�ow by adjusting the maximum drop probability
maxp dynamically. Other strategies; such as E�ective RED (ERED), used both
actual and average queue sizes to control congestion. Re�ned RED (FRED)
used dynamic weight (wq) and maximum drop probability (maxp) to enhance
the performance of RED.
This thesis proposed three RED-based strategies to ovecome the mis-
match between the average and actual queue sizes. New parameter con�g-
urations are proposed for each strategy to avoid the drawbacks of erroneous
con�guration. The proposed strategies are: Queue Sectors RED (QSRED),

6.2. SIMULATION RESULTS 121
Risk Threshold RED (RTRED) and Weighted RED (WTRED). These strate-
gies are simulated using the NS-2 simulation and their performance is evaluated
and compared with current RED-based strategies.
6.2. Simulation results
QSRED divides the bu�er into six equal sectors. These sectors represent
new dropping levels added to the original RED implementation. QSRED used
the actual and average queue size parameters to help RED absorb short lived
bursty tra�c and control TCP congestion e�ciently. Since RED uses proba-
bilistic packet dropping, QSRED dynamically adjusts the maxp value of RED
to maintain network stability and smooth tra�c. QSRED is compared with
ERED and RED. The results show that QSRED o�ers higher throughput and
link utilization with lower packet losses and delays.
RTRED is a compromise between the TD and RED strategies. RTRED
uses both the actual and average queue sizes to calculate the drop probability
and congestion level. These calculations operate in conjunction with a third
drop level; the risk threshold. The simulation results suggest that RTRED out-
performed competing RED-based strategies; reducing the unnecessary packet
losses, the average delay time and the overhead of packet retransmission. Fur-
thermore, RTRED avoids wasting the gateway bu�er and increases the bu�er
utilization.
WTRED uses dynamic weight parameter and new maximum thresh-
old and minimum threshold. NS-2 simulations show that, a similar strategy,
FRED reduces loss rates and delays; but this comes at the cost of dramati-
cally reduced throughput and link utilization. Comparatively, RED generates
higher throughput and higher link utilization with acceptable delays and losses.
WTRED provides the highest throughput and link utilization. The packet loss
rate is slightly higher than RED, but the bene�t of these slightly higher losses
is a lower average delay. Overall, the results suggest that WTRED provides a
better balance of throughput, loss, delay and network utilization.

6.3. FUTURE WORK 122
6.3. Future work
Future work will further investigate the optimal usage of the weight pa-
rameter. Additionally, in the future we plan to compare the performance of
QSRED, RTRED and WTRED.
6.3.1. Optimal weight parameter
The weight parameter wq is most critical in RED for two reasons. Firstly,
large weights wq prevent RED from �ltering out transient congestion [29].
Secondly, low wq prevents RED from detecting the intial stages of congestion.
The main goal of RED is to maintain a desirable average queue zise which is
less than a certain threshold. Equation 2.6 [29] illustrates this scenario; where
L is the number of packet arrivals provided that the queue was empty initially,
wq is the weight parameter and minth is the minimum threshold.
Theoretically, RED should maintain an average queue size less than the
minimum threshold with few �uctuations less than the maximum threshold to
absourb transient congestion. Practically, the average queue size in RED does
not re�ect the actual dynamics of the queue size and packets are dropped due
to bu�er over�ow. This has been shown through simulation in this thesis. As a
future work, we suggest including the queue idle and peak times in estimating
the weight parameter dynamically. The main issue is to �nd the optimal wq
that reasonably re�ects the dynamics of the actual queue size over the average
queue size.
6.3.2. Comparison between QSRED, RTRED and WTRED
Using the actual queue size check as the only congestion indicator in
TD causes problems; such as global synchronization, lock out and full queue.
QSRED and RTRED apply actual and average queue size checks to match
the queue dynamics. In addition to the complexity incurred by the double
queue size check, QSRED and RTRED add more sectors and drop levels which

6.3. FUTURE WORK 123
means more monitoring and more parameter con�guration. Actual queue size
dynamics in WTRED are re�ected on the average queue size using adjustable
weight parameter wq. WTRED also maintains the original drop levels of RED
which makes WTRED the simplest strategy to implement.
QSRED and RTRED use the maximum drop probability maxp to adjust
the drop rate depending on the level of congestion. The congestion level in both
strategies is partially estimated using the actual queue size. WTRED assigns
a speci�c weight parameter wq for every drop level to increase/decrease the
drop rate. The congestion level in WTRED is estimated depending on the
average queue size. Hence, QSRED and RTRED are expected to be better
than WTRED in solving the short lived congestion. Conversely, WTRED is
expected to better solve the long lived congestion.
A comparative study between QSRED, RTRED and WTRED is a worth-
while point of research. As a future work, the performance of these three
strategies can be evaluated against throughput, link utilization, packet loss
and delays. The strategies can be simulated using the NS-2 simulator.

References
[1] B. Abbasov and S. Korukouglu. E�ective red: An algorithm to improve
red's performance by reducing packet loss rate. Journal of Network and
Computer Applications, 32(3):703�709, May 2009.
[2] M. Allman, V. Paxon, and W. Stevens. Tcp congestion control. Technical
report, IETF RFC2581, 1999.
[3] J. Aweya, M. Ouellette, and D. Montuno. A control theoretic approach
to active queue management. Computer Networks: The International
Journal of Computer and Telecommunications Networking, 36(2-3):203�
235, July 2001.
[4] R. Axelrod. The evolution of cooperation. HarperCollins, 1984.
[5] D. Bansal and H. Balakrishnan. Bionomial congestion control al-gorithms.
In Twentieth Annual Joint Conference of the IEEE Computer and Com-
munications Societies, Proceedings, volume 2, pages 631�640, Anchorage,
AK, 2001.
[6] I. Barrera, G. Arce, and S. Bohacek. Statistical approach for congestion
control in gateway routers. Computer Networks, 55(3):572�582, 2011.
[7] B. Braden, D. Clark, J. Crowcroft, and et al. Recommendations on queue
management and congestion avoidance in the internet. Technical report,
IETF RFC2309, April 1998.
[8] L. S. Brakmo and L. L. Peterson. Tcp vegas: End-to-end con-gestion
avoidance on a global internet. IEEE JSAC, 13(8):1465�1480, 1995.
[9] H. Chengchen and L. Bin. Red with optimized dynamic threshold deploy-
ment on shered bu�er. In Advanced Information Networking and Appli-
cations AINA, 18th International Conference, pages 451 � 454, 2004.
124

References 125
[10] M. Christiansen, K. Je�ay, D. Ott, and F. Smith. Tuning red for web
tra�c. IEEE/ACM Transactions Networking, 9(3):249�264, Jun 2001.
[11] D. Clark and W. Fang. Explicit allocation of best-e�ort packet delivery
service. IEEE/ACM Transactions on Networking, 6(4):362�373, August
1998.
[12] V. Dumas, F. Guillemin, and P. Robert. A markovian analysis of additive-
increase multiplicative-decrease algorithms. JSTOR, 34(1):85�111, March
2002.
[13] K. Fall and S. Floyd. Simulation-based comparisons of tahoe, reno, and
sack tcp. Technical report, ACM Computer Communication Review,
Berkeley, 1996.
[14] L. Feng, Z. Guan, and H. Wang. Controlling bifurcations and chaos in
tcpudpred. Real World Applications, 11(3):1491�1501, 2010.
[15] W. Feng. A self-con�guring red gateway. In Proceedings of IEEE INFO-
COM 99, pages 1320�1328, San Franscisco, CA, March 1999.
[16] W. Feng, D. Kandlur, D. Saha, and K. Shin. Blue: A new class of active
queue management algorithms. Technical report, University of Michigan,
UM CSE-TR-387-. 99, April 1999.
[17] W. Feng, D. Kandlur, D. Saha, and K. G. Shin. Techniques for eliminating
packet loss in congested tcp/ip networks. Technical report, University of
Michigan, UM CSE-TR-349-97, November 97.
[18] S. Floyd. Tcp and explicit congestion noti�cation. ACM. Computer Com-
munication Review, 24(5):10�23, 1994.
[19] S. Floyd. Notes on testing RED implementation,
http://www.icir.org/�oyd/papers/redtesting, 1996.
[20] S. Floyd. Congestion control principles. IETF, September 2000.
[21] S. Floyd. Recommendation on using the gentle-variant of red, available:
http://icir.org/�oyd/red/gentle.html. 2000.
[22] S. Floyd. References on RED (Random Early Detection) Queue Manage-
ment: http://www.icir.org/�oyd/red.html, 2008.

References 126
[23] S. Floyd and K. Fall. Promoting the use of end-to-end congestion control
in the internet. IEEE/ACM Trans. Net., 1999.
[24] S. Floyd and K. Fall. Promoting the use of end-to-end congestion control
in the internet. Networking, IEEE/ACM Transactions, 7(4):458 � 472,
1999.
[25] S. Floyd, R. Gummadi, and S. Shenker. Adaptive RED: An Algo-
rithm for Increasing the Robustness of RED's Active Queue Management,
http://www.aciri.org/�oyd/papers/adaptiveRed.ps, 2001.
[26] S. Floyd and T. Hennderson. The newreno modi�cation to tcp's fast
recovery algorithm. Technical report, RFC 2582, 1999.
[27] S. Floyd and V. Jacobson. Tra�c phase e�ects in packet-switched gate-
ways. ACM Comp. Commun. Rev., 21(2):26�42, April 1991.
[28] S. Floyd and V. Jacobson. On tra�c phase e�ects in packet-switched
gateways. Internetworking: Research and Experience, 3(3):115�156, Sep-
tember 1992.
[29] S. Floyd and V. Jacobson. Random early detection gateways for conges-
tion avoidance. IEEE/ACM Trans. Netw., 1:397�413, 1993.
[30] S. Floyd and V. Jacobson. The synchronization of periodic routing mes-
sages. IEEE/ACM Transactions on Networking (TON), 2(2):122 � 136,
1994.
[31] P. Gevros, J. Crowcroft, P. Kirstein, and S. Bhatti. Congestion control
mechanisms and the best e�ort service model. Network, IEEE, 15(3):16�
26, May 2001.
[32] L. Guo and I. Matta. The war between mice and elephants. In In Pro-
ceedings of the 9th IEEE International Conference on Network Protocols
(ICNP), USA, November 2001.
[33] E. S. Hashem. Analysis of random drop for gateway congestion control.
Master's thesis, Massachusetts Institute of Technology, 1989.
[34] M. Hassan and R. Jain. High Performance TCP/IP Networking: Con-
cepts, Issues, and Solutions. Prentice-Hall, 2003.

References 127
[35] E. Head and S. Head. A survey on congestion control. Global Journal of
Computer Science and Technology, 9(5):82�87, 2010.
[36] J. Hoe. Improving the start-up behavior of a congestion control scheme
for tcp. Technical report, Proceedings of the ACM SIGCOMM, 1996.
[37] ISI. The network simulator - ns-2. www.isi.edu/nsnam/ns-build.html,
2005.
[38] V. Jacobson. Congestion avoidance and control. Proc. ACM SIGCOMM
88, 18(4):314�329, August 1988.
[39] J. M. Ja�e. Bottleneck �ow control. IEEE Trans. Commun, 29(7):954�
962, 1981.
[40] R. Jain and K. K. Ramakrishnan. Congestion avoidance in computer net-
works with a connectionless network layer: Concepts, goals and methodol-
ogy. In in Proc. IEEE Comp. Networking Symp, Washington D.C., pages
134�143, 1988.
[41] J. Kay and J. Pasquale. The importance of non-data touching processing
overheads in tcp/ip. in Proceeeding of the SIGCOMM Symposium on
communications Architectures and protocols, 23(4):259�268, 1993.
[42] S. Kunniyur and R. Srikant. Analysis and design of an adaptive virtual
queue (avq) algorithm for active queue management. In Proc. of ACM
SIGCOMM 2001, pages 123�134, San Diego, USA, august 2001.
[43] L. Le, J. Aikat, K. Je�ay, and F. Smith. The e�ect of active queue manage-
ment on web performance. In SIGCOMM'03, pages 265�276, Karlsruhe,
Germany, 2003.
[44] D. Lin and R. Morris. Dynamics of random early detection. ACM SIG-
COMM '97, 27(4):127�137, September 1997.
[45] D. Lin and R. Morris. Dynamics of random early detection. In ACM
SIGCOMM '97, pages 27�137, Cannes, France, 1997.
[46] S. H. Low and D. E. Lapsley. Optimization �ow control, i: Basic algorithm
and convergence. IEEE/ACM Transactions on Networking, 7(6):861�874,
December 1999.

References 128
[47] J. K. MacKie-Mason and H. R. Varian. Pricing congestible network re-
sources. IEEE Journal in Selected Areas, 13(7):1141�1149, 1995.
[48] M. Mathis and J. Mahdavi. Re�ning tcp congestion control. In Forward
acknowledgment, pages 281�292. in Procedings of the ACM SIGCOMM,
1996.
[49] M. Mathis, J. Mahdavi, S. Floyd, and A. Romanow. Tcp selective ac-
knowledgement options. Technical report, RFC 2018, 1996.
[50] M. May, C. Diot, B. Lyles, and J. Bolot. In�uence of active queue man-
agement parameters on aggregate tra�c performance. Technical Report
RR3995, INRIA, 2000.
[51] M. May and et al. Reasons not to deploy red. pages 260�262, London ,
UK 1999, 1999.
[52] V. Misra, W. Gong, and D. Towsley. Fluid-based analysis of a network
of aqm routers supporting tcp �ows with an application to red. ACM
SIGCOMM Computer Communication Review, 30(4):151�160, October
2000.
[53] D. Mitra and J. Seery. Dynamic adaptive windows for high speed data net-
works with multiple paths and propagation delays. In Proceedings. IEEE
INFOCOM '91. Tenth Annual Joint Conference of the IEEE Computer
and Communications Societies. Networking in the 90s., volume 1, pages
39�48, Bal Harbour, FL, Apr 1991.
[54] J. Nagle. Congestion control in ip/tcp internetworks. RFC 896, IETF,
1984.
[55] J. Nagle. On packet switches with in�nite storage. IEEE Trans. Commun.,
35:435�438, 1987.
[56] T. J. Ott, T. V. Lakshman, and L. H. Wong. Sred: Stabilized red. IN-
FOCOM '99, 3:1346�1355, 1999.
[57] J. Padhye, V. Firoiu, D. Towsley, and J. F. Kurose. Modeling tcp reno
performance: a simple model and its empirical validation. Networking,
IEEE/ACM Transactions, 8(2):133 � 145, 2000.

References 129
[58] P. K. Panos Gevros, Jon Crowcroft and S. Bhatti. Congestion control
mechanisms and the best e�ort service model. IEEE Network, 15:16�26,
2001.
[59] M. Parris, K. Je�ay, and F. Smith. Lightweight active router-queue man-
agement for multimedia networking. In Multimedia Computing and Net-
working, SPIE Proceedings Series, volume 3020, San Jose, CA, January
1999.
[60] J. Postel. Transmission control protocol. IETF, RFC 793, 1981.
[61] W. Prue and J. Postel. Something a host could do with source quench.
Technical Report RFC1016, IETF, July 1987.
[62] K. Ramakrishnan and S. Floyd. A proposal to add explicit congestion
noti�cation (ecn) to ip. Technical report, IETF RFC2481, 1990.
[63] V. Rosolen, O. Bonaventure, and G. Leduc. A red discard strategy for
atm networks and its performance evaluation with tcp/ip tra�c. ACM
SIGCOMM Computer Communication Review, 29(3):23�43, July 1999.
[64] S. Ryu, C. Rump, and Q. Chunming. Advances in internet congestion
control. Communications Surveys & Tutorials, IEEE, 5(1):28�39, 2003.
[65] T. Sheldon and B. Sur. Congestion control mechanisms, 2001.
[66] S. Shenker, L. Zhang, and D. Clark. Some observations on the dynamics of
a congestion control algorithm. ACM Computer Communication Review,
pages 30�39, 1990.
[67] W. Stevens. Tcp slow-start, congestion avoidance, fast retransmit and fast
recovery algorithms. Technical report, IETF RFC2001, 1997.
[68] L. Sun and L. Wang. A novel red scheme with preferential dynamic thresh-
old deployment. the International Conference on Computational Intelli-
gence Security Workshops, 2007.
[69] B. Suter, T. V. Lakshman, D. Stiliadis, and A. K. Choundhury. Design
considerations for supporting tcp with per-�ow queuing. In INFOCOM
'98. Seventeenth Annual Joint Conference of the IEEE Computer and
Communications Societies, volume 1, pages 299 �306, San Francisco, CA,

References 130
1998.
[70] C. Villamizar and C. Song. High performance tcp in ansnet. ACM SIG-
COMM Computer Communication Review, 24(5):45�60, October 1994.
[71] L. Vukadinovic and L. Trajkovic. Red with dynamic thresholds for im-
proved fairness. In ACM Symposium on Applied Computing, 2004.
[72] H. Wang and K. Shin. Re�end design of early detection gateways. Global
Telecommunication Conference GLOBCOM'99, 1:769�775, 1999.
[73] L. Wei-yan, Z. Xue-lan, L. Tao, and L. Bin. A dynamic and self-adaptive
tcp friendly congestion control mechanism in next-generation networks. In
Intelligent Systems and Applications ISA, Inter-national Workshop, pages
1�4, Wuhan, 2009.
[74] M. Welzl and W. Eddy. Congestion control in the rfc series. IRTF, RFC-
5783, 2010.
[75] C. Wu and S. Yang. The mechanism of adapting red parameters to tcp
tra�c. Computer Communications, 32(13-14):1525�1530, 2009.
[76] L. Y. Jie and Z. L. Bf-red: A novel algorithm for improving band-width
fairness of red. In The 2006 IEEE International Conference ICNSC, vol-
ume 1001-1005, Ft. Lauderdale, FL, 2006.
[77] P. Young. Recursive estimation and time-series analysis. Springer-Verlag,
1984.
[78] L. Zhang. A new architecture for packet switching network protocols.
Technical report, Laboratory for Computer Scienc, Massachusetts Insti-
tute of Technology, 1989.
[79] L. Zhang and D. Clark. Oscillating behavior of network tra�c: A case
study simulation. Internetworking Research and Experience, 1(2):101�112,
1990.
[80] L. Zhang, S. Shenker, and D. Clark. Observations on the dynamics of
a con-gestion control algorithm: The e�ects of two way tra�c. In ACM
SIGCOMM'91, pages 133�148, Zurich, Switzerland, 1991.

References 131
[81] Y. Zhang and L. Qiu. Understanding the end-to-end perfor-mance im-
pact of red in a heterogeneous environment. Technical report, Cornell CS
Technical Report 2000-1802, July 2000.


![A Cross-layer Dual Queue Approach for Improving TCP ... · The issue of TCP fairness in WLANs has been recently addressed in [6–10]. In [6], the ... 3 Dual Queue Scheme for Uplink](https://static.documents.pub/doc/80x56/603e1d18025a5a6a0b2c52b9/a-cross-layer-dual-queue-approach-for-improving-tcp-the-issue-of-tcp-fairness.jpg)


