15
Analysis and flood models for Ljubljana Urban Region Elco Koks & Hans de Moel
| Date post: | 04-Jan-2016 |
| Category: |
Documents |
| Upload: | gladys-norton |
| View: | 217 times |
| Download: | 1 times |

Analysis and flood models for Ljubljana Urban Region
Elco Koks & Hans de Moel

2
Brief overview
What is flood risk?
Modelling the hazard
Preparing the exposure data
Maximum damages and depth-damage curves
The damage assessment
Applying mitigation measures

3
Flood risk
Hazard
Exposure
Vulnerability
x
x
= Risk

4
Modelling the hazard: HEC-RAS
Developed by the US Army Corps of Engineers (USACE)
Open access
Allows for modelling river floods
5
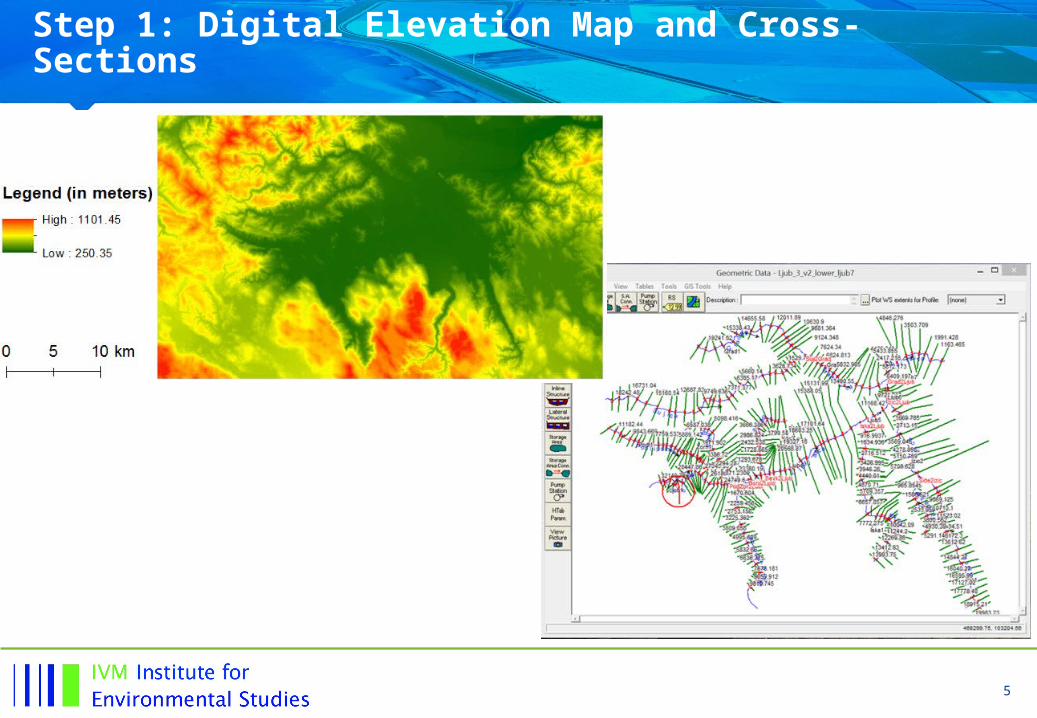
Step 1: Digital Elevation Map and Cross-Sections

6
Step 2: The discharges (in meters per second)
Return period
Ljub1 Ljub7 Podl1 Zorn1 boro1 iska1 iz_side1 izic1 grad1 Suji1
'vhrnika' 'moste' 'razor' 'drenov' 'borovnica' 'iska' 'ig1' 'zelimlje' 'dvor' 'razori'
2 13 55 13 2 10 28 10 14 15 6
10 27 108 23 4 22 53 15 26 34 14
25 31 126 27 4 27 62 16 31 42 19
50 34 136 30 5 30 68 17 34 47 22
100 37 144 32 5 33 74 17 37 52 25
250 39 153 35 6 36 80 17 40 57 28
500 41 158 37 6 38 84 17 42 61 31

7
Step 3: Final steps in HEC-RAS

8
Step 4: The results, 2010 flood simulated

9
Preparing the exposure data: update land-use map
OLD:
NEW:

10
Vulnerability: maximum damages and depth-damage curves
Based on JRC study from 2007: curves and maximum damages were tailored to country level. Land-use class
Max Damage (per square
meter)High-density residential: land 25High-density residential: the buildings 400Low-density residential: land 10Low-density residential: the buildings 400Industrial or commercial: land 20Industrial or commercial: the buildings 300Road and rail networks and associated land 8.34Airports 10.58Construction sites 76.73Green urban areas 59.01Sport and leisure facilities 57.57Non-irrigated arable land 0.43Permanently irrigated land 0.42Vineyards 0.4Fruit trees and berry plantations 0.38Pastures 0.4Annual crops associated with permanent crops 0.33Complex cultivation patterns 0.37Land principally occupied by agriculture, with significant areas of natural vegetation 0.25Agro-forestry areas 0.29

11
Applying mitigation measures
Raising houses:• +25 cm• +50 cm• +100 cm
Building a dike:• Notranje Gorice

12
The results
Baseline Dike + 25 cm +50 cm + 100 cm0
20
40
60
80
100
120
140
RP10
RP50
RP100
RP500
in m
illi
on
s E
uro
Baseline Dike + 25 cm +50 cm + 100 cm0
1
2
3
4
5
6
7
8
9
10
EAD
EAD
in m
illi
on
s E
uro

13
Benefit-cost analysis
Cost-benefit ratio of dike at Notranje is > 2
Elevating existing buildings has very low ratio (0.005)
Elevating new buildings has a much higher ratio but is not everywhere > 1
14
Concluding remarks
The model is able to model the flood and its consequences
BUT: maximum damages and curves should be tailored more to Slovenian characteristics.
With such models, many more adaptation and mitigation measures can be evaluated


