17
1 ELCO Management Co, LLC Co, LLC Unlocking The Energy Value Chain “The U.S. Energy Boom will be like the Internet of the 1990’s.” – Jack Welch
1
ELCO Management Co, LLCCo, LLC
Unlocking The Energy Value Chain
“The U.S. Energy Boom will be like the Internet of the 1990’s.” – Jack Welch
2
ELCO Management OverviewFocus and Expertise
ELCO Management OverviewFocus and Expertise
• ELCO was founded in 1995 and is an SEC Registered Investment Advisor specializing in the Energy and Infrastructure (Energy Value Chain) sectors.
• ELCO employs a fundamental top-down bottom-up research process and utilizes a strict and comprehensive risk management approach.
• ELCO manages a long-short fund focusing on the Energy Value Chain which has a compounded annualized return of 14.25% since inception in 2002
• ELCO has been consistently recognized as a top-ten energy manager by Barclays Managed Fund Report.
• Assets under management are currently $300 million firm wide
• General Partners have a significant investment in the investment strategies run by ELCO

Energy Value ChainInvestment Universe
Energy Value ChainInvestment Universe
• ELCO specializes in the “Energy Value Chain” which includes oil, natural gas, MLPs, power and renewable energy.
Energy Infrastructure Value Chain (Enterprise Value $4,250B, 500+ companies)
Upstream Fuels EV $2,300 billion, ~325 companies
Pipes and TranscosEV $500 billion, ~100 companies
Power EV $275 billion, ~20
companies
• Majors • Independent Oil & Gas• Coal• Liquefied Natural Gas• Services
•Pipelines & Transmission
•Services •Gathering & Processing•Storage•E&C
•Nuclear•Natural Gas-fired•Coal-fired•Renewable/Alternatives•E&C
Utilities & Distribution
EV >$1,100 billion, ~130 companies
• Energy Delivery (Regulated/Unregulated)
• Energy Efficiency• Smart Grid• E&C
Energy Infrastructure Value Chain (Enterprise Value $4,250B, 500+ companies)
Energy Infrastructure Value Chain (Enterprise Value $4,250B, 500+ companies)
Upstream Fuels EV $2,300 billion, ~325 companies
Upstream Fuels EV $2,300 billion, ~325 companies
Pipes and TranscosEV $500 billion, ~100 companies
Pipes and TranscosEV $500 billion, ~100 companies
Power EV $275 billion, ~20
companies
Power EV $275 billion, ~20
companies
• Majors • Independent Oil & Gas• Coal• Liquefied Natural Gas• Services
• Majors • Independent Oil & Gas• Coal• Liquefied Natural Gas• Services
•Pipelines & Transmission
•Services •Gathering & Processing•Storage•E&C
•Pipelines & Transmission
•Services •Gathering & Processing•Storage•E&C
•Nuclear•Natural Gas-fired•Coal-fired•Renewable/Alternatives•E&C
•Nuclear•Natural Gas-fired•Coal-fired•Renewable/Alternatives•E&C
Utilities & Distribution
EV >$1,100 billion, ~130 companies
Utilities & Distribution
EV >$1,100 billion, ~130 companies
• Energy Delivery (Regulated/Unregulated)
• Energy Efficiency• Smart Grid• E&C
• Energy Delivery (Regulated/Unregulated)
• Energy Efficiency• Smart Grid• E&C
3

Investment StylesInvestment Styles• ELCO investment style is fundamentally driven by the investment team’s
expertise in the Energy space.
• The Energy value chain offers a large opportunity set and full range of investment styles in order to adapt to changing market conditions
• Comprises of ~50% of the S&P 500 Index
Sub Sector GARP Growth Value Momentum Defensive Event Driven
Majors ✓ ✓ ✓ ✓
E&P ✓ ✓ ✓ ✓
Services ✓ ✓ ✓
MLPs/Pipes ✓ ✓ ✓ ✓ ✓
Utilities and Power ✓ ✓ ✓
E&C ✓ ✓ ✓
Sub Sector GARP Growth Value Momentum Defensive Event Driven
Majors ✓ ✓ ✓ ✓
E&P ✓ ✓ ✓ ✓
Services ✓ ✓ ✓
MLPs/Pipes ✓ ✓ ✓ ✓ ✓
Utilities and Power ✓ ✓ ✓
E&C ✓ ✓ ✓
4
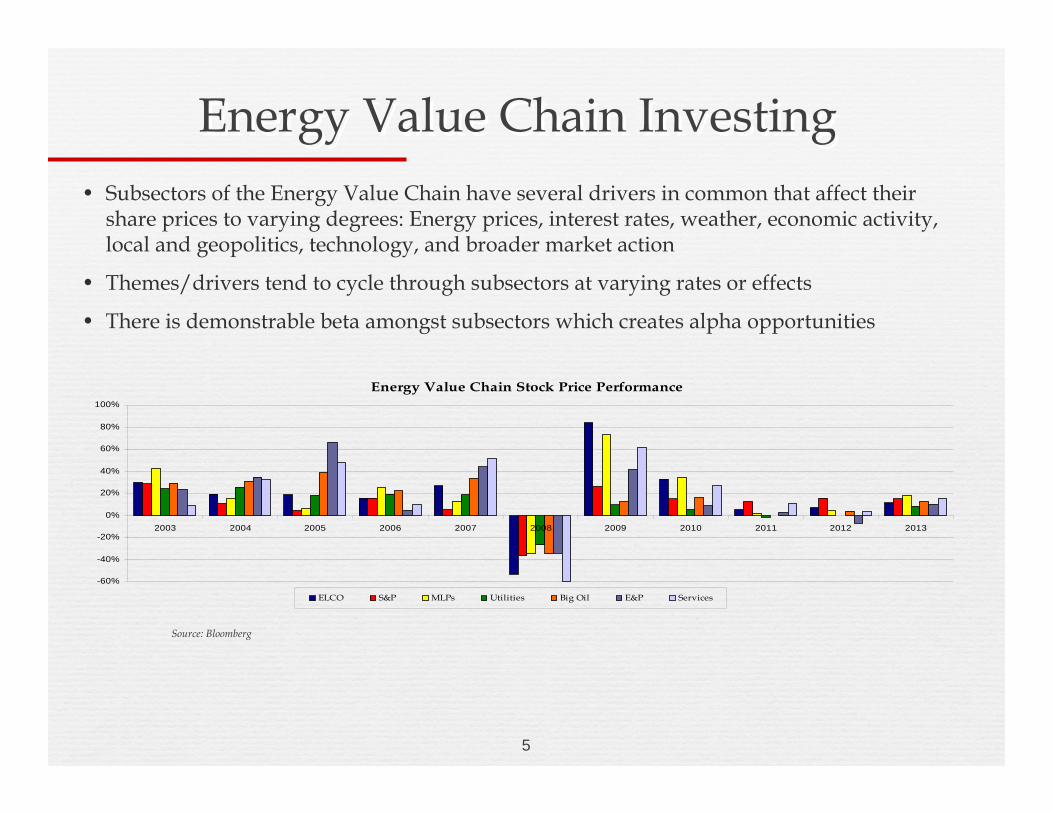
Energy Value Chain InvestingEnergy Value Chain Investing• Subsectors of the Energy Value Chain have several drivers in common that affect their
share prices to varying degrees: Energy prices, interest rates, weather, economic activity, local and geopolitics, technology, and broader market action
• Themes/drivers tend to cycle through subsectors at varying rates or effects
• There is demonstrable beta amongst subsectors which creates alpha opportunities
Source: Bloomberg
5
Energy Value Chain Stock Price Performance
-60%
-40%
-20%
0%
20%
40%
60%
80%
100%
2003 2004 2005 2006 2007 2008 2009 2010 2011 2012 2013
ELCO S&P MLPs Utilities Big Oil E&P Services

Game Changing ThemesNew Technologies Are Disrupting the Global Energy Landscape
Game Changing ThemesNew Technologies Are Disrupting the Global Energy Landscape
• Technological advances in drilling and well stimulation have combined to unlock vast oil and gas reserves that until recently were thought to be uneconomic.
• Impact: This advancement has already effected the US energy value chain
• The development of shale plays and ultra-deep wells have pushed the US passed Russia as the world’s largest natural gas producer.
• Old Economy Renaissance: Due to the renewed certainty of supply and lower relative prices, natural gas-dependent industries such as Petrochemicals, Fertilizer, and Steel are investing in the US again -creating jobs across the chain.
• US oil production is now growing after declining for the last decade. The IEA’s projection show U.S. oil production peaking in 2020 at 11.1 million barrels per day, up from 8.1 million barrels per day in 2011.
QuickTime™ and a decompressor
are needed to see this picture.
6
7
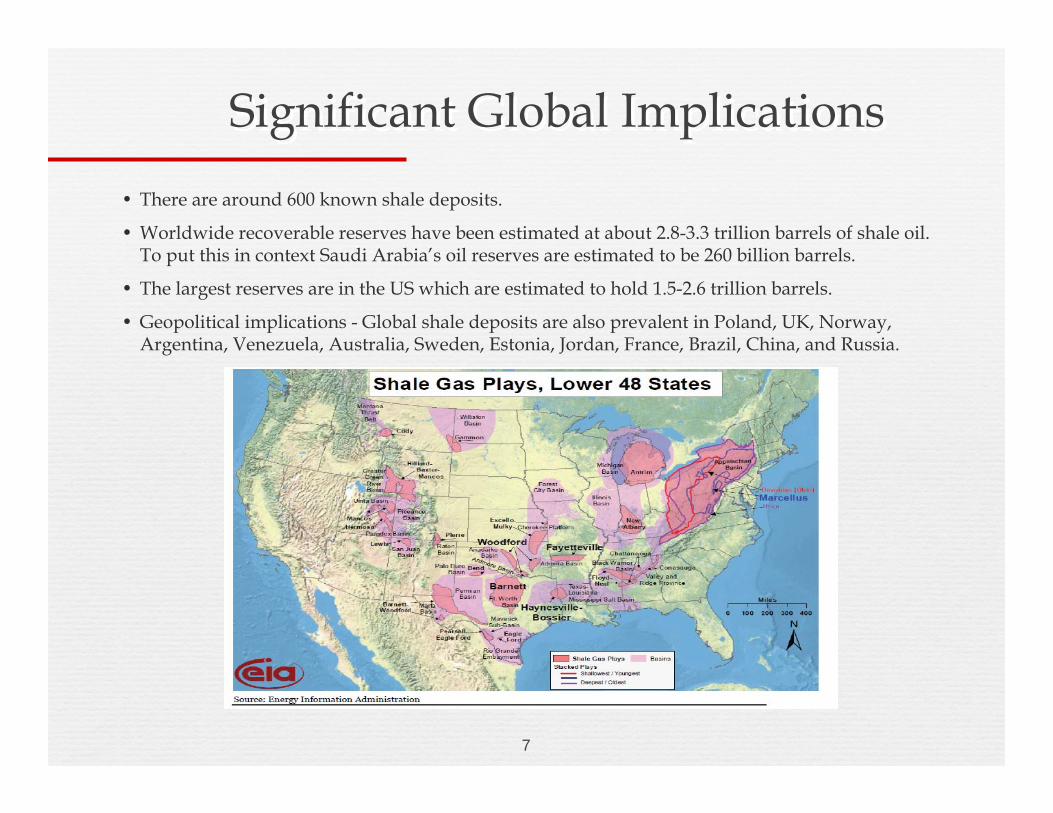
Significant Global ImplicationsSignificant Global Implications• There are around 600 known shale deposits.
• Worldwide recoverable reserves have been estimated at about 2.8-3.3 trillion barrels of shale oil. To put this in context Saudi Arabia’s oil reserves are estimated to be 260 billion barrels.
• The largest reserves are in the US which are estimated to hold 1.5-2.6 trillion barrels.
• Geopolitical implications - Global shale deposits are also prevalent in Poland, UK, Norway,Argentina, Venezuela, Australia, Sweden, Estonia, Jordan, France, Brazil, China, and Russia.
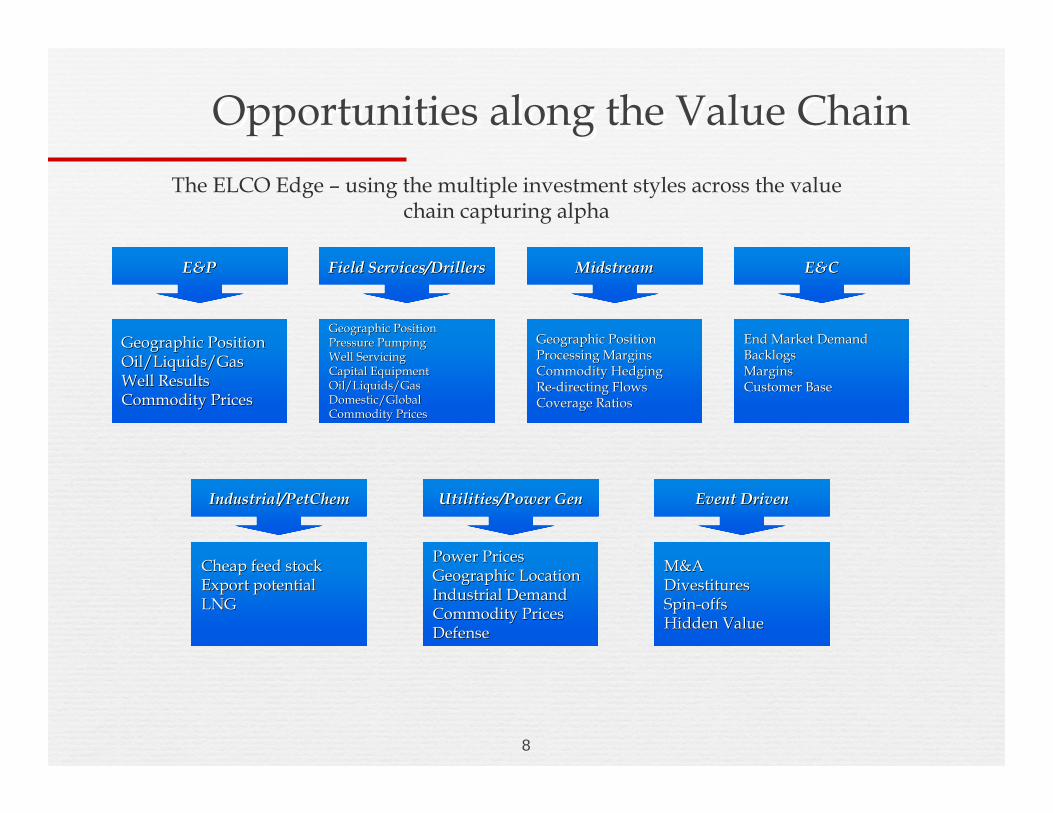
Opportunities along the Value ChainOpportunities along the Value Chain
E&PE&P
Geographic PositionGeographic PositionOil/Liquids/GasOil/Liquids/GasWell ResultsWell ResultsCommodity PricesCommodity Prices
Field Services/DrillersField Services/Drillers
Geographic PositionGeographic PositionPressure PumpingPressure PumpingWell ServicingWell ServicingCapital EquipmentCapital EquipmentOil/Liquids/GasOil/Liquids/GasDomestic/GlobalDomestic/GlobalCommodity PricesCommodity Prices
MidstreamMidstream
Geographic PositionGeographic PositionProcessing MarginsProcessing MarginsCommodity HedgingCommodity HedgingReRe--directing Flowsdirecting FlowsCoverage RatiosCoverage Ratios
E&CE&C
End Market DemandEnd Market DemandBacklogsBacklogsMarginsMarginsCustomer BaseCustomer Base
Industrial/Industrial/PetChemPetChem
Power PricesPower PricesGeographic LocationGeographic LocationIndustrial DemandIndustrial DemandCommodity PricesCommodity PricesDefenseDefense
Utilities/Power GenUtilities/Power Gen
Cheap feed stockCheap feed stockExport potentialExport potentialLNGLNG
Event DrivenEvent Driven
M&AM&ADivestituresDivestituresSpinSpin--offsoffsHidden ValueHidden Value
The ELCO Edge – using the multiple investment styles across the value chain capturing alpha
8
9
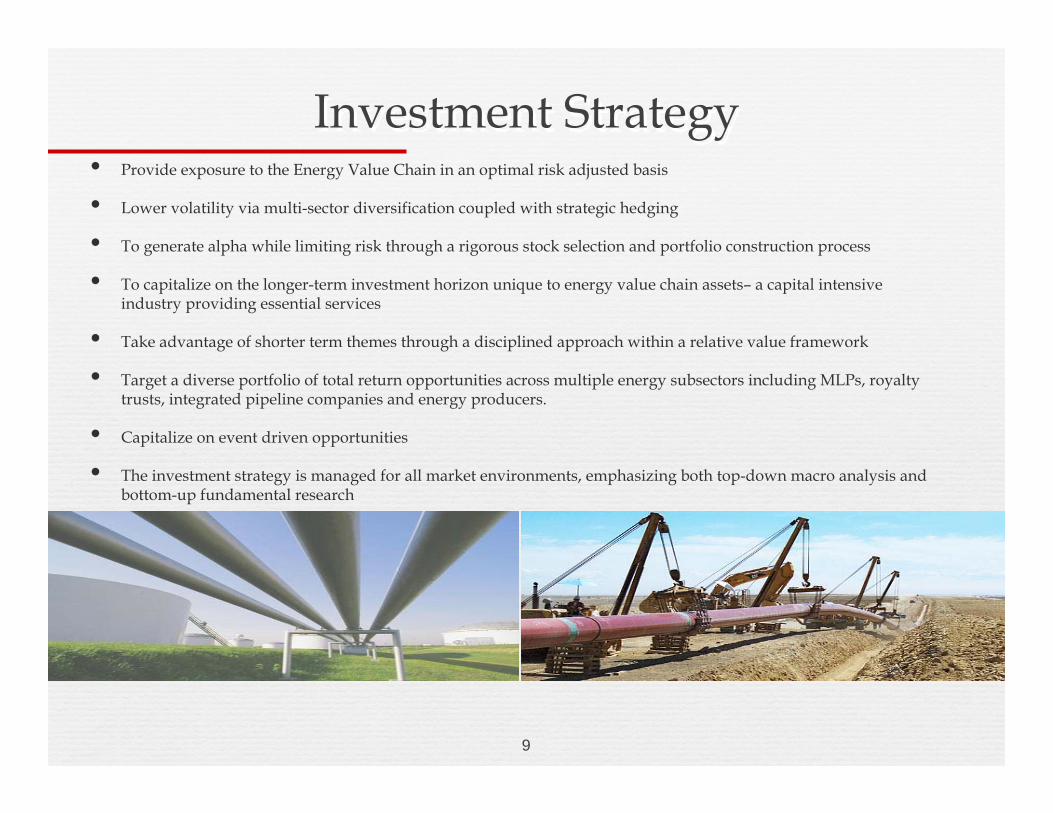
Investment StrategyInvestment Strategy• Provide exposure to the Energy Value Chain in an optimal risk adjusted basis
• Lower volatility via multi-sector diversification coupled with strategic hedging
• To generate alpha while limiting risk through a rigorous stock selection and portfolio construction process
• To capitalize on the longer-term investment horizon unique to energy value chain assets– a capital intensive industry providing essential services
• Take advantage of shorter term themes through a disciplined approach within a relative value framework
• Target a diverse portfolio of total return opportunities across multiple energy subsectors including MLPs, royalty trusts, integrated pipeline companies and energy producers.
• Capitalize on event driven opportunities
• The investment strategy is managed for all market environments, emphasizing both top-down macro analysis and bottom-up fundamental research

Investment ProcessInvestment Process
• ELCO employs sector expertise and an intensive bottom-up fundamental research driven process
• Top down themes are developed by analyzing current industry trends
• Positions are modeled and selected on several criteria including:
Earnings leverage to broader themes
Strength of management
Potential upside to fundamental price target
Earnings stability and growth potential
Free cash flow growth potential
Dividend/distribution coverage ratio and quality of cash flow
10

Risk ManagementRisk Management
• We screen for fundamental, macro or political issues
• We sell when a change in the fundamentals place earnings at risk
• We keep the portfolio diversified to avoid concentration or systemic risks
• We reassess, then typically trim as a position nears its fundamental price target
• We employ relative downside targets
• We average down when the stock price is negatively affected by drivers which do not compromise earnings (market sentiment for instance)
11

Long/Short Performance*Long/Short Performance*
11.471.18-1.643.551.057.042013
6.862.51-1.53-1.544.663.414.90-0.18-11.572.19-2.633.264.422012
2.69-0.543.252002
30.112.240.392.431.831.86-2.88-0.406.139.301.051.290.932003
19.57-0.077.003.114.32-1.631.223.78-0.43-0.14-0.580.411.362004
18.802.461.39-5.404.781.575.922.972.27-3.10-1.215.041.262005
15.67-0.404.664.89-2.740.330.761.470.581.452.01-3.845.952006
26.602.19-5.265.614.59-2.22-0.031.096.103.234.601.902.632007
-53.21-5.70-17.79-18.26-22.95-3.59-10.541.426.339.25-2.674.66-7.412008
84.159.084.38-2.786.951.049.76-4.3213.7019.436.99-9.4011.372009
33.207.605.065.557.69-3.268.66-0.40-9.415.252.713.63-2.502010
7.743.021.1916.79-12.78-10.021.77-0.07-4.150.772.756.764.562011
YTDDECNOVOCTSEPAUGJULJUNMAYAPRMARFEBJAN
*Monthly performance numbers are unaudited and estimated as the performance and management fees are calculated at the end of the each year. As of 2/2006, management fee is 1.5%. Prior to October 31, 2002, the Fund was in a pre-launch phase with only one partner in addition to the general partner.
12

ELCO Long/ShortELCO Long/ShortOne the ELCO funds is an equity long/short fund focused on the energy value chain including upstream E&P, midstream MLPs, renewables and downstream utility sectors; and includes related sectors when our research uncovers opportunities e.g., petrochemicals, transportation, etc. Our investment strategy utilizes top-down thematic research. We then employ bottom-up fundamental company analysis to determine the best risk/reward investment opportunities.
Risk/Return StatisticCompounded ROR 14.25% Standard Deviation 20.75%
Cumulative Return since inception 309.44% Downside Deviation(0.0%) 14.26%
Percent Profitable Months 67% Sharpe Ratio (0.0%) 0.75
Average Monthly Return 1.3% Sortino Ratio (0.0%) 0.94
Fund InformationMinimum Subscription $500,000 Subscriptions/Redemptions Monthly/Quarterly
Management Fee 1.5% Auditor Grant Thornton, LP
Performance Fee 20% Prime Broker J.P. Morgan
Fund AUM/Total AUM $54MM/$250MM Legal Tannenbaum Helpern, LLP
13
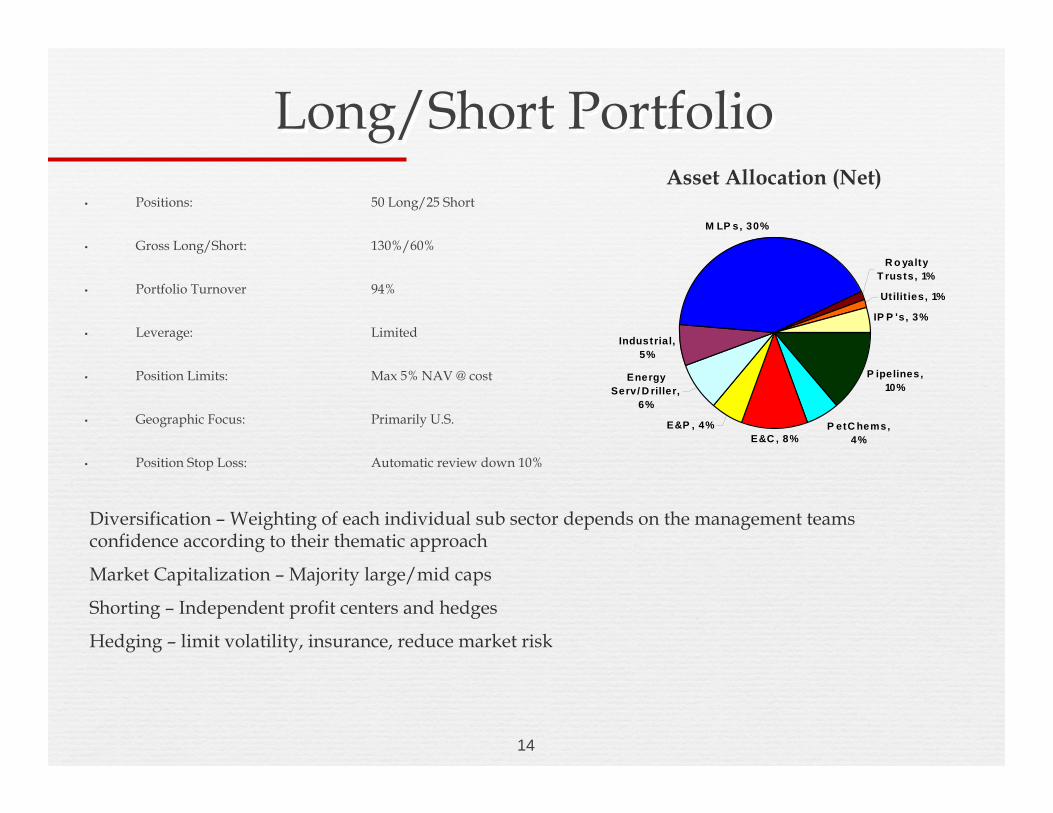
Long/Short PortfolioLong/Short Portfolio• Positions: 50 Long/25 Short
• Gross Long/Short: 130%/60%
• Portfolio Turnover 94%
• Leverage: Limited
• Position Limits: Max 5% NAV @ cost
• Geographic Focus: Primarily U.S.
• Position Stop Loss: Automatic review down 10%
Diversification – Weighting of each individual sub sector depends on the management teams confidence according to their thematic approach
Market Capitalization – Majority large/mid caps
Shorting – Independent profit centers and hedges
Hedging – limit volatility, insurance, reduce market risk
Asset Allocation (Net)
14
P ipelines, 10%
P etC hems, 4%E&C , 8%
E&P , 4%
Industrial, 5%
M LP s, 30%
R o yalty T rusts, 1%
Utilit ies, 1%
IP P 's, 3%
Energy Serv/ D riller,
6%
15
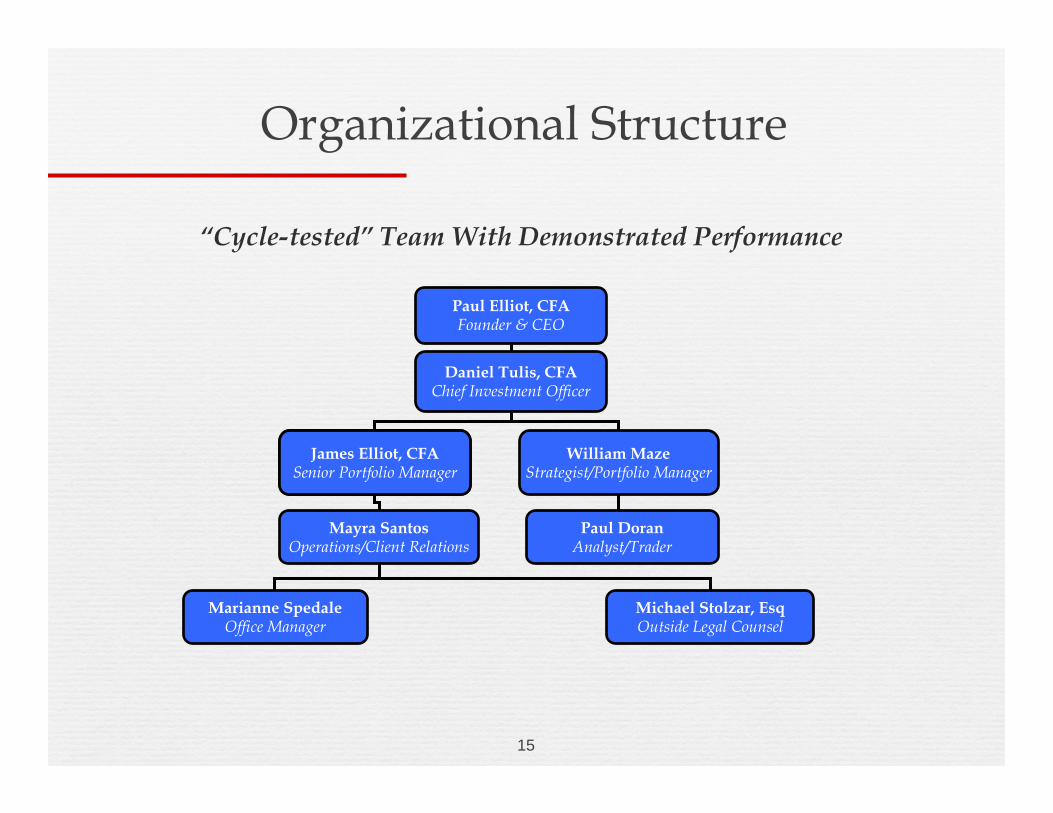
Organizational Structure
“Cycle-tested” Team With Demonstrated Performance
Paul Elliot, CFAFounder & CEO
Daniel Tulis, CFAChief Investment Officer
James Elliot, CFASenior Portfolio Manager
Mayra SantosOperations/Client Relations
Paul DoranAnalyst/Trader
Marianne SpedaleOffice Manager
Michael Stolzar, EsqOutside Legal Counsel
William MazeStrategist/Portfolio Manager
James Elliot, CFASenior Portfolio Manager

16
Management TeamManagement TeamEnergy ValueEnergy Value--Chain Investing VeteransChain Investing Veterans
Paul Elliot, CFA Founder and CEO
• More than 30 Years of Research and Asset Management Experience
• Expertise in Energy Infrastructure, Electrical Equipment, Master Limited Partnerships (MLPs)
• Served as Senior Research Analyst, Portfolio Manager and Partner at Cowen & Co. for 20 years
• CFA Designation 1972
Daniel Tulis, CFA CIO
• More than 30 Years Research Experience
• First Research Analyst Covering Energy Master Limited Partnerships (MLPs)
• Headed the Electric Power, Natural Gas, MLP Research as Senior Managing Director at Banc of America, S. Barney & Shearson Lehman
• Ranked as an All Star for 10 years by Institutional Investor Magazine (#1 in 1994)
• Expertise in Electric and Natural Gas Utilities, Oil and Gas Exploration/Production, Energy Infrastructure, MLPs, Energy Technology, and Special Situations
• CFA Designation 1968
James Elliot, CFA Portfolio Manager and Senior Analyst
• More than 10 Years Research and Portfolio Management Experience
• Cowen Asset Management, Portfolio Manager, Research Analyst, Trader
• Co-Managed a $1 Billion Large Cap Core Portfolio - Invested Sectors: Financial, Technology, Consumer Staples, Consumer Discretional, Health Care, etc.
• Expertise in Power Technology, Alternative Energy and MLPs,
• CFA Designation 1995
William Maze Strategist and Portfolio Manager
• More than 18 Years Research and Portfolio Management Experience
• Co-Managed $1.7 Billion energy-infrastructure and utility portfolio for Ecofin Ltd. Headed Neuberger Berman’s Utility, MLP, Coal and Energy Technology research.
• Consistently recognized for his research, valuation and stock selection skills in leading institutional research polls and was ranked by The Wall Street Journal as the number-one stock picker in his sector
• Expertise in Power, Natural Gas and MLPs,
Paul Doran Analyst, Trader, Risk Officer
• More than 7 years Research, Trading, and Risk Management Experience
• Expertise in Oil and Gas Exploration/Production, Energy Services, Energy Infrastructure, MLPs
• UBS Financial Services, Wealth Management
17
Legal Disclaimer
nThis presentation is being furnished on a confidential basis and serves as preliminary executive summary for information regarding an investment in ELCO Management Co., Separately Managed Account Programs (SMAP), and may not be used or reproduced for any other purpose. This presentation does not constitute an offer to sell nor a solicitation of an offer to purchase interests in any investment vehicle managed by ELCO Management Co., LLC. All security transactions involve substantial risk of loss. Products may involve above average risk and past performance is not necessarily indicative of future performance. All material is compiled from sources believed to be reliable, but accuracy cannot be guaranteed.


