Page 1
ANALYSIS OF NATURALLY OCCURING RADIOACTIVE MATERIALS IN DRILL CUTTINGS, GREATER WATTENBERG FIELD, WELD COUNTY
COLORADO
COGCC Special Project 2136
November 2014
Prepared by:
Colorado Oil & Gas Conservation Commission 1120 Lincoln Street, Suite 801
Denver, CO 80203
Page 2
SPECIAL PROJECT 2136 COGCC
2
Table of Contents
List of Acronyms ....................................................................................................................................... 3
Introduction ............................................................................................................................................... 4
Background ................................................................................................................................................ 4
Sample Results .......................................................................................................................................... 5
Field Screening .......................................................................................................................................... 5
Analytical Laboratory Sample Results.................................................................................................. 6
Gross Alpha Results .......................................................................................................................... 7
Gross Beta Results .............................................................................................................................. 8
Gamma-Emitting Radionuclide Results ......................................................................................... 8
Uranium Isotopic Radionuclide Results ....................................................................................... 10
Thorium Isotopic Radionuclide Results ....................................................................................... 10
Discussion ................................................................................................................................................ 11
Conclusion and Recommendations ..................................................................................................... 11
Recommendations ................................................................................................................................... 12
References................................................................................................................................................. 12
Figures………………………………………………………………………...…Following Report Text
Tables………………………………………………………………………..….…… Following Figures
Page 3
SPECIAL PROJECT 2136 COGCC
3
LIST OF ACRONYMS
ALS ALS Laboratory Group
ASTM ASTM International (formerly known as American Society for Testing and
Materials)
CCR Code of Colorado Regulations
CDPHE Colorado Department of Public Health and Environment
COGCC Colorado Oil & Gas Conservation Commission
DOT Department of Transportation
E&P Exploration & Production
keV kiloelectron volts
MDA minimum detection activity
NORM Naturally Occurring Radioactive Materials
pCi/g picoCuries per gram
STRONGER State Review of Oil & Natural Gas Environmental Regulations
TENORM Technically Enhanced Naturally Occurring Radioactive Material
USEPA U.S. Environmental Protection Agency
Page 4
SPECIAL PROJECT 2136 COGCC
4
INTRODUCTION
In October 2011, the State Review of Oil & Natural Gas Environmental Regulations
(STRONGER) team recommended that the Colorado Oil & Gas Conservation Commission
(COGCC) gather information on the occurrence and level of Naturally Occurring Radioactive
Materials (NORM) in Exploration & Production related (E&P) wastes in Colorado.
COGCC Special Project 2136 (NORM Study) was initiated in 2014. COGCC staff undertook a
sampling program to collect representative samples of selected E&P waste for analytical
laboratory evaluation for NORM. Because of the widespread practice of beneficial reuse of drill
cuttings as an agricultural soils amendment, staff determined that evaluation of NORM levels in
drill cuttings was an appropriate focus for this information gathering study. This study focused
on drill cuttings from recent well drilling in the Greater Wattenberg Field in Weld County.
A total of 36 samples were collected during the months of May and June 2014 and submitted for
analyses. The samples included 12 samples of drill cuttings, 12 samples of soils with drill
cuttings incorporated, and 12 samples of native soils collected as background samples. The
analytical results for these samples have been uploaded to the COGCC database and are
available for public review. Discussions of the results are presented below.
BACKGROUND
Naturally Occurring Radioactive Material (NORM) is any radioactive material that occurs
naturally and is not byproduct, source or special nuclear material (6 Code of Colorado
Regulations [CCR] 1007-1 Part 01). NORM is sometimes defined as primordial radionuclides, or
natural radioactivity in the form of uranium and thorium and their progeny such as radium,
present in water, soils, rocks, and materials undisturbed as a result of human activity.
Technically Enhanced Naturally Occurring Radioactive Material (TENORM) is naturally
occurring radioactive material where the natural radionuclide concentrations are increased by
or as a result of human practices (6 CCR 1007-1 Part 01). TENORM does not include
background radiation or natural radioactivity of rocks or soils. Typical TENORM materials
include materials such as gas plant pipe scaling, some drinking water purification and
treatment wastes, mining/refining wastes, scrap metal, industrial sludges, and other industrial
process wastes and materials.
Page 5
SPECIAL PROJECT 2136 COGCC
5
The Radiation Program of the Colorado Department of Public Health and Environment
(CDPHE) Hazardous Materials and Waste Division provides some regulatory oversight and
guidance regarding TENORM materials (http://www.colorado.gov/cs/Satellite/CDPHE-
HM/CBON/1251617273613).
NORM is everywhere. It is a part of our daily lives, as the natural environment has many
sources of radiation. Radiation continually bombards us from space. The earth’s rocks and soils,
the air we breathe, the food we eat, the water we drink, even our bodies are radioactive. In most
cases the level of NORM is below any regulatory definition of radioactive material and the
health risks from these low levels of radiation are considered low. In some cases, however, the
level of NORM may be equal to materials governed under TENORM regulatory programs, or
the handling of NORM materials can create issues which may increase potential for health
exposures.
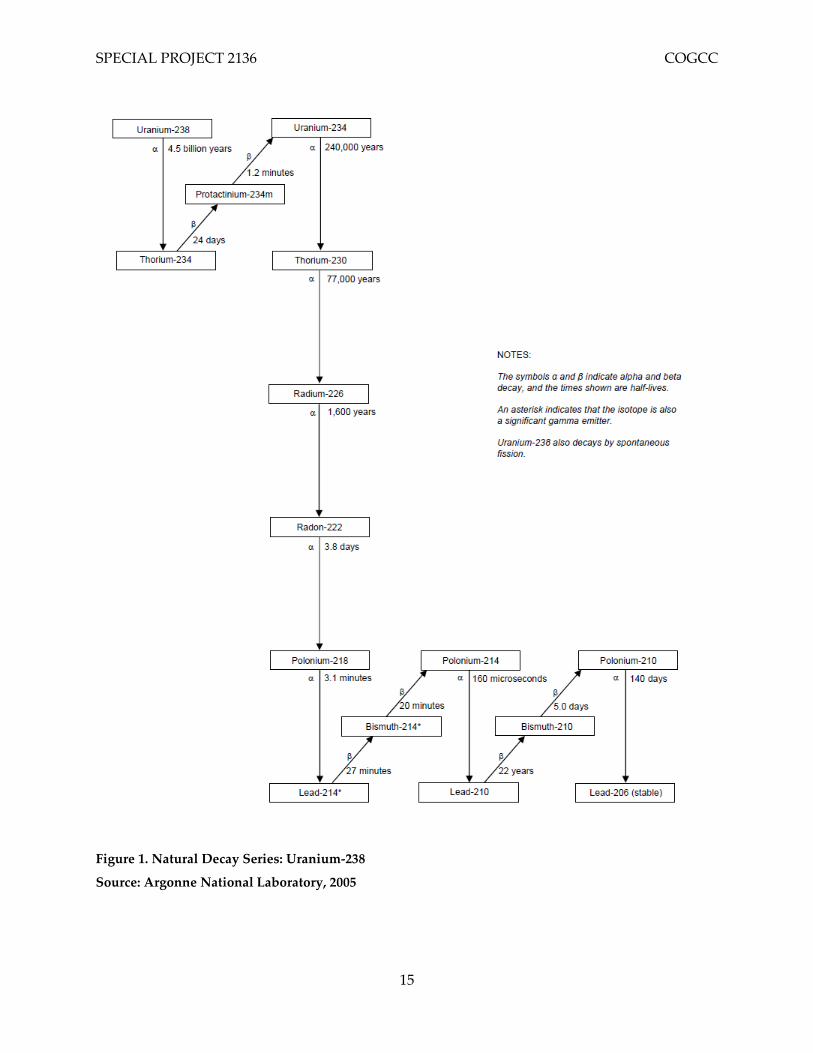
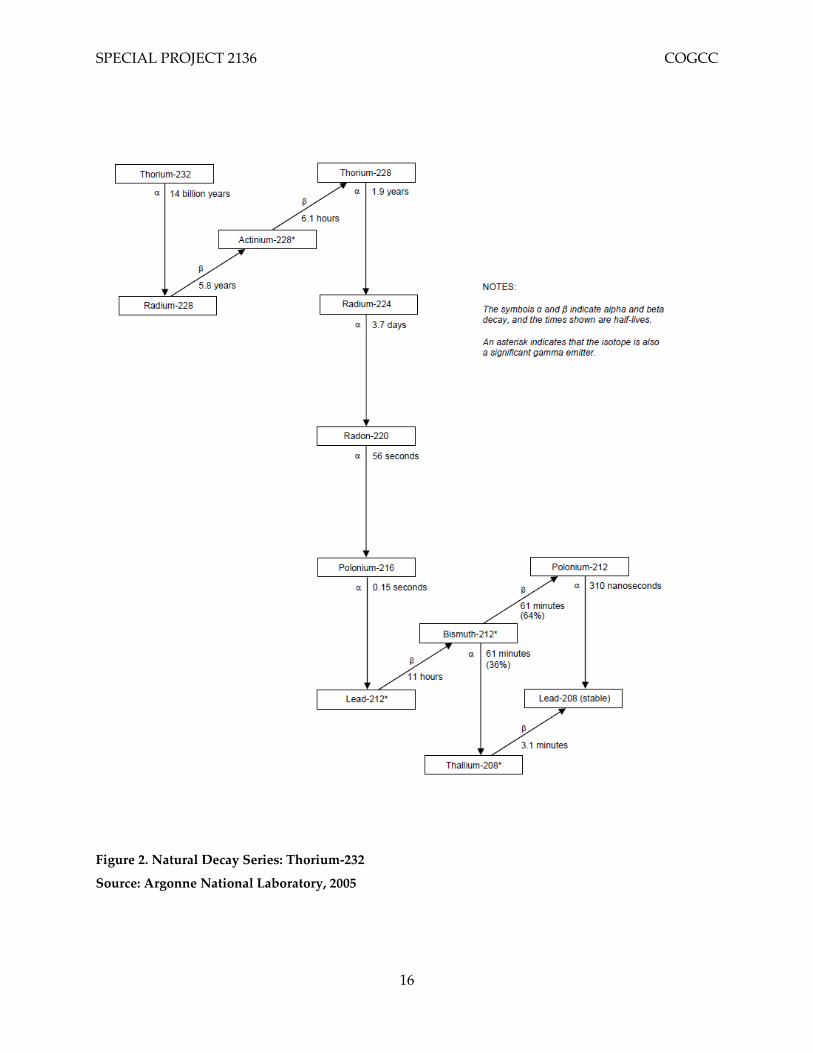
The primary radionuclides of concern in NORM are radium-226 (226Ra) of the uranium-238
(238U) decay series, and radium-228 (228Ra) of the thorium-232 (232Th) decay series. Figures 1 and
2 depict the decay chains of 238U and 232Th, respectively.
SAMPLE RESULTS
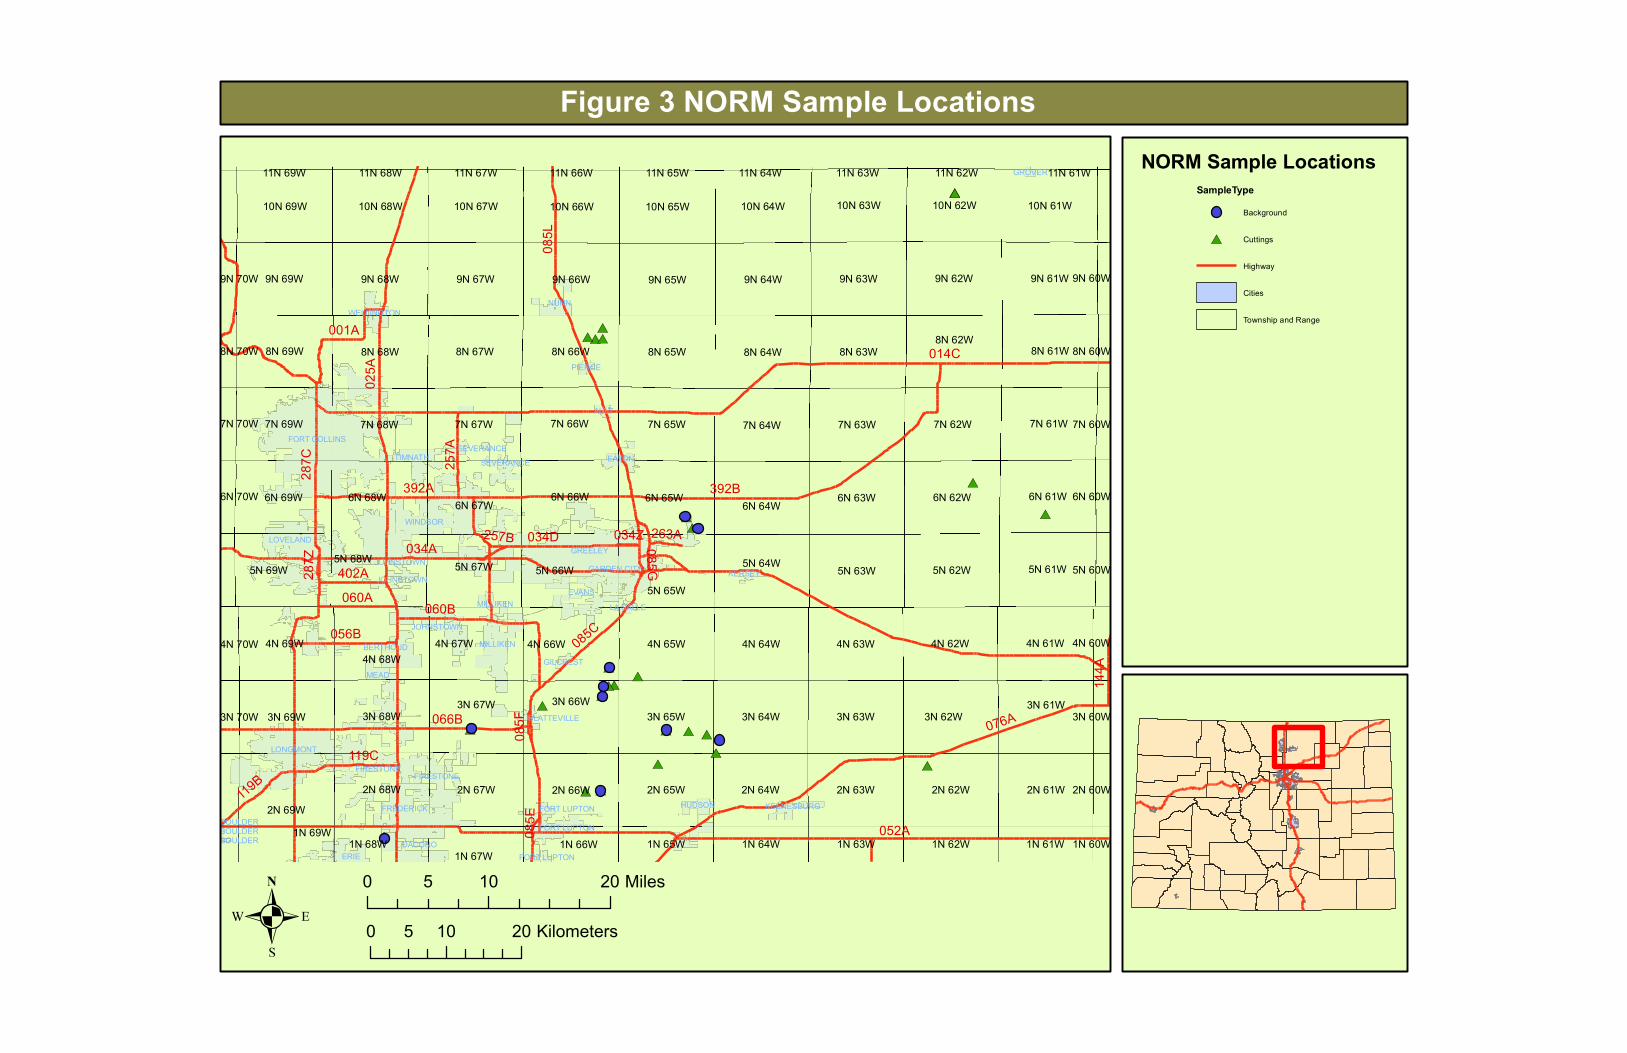
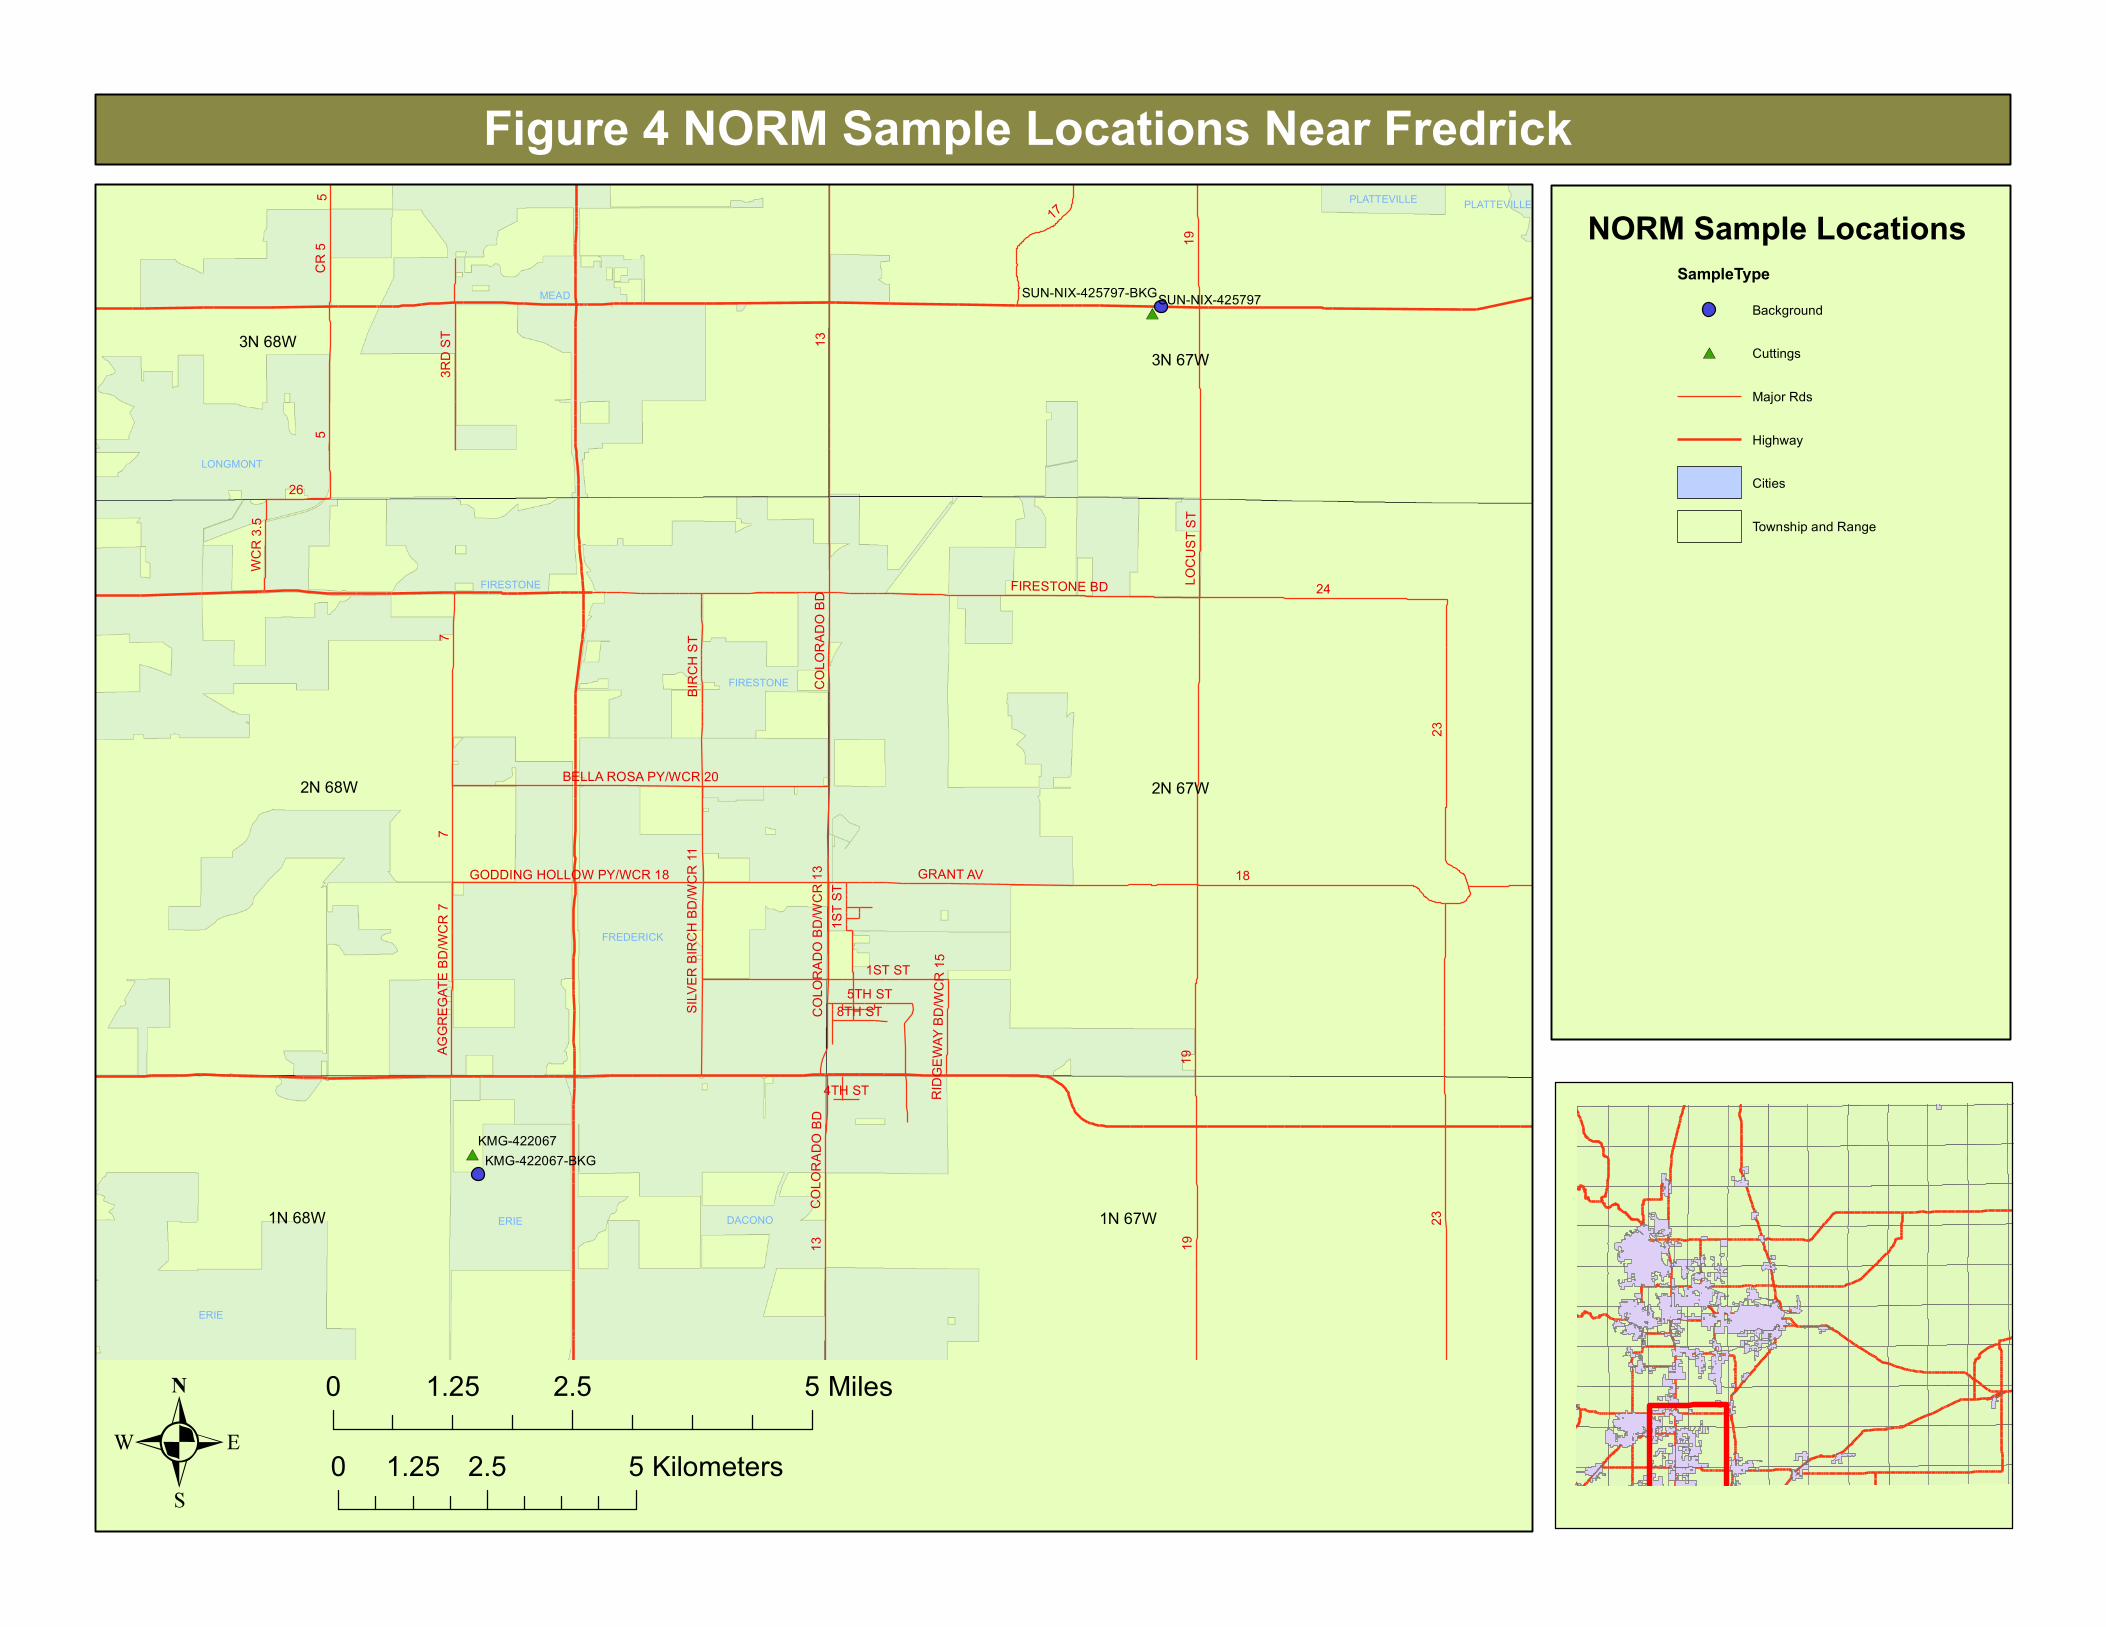
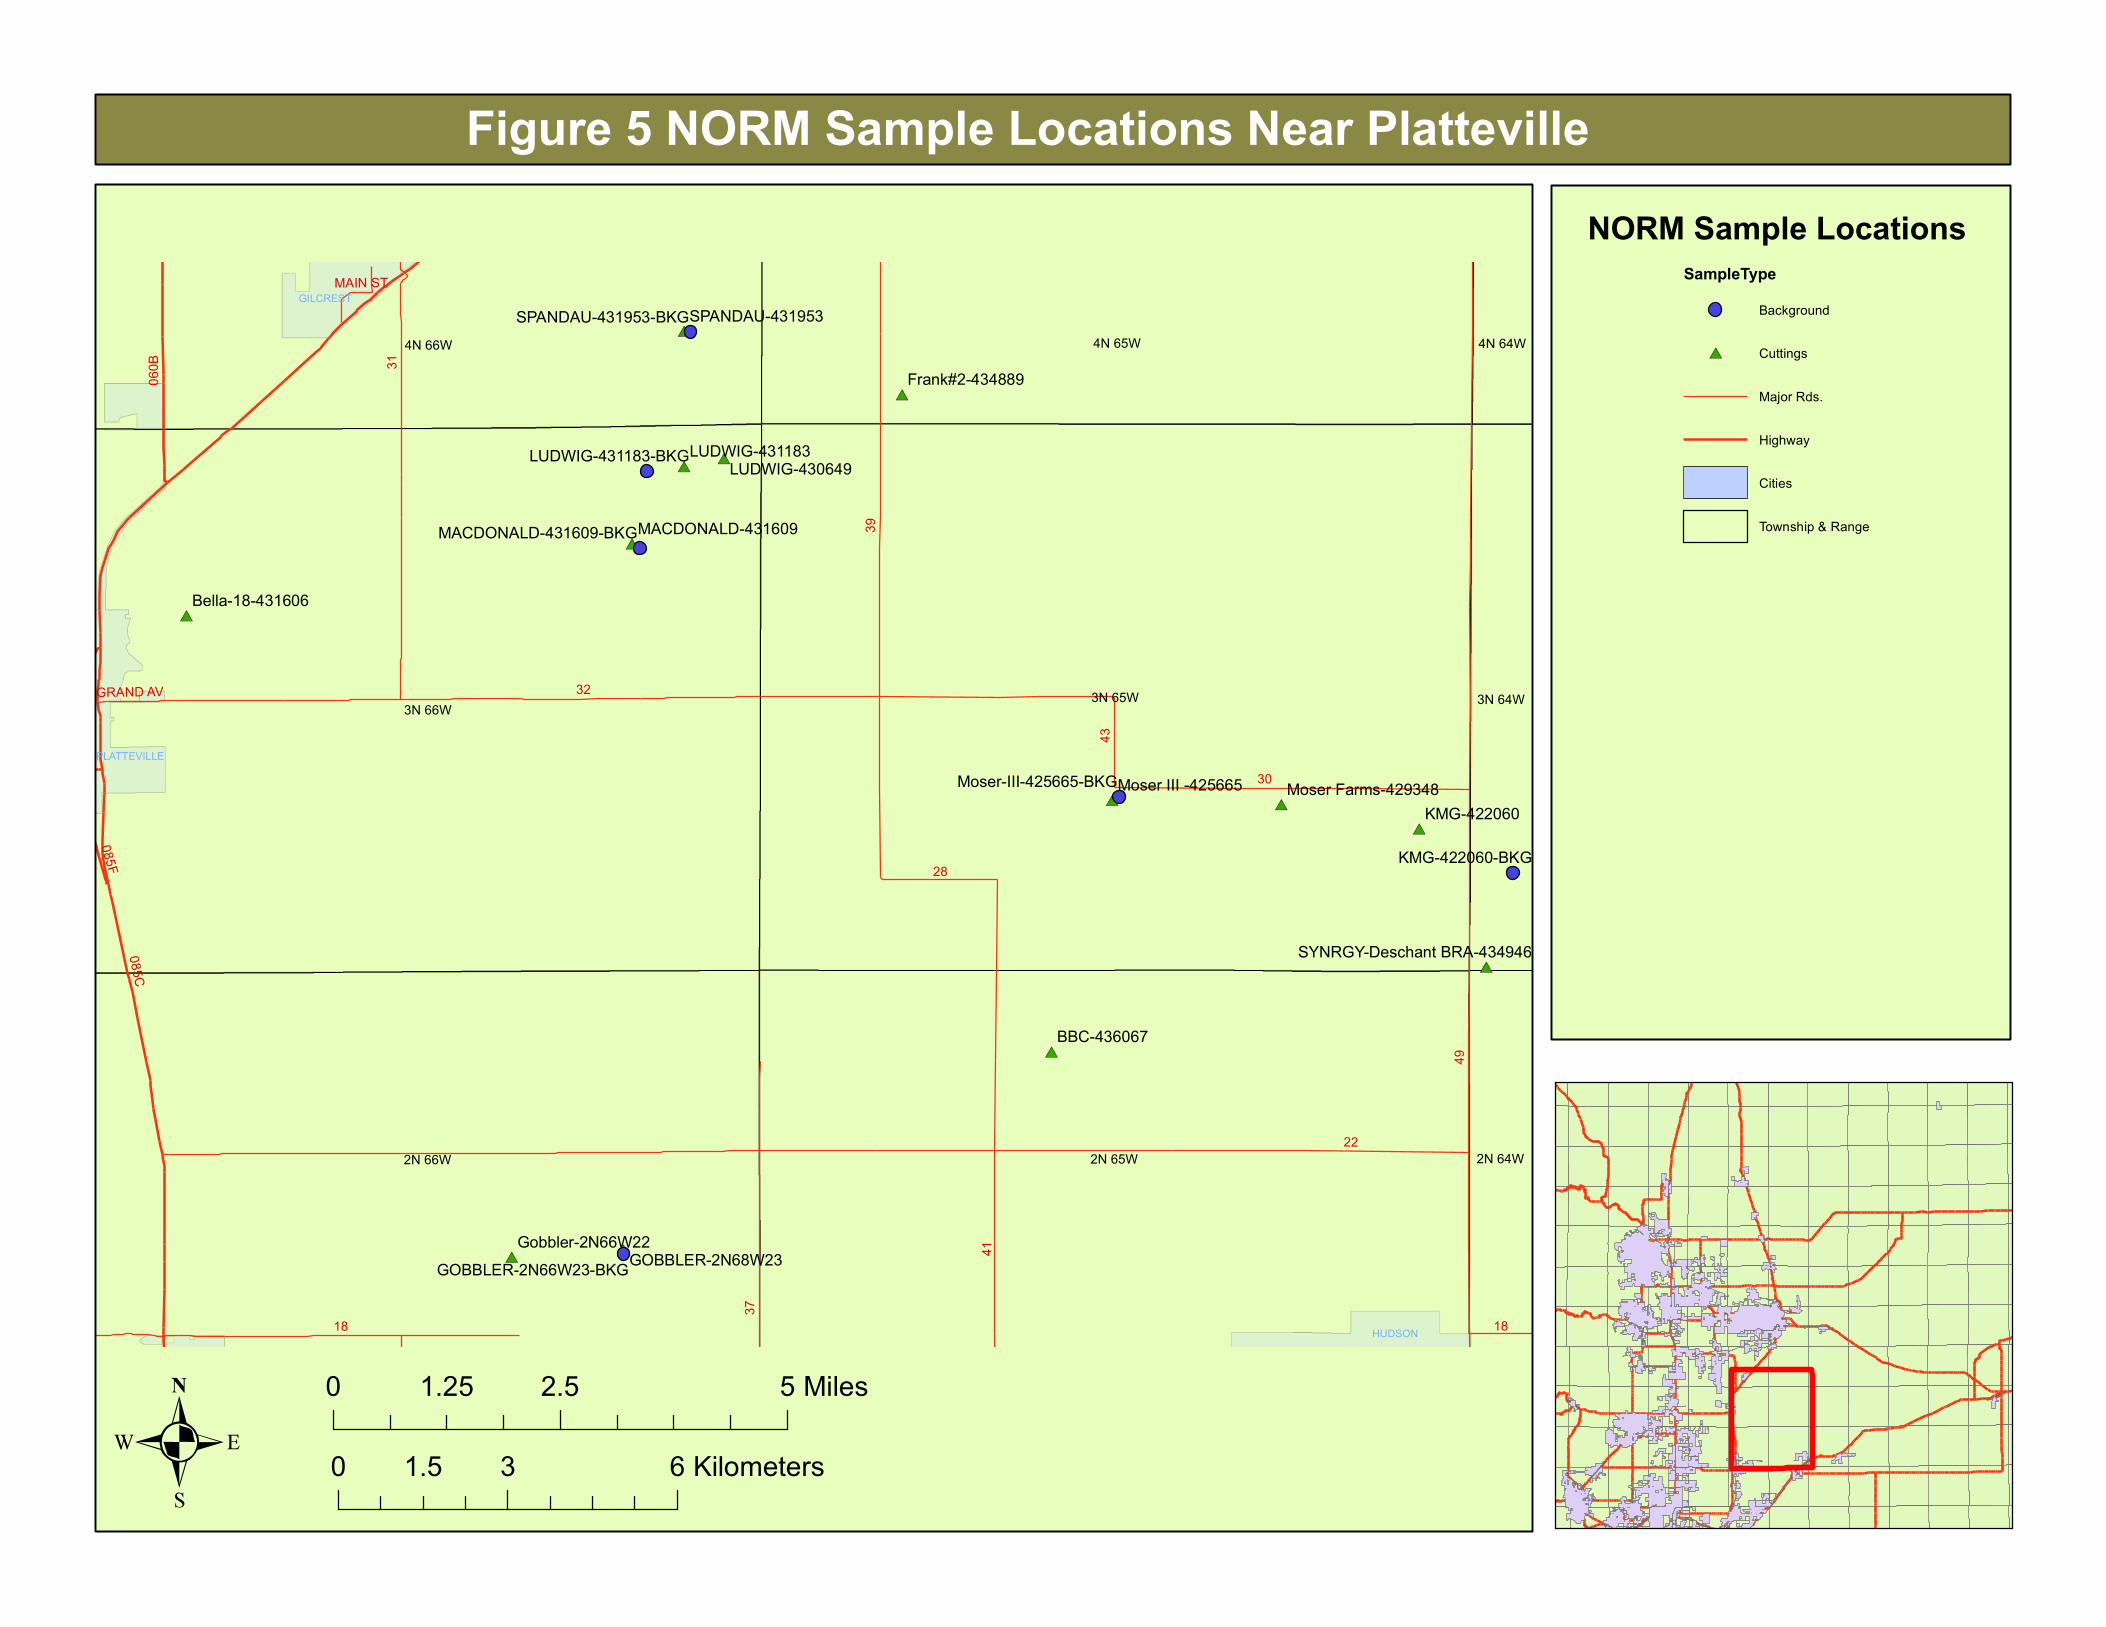
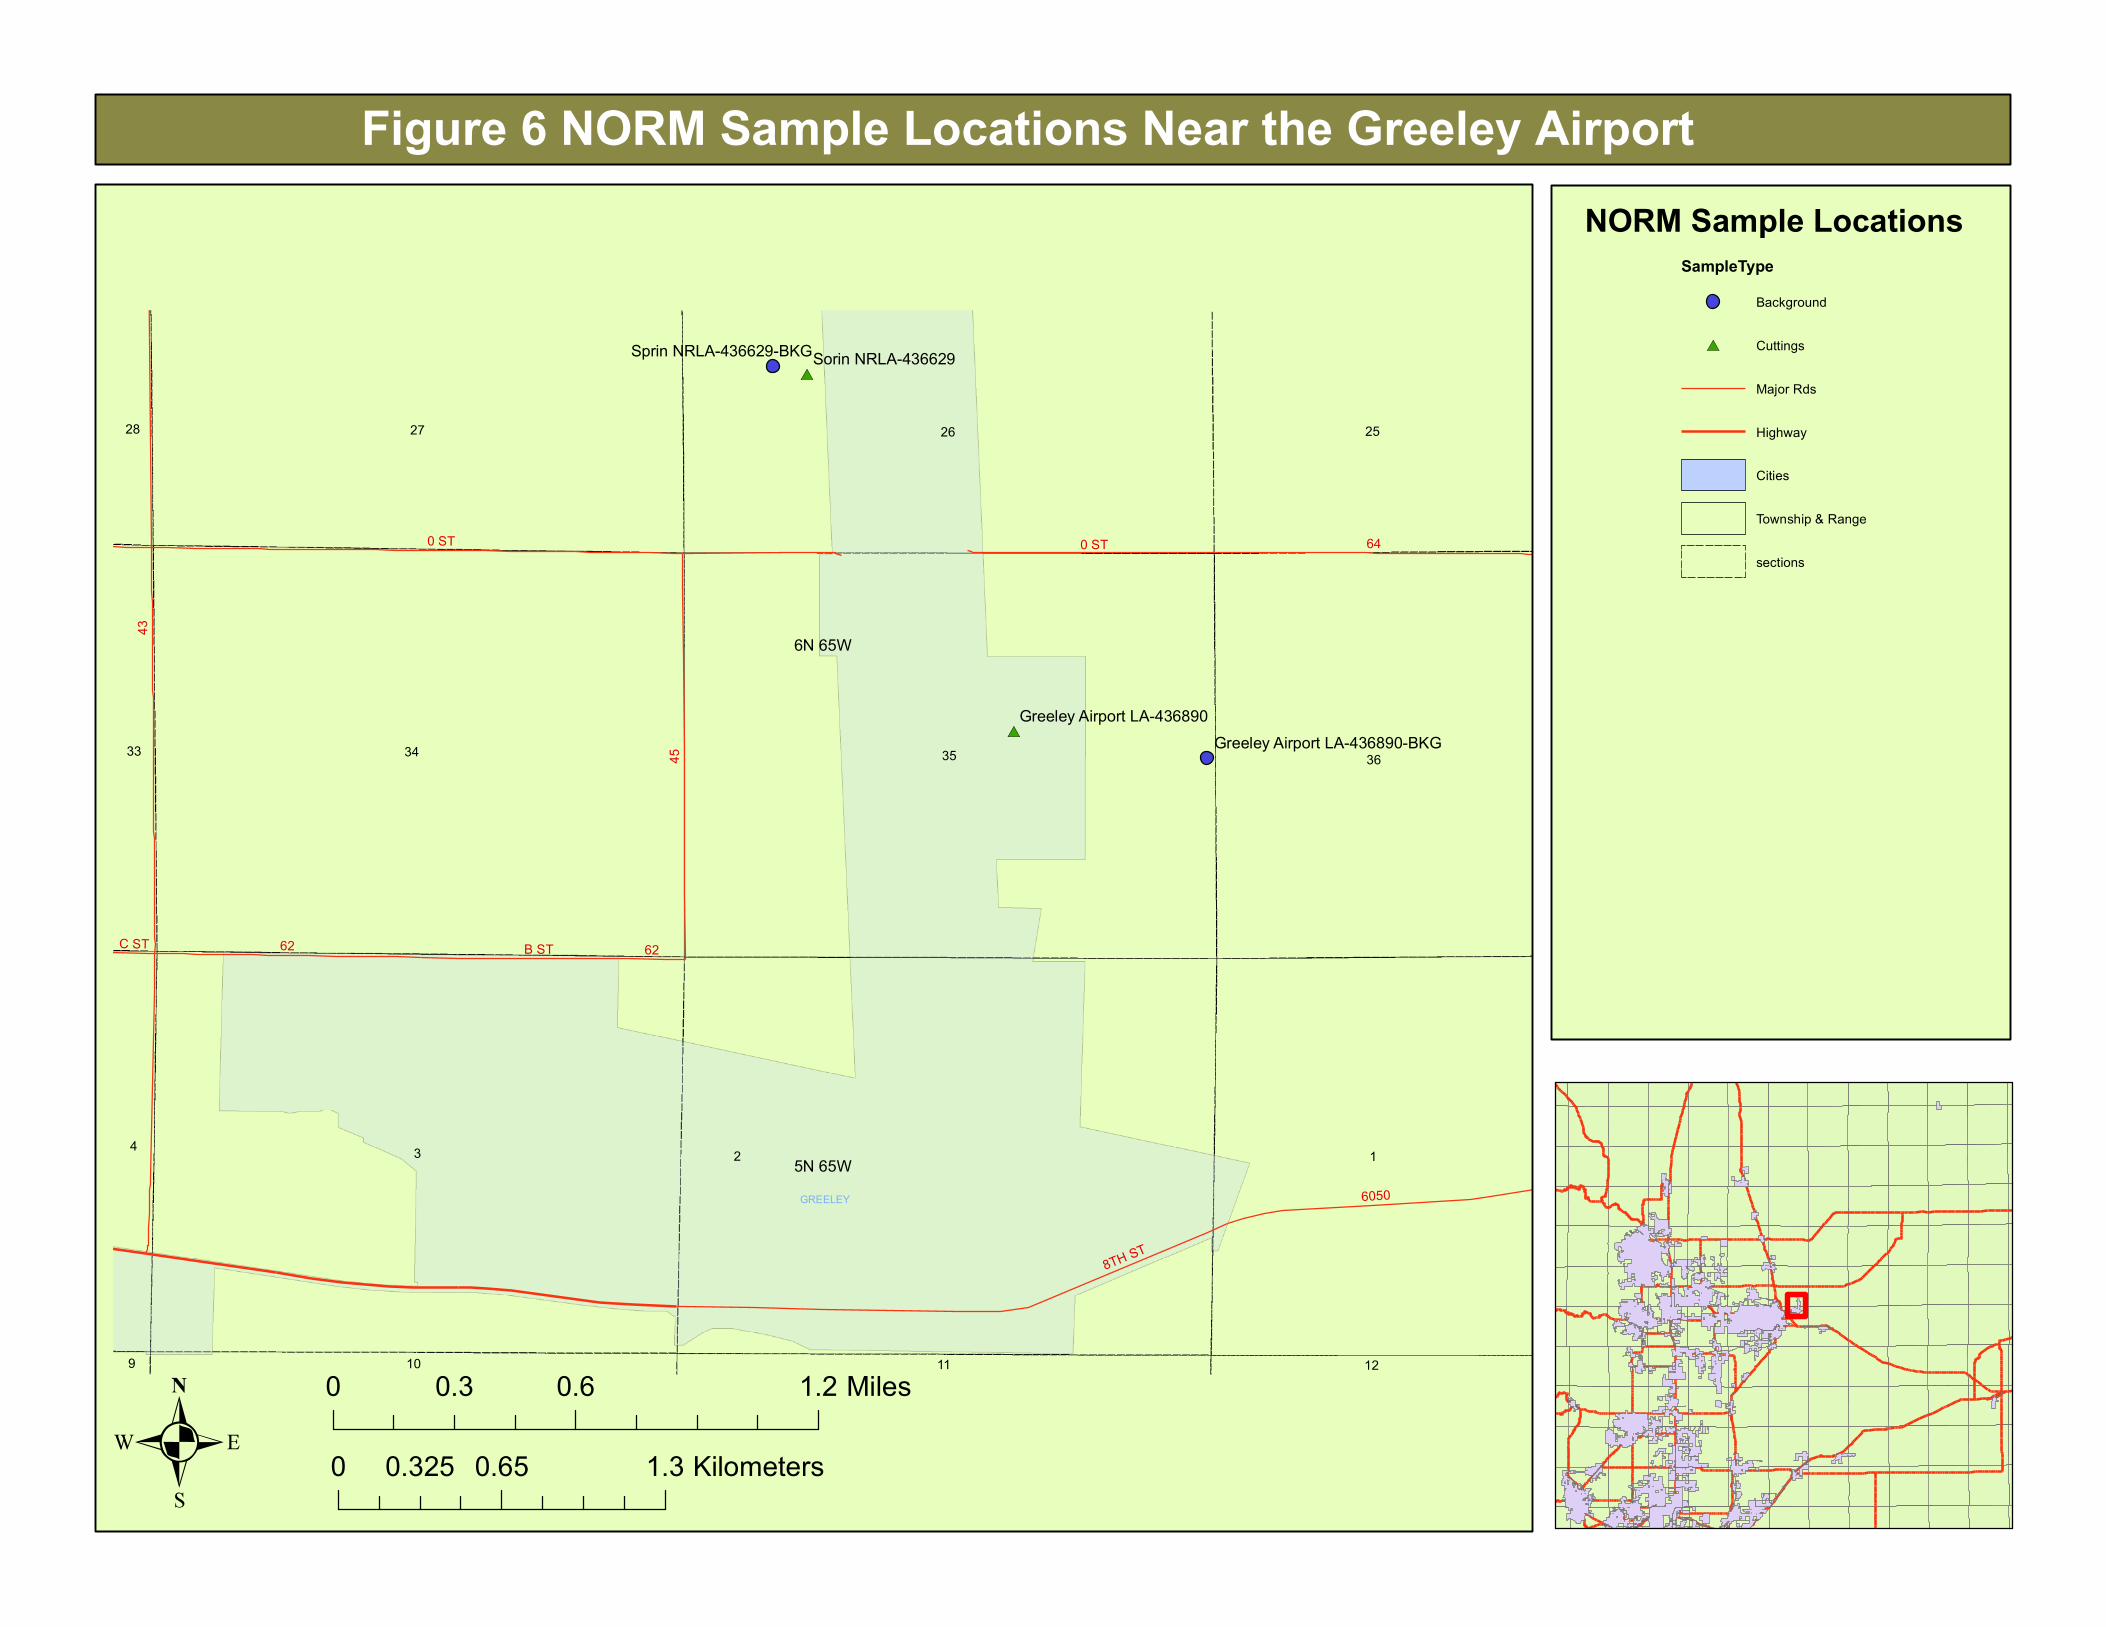
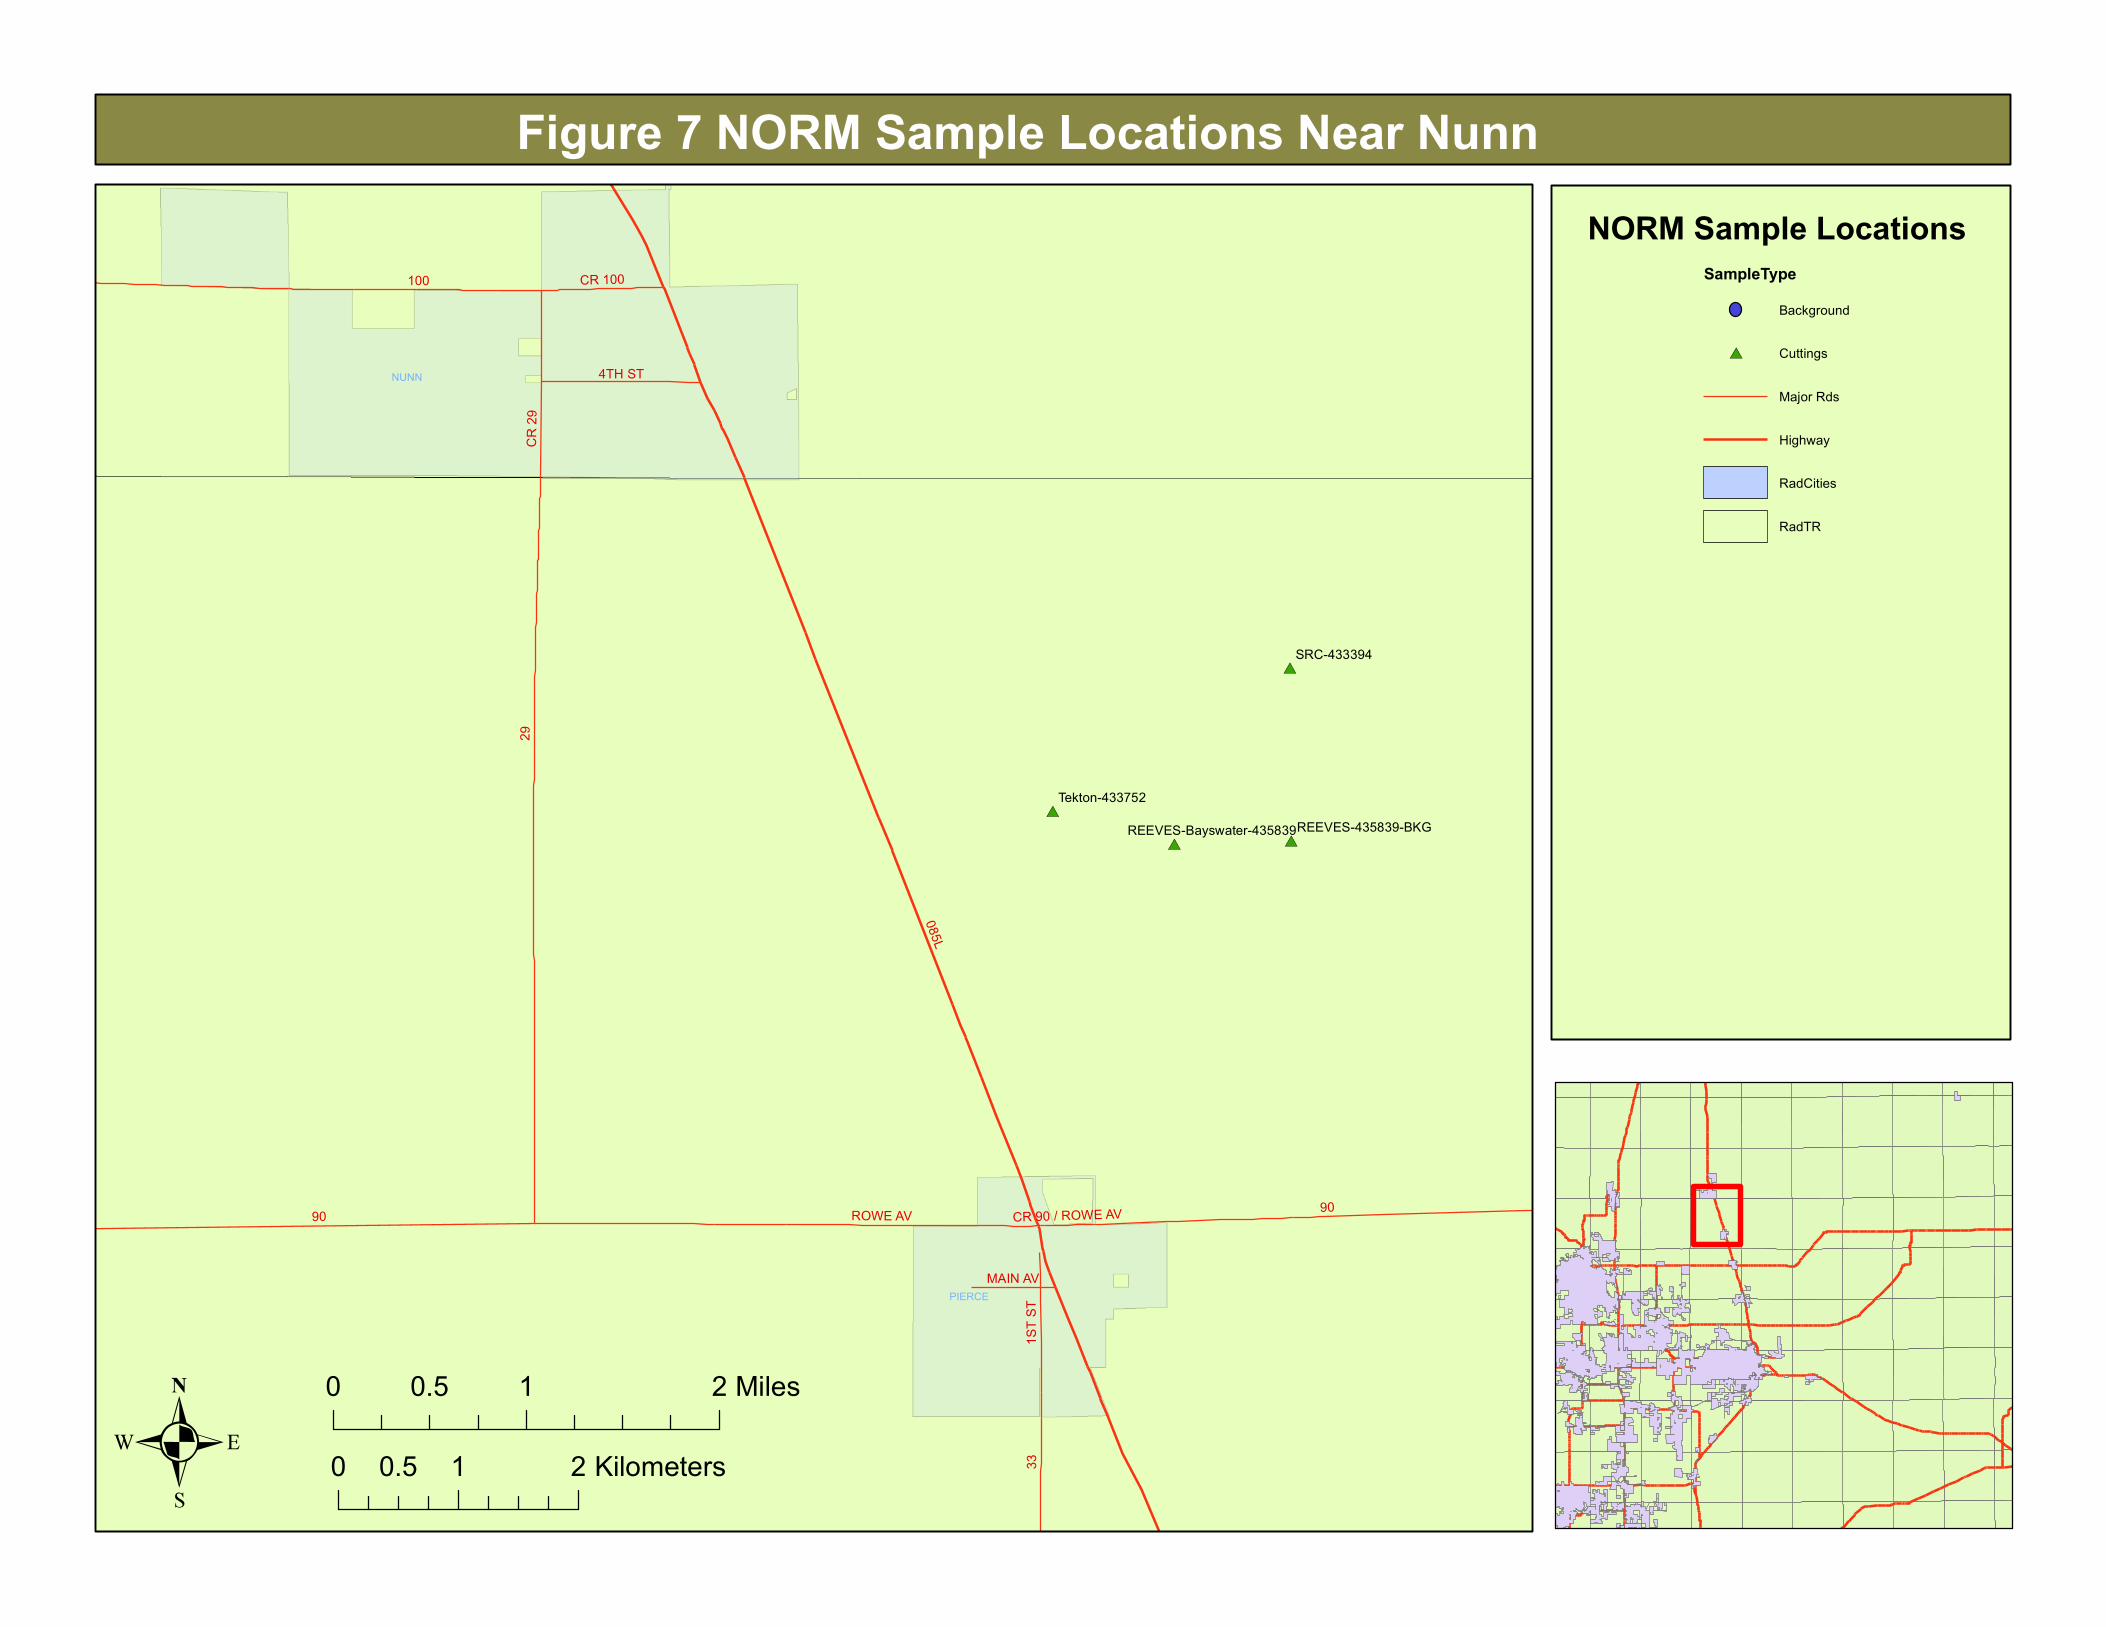
COGCC staff collected 12 samples of drill cuttings, 12 samples of soils with incorporated drill
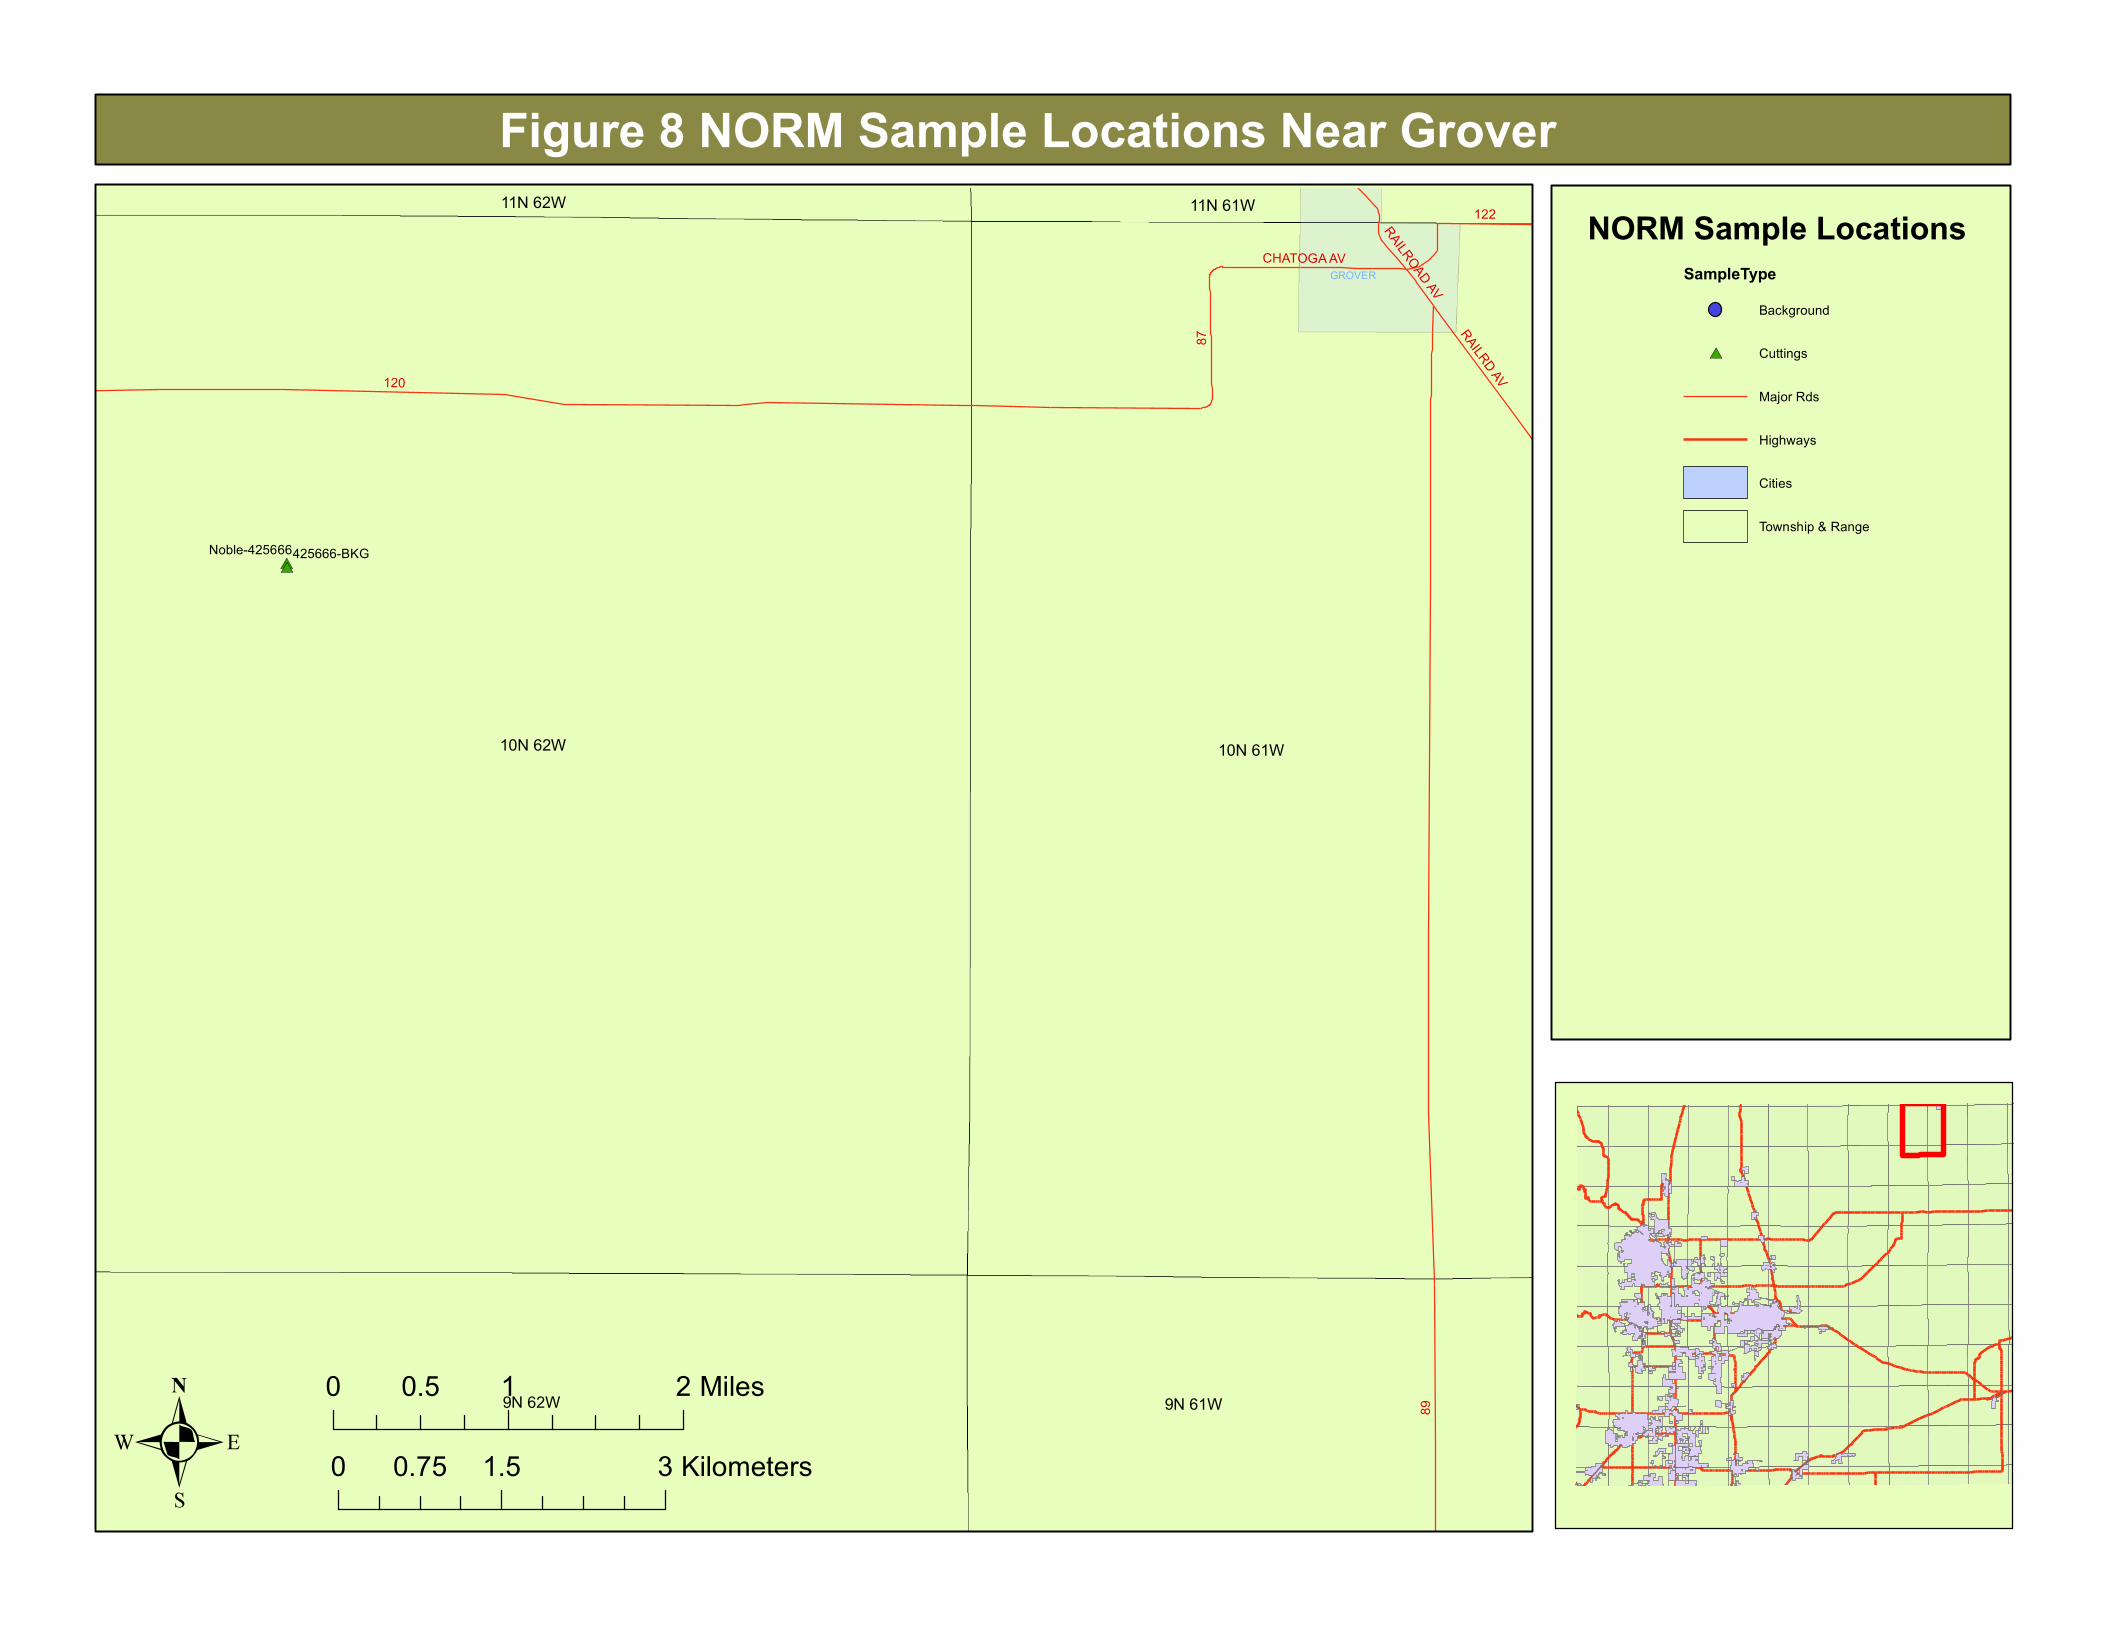
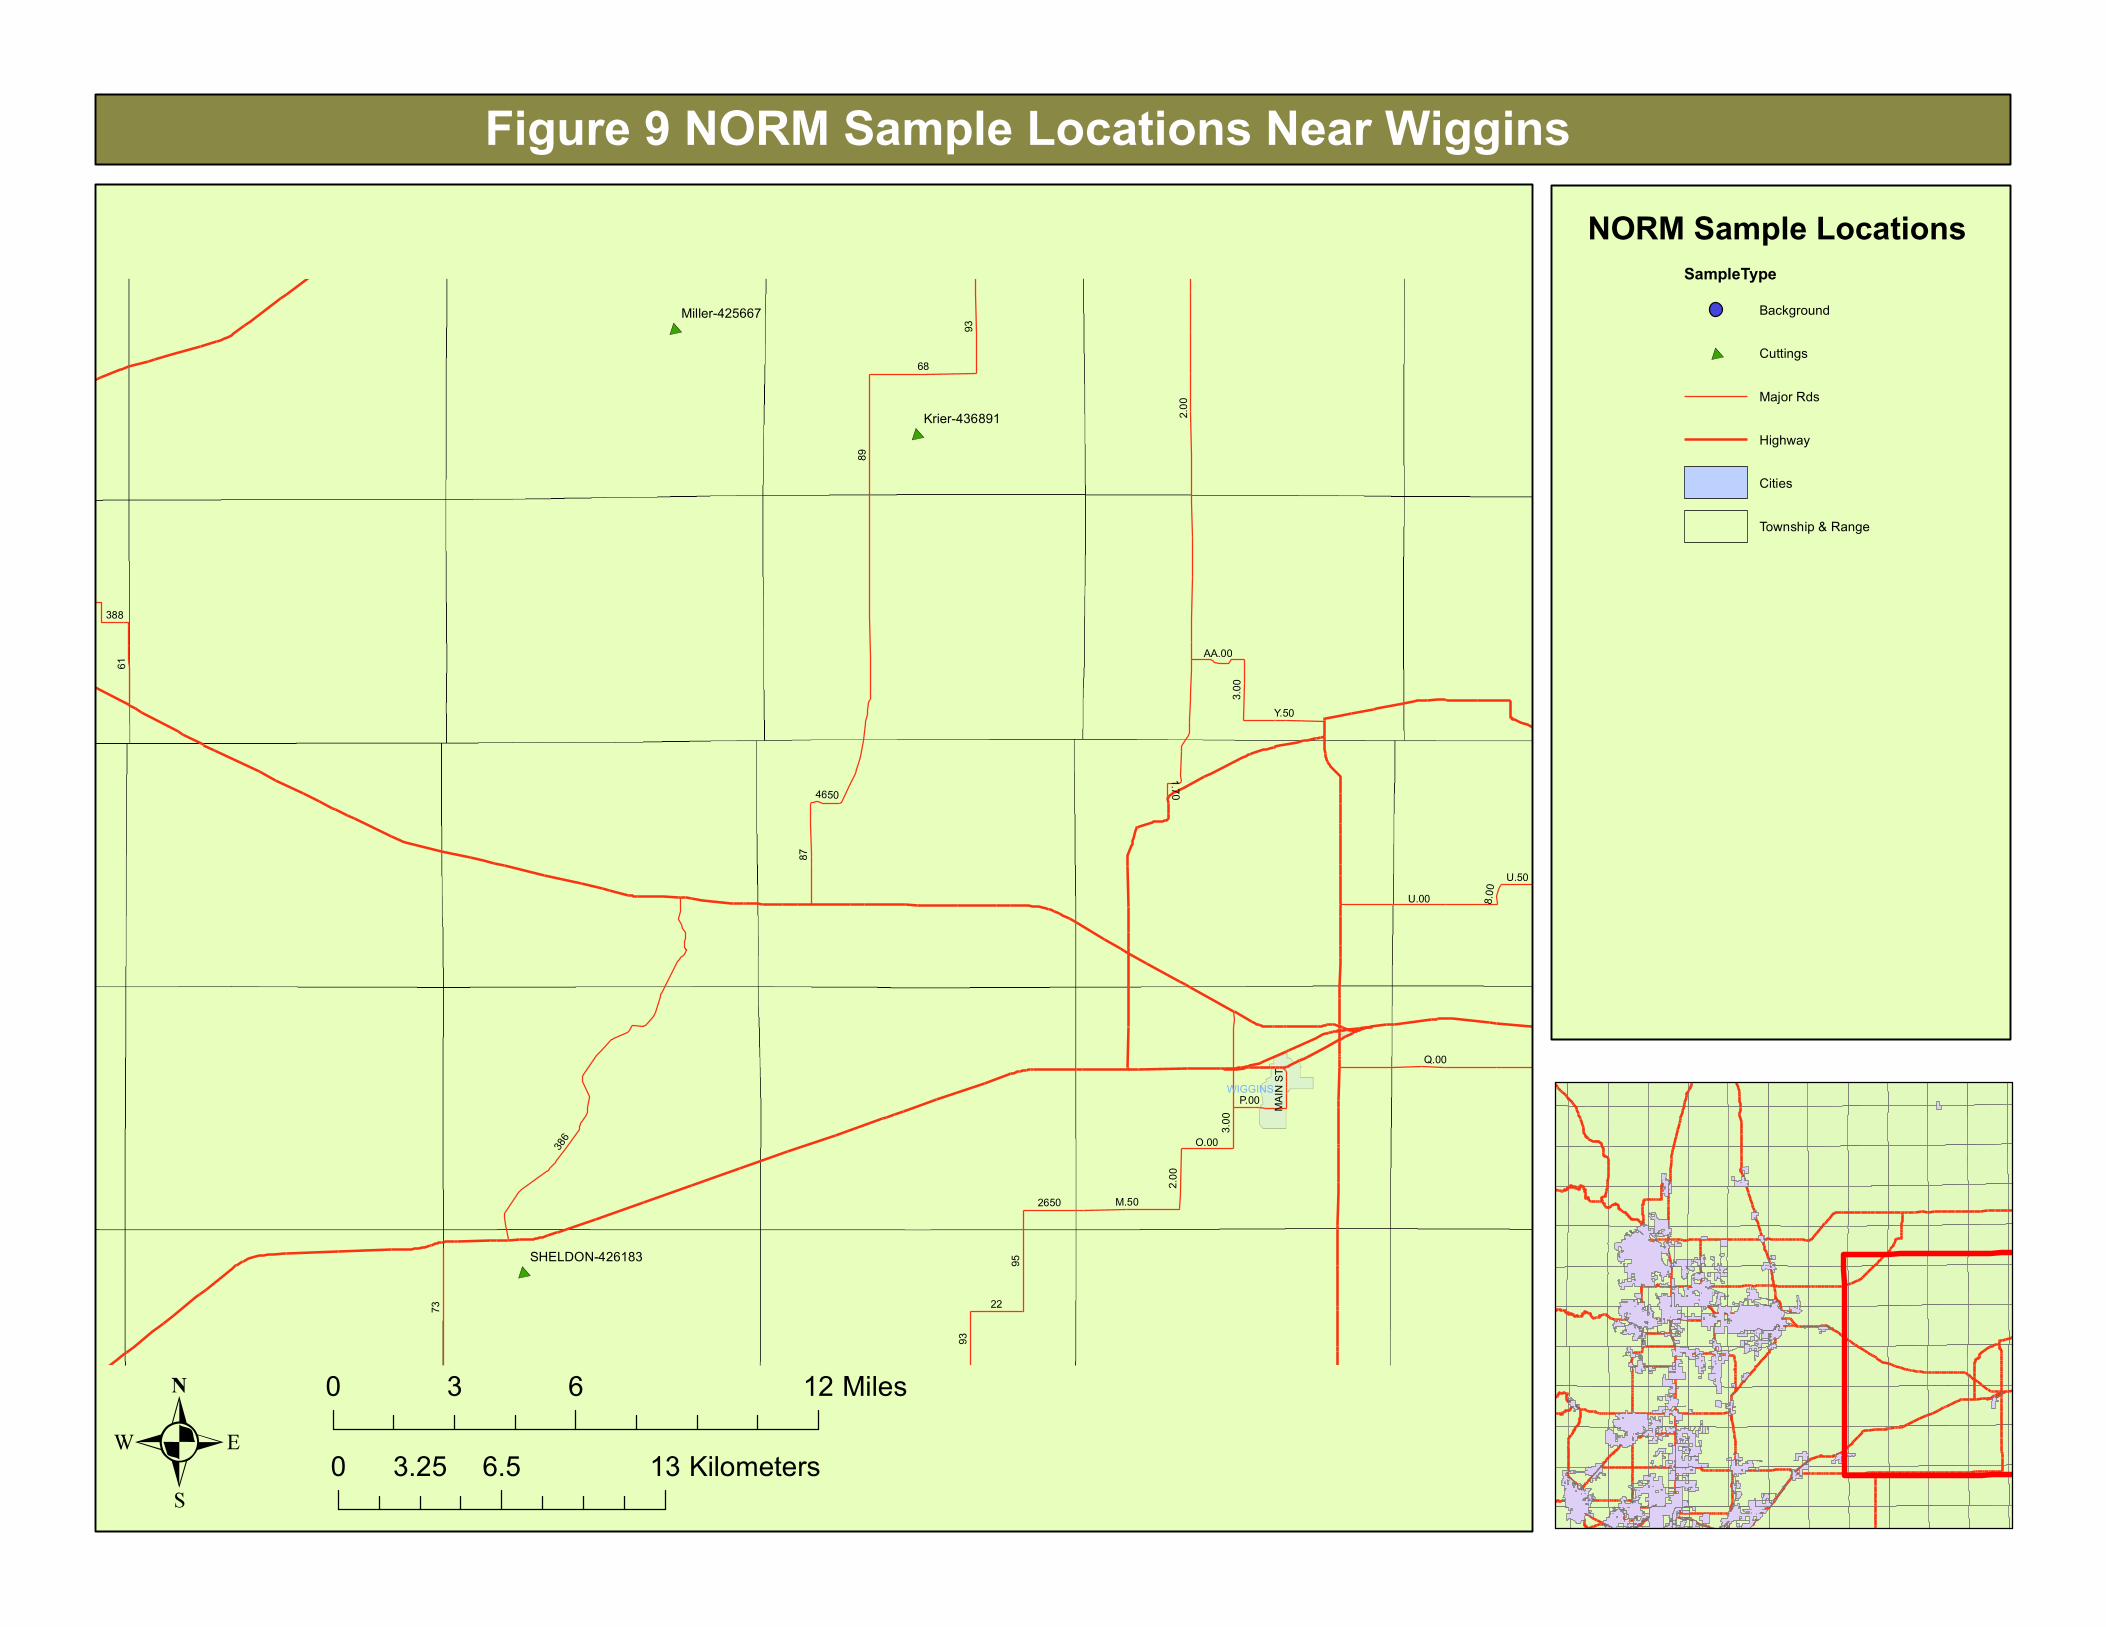
cuttings, and 12 background soil samples at location shown on Figures 3 through 9. Where
samples were collected post-incorporation, an appropriate background location was selected
and sampled. Where cuttings were still in storage piles prior to incorporation, a site-specific
background sample was not collected. All sampling and laboratory analyses were conducted
according to procedures described in the Sampling and Analysis Plan for Naturally Occurring
Radioactive Material in Oil and Gas Well Drill Cuttings (COGCC 2014).
FIELD SCREENING
A Ludlum Model 19A Micro-R Meter, a direct reading gamma ray meter, was used for field
screening to identify the possible presence and degree of NORM in cuttings. No instrument
readings above ambient background were recorded for any of the samples collected.
Additionally, radiological screening (sample acceptance protocol) conducted by the laboratory
showed no instrument readings exceeding background for samples received.
Page 6
SPECIAL PROJECT 2136 COGCC
6
ANALYTICAL LABORATORY SAMPLE RESULTS
Laboratory analyses for the NORM Study were conducted by ALS Laboratory Group (ALS) in
Fort Collins, Colorado. Samples were either hand-delivered to the laboratory or shipped via
commercial transporter. Table 1 summarizes the analytical parameters, analyses methods,
sample quantities, and holding times for this study. Table 2 summarizes the detection limits for
the laboratory analyses for this study. Tables 3 through 6 summarize sample results for the
NORM Study and include both radionuclides detected and those that were analyzed but were
not detected.
The following description of radiochemical analysis is summarized and excerpted from
Consolvo and Sukpsky’s Radiological Lab Results Don’t Have to Be Confusing (2011).
For radiochemical parameters the amount of energy released through radioactive
decay is measured in units of activity as alpha, beta, or gamma radiation. The decay
rate (disintegrations per minute) is converted to activity based on the Curie (Ci) unit
of activity. Because of the very small radioactivity of environmental samples, the
unit of measure is reported in picoCuries (10-12 Ci) per gram (pCi/g) for solid samples
(this study) or in pCi per liter (pCi/l) for water samples. Unlike most general
analytical chemistry results, which are typically reported down to a minimum
reporting level, radiochemistry results are reported raw and flagged with a “U”
when the activity is less than the requested Method Detectable Concentration
(MDC).
There are two detection-capabilities associated with radionuclide analyses; the
Requested MDC , and the Achieved MDC (reported in the analytical reports for this
study as MDC).
The Requested MDC are a prior calculations that determine, prior to actual sample
analysis, whether a particular measurement system can detect activity to a specific
level, and are used to determine the counting time required to meet a predetermined
minimum detection limit. Lower Limit of Detection (LLD) is the smallest activity
level in a sample that will yield a net count (above system background) that can be
detected with a 95 percent probability. LLD is a calculation that represents the
measurement capabilities of a system. Required Detection Limit (RDL) is the
Page 7
SPECIAL PROJECT 2136 COGCC
7
minimum level to which an analytical method must be able to report to measure
radionuclides. RDL is the concentration that can be counted with a precision of ± 100
percent at the 95 percent confidence level (that is, 1.96 σ, where σ is the standard
deviation in the net counting rate of the sample)
Achieved MDC are a posteriori calculations that, following an actual sample analysis,
determine the minimum detection limit specifically for that analysis. Minimum
Detectable Activity (MDA) is the smallest activity of radioactive material in a sample
that will yield a net count (above sample background) that can be detected with 95
percent probability.
Uncertainty Report Along with a result (activity level) and detection limit, each sample result’s
uncertainty level is reported. A sample’s uncertainty level is a combination of
counting error of the analytical instrument and uncertainty due to statistical effects
in the emission of radiation, and statistical effects in the detection process. In this
report, uncertainty is reported as “±” a value.
Negative Radioactivity Reported sample results are sometimes negative values. When a sample has little
radioactivity, the analytical results should have a normal distribution of positive and
negative results around zero. When a sample result is subtracted from that of the
system’s background and the sample value is less than that background, the result is
a negative value. A negative result indicates that the radionuclide activity in the
sample is low.
Gross Alpha Results
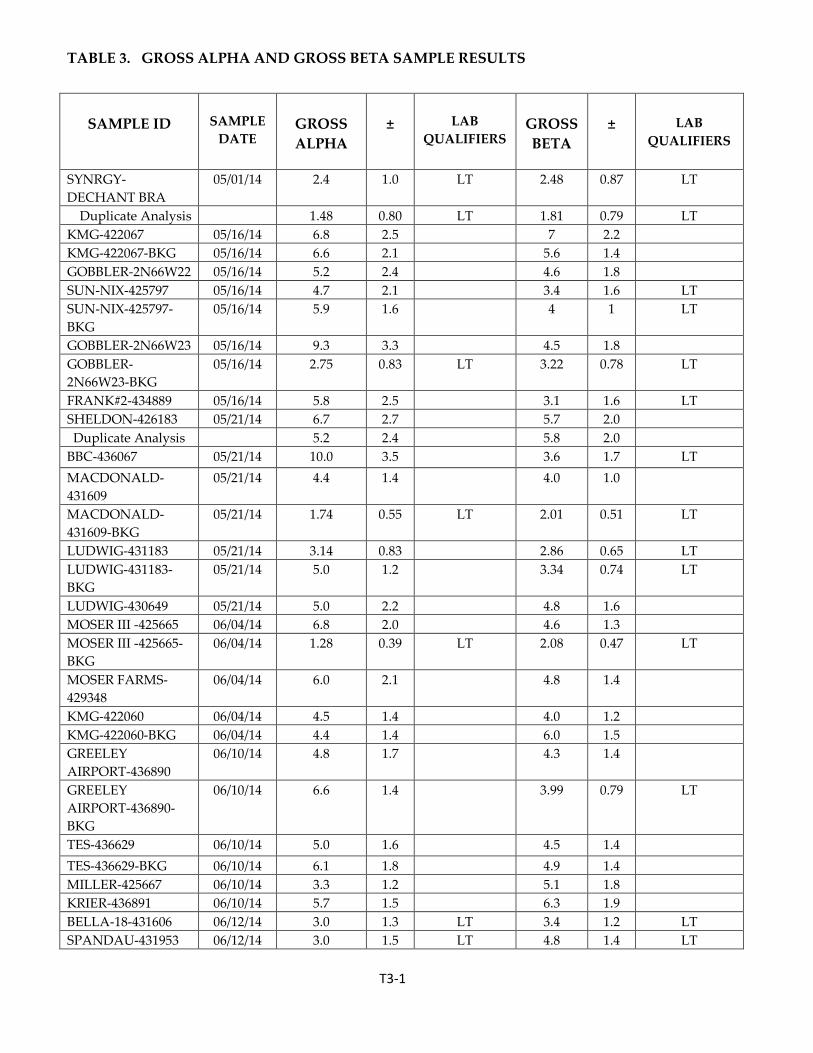
Table 3 provides a summary of the gross alpha analytical results. Gross alpha activities in drill
cuttings ranged between 1.48 ± 0.80 and 10 ± 3.5 picoCuries per gram (pCi/g). The highest gross
alpha activity detected, 10 ± 3.5 pCi/g, occurred in unincorporated cuttings at the BBC-436067
beneficial reuse area. Gross alpha activities in background samples ranged between 1.28 ± 0.39
pCi/g and 6.6 ± 1.4 pCi/g. The highest gross alpha activities occurred in sample GREELEY
AIRPORT-436890-BKG.
Page 8
SPECIAL PROJECT 2136 COGCC
8
The gross alpha activity detected is related to naturally occurring alpha-emitting radionuclides,
primarily Uranium-238 (238U), Thorium-232 (232Th), and their daughter products present in
surface soils and subsurface rocks.
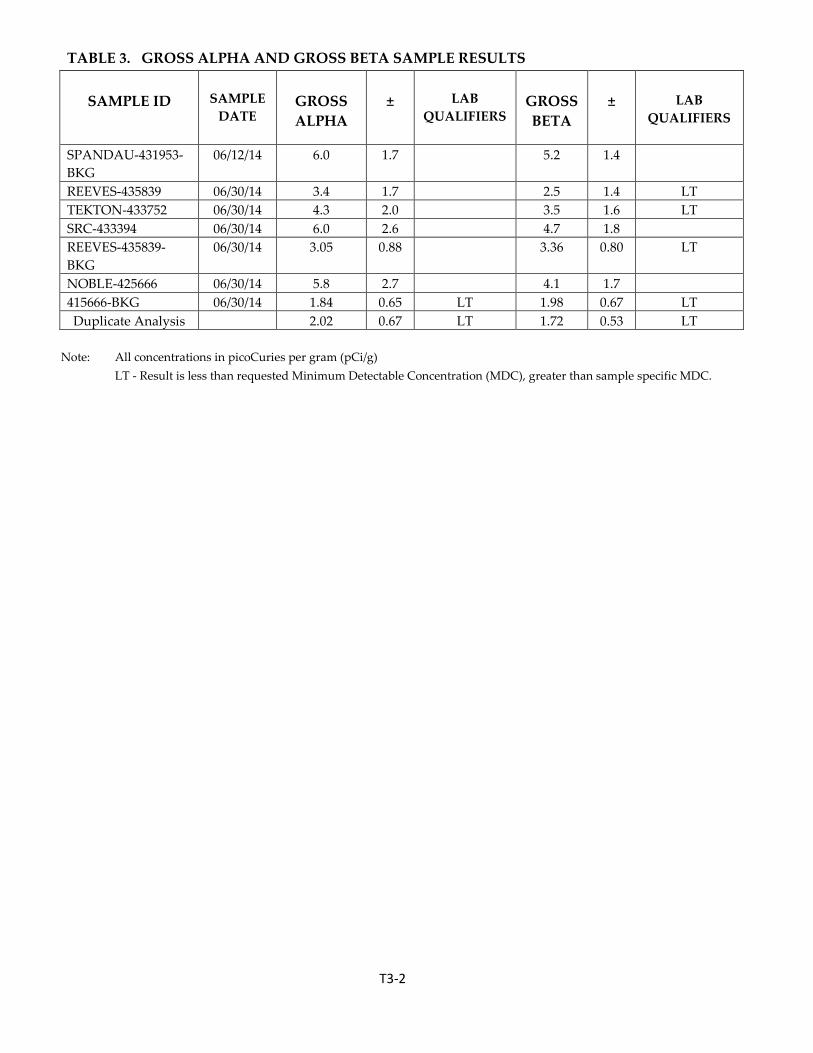
Gross Beta Results
Table 3 presents a summary of the gross beta analytical results. Gross beta activities in drill
cuttings ranged between 1.81 ± 0.79 and 6.3 ± 1.9 pCi/g. The highest gross beta activity detected
occurred in incorporated cuttings at the KRIER-436891 beneficial reuse area. Gross beta
activities in background samples ranged between 1.98 ± 0.57 pCi/g and 5.2 ± 1.4 pCi/g. The
highest gross beta activities occurred in background sample SPANDAU-431953-BKG.
The gross beta activity detected is related to naturally occurring potassium-40 (40K) in surface
soils and subsurface rocks. 40K is one of the most abundant naturally occurring radionuclides
and primarily occurs in clay and mica minerals that compose both the surface soils and shales
found in the subsurface.
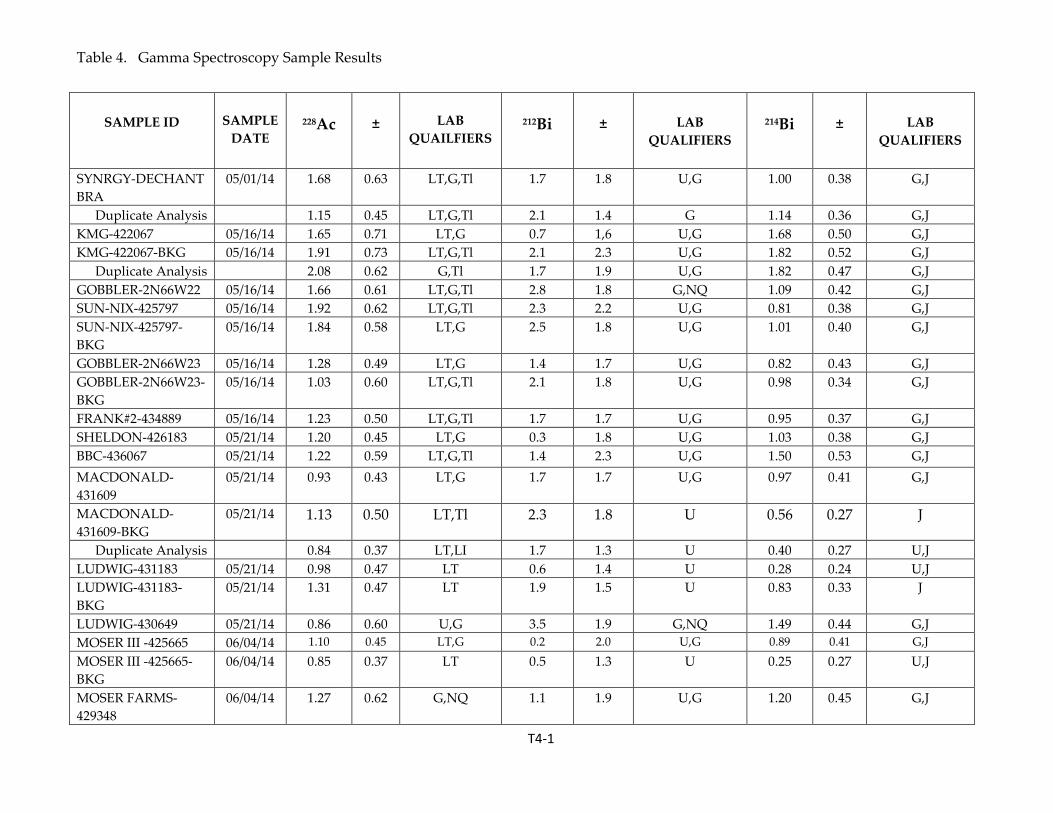
Gamma-Emitting Radionuclide Results
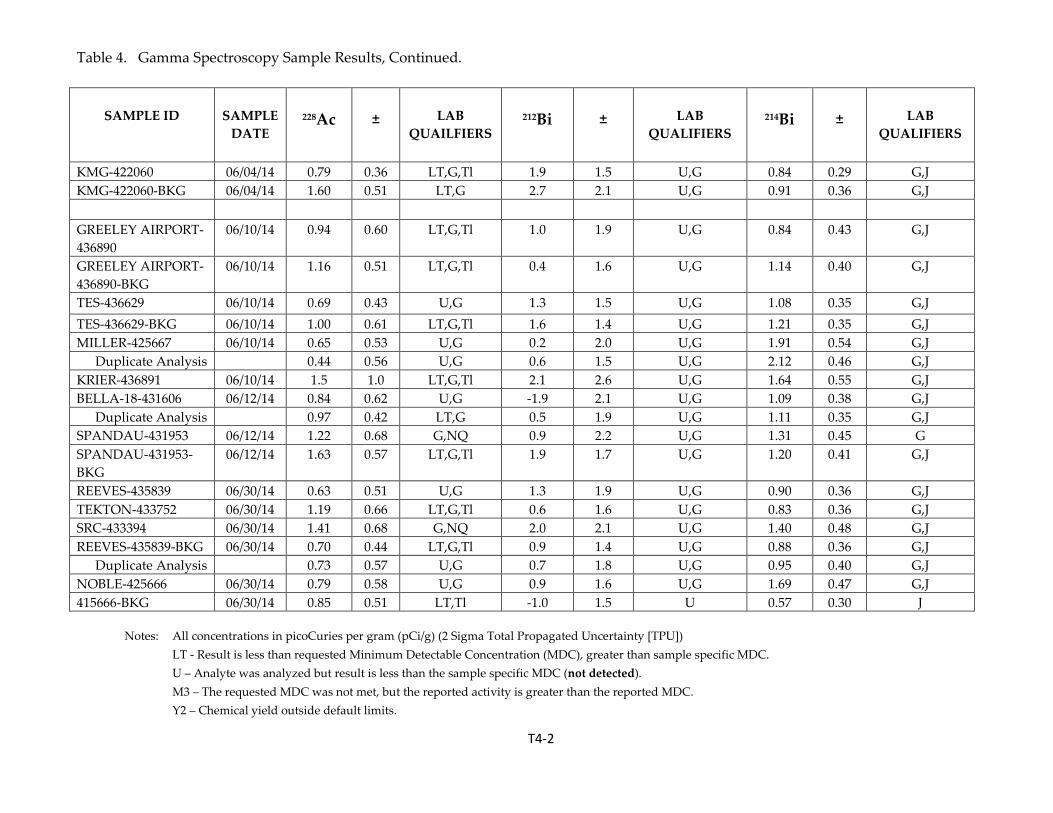
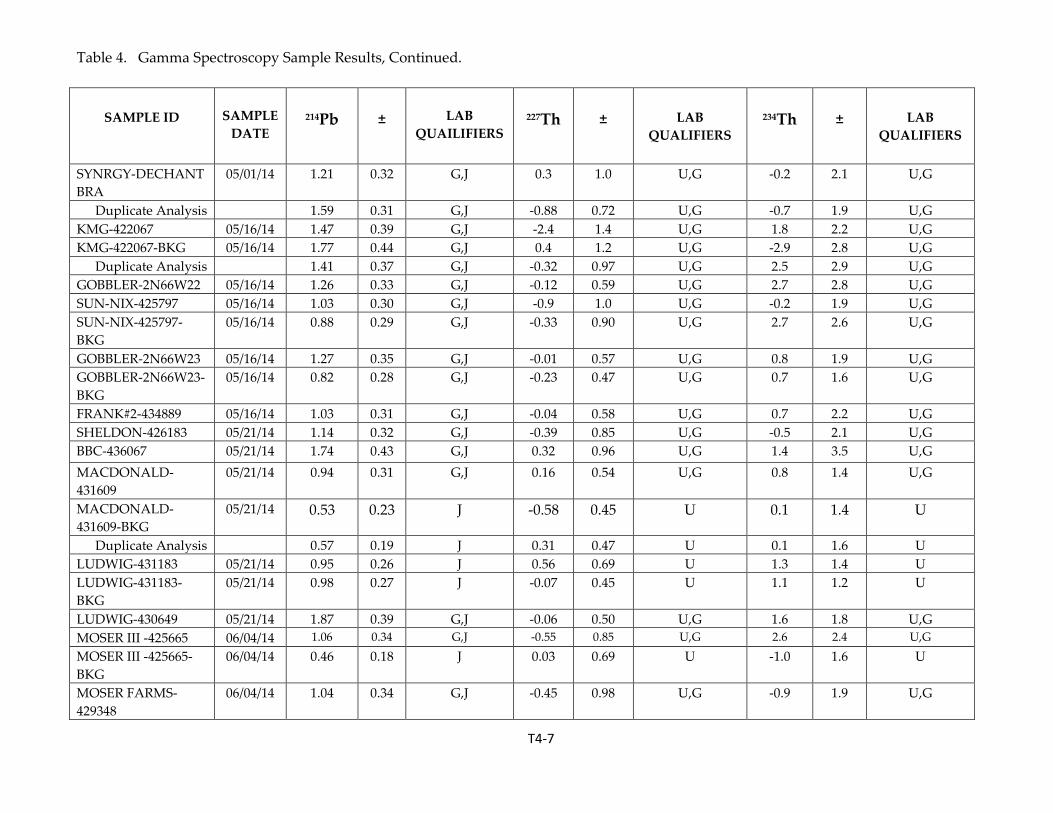
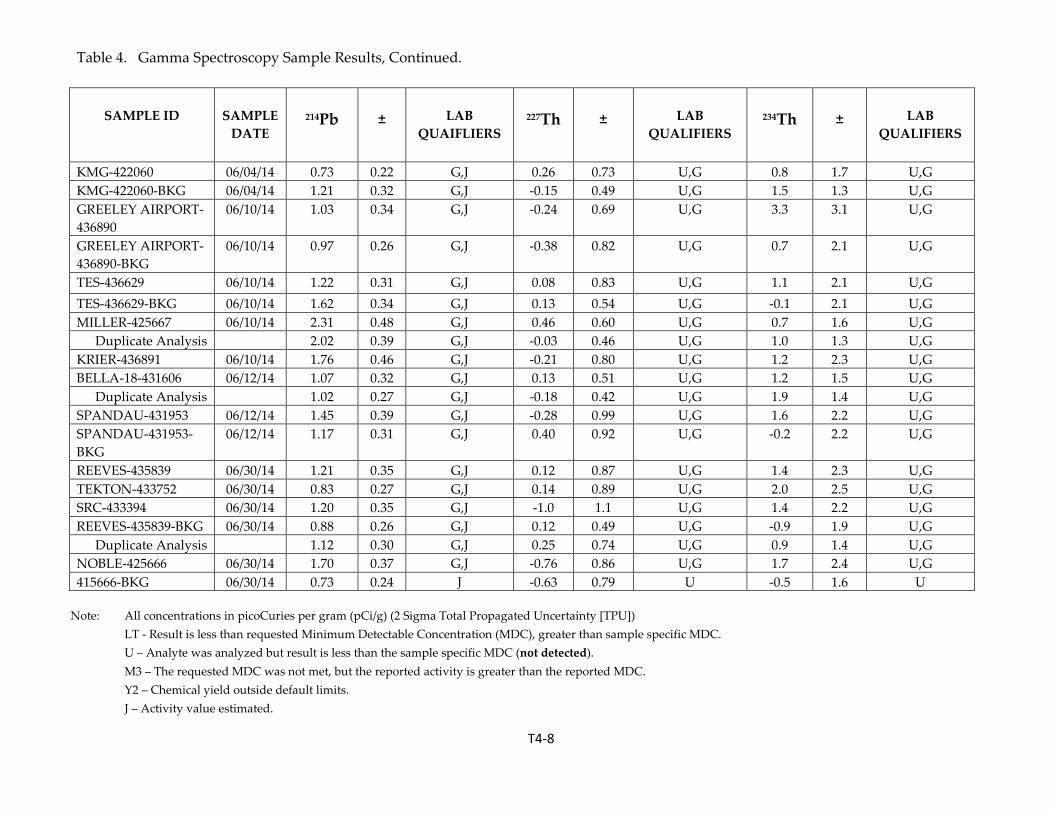
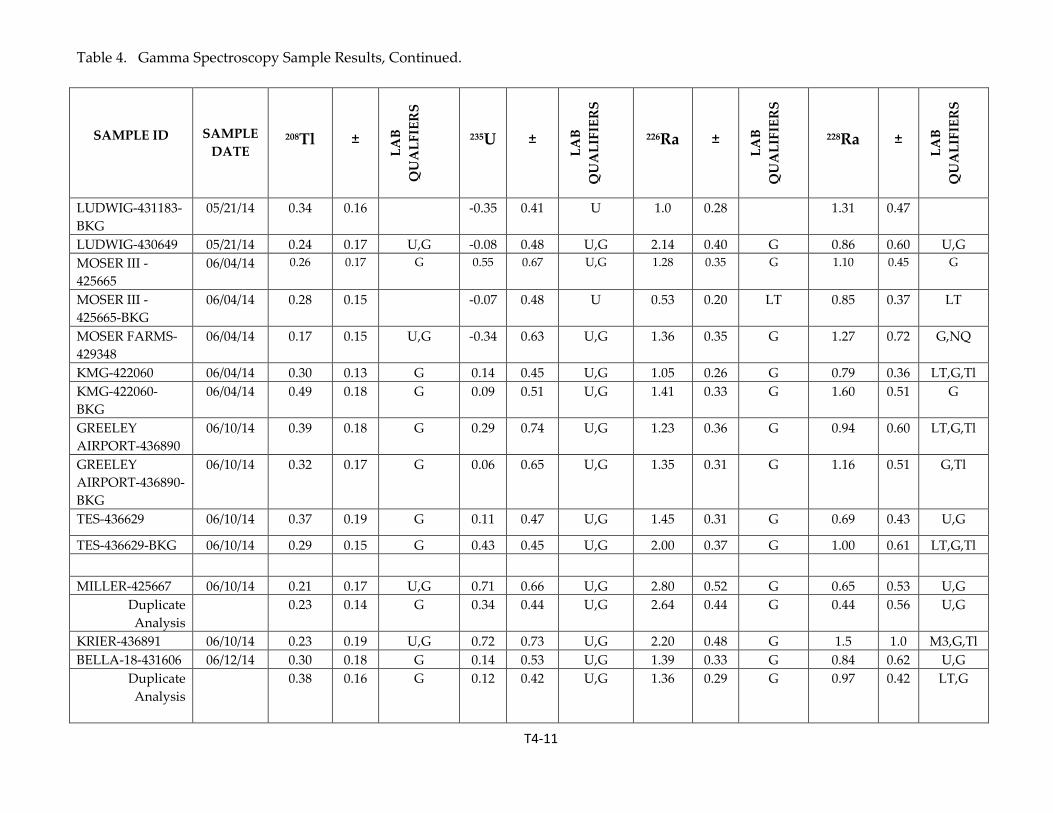
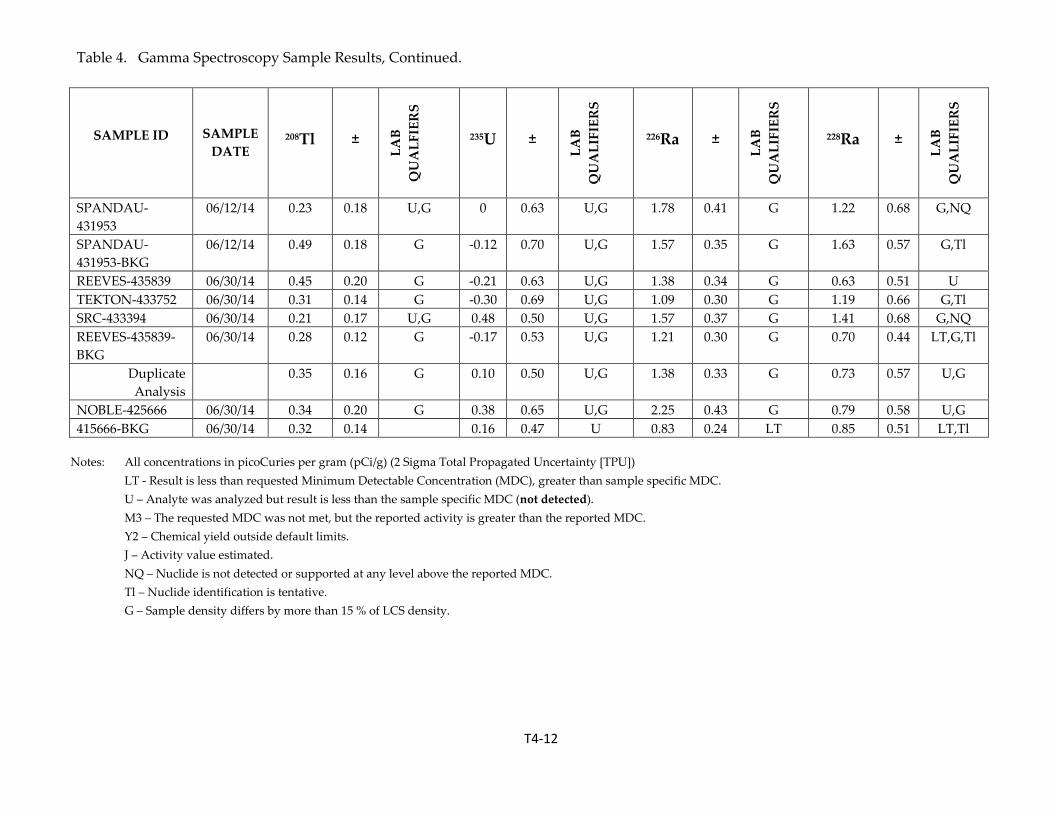
Table 4 provides a summary of the gamma-emitting radionuclide results. Naturally occurring
radionuclides detected include actinium-228 (228Ac), bismuth-212 (212Bi), bismuth-214 (214Bi),
potassium-40 (40K), lead-212 (212Pb), lead-214 (214Pb), thallium-208 (208Tl), radium-226 (226Ra), and
radium-228 (228Ra). Gamma-emitting radionuclides not detected include protactinium-234m
(234mPa), thorium-227 (227Th), thorium-234 (234Th), and uranium-235 (235U).
Actinium-228 activities in cuttings ranged from not detected to 1.92 ± 0.62 pCi/g with the
highest activities occurring in sample SUN-NIX-425797. 228Ac activities in background sample
ranged from not detected to 2.08 ± 0.62 pCi/g, with the highest activities occurring in sample
KMG-422067-BKG (duplicate analysis).
Actinium-228 (228Ac)
Bismuth-212 activities in cuttings ranged from not detected to 3.5 ± 1.9 pCi/g, with the highest
activities occurring in sample LUDWIG-430649. 212Bi was not detected in any of the background
samples.
Bismuth-212 (212Bi)
Page 9
SPECIAL PROJECT 2136 COGCC
9
Bismuth-214 activities in cuttings ranged from not detected to 2.12 ± 0.46 pCi/g with the highest
activities occurring in sample MILLER-425667 (duplicate analysis). 214Bi activities in background
samples ranged from not detected to 1.82 ± 0.52 with the highest activities occurring in sample
KMG-422067-BKG.
Bismuth-214(214Bi)
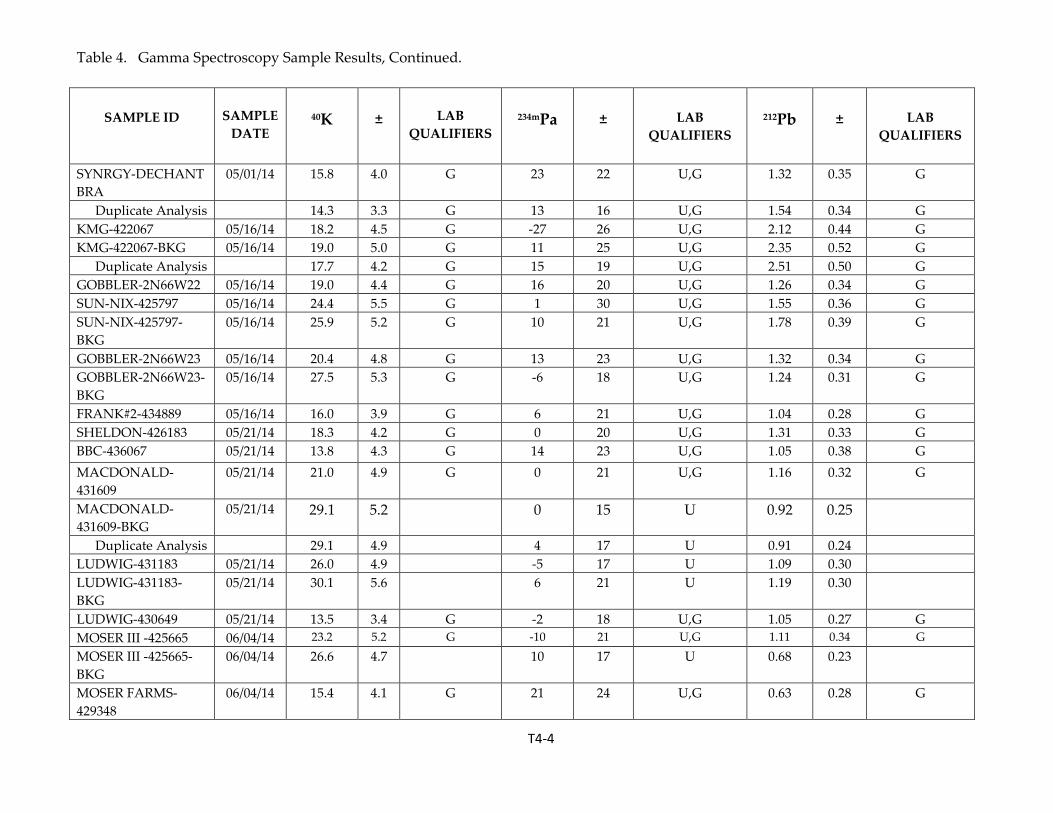
Potassium-40 activities in cuttings ranged from 8.9 ± 2.7 to 26 ± 4.9 pCi/g, with the highest
activities occurring in sample LUDWIG-431183. 40K activities in background samples ranged
from 16.9 ± 3.8 to 30.1 ± 5.6, with the highest activities occurring in sample LUDWIG-431183-
BKG.
Potassium-40 (40K)
Lead-212 activities in cuttings ranged from 0.52 ± 0.23 to 2.12 ± 0.44 pCi/g, with the highest
activities occurring in sample KMG-422067. 212Pb activities in background samples ranged from
0.68 ± 0.23 to 2.35 ± 0.52 pCi/g, with the highest activities occurring in sample KMG-422067-
BKG.
Lead-212 (212Pb)
Lead-214 activities in cuttings ranged from 0.83 ± 0.27 to 2.31 ± 0.48 pCi/g, with the highest
activities occurring in sample MILLER-425667. 214Pb activities in background samples ranged
from 0.46 ± 0.18 to 1.77 ± 0.44 pCi/g, with the highest activities occurring in sample KMG-
422067-BKG.
Lead-214 (214Pb)
Thallium-208 activities in cuttings ranged from not detected to 0.55 ± 0.20 pCi/g, with the
highest activities occurring in sample SUN-NIX-425797. 208Tl activities in background samples
ranged from not detected to 0.81 ± 0.27 pCi/g, with the highest activities occurring in sample
KMG-422067-BKG.
Thallium-208 (208Tl)
Radium-226 activities in cuttings ranged from 0.83 ± 0.24 to 2.80 ± 0.52 pCi/g, with the highest
activities occurring in sample Miller-425667. 226Ra activities in background samples ranged from
0.53 ± 0.2 to 2.29 ± 0.47 pCi/g, with the highest activities occurring in sample KMG-422067-BKG.
Radium-226 (226Ra)
Page 10
SPECIAL PROJECT 2136 COGCC
10
Radium-228 activities in cuttings ranged from not detected to 1.68 ± 0.63 pCi/g, with the highest
activities occurring in sample SYNRGY-DECHANT-BRA. 228Ra activities in background
samples ranged from not detected to 2.08 ± 0.62 pCi/g, with the highest activities occurring in
sample KMG-422067-BKG (duplicate analysis).
Radium-228 (228Ra)
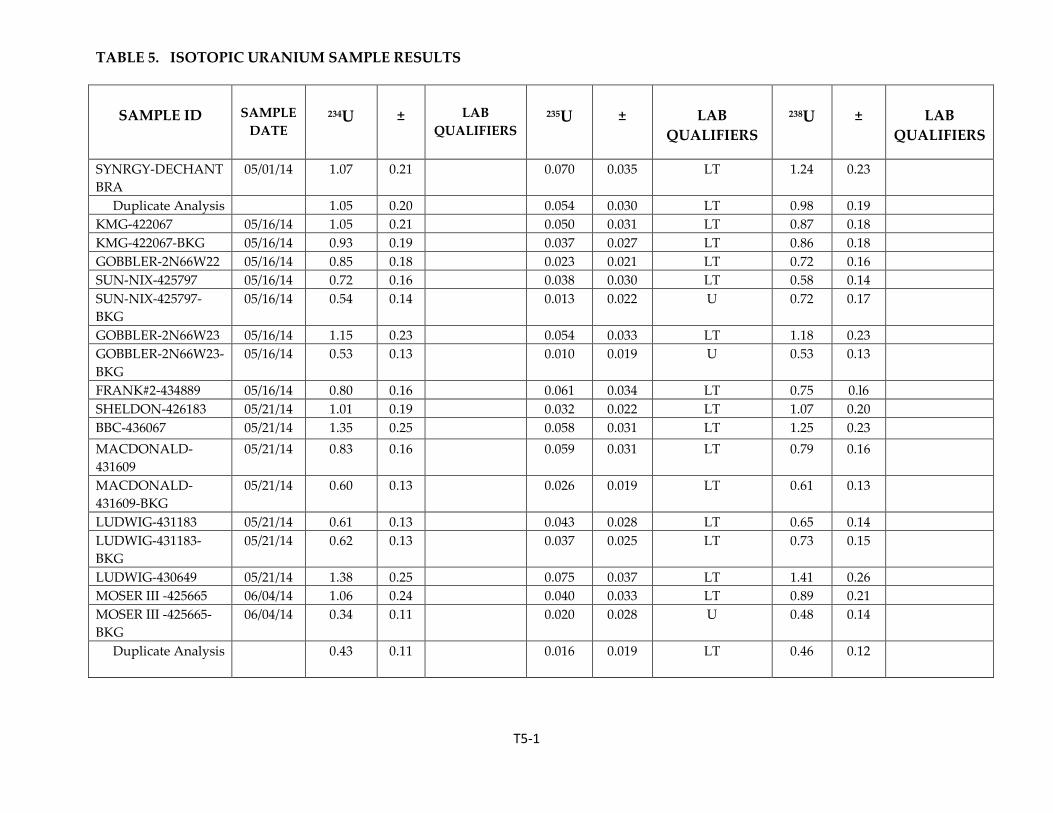
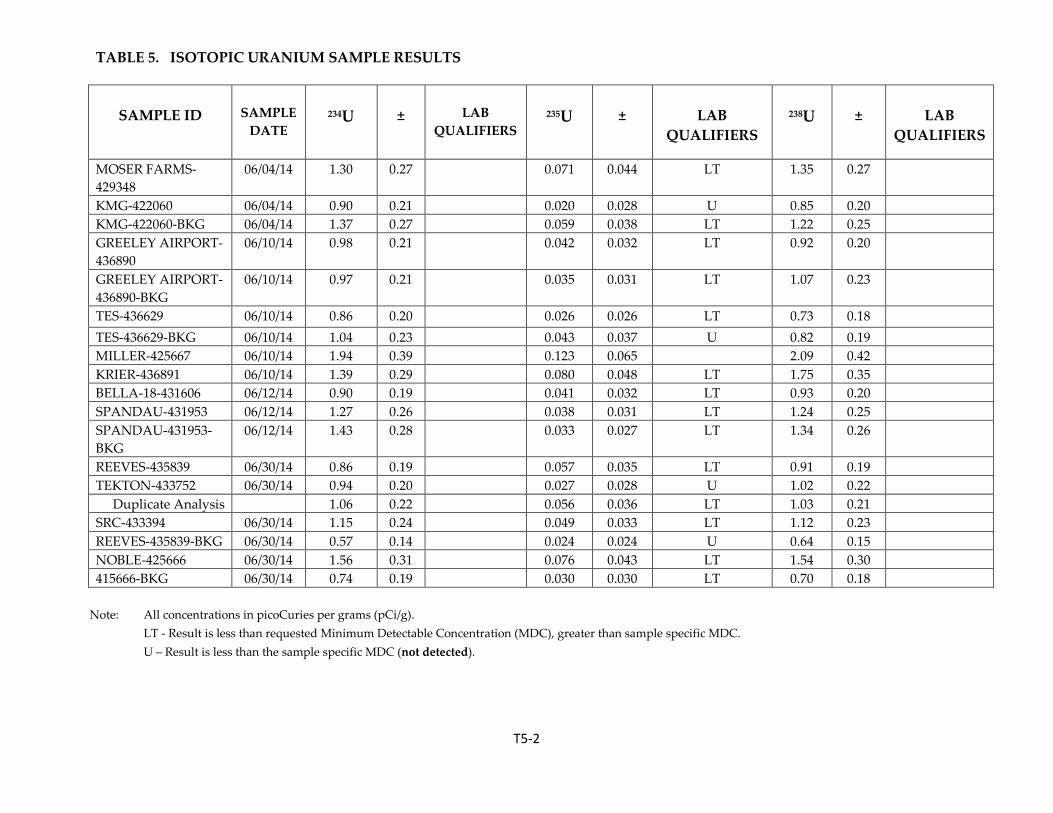
Uranium Isotopic Radionuclide Results
Table 5 provides a summary of the alpha spectroscopy uranium isotopic radionuclide results.
Uranium-234 activities in cuttings ranged from 0.61 ± 0.13 to 1.94 ± 0.39 pCi/g, with the highest
activities occurring in sample MILLER-425667. 234U activities in background samples ranged
from 0.34 ± 0.11 to 1.43 ± 0.28 pCi/g, with the highest activities occurring in sample SPANDAU-
431953-BKG.
Uranium-234 (234U)
Uranium-235 activities in cuttings ranged from not detected to 0.076 ± 0.043 pCi/g, with the
highest activities occurring in sample NOBLE-425666. 235U activities in background samples
ranged from not detected to 0.059 ± 0.038 pCi/g, with the highest activities occurring in sample
KMG-422060-BKG.
Uranium-235 (235U)
Uranium-238 activities in cuttings ranged from 0.58 ± 0.14 to 2.09 ± 0.42 pCi/g, with the highest
activities occurring in sample MILLER-425667. 238U activities in background samples ranged
from 0.46 ± 0.12 to 1.34 ± 0.26 pCi/g, with the highest activities occurring in sample SPANDAU-
431953-BKG.
Uranium-238 (238U)
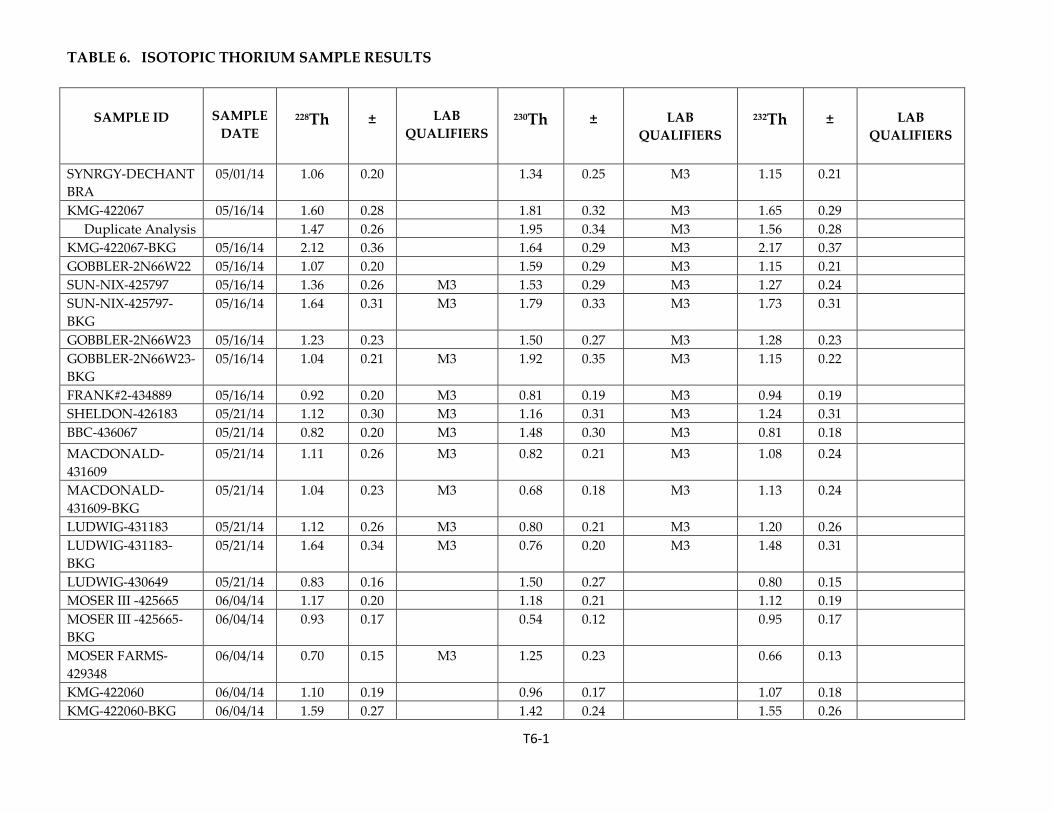
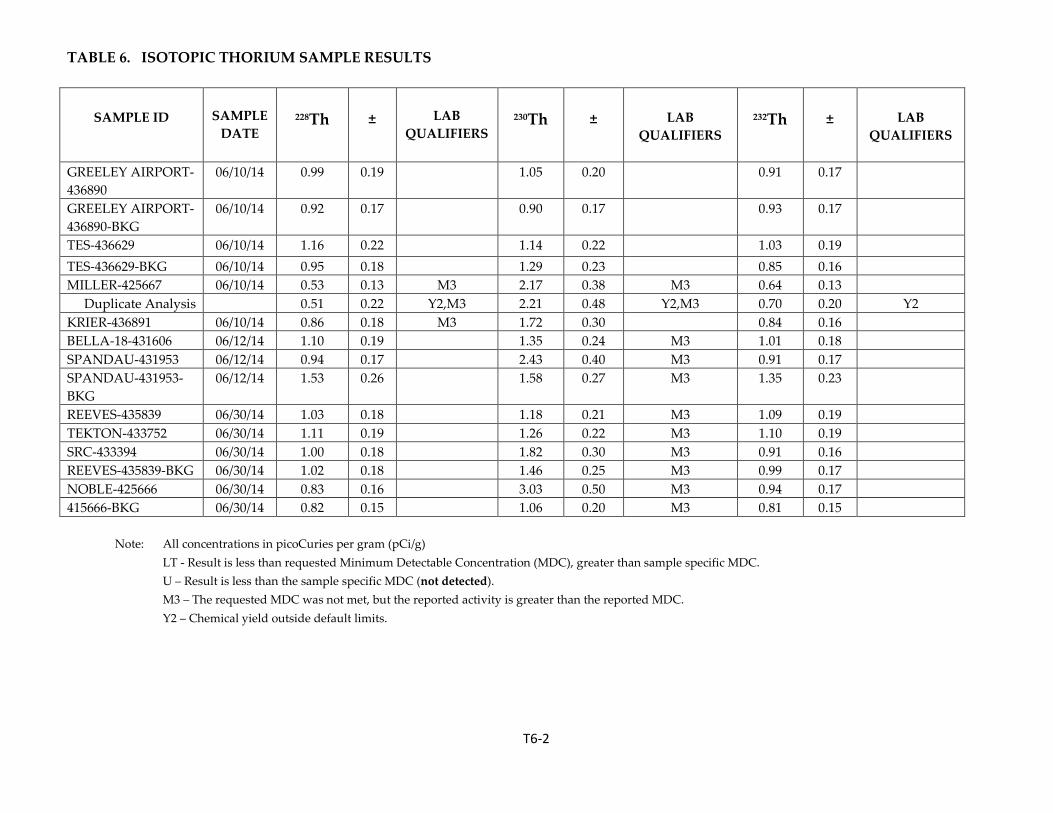
Thorium Isotopic Radionuclide Results
Table 6 provides a summary of the alpha spectroscopy thorium isotopic radionuclide results.
Thorium-228 activities in cuttings ranged from 0.51± 0.22 to 1.60 ± 0.28 pCi/g, with the highest
activities occurring in sample KMG-422067. 238Th activities in background samples ranged from
0.82 ± 0.15 to 2.12 ± 0.36 pCi/g, with the highest activities occurring in sample KMG-422067-
BKG.
Thorium-228 (228Th)
Page 11
SPECIAL PROJECT 2136 COGCC
11
Thorium-230 activities in cuttings ranged from 0.80 ± 0.21 to 3.03 ± 0.50 pCi/g, with the highest
activities occurring in sample NOBLE-425666. 230Th activities in background samples ranged
from 0.54 ± 0.12 to 1.92 ± 0.35 pCi/g, with the highest activities occurring in sample GOBBLER-
2N66W23-BKG.
Thorium-230 (230Th)
Thorium-232 activities in cuttings ranged from 0.64 ± 0.13 to 1.65 ± 0.29 pCi/g, with the highest
activities occurring in sample KMG-422067. 232Th activities in background samples ranged from
0.81±0.15 to 2.17 ± 0.37 pCi/g, with the highest activities occurring in sample KMG-422067-BKG.
Thorium-232 (232Th)
DISCUSSION
The data collected and reviewed for this study shows that NORM activities in cuttings are at
very low activities. No trends are observed in the presence of naturally occurring radionuclides
when comparing drill cuttings, either pre- or post-incorporation, with background samples.
None of the observed radionuclide activity levels from the cuttings or background samples
were at any levels which would indicate elevated or enriched conditions.
Although NORM has no regulatory limits, comparison of the NORM Study radiological results
to CDPHE TENORM Policy and Guidance (Table 7) show that no radiological activity levels in
the NORM Study samples exceeded the administrative release limits and would be considered
exempted from radiological control by that policy.
CONCLUSION AND RECOMMENDATIONS
The COGCC NORM Study was implemented in response to the October 2011 STRONGER
recommendation that the COGCC gather information on the occurrence and level of NORM in
E&P wastes in Colorado. The initial project involving the evaluation of the concentrations of
NORM in drill cuttings from newly drilled wells in the Greater Wattenberg Area of Weld
County has been completed. The COGCC staff observed no radionuclide activity levels in this
E&P waste that indicate that NORM in drilling cuttings exceed radionuclide activity levels
observed in background samples. In many cases, radionuclide activity levels in background
samples were found to be higher than levels from drill cuttings.
Page 12
SPECIAL PROJECT 2136 COGCC
12
The data available at present indicate that the beneficial reuse of drill cuttings as an agricultural
soils amendment does not create conditions that pose impacts to human health or the
environment from radiation. Although NORM has no regulatory limits, comparison of the
NORM Study radiological results to CDPHE TENORM regulations show that no radiological
activity levels in the NORM Study samples exceeded the unrestricted use limits.
RECOMMENDATIONS
1. The COGCC has additional limited radiological sampling data from earlier sampling, such
as the Project Rulison (Project 1991) sampling required by order in the Rulison blast area,
which should be incorporated into a follow-on data review/report in FY 2015.
2. COGCC should proceed to analyze E&P wastes generated in Colorado for the presence of
NORM and continue to develop a database of radiological information for the following
E&P wastes:
• Produced water at all stages of water handing activities including surface evaporation
pits.
• Cuttings from other formations and other areas of the State, as available (this is
envisioned as opportunistic sampling as drilling operations make cuttings available in
other areas).
• Other E&P wastes such as tank bottoms, drilling mud, pit sludges, and well completion
flow-back, among others (again, this will be opportunistic and may be associated with
other environmental investigations).
REFERENCES
Argonne National Laboratories, Environmental Science Division. 2005. Human Health Fact
Sheet, Natural Decay Series: Uranium, Radium, and Thorium.
6 Colorado Code of Regulations [CCR] 1007-1 Part 01.
Colorado Department of Public Health and Environment (CDPHE). Radiation Control Program.
https://www.colorado.gov/cdphe/radiation Accessed on November 8, 2014.
Colorado Oil & Gas Conservation Commission (COGCC). April 2014. Sampling and Analysis
Plan for Naturally Occurring Radioactive Material in Oil and Gas Well Drill Cuttings.
Page 13
SPECIAL PROJECT 2136 COGCC
13
Consolvo, John and Sukosky, John M., July 2011, Radiological Lab Results Don’t Have to Be
Confusing: OpFlow, American Water Works Association. http://www.awwa.org/opflow.
Page 14
SPECIAL PROJECT 2136 COGCC
14
FIGURES
Page 15
SPECIAL PROJECT 2136 COGCC
15
Figure 1. Natural Decay Series: Uranium-238
Source: Argonne National Laboratory, 2005
Page 16
SPECIAL PROJECT 2136 COGCC
16
Figure 2. Natural Decay Series: Thorium-232
Source: Argonne National Laboratory, 2005
Page 17
Figure 3 NORM Sample Locations
#*
#*
#*
#*
#*
#*
#*#*
#*
#*
#*
#*
#*#*#*
#*#*
#*
#*#*
#*
#*#*
#*
#*
#*
034A
052A
014C02
5A
287C
392B
076A
085L
066B
085C
257A
034D
060B
392A
119B
056B
001A
060A
119C
144A
402A
263A08
5F
287Z
085G
085E
257B 034ZGREELEY
FORT COLLINS
LOVELANDWINDSOR
LONGMONT
MEAD
ERIE
EVANS
FREDERICK
MILLIKEN
DACONO
FIRESTONE
BERTHOUD
JOHNSTOWN
HUDSON
NUNN
TIMNATH SEVERANCE
FORT LUPTON
EATON
WELLINGTON
FIRESTONE
PLATTEVILLE
JOHNSTOWN
MILLIKEN
AULT
KEENESBURG
KERSEY
PIERCE
JOHNSTOWN
LA SALLE
GILCREST
GROVER
SEVERANCE
FORT LUPTON
FORT LUPTONBOULDERBOULDER
GARDEN CITY
BOULDER
5N 66W
7N 66W
6N 66W
4N 61W
5N 61W
4N 69W
7N 69W
6N 65W
7N 62W
6N 69W
4N 66W
9N 62W
5N 69W
9N 66W 9N 63W
7N 65W
9N 64W
5N 65W
8N 61W
7N 63W
5N 62W
9N 65W
8N 62W
9N 69W
5N 68W
8N 64W
2N 66W
6N 68W 6N 61W
3N 69W
9N 67W
7N 61W
3N 68W3N 66W
2N 63W2N 68W
5N 63W
7N 68W
4N 62W
3N 63W
9N 68W
6N 63W
2N 62W
8N 69W
6N 62W
2N 69W
9N 61W
3N 65W
8N 63W
3N 62W
4N 68W
5N 64W
8N 68W
4N 65W 4N 63W
6N 64W
2N 65W
7N 64W
8N 65W
5N 67W
2N 64W
3N 61W
2N 61W
3N 64W
6N 67W
2N 67W
3N 67W
4N 64W
8N 66W
7N 67W
4N 67W
8N 67W
10N 63W10N 66W 10N 64W10N 65W 10N 61W10N 62W10N 67W10N 68W10N 69W
1N 63W 1N 62W1N 65W1N 66W 1N 64W 1N 61W1N 68W1N 69W
1N 67W
3N 70W
4N 70W 4N 60W
2N 60W
3N 60W
8N 70W
9N 70W
7N 70W
5N 60W
6N 70W 6N 60W
7N 60W
9N 60W
8N 60W
1N 60W
11N 65W11N 66W11N 69W 11N 67W11N 68W 11N 64W 11N 61W11N 63W 11N 62W NORM Sample LocationsSampleType
Background
#* Cuttings
Highway
Cities
Township and Range
.0 10 205 Miles
0 10 205 Kilometers
Page 18
Figure 4 NORM Sample Locations Near Fredrick
#*
#*KMG-422067KMG-422067-BKG
SUN-NIX-425797SUN-NIX-425797-BKG
18
5
19
13
7
23
24
17
FIRESTONE BD
3RD
ST
26
GRANT AV
CR 5
1ST ST
BELLA ROSA PY/WCR 20
BIRCH
STSIL
VER
BIRCH
BD/
WCR
11
COLO
RADO
BD/
WCR
13GODDING HOLLOW PY/WCR 18
5TH ST
WCR
3.5
LOCU
ST S
T
AGGR
EGAT
E BD/
WCR
7
8TH ST
COLO
RADO
BD
RIDG
EWAY
BD/W
CR 15
4TH ST
5
23
13
7
1ST S
T
1919
COLO
RADO
BD
FREDERICK
MEAD
DACONO
FIRESTONE
ERIE
LONGMONT
ERIE
FIRESTONE
PLATTEVILLE PLATTEVILLE
2N 68W 2N 67W
3N 68W3N 67W
1N 68W 1N 67W
NORM Sample LocationsSampleType
Background
#* Cuttings
Major Rds
Highway
Cities
Township and Range
.0 2.5 51.25 Miles
0 2.5 51.25 Kilometers
Page 19
Figure 5 NORM Sample Locations Near Platteville
#*
#*
#*
#*
#*
#*
#*
#*
#*
#*
#*
#*
#* KMG-422060
BBC-436067
LUDWIG-431183LUDWIG-430649
Frank#2-434889
KMG-422060-BKG
SPANDAU-431953
Gobbler-2N66W22
Bella-18-431606
GOBBLER-2N68W23
MACDONALD-431609
LUDWIG-431183-BKG
Moser III -425665 Moser Farms-429348
SPANDAU-431953-BKG
GOBBLER-2N66W23-BKG
Moser-III-425665-BKG
MACDONALD-431609-BKG
SYNRGY-Deschant BRA-434946
22
49
32
39
41
31
18
3037
28
43
GRAND AV
MAIN ST
18
085C
060B
085F
PLATTEVILLE
GILCREST
HUDSON
3N 65W3N 66W
2N 65W2N 66W
4N 65W4N 66W
3N 64W
2N 64W
4N 64W
NORM Sample LocationsSampleType
Background
#* Cuttings
Major Rds.
Highway
Cities
Township & Range
.0 2.5 51.25 Miles
0 3 61.5 Kilometers
Page 20
Figure 6 NORM Sample Locations Near the Greeley Airport
#*
#*Sorin NRLA-436629Sprin NRLA-436629-BKG
Greeley Airport LA-436890Greeley Airport LA-436890-BKG
43
45
0 ST 64
62
8TH ST
6050
B STC ST
0 ST
62
GREELEY
6N 65W
5N 65W23 1
3534
26
36
27 25
4
33
10 11
28
129
NORM Sample LocationsSampleType
Background
#* Cuttings
Major Rds
Highway
Cities
Township & Range
sections
.0 0.6 1.20.3 Miles
0 0.65 1.30.325 Kilometers
Page 21
Figure 7 NORM Sample Locations Near Nunn
#*
#*
#*
#*
SRC-433394
Tekton-433752REEVES-435839-BKGREEVES-Bayswater-435839
29
90
100
33
CR 29
4TH ST
1ST S
T
ROWE AV
CR 100
MAIN AV
CR 90 / ROWE AV 90085L
NUNN
PIERCE
NORM Sample LocationsSampleType
Background
#* Cuttings
Major Rds
Highway
RadCities
RadTR
.0 1 20.5 Miles
0 1 20.5 Kilometers
Page 22
Figure 8 NORM Sample Locations Near Grover
#*#*425666-BKGNoble-425666
89
120
87
122
CHATOGA AV
RAILRD AV
RAILROAD AV
GROVER
10N 62W 10N 61W
9N 62W 9N 61W
11N 62W 11N 61W NORM Sample LocationsSampleType
Background
#* Cuttings
Major Rds
Highways
Cities
Township & Range
.0 1 20.5 Miles
0 1.5 30.75 Kilometers
Page 23
Figure 9 NORM Sample Locations Near Wiggins
#*
#*
#*Krier-436891
Miller-425667
SHELDON-426183
89
2.00
386
73
68
87
95
Q.00
93
U.00
61
3.00
22
M.50
Y.50
O.00
388
2650
AA.00
P.00
U.50
4650
8.00
MAIN
ST
1.70
93
3.00
2.00
WIGGINS
NORM Sample LocationsSampleType
Background
#* Cuttings
Major Rds
Highway
Cities
Township & Range
.0 6 123 Miles
0 6.5 133.25 Kilometers
Page 24
SPECIAL PROJECT 2136 COGCC
17
TABLES
Page 25
SPECIAL PROJECT 2136 COGCC
18
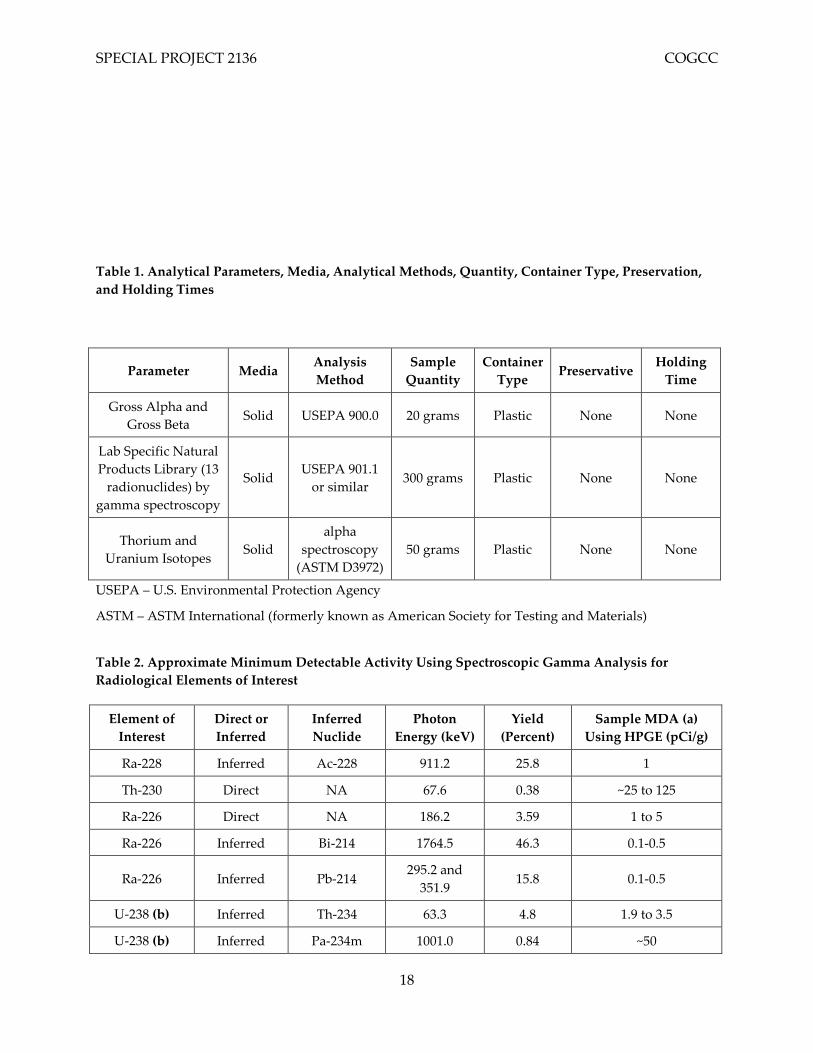
Table 1. Analytical Parameters, Media, Analytical Methods, Quantity, Container Type, Preservation, and Holding Times
Parameter Media Analysis Method
Sample Quantity
Container Type
Preservative Holding
Time
Gross Alpha and Gross Beta
Solid USEPA 900.0 20 grams Plastic None None
Lab Specific Natural Products Library (13
radionuclides) by gamma spectroscopy
Solid USEPA 901.1
or similar 300 grams Plastic None None
Thorium and Uranium Isotopes
Solid alpha
spectroscopy (ASTM D3972)
50 grams Plastic None None
USEPA – U.S. Environmental Protection Agency
ASTM – ASTM International (formerly known as American Society for Testing and Materials)
Table 2. Approximate Minimum Detectable Activity Using Spectroscopic Gamma Analysis for Radiological Elements of Interest
Element of Interest
Direct or Inferred
Inferred Nuclide
Photon Energy (keV)
Yield (Percent)
Sample MDA (a) Using HPGE (pCi/g)
Ra-228 Inferred Ac-228 911.2 25.8 1
Th-230 Direct NA 67.6 0.38 ~25 to 125
Ra-226 Direct NA 186.2 3.59 1 to 5
Ra-226 Inferred Bi-214 1764.5 46.3 0.1-0.5
Ra-226 Inferred Pb-214 295.2 and
351.9 15.8 0.1-0.5
U-238 (b) Inferred Th-234 63.3 4.8 1.9 to 3.5
U-238 (b) Inferred Pa-234m 1001.0 0.84 ~50
Page 26
SPECIAL PROJECT 2136 COGCC
19
(a) The nuclide minimum detection activity (MDA) values stated in the table are from samples analyzed by the HPGe spectrometer in a shielded 1 L Marinelli beaker which is counted for 15 minutes.
(b) XRF may be used for solid matrix uranium determination and ICP-MS used for liquid samples.
pCi/g – picoCuries per gram.
keV – kiloelectron volts.
Page 27
TABLE 3. GROSS ALPHA AND GROSS BETA SAMPLE RESULTS
T3-1
SAMPLE ID
SAMPLE DATE
GROSS ALPHA
±
LAB
QUALIFIERS
GROSS BETA
±
LAB
QUALIFIERS
SYNRGY-DECHANT BRA
05/01/14 2.4 1.0 LT 2.48 0.87 LT
Duplicate Analysis 1.48 0.80 LT 1.81 0.79 LT KMG-422067 05/16/14 6.8 2.5 7 2.2 KMG-422067-BKG 05/16/14 6.6 2.1 5.6 1.4 GOBBLER-2N66W22 05/16/14 5.2 2.4 4.6 1.8 SUN-NIX-425797 05/16/14 4.7 2.1 3.4 1.6 LT SUN-NIX-425797-BKG
05/16/14 5.9 1.6 4 1 LT
GOBBLER-2N66W23 05/16/14 9.3 3.3 4.5 1.8 GOBBLER-2N66W23-BKG
05/16/14 2.75 0.83 LT 3.22 0.78 LT
FRANK#2-434889 05/16/14 5.8 2.5 3.1 1.6 LT SHELDON-426183 05/21/14 6.7 2.7 5.7 2.0 Duplicate Analysis 5.2 2.4 5.8 2.0
BBC-436067 05/21/14 10.0 3.5 3.6 1.7 LT MACDONALD-431609
05/21/14 4.4 1.4 4.0 1.0
MACDONALD-431609-BKG
05/21/14 1.74 0.55 LT 2.01 0.51 LT
LUDWIG-431183 05/21/14 3.14 0.83 2.86 0.65 LT LUDWIG-431183-BKG
05/21/14 5.0 1.2 3.34 0.74 LT
LUDWIG-430649 05/21/14 5.0 2.2 4.8 1.6 MOSER III -425665 06/04/14 6.8 2.0 4.6 1.3 MOSER III -425665-BKG
06/04/14 1.28 0.39 LT 2.08 0.47 LT
MOSER FARMS-429348
06/04/14 6.0 2.1 4.8 1.4
KMG-422060 06/04/14 4.5 1.4 4.0 1.2 KMG-422060-BKG 06/04/14 4.4 1.4 6.0 1.5 GREELEY AIRPORT-436890
06/10/14 4.8 1.7 4.3 1.4
GREELEY AIRPORT-436890-BKG
06/10/14 6.6 1.4 3.99 0.79 LT
TES-436629 06/10/14 5.0 1.6 4.5 1.4 TES-436629-BKG 06/10/14 6.1 1.8 4.9 1.4 MILLER-425667 06/10/14 3.3 1.2 5.1 1.8 KRIER-436891 06/10/14 5.7 1.5 6.3 1.9 BELLA-18-431606 06/12/14 3.0 1.3 LT 3.4 1.2 LT SPANDAU-431953 06/12/14 3.0 1.5 LT 4.8 1.4 LT
Page 28
TABLE 3. GROSS ALPHA AND GROSS BETA SAMPLE RESULTS
T3-2
SAMPLE ID
SAMPLE
DATE
GROSS ALPHA
±
LAB
QUALIFIERS
GROSS BETA
±
LAB
QUALIFIERS
SPANDAU-431953-BKG
06/12/14 6.0 1.7 5.2 1.4
REEVES-435839 06/30/14 3.4 1.7 2.5 1.4 LT TEKTON-433752 06/30/14 4.3 2.0 3.5 1.6 LT SRC-433394 06/30/14 6.0 2.6 4.7 1.8 REEVES-435839-BKG
06/30/14 3.05 0.88 3.36 0.80 LT
NOBLE-425666 06/30/14 5.8 2.7 4.1 1.7 415666-BKG 06/30/14 1.84 0.65 LT 1.98 0.67 LT Duplicate Analysis 2.02 0.67 LT 1.72 0.53 LT
Note: All concentrations in picoCuries per gram (pCi/g)
LT - Result is less than requested Minimum Detectable Concentration (MDC), greater than sample specific MDC.
Page 29
T4-1
Table 4. Gamma Spectroscopy Sample Results
SAMPLE ID
SAMPLE
DATE
228Ac
±
LAB
QUAILFIERS
212Bi
±
LAB
QUALIFIERS
214Bi
±
LAB
QUALIFIERS
SYNRGY-DECHANT BRA
05/01/14 1.68 0.63 LT,G,Tl 1.7 1.8 U,G 1.00 0.38 G,J
Duplicate Analysis 1.15 0.45 LT,G,Tl 2.1 1.4 G 1.14 0.36 G,J KMG-422067 05/16/14 1.65 0.71 LT,G 0.7 1,6 U,G 1.68 0.50 G,J KMG-422067-BKG 05/16/14 1.91 0.73 LT,G,Tl 2.1 2.3 U,G 1.82 0.52 G,J
Duplicate Analysis 2.08 0.62 G,Tl 1.7 1.9 U,G 1.82 0.47 G,J GOBBLER-2N66W22 05/16/14 1.66 0.61 LT,G,Tl 2.8 1.8 G,NQ 1.09 0.42 G,J SUN-NIX-425797 05/16/14 1.92 0.62 LT,G,Tl 2.3 2.2 U,G 0.81 0.38 G,J SUN-NIX-425797-BKG
05/16/14 1.84 0.58 LT,G 2.5 1.8 U,G 1.01 0.40 G,J
GOBBLER-2N66W23 05/16/14 1.28 0.49 LT,G 1.4 1.7 U,G 0.82 0.43 G,J GOBBLER-2N66W23-BKG
05/16/14 1.03 0.60 LT,G,Tl 2.1 1.8 U,G 0.98 0.34 G,J
FRANK#2-434889 05/16/14 1.23 0.50 LT,G,Tl 1.7 1.7 U,G 0.95 0.37 G,J SHELDON-426183 05/21/14 1.20 0.45 LT,G 0.3 1.8 U,G 1.03 0.38 G,J BBC-436067 05/21/14 1.22 0.59 LT,G,Tl 1.4 2.3 U,G 1.50 0.53 G,J MACDONALD-431609
05/21/14 0.93 0.43 LT,G 1.7 1.7 U,G 0.97 0.41 G,J
MACDONALD-431609-BKG
05/21/14 1.13 0.50 LT,Tl 2.3 1.8 U 0.56 0.27 J
Duplicate Analysis 0.84 0.37 LT,LI 1.7 1.3 U 0.40 0.27 U,J LUDWIG-431183 05/21/14 0.98 0.47 LT 0.6 1.4 U 0.28 0.24 U,J LUDWIG-431183-BKG
05/21/14 1.31 0.47 LT 1.9 1.5 U 0.83 0.33 J
LUDWIG-430649 05/21/14 0.86 0.60 U,G 3.5 1.9 G,NQ 1.49 0.44 G,J MOSER III -425665 06/04/14 1.10 0.45 LT,G 0.2 2.0 U,G 0.89 0.41 G,J
MOSER III -425665-BKG
06/04/14 0.85 0.37 LT 0.5 1.3 U 0.25 0.27 U,J
MOSER FARMS-429348
06/04/14 1.27 0.62 G,NQ 1.1 1.9 U,G 1.20 0.45 G,J
Page 30
Table 4. Gamma Spectroscopy Sample Results, Continued.
T4-2
SAMPLE ID
SAMPLE
DATE
228Ac
±
LAB
QUAILFIERS
212Bi
±
LAB
QUALIFIERS
214Bi
±
LAB
QUALIFIERS
KMG-422060 06/04/14 0.79 0.36 LT,G,Tl 1.9 1.5 U,G 0.84 0.29 G,J KMG-422060-BKG 06/04/14 1.60 0.51 LT,G 2.7 2.1 U,G 0.91 0.36 G,J
GREELEY AIRPORT-436890
06/10/14 0.94 0.60 LT,G,Tl 1.0 1.9 U,G 0.84 0.43 G,J
GREELEY AIRPORT-436890-BKG
06/10/14 1.16 0.51 LT,G,Tl 0.4 1.6 U,G 1.14 0.40 G,J
TES-436629 06/10/14 0.69 0.43 U,G 1.3 1.5 U,G 1.08 0.35 G,J TES-436629-BKG 06/10/14 1.00 0.61 LT,G,Tl 1.6 1.4 U,G 1.21 0.35 G,J MILLER-425667 06/10/14 0.65 0.53 U,G 0.2 2.0 U,G 1.91 0.54 G,J
Duplicate Analysis 0.44 0.56 U,G 0.6 1.5 U,G 2.12 0.46 G,J KRIER-436891 06/10/14 1.5 1.0 LT,G,Tl 2.1 2.6 U,G 1.64 0.55 G,J BELLA-18-431606 06/12/14 0.84 0.62 U,G -1.9 2.1 U,G 1.09 0.38 G,J
Duplicate Analysis 0.97 0.42 LT,G 0.5 1.9 U,G 1.11 0.35 G,J SPANDAU-431953 06/12/14 1.22 0.68 G,NQ 0.9 2.2 U,G 1.31 0.45 G SPANDAU-431953-BKG
06/12/14 1.63 0.57 LT,G,Tl 1.9 1.7 U,G 1.20 0.41 G,J
REEVES-435839 06/30/14 0.63 0.51 U,G 1.3 1.9 U,G 0.90 0.36 G,J TEKTON-433752 06/30/14 1.19 0.66 LT,G,Tl 0.6 1.6 U,G 0.83 0.36 G,J SRC-433394 06/30/14 1.41 0.68 G,NQ 2.0 2.1 U,G 1.40 0.48 G,J REEVES-435839-BKG 06/30/14 0.70 0.44 LT,G,Tl 0.9 1.4 U,G 0.88 0.36 G,J
Duplicate Analysis 0.73 0.57 U,G 0.7 1.8 U,G 0.95 0.40 G,J NOBLE-425666 06/30/14 0.79 0.58 U,G 0.9 1.6 U,G 1.69 0.47 G,J 415666-BKG 06/30/14 0.85 0.51 LT,Tl -1.0 1.5 U 0.57 0.30 J
Notes: All concentrations in picoCuries per gram (pCi/g) (2 Sigma Total Propagated Uncertainty [TPU])
LT - Result is less than requested Minimum Detectable Concentration (MDC), greater than sample specific MDC. U – Analyte was analyzed but result is less than the sample specific MDC (not detected). M3 – The requested MDC was not met, but the reported activity is greater than the reported MDC. Y2 – Chemical yield outside default limits.
Page 31
Table 4. Gamma Spectroscopy Sample Results, Continued.
T4-3
J – Activity value estimated. NQ – Nuclide is not detected or supported at any level above the reported MDC. Tl – Nuclide identification is tentative. G – Sample density differs by more than 15 % of LCS density.
Page 32
Table 4. Gamma Spectroscopy Sample Results, Continued.
T4-4
SAMPLE ID
SAMPLE
DATE
40K
±
LAB
QUALIFIERS
234mPa
±
LAB
QUALIFIERS
212Pb
±
LAB
QUALIFIERS
SYNRGY-DECHANT BRA
05/01/14 15.8 4.0 G 23 22 U,G 1.32 0.35 G
Duplicate Analysis 14.3 3.3 G 13 16 U,G 1.54 0.34 G KMG-422067 05/16/14 18.2 4.5 G -27 26 U,G 2.12 0.44 G KMG-422067-BKG 05/16/14 19.0 5.0 G 11 25 U,G 2.35 0.52 G
Duplicate Analysis 17.7 4.2 G 15 19 U,G 2.51 0.50 G GOBBLER-2N66W22 05/16/14 19.0 4.4 G 16 20 U,G 1.26 0.34 G SUN-NIX-425797 05/16/14 24.4 5.5 G 1 30 U,G 1.55 0.36 G SUN-NIX-425797-BKG
05/16/14 25.9 5.2 G 10 21 U,G 1.78 0.39 G
GOBBLER-2N66W23 05/16/14 20.4 4.8 G 13 23 U,G 1.32 0.34 G GOBBLER-2N66W23-BKG
05/16/14 27.5 5.3 G -6 18 U,G 1.24 0.31 G
FRANK#2-434889 05/16/14 16.0 3.9 G 6 21 U,G 1.04 0.28 G SHELDON-426183 05/21/14 18.3 4.2 G 0 20 U,G 1.31 0.33 G BBC-436067 05/21/14 13.8 4.3 G 14 23 U,G 1.05 0.38 G MACDONALD-431609
05/21/14 21.0 4.9 G 0 21 U,G 1.16 0.32 G
MACDONALD-431609-BKG
05/21/14 29.1 5.2 0 15 U 0.92 0.25
Duplicate Analysis 29.1 4.9 4 17 U 0.91 0.24 LUDWIG-431183 05/21/14 26.0 4.9 -5 17 U 1.09 0.30 LUDWIG-431183-BKG
05/21/14 30.1 5.6 6 21 U 1.19 0.30
LUDWIG-430649 05/21/14 13.5 3.4 G -2 18 U,G 1.05 0.27 G MOSER III -425665 06/04/14 23.2 5.2 G -10 21 U,G 1.11 0.34 G MOSER III -425665-BKG
06/04/14 26.6 4.7 10 17 U 0.68 0.23
MOSER FARMS-429348
06/04/14 15.4 4.1 G 21 24 U,G 0.63 0.28 G
Page 33
Table 4. Gamma Spectroscopy Sample Results, Continued.
T4-5
SAMPLE ID
SAMPLE
DATE
40K
±
LAB
QUAILFIERS
234mPa
±
LAB
QUALIFIERS
212Pb
±
LAB
QUALIFIERS
KMG-422060 06/04/14 21.5 4.2 G 9 16 U,G 0.83 0.25 G KMG-422060-BKG 06/04/14 20.1 4.4 G -11 20 U,G 1.57 0.34 G GREELEY AIRPORT-436890
06/10/14 18.7 4.9 G 20 22 U,G 0.81 0.30 G
GREELEY AIRPORT-436890-BKG
06/10/14 19.3 4.2 G 6 19 U,G 1.34 0.33 G
TES-436629 06/10/14 15.4 3.6 G 12 20 U,G 0.89 0.27 G TES-436629-BKG 06/10/14 16.9 3.8 G 3 16 U,G 0.99 0.27 G MILLER-425667 06/10/14 9.7 3.4 LT,G 13 29 U,G 0.52 0.23 G
Duplicate Analysis 8.9 2.7 LT,G -2 19 U,G 0.60 0.21 G KRIER-436891 06/10/14 15.1 4.6 G 3 26 U,G 1.09 0.38 G BELLA-18-431606 06/12/14 16.3 4.4 G -13 25 U,G 0.96 0.31 G
Duplicate Analysis 15.8 3.7 G 3 17 U,G 1.25 0.28 G SPANDAU-431953 06/12/14 15.5 4.5 G 3 21 U,G 1.20 0.34 G SPANDAU-431953-BKG
06/12/14 24.4 4.8 G 2 18 U,G 1.74 0.40 G
REEVES-435839 06/30/14 17.7 4.5 G 0 24 U,G 1.32 0.35 G TEKTON-433752 06/30/14 18.7 4.2 G 20 20 U,G 1.06 0.33 G SRC-433394 06/30/14 10.7 3.4 G 2 24 U,G 0.73 0.27 G REEVES-435839-BKG 06/30/14 19.9 4.2 G 14 17 U,G 0.93 0.27 G
Duplicate Analysis 21.2 4.5 G 12 22 U,G 0.92 0.27 G NOBLE-425666 06/30/14 13.8 3.7 G -6 19 U,G 0.41 0.38 U,G 415666-BKG 06/30/14 20.5 4.3 16 21 U 0.74 0.25
Note: All concentrations in picoCuries per gram (pCi/g) (2 Sigma Total Propagated Uncertainty [TPU])
LT - Result is less than requested Minimum Detectable Concentration (MDC), greater than sample specific MDC. U – Analyte was analyzed but result is less than the sample specific MDC (not detected). M3 – The requested MDC was not met, but the reported activity is greater than the reported MDC. Y2 – Chemical yield outside default limits. J – Activity value estimated.
Page 34
Table 4. Gamma Spectroscopy Sample Results, Continued.
T4-6
NQ – Nuclide is not detected or supported at any level above the reported MDC. Tl – Nuclide identification is tentative. G – Sample density differs by more than 15 % of LCS density.
Page 35
Table 4. Gamma Spectroscopy Sample Results, Continued.
T4-7
SAMPLE ID
SAMPLE
DATE
214Pb
±
LAB
QUAILIFIERS
227Th
±
LAB
QUALIFIERS
234Th
±
LAB
QUALIFIERS
SYNRGY-DECHANT BRA
05/01/14 1.21 0.32 G,J 0.3 1.0 U,G -0.2 2.1 U,G
Duplicate Analysis 1.59 0.31 G,J -0.88 0.72 U,G -0.7 1.9 U,G KMG-422067 05/16/14 1.47 0.39 G,J -2.4 1.4 U,G 1.8 2.2 U,G KMG-422067-BKG 05/16/14 1.77 0.44 G,J 0.4 1.2 U,G -2.9 2.8 U,G
Duplicate Analysis 1.41 0.37 G,J -0.32 0.97 U,G 2.5 2.9 U,G GOBBLER-2N66W22 05/16/14 1.26 0.33 G,J -0.12 0.59 U,G 2.7 2.8 U,G SUN-NIX-425797 05/16/14 1.03 0.30 G,J -0.9 1.0 U,G -0.2 1.9 U,G SUN-NIX-425797-BKG
05/16/14 0.88 0.29 G,J -0.33 0.90 U,G 2.7 2.6 U,G
GOBBLER-2N66W23 05/16/14 1.27 0.35 G,J -0.01 0.57 U,G 0.8 1.9 U,G GOBBLER-2N66W23-BKG
05/16/14 0.82 0.28 G,J -0.23 0.47 U,G 0.7 1.6 U,G
FRANK#2-434889 05/16/14 1.03 0.31 G,J -0.04 0.58 U,G 0.7 2.2 U,G SHELDON-426183 05/21/14 1.14 0.32 G,J -0.39 0.85 U,G -0.5 2.1 U,G BBC-436067 05/21/14 1.74 0.43 G,J 0.32 0.96 U,G 1.4 3.5 U,G MACDONALD-431609
05/21/14 0.94 0.31 G,J 0.16 0.54 U,G 0.8 1.4 U,G
MACDONALD-431609-BKG
05/21/14 0.53 0.23 J -0.58 0.45 U 0.1 1.4 U
Duplicate Analysis 0.57 0.19 J 0.31 0.47 U 0.1 1.6 U LUDWIG-431183 05/21/14 0.95 0.26 J 0.56 0.69 U 1.3 1.4 U LUDWIG-431183-BKG
05/21/14 0.98 0.27 J -0.07 0.45 U 1.1 1.2 U
LUDWIG-430649 05/21/14 1.87 0.39 G,J -0.06 0.50 U,G 1.6 1.8 U,G MOSER III -425665 06/04/14 1.06 0.34 G,J -0.55 0.85 U,G 2.6 2.4 U,G MOSER III -425665-BKG
06/04/14 0.46 0.18 J 0.03 0.69 U -1.0 1.6 U
MOSER FARMS-429348
06/04/14 1.04 0.34 G,J -0.45 0.98 U,G -0.9 1.9 U,G
Page 36
Table 4. Gamma Spectroscopy Sample Results, Continued.
T4-8
SAMPLE ID
SAMPLE
DATE
214Pb
±
LAB
QUAIFLIERS
227Th
±
LAB
QUALIFIERS
234Th
±
LAB
QUALIFIERS
KMG-422060 06/04/14 0.73 0.22 G,J 0.26 0.73 U,G 0.8 1.7 U,G KMG-422060-BKG 06/04/14 1.21 0.32 G,J -0.15 0.49 U,G 1.5 1.3 U,G GREELEY AIRPORT-436890
06/10/14 1.03 0.34 G,J -0.24 0.69 U,G 3.3 3.1 U,G
GREELEY AIRPORT-436890-BKG
06/10/14 0.97 0.26 G,J -0.38 0.82 U,G 0.7 2.1 U,G
TES-436629 06/10/14 1.22 0.31 G,J 0.08 0.83 U,G 1.1 2.1 U,G TES-436629-BKG 06/10/14 1.62 0.34 G,J 0.13 0.54 U,G -0.1 2.1 U,G MILLER-425667 06/10/14 2.31 0.48 G,J 0.46 0.60 U,G 0.7 1.6 U,G
Duplicate Analysis 2.02 0.39 G,J -0.03 0.46 U,G 1.0 1.3 U,G KRIER-436891 06/10/14 1.76 0.46 G,J -0.21 0.80 U,G 1.2 2.3 U,G BELLA-18-431606 06/12/14 1.07 0.32 G,J 0.13 0.51 U,G 1.2 1.5 U,G
Duplicate Analysis 1.02 0.27 G,J -0.18 0.42 U,G 1.9 1.4 U,G SPANDAU-431953 06/12/14 1.45 0.39 G,J -0.28 0.99 U,G 1.6 2.2 U,G SPANDAU-431953-BKG
06/12/14 1.17 0.31 G,J 0.40 0.92 U,G -0.2 2.2 U,G
REEVES-435839 06/30/14 1.21 0.35 G,J 0.12 0.87 U,G 1.4 2.3 U,G TEKTON-433752 06/30/14 0.83 0.27 G,J 0.14 0.89 U,G 2.0 2.5 U,G SRC-433394 06/30/14 1.20 0.35 G,J -1.0 1.1 U,G 1.4 2.2 U,G REEVES-435839-BKG 06/30/14 0.88 0.26 G,J 0.12 0.49 U,G -0.9 1.9 U,G
Duplicate Analysis 1.12 0.30 G,J 0.25 0.74 U,G 0.9 1.4 U,G NOBLE-425666 06/30/14 1.70 0.37 G,J -0.76 0.86 U,G 1.7 2.4 U,G 415666-BKG 06/30/14 0.73 0.24 J -0.63 0.79 U -0.5 1.6 U
Note: All concentrations in picoCuries per gram (pCi/g) (2 Sigma Total Propagated Uncertainty [TPU])
LT - Result is less than requested Minimum Detectable Concentration (MDC), greater than sample specific MDC. U – Analyte was analyzed but result is less than the sample specific MDC (not detected). M3 – The requested MDC was not met, but the reported activity is greater than the reported MDC. Y2 – Chemical yield outside default limits. J – Activity value estimated.
Page 37
Table 4. Gamma Spectroscopy Sample Results, Continued.
T4-9
NQ – Nuclide is not detected or supported at any level above the reported MDC. Tl – Nuclide identification is tentative. G – Sample density differs by more than 15 % of LCS density.
Page 38
Table 4. Gamma Spectroscopy Sample Results, Continued.
T4-10
SAMPLE ID
SAMPLE DATE
208Tl
± LA
B Q
UA
LFIE
RS
235U
± LA
B Q
UA
LIFI
ERS
226Ra
± LA
B Q
UA
LIFI
ERS
228Ra
± LA
B Q
UA
LIFI
ERS
SYNRGY-DECHANT BRA
05/01/14 0.33 0.17 G 0.63 0.66 U,G 1.45 0.33 G 1.68 0.63 G,Tl
Duplicate Analysis
0.31 0.15 G 0.66 0.56 U,G 1.89 0.35 G 1.15 0.45 G,Tl
KMG-422067 05/16/14 0.46 0.22 G -0.29 0.63 U,G 1.91 0.41 G 1.65 0.71 M3,G KMG-422067-BKG
05/16/14 0.81 0.27 G 0.12 0.82 U,G 2.29 0.47 G 1.91 0.73 M3,G,Tl
Duplicate Analysis
0.71 0.21 G 0.09 0.71 U,G 2.07 0.42 G 2.08 0.62 G,Tl
GOBBLER-2N66W22
05/16/14 0.32 0.18 G -0.09 0.57 U,G 1.65 0.38 G 1.66 0.61 G,Tl
SUN-NIX-425797 05/16/14 0.55 0.20 G -0.17 0.58 U,G 1.27 0.33 G 1.92 0.62 G,Tl SUN-NIX-425797-BKG
05/16/14 0.68 0.22 G -0.06 0.61 U,G 1.19 0.32 G 1.84 0.58 G
GOBBLER-2N66W23
05/16/14 0.50 0.20 G 0.17 0.54 U,G 1.43 0.36 G 1.28 0.49 G
GOBBLER-2N66W23-BKG
05/16/14 0.38 0.16 G 0.13 0.40 U,G 1.09 0.29 G 1.03 0.60 G,Tl
FRANK#2-434889 05/16/14 0.25 0.14 G 0.14 0.58 U,G 1.38 0.35 G 1.23 0.50 G,Tl SHELDON-426183
05/21/14 0.54 0.20 G -0.08 0.54 U,G 1.51 0.36 G 1.20 0.45 G
BBC-436067 05/21/14 0.43 0.25 G 0.45 0.67 U,G 2.14 0.47 G 1.22 0.59 G,Tl MACDONALD-431609
05/21/14 0.29 0.17 G 0.16 0.55 U,G 1.22 0.33 G 0.93 0.43 LT,G
MACDONALD-431609-BKG
05/21/14 0.29 0.12 0.29 0.42 U 0.67 0.22 LT 1.13 0.50 Tl
Duplicate Analysis
0.27 0.12 0.07 0.40 U 0.71 0.21 LT 0.84 0.37 LT,Tl
LUDWIG-431183 05/21/14 0.28 0.13 -0.04 0.46 U 0.83 0.24 LT 0.98 0.47 LT
Page 39
Table 4. Gamma Spectroscopy Sample Results, Continued.
T4-11
SAMPLE ID
SAMPLE DATE
208Tl
± LA
B Q
UA
LFIE
RS
235U
± LA
B Q
UA
LIFI
ERS
226Ra
± LA
B Q
UA
LIFI
ERS
228Ra
± LA
B Q
UA
LIFI
ERS
LUDWIG-431183-BKG
05/21/14 0.34 0.16 -0.35 0.41 U 1.0 0.28 1.31 0.47
LUDWIG-430649 05/21/14 0.24 0.17 U,G -0.08 0.48 U,G 2.14 0.40 G 0.86 0.60 U,G MOSER III -425665
06/04/14 0.26 0.17 G 0.55 0.67 U,G 1.28 0.35 G 1.10 0.45 G
MOSER III -425665-BKG
06/04/14 0.28 0.15 -0.07 0.48 U 0.53 0.20 LT 0.85 0.37 LT
MOSER FARMS-429348
06/04/14 0.17 0.15 U,G -0.34 0.63 U,G 1.36 0.35 G 1.27 0.72 G,NQ
KMG-422060 06/04/14 0.30 0.13 G 0.14 0.45 U,G 1.05 0.26 G 0.79 0.36 LT,G,Tl KMG-422060-BKG
06/04/14 0.49 0.18 G 0.09 0.51 U,G 1.41 0.33 G 1.60 0.51 G
GREELEY AIRPORT-436890
06/10/14 0.39 0.18 G 0.29 0.74 U,G 1.23 0.36 G 0.94 0.60 LT,G,Tl
GREELEY AIRPORT-436890-BKG
06/10/14 0.32 0.17 G 0.06 0.65 U,G 1.35 0.31 G 1.16 0.51 G,Tl
TES-436629 06/10/14 0.37 0.19 G 0.11 0.47 U,G 1.45 0.31 G 0.69 0.43 U,G
TES-436629-BKG 06/10/14 0.29 0.15 G 0.43 0.45 U,G 2.00 0.37 G 1.00 0.61 LT,G,Tl
MILLER-425667 06/10/14 0.21 0.17 U,G 0.71 0.66 U,G 2.80 0.52 G 0.65 0.53 U,G Duplicate Analysis
0.23 0.14 G 0.34 0.44 U,G 2.64 0.44 G 0.44 0.56 U,G
KRIER-436891 06/10/14 0.23 0.19 U,G 0.72 0.73 U,G 2.20 0.48 G 1.5 1.0 M3,G,Tl BELLA-18-431606 06/12/14 0.30 0.18 G 0.14 0.53 U,G 1.39 0.33 G 0.84 0.62 U,G
Duplicate Analysis
0.38 0.16 G 0.12 0.42 U,G 1.36 0.29 G 0.97 0.42 LT,G
Page 40
Table 4. Gamma Spectroscopy Sample Results, Continued.
T4-12
SAMPLE ID
SAMPLE DATE
208Tl
± LA
B Q
UA
LFIE
RS
235U
± LA
B Q
UA
LIFI
ERS
226Ra
± LA
B Q
UA
LIFI
ERS
228Ra
± LA
B Q
UA
LIFI
ERS
SPANDAU-431953
06/12/14 0.23 0.18 U,G 0 0.63 U,G 1.78 0.41 G 1.22 0.68 G,NQ
SPANDAU-431953-BKG
06/12/14 0.49 0.18 G -0.12 0.70 U,G 1.57 0.35 G 1.63 0.57 G,Tl
REEVES-435839 06/30/14 0.45 0.20 G -0.21 0.63 U,G 1.38 0.34 G 0.63 0.51 U TEKTON-433752 06/30/14 0.31 0.14 G -0.30 0.69 U,G 1.09 0.30 G 1.19 0.66 G,Tl SRC-433394 06/30/14 0.21 0.17 U,G 0.48 0.50 U,G 1.57 0.37 G 1.41 0.68 G,NQ REEVES-435839-BKG
06/30/14 0.28 0.12 G -0.17 0.53 U,G 1.21 0.30 G 0.70 0.44 LT,G,Tl
Duplicate Analysis
0.35 0.16 G 0.10 0.50 U,G 1.38 0.33 G 0.73 0.57 U,G
NOBLE-425666 06/30/14 0.34 0.20 G 0.38 0.65 U,G 2.25 0.43 G 0.79 0.58 U,G 415666-BKG 06/30/14 0.32 0.14 0.16 0.47 U 0.83 0.24 LT 0.85 0.51 LT,Tl
Notes: All concentrations in picoCuries per gram (pCi/g) (2 Sigma Total Propagated Uncertainty [TPU])
LT - Result is less than requested Minimum Detectable Concentration (MDC), greater than sample specific MDC. U – Analyte was analyzed but result is less than the sample specific MDC (not detected). M3 – The requested MDC was not met, but the reported activity is greater than the reported MDC. Y2 – Chemical yield outside default limits. J – Activity value estimated. NQ – Nuclide is not detected or supported at any level above the reported MDC. Tl – Nuclide identification is tentative. G – Sample density differs by more than 15 % of LCS density.
Page 41
TABLE 5. ISOTOPIC URANIUM SAMPLE RESULTS
T5-1
SAMPLE ID
SAMPLE
DATE
234U
±
LAB
QUALIFIERS
235U
±
LAB
QUALIFIERS
238U
±
LAB
QUALIFIERS
SYNRGY-DECHANT BRA
05/01/14 1.07 0.21 0.070 0.035 LT 1.24 0.23
Duplicate Analysis 1.05 0.20 0.054 0.030 LT 0.98 0.19 KMG-422067 05/16/14 1.05 0.21 0.050 0.031 LT 0.87 0.18 KMG-422067-BKG 05/16/14 0.93 0.19 0.037 0.027 LT 0.86 0.18 GOBBLER-2N66W22 05/16/14 0.85 0.18 0.023 0.021 LT 0.72 0.16 SUN-NIX-425797 05/16/14 0.72 0.16 0.038 0.030 LT 0.58 0.14 SUN-NIX-425797-BKG
05/16/14 0.54 0.14 0.013 0.022 U 0.72 0.17
GOBBLER-2N66W23 05/16/14 1.15 0.23 0.054 0.033 LT 1.18 0.23 GOBBLER-2N66W23-BKG
05/16/14 0.53 0.13 0.010 0.019 U 0.53 0.13
FRANK#2-434889 05/16/14 0.80 0.16 0.061 0.034 LT 0.75 0.l6 SHELDON-426183 05/21/14 1.01 0.19 0.032 0.022 LT 1.07 0.20 BBC-436067 05/21/14 1.35 0.25 0.058 0.031 LT 1.25 0.23 MACDONALD-431609
05/21/14 0.83 0.16 0.059 0.031 LT 0.79 0.16
MACDONALD-431609-BKG
05/21/14 0.60 0.13 0.026 0.019 LT 0.61 0.13
LUDWIG-431183 05/21/14 0.61 0.13 0.043 0.028 LT 0.65 0.14 LUDWIG-431183-BKG
05/21/14 0.62 0.13 0.037 0.025 LT 0.73 0.15
LUDWIG-430649 05/21/14 1.38 0.25 0.075 0.037 LT 1.41 0.26 MOSER III -425665 06/04/14 1.06 0.24 0.040 0.033 LT 0.89 0.21 MOSER III -425665-BKG
06/04/14 0.34 0.11 0.020 0.028 U 0.48 0.14
Duplicate Analysis
0.43 0.11 0.016 0.019 LT 0.46 0.12
Page 42
TABLE 5. ISOTOPIC URANIUM SAMPLE RESULTS
T5-2
SAMPLE ID
SAMPLE
DATE
234U
±
LAB
QUALIFIERS
235U
±
LAB
QUALIFIERS
238U
±
LAB
QUALIFIERS
MOSER FARMS-429348
06/04/14 1.30 0.27 0.071 0.044 LT 1.35 0.27
KMG-422060 06/04/14 0.90 0.21 0.020 0.028 U 0.85 0.20 KMG-422060-BKG 06/04/14 1.37 0.27 0.059 0.038 LT 1.22 0.25 GREELEY AIRPORT-436890
06/10/14 0.98 0.21 0.042 0.032 LT 0.92 0.20
GREELEY AIRPORT-436890-BKG
06/10/14 0.97 0.21 0.035 0.031 LT 1.07 0.23
TES-436629 06/10/14 0.86 0.20 0.026 0.026 LT 0.73 0.18 TES-436629-BKG 06/10/14 1.04 0.23 0.043 0.037 U 0.82 0.19 MILLER-425667 06/10/14 1.94 0.39 0.123 0.065 2.09 0.42 KRIER-436891 06/10/14 1.39 0.29 0.080 0.048 LT 1.75 0.35 BELLA-18-431606 06/12/14 0.90 0.19 0.041 0.032 LT 0.93 0.20 SPANDAU-431953 06/12/14 1.27 0.26 0.038 0.031 LT 1.24 0.25 SPANDAU-431953-BKG
06/12/14 1.43 0.28 0.033 0.027 LT 1.34 0.26
REEVES-435839 06/30/14 0.86 0.19 0.057 0.035 LT 0.91 0.19 TEKTON-433752 06/30/14 0.94 0.20 0.027 0.028 U 1.02 0.22
Duplicate Analysis 1.06 0.22 0.056 0.036 LT 1.03 0.21 SRC-433394 06/30/14 1.15 0.24 0.049 0.033 LT 1.12 0.23 REEVES-435839-BKG 06/30/14 0.57 0.14 0.024 0.024 U 0.64 0.15 NOBLE-425666 06/30/14 1.56 0.31 0.076 0.043 LT 1.54 0.30 415666-BKG 06/30/14 0.74 0.19 0.030 0.030 LT 0.70 0.18
Note: All concentrations in picoCuries per grams (pCi/g).
LT - Result is less than requested Minimum Detectable Concentration (MDC), greater than sample specific MDC. U – Result is less than the sample specific MDC (not detected).
Page 43
TABLE 6. ISOTOPIC THORIUM SAMPLE RESULTS
T6-1
SAMPLE ID
SAMPLE
DATE
228Th
±
LAB
QUALIFIERS
230Th
±
LAB
QUALIFIERS
232Th
±
LAB
QUALIFIERS
SYNRGY-DECHANT BRA
05/01/14 1.06 0.20 1.34 0.25 M3 1.15 0.21
KMG-422067 05/16/14 1.60 0.28 1.81 0.32 M3 1.65 0.29 Duplicate Analysis 1.47 0.26 1.95 0.34 M3 1.56 0.28
KMG-422067-BKG 05/16/14 2.12 0.36 1.64 0.29 M3 2.17 0.37 GOBBLER-2N66W22 05/16/14 1.07 0.20 1.59 0.29 M3 1.15 0.21 SUN-NIX-425797 05/16/14 1.36 0.26 M3 1.53 0.29 M3 1.27 0.24 SUN-NIX-425797-BKG
05/16/14 1.64 0.31 M3 1.79 0.33 M3 1.73 0.31
GOBBLER-2N66W23 05/16/14 1.23 0.23 1.50 0.27 M3 1.28 0.23 GOBBLER-2N66W23-BKG
05/16/14 1.04 0.21 M3 1.92 0.35 M3 1.15 0.22
FRANK#2-434889 05/16/14 0.92 0.20 M3 0.81 0.19 M3 0.94 0.19 SHELDON-426183 05/21/14 1.12 0.30 M3 1.16 0.31 M3 1.24 0.31 BBC-436067 05/21/14 0.82 0.20 M3 1.48 0.30 M3 0.81 0.18 MACDONALD-431609
05/21/14 1.11 0.26 M3 0.82 0.21 M3 1.08 0.24
MACDONALD-431609-BKG
05/21/14 1.04 0.23 M3 0.68 0.18 M3 1.13 0.24
LUDWIG-431183 05/21/14 1.12 0.26 M3 0.80 0.21 M3 1.20 0.26 LUDWIG-431183-BKG
05/21/14 1.64 0.34 M3 0.76 0.20 M3 1.48 0.31
LUDWIG-430649 05/21/14 0.83 0.16 1.50 0.27 0.80 0.15 MOSER III -425665 06/04/14 1.17 0.20 1.18 0.21 1.12 0.19 MOSER III -425665-BKG
06/04/14 0.93 0.17 0.54 0.12 0.95 0.17
MOSER FARMS-429348
06/04/14 0.70 0.15 M3 1.25 0.23 0.66 0.13
KMG-422060 06/04/14 1.10 0.19 0.96 0.17 1.07 0.18 KMG-422060-BKG 06/04/14 1.59 0.27 1.42 0.24 1.55 0.26
Page 44
TABLE 6. ISOTOPIC THORIUM SAMPLE RESULTS
T6-2
SAMPLE ID
SAMPLE
DATE
228Th
±
LAB
QUALIFIERS
230Th
±
LAB
QUALIFIERS
232Th
±
LAB
QUALIFIERS
GREELEY AIRPORT-436890
06/10/14 0.99 0.19 1.05 0.20 0.91 0.17
GREELEY AIRPORT-436890-BKG
06/10/14 0.92 0.17 0.90 0.17 0.93 0.17
TES-436629 06/10/14 1.16 0.22 1.14 0.22 1.03 0.19 TES-436629-BKG 06/10/14 0.95 0.18 1.29 0.23 0.85 0.16 MILLER-425667 06/10/14 0.53 0.13 M3 2.17 0.38 M3 0.64 0.13
Duplicate Analysis 0.51 0.22 Y2,M3 2.21 0.48 Y2,M3 0.70 0.20 Y2 KRIER-436891 06/10/14 0.86 0.18 M3 1.72 0.30 0.84 0.16 BELLA-18-431606 06/12/14 1.10 0.19 1.35 0.24 M3 1.01 0.18 SPANDAU-431953 06/12/14 0.94 0.17 2.43 0.40 M3 0.91 0.17 SPANDAU-431953-BKG
06/12/14 1.53 0.26 1.58 0.27 M3 1.35 0.23
REEVES-435839 06/30/14 1.03 0.18 1.18 0.21 M3 1.09 0.19 TEKTON-433752 06/30/14 1.11 0.19 1.26 0.22 M3 1.10 0.19 SRC-433394 06/30/14 1.00 0.18 1.82 0.30 M3 0.91 0.16 REEVES-435839-BKG 06/30/14 1.02 0.18 1.46 0.25 M3 0.99 0.17 NOBLE-425666 06/30/14 0.83 0.16 3.03 0.50 M3 0.94 0.17 415666-BKG 06/30/14 0.82 0.15 1.06 0.20 M3 0.81 0.15
Note: All concentrations in picoCuries per gram (pCi/g)
LT - Result is less than requested Minimum Detectable Concentration (MDC), greater than sample specific MDC. U – Result is less than the sample specific MDC (not detected). M3 – The requested MDC was not met, but the reported activity is greater than the reported MDC. Y2 – Chemical yield outside default limits.
Page 45
Table 7. Unrestricted Use TENORM
Materials that do not exceed the following limits may be managed without consideration of the
radioactive constituents:
Combined 226Ra/228Ra
Natural Uranium
Natural Thorium
3 pCi/g above background
30 pCi/g above background
3 pCi/g above background
pCi/g – picocuries per gram
226Ra – radium-226
228Ra – radium-228


![Chapter 24: Carbohydrates · 2020. 2. 27. · Chapter 24: Carbohydrates [Sections: 24.1–24.10] Carbohydrates definition • naturally occuring compounds derived from carbon, oxygen](https://static.documents.pub/doc/80x56/60fa974869a56a2caa24abeb/chapter-24-carbohydrates-2020-2-27-chapter-24-carbohydrates-sections-241a2410.jpg)


