83
Analysis of State of Vermont Employee Engagement Survey Results – 2013 January 2014 Prepared by: Douglas Pine, Ph.D. Vermont Department of Human Resources

Analysis of State of Vermont
Employee Engagement Survey Results – 2013
January 2014
Prepared by:
Douglas Pine, Ph.D.
Vermont Department of Human Resources

2
Employee Engagement Survey Results - 2013
Table of Contents
Introduction ............................................................................................................................................................................ 5
Methodology ........................................................................................................................................................................... 7
Table 1 Reliability Coefficients for Employee Engagement Survey and Subscales. ..................................................... 8
Table 2 Response Rate by Department ..................................................................................................................... 10
Table 3 Response Rate by Job Type ........................................................................................................................... 11
Table 4 Response Rate by Length of Service ............................................................................................................. 11
Table 5 Response Rate by Age Group ........................................................................................................................ 11
Table 6 Response Rate by Annual Salary Range ........................................................................................................ 12
Table 7 Response Rate by Bargaining Unit ................................................................................................................ 12
Table 8 Response Rate by Gender ............................................................................................................................. 12
Table 9 Response Rate by Racial/Ethnic Group ......................................................................................................... 12
Summary of Key Findings: Job Duties and their Relationship to the Mission and Goals of Your Agency or Department
.......................................................................................................................................................................................... 13
Table 10 Job Duties and their Relationship to the Mission and Goals of your Agency or Department – All
Respondents ............................................................................................................................................... 13
Table 11 Job Duties and their Relationship to the Mission and Goals of your Agency or Department by
Department ................................................................................................................................................. 14
Table 12 Job Duties and their Relationship to the Mission and Goals of your Agency or Department by Length of
Service ......................................................................................................................................................... 16
Table 13 Job Duties and their Relationship to the Mission and Goals of your Agency or Department by Age Group
................................................................................................................................................................... 17
Table 14 Job Duties and their Relationship to the Mission and Goals of your Agency or Department by Annual
Salary Range ................................................................................................................................................ 18
Table 15 Job Duties and their Relationship to the Mission and Goals of your Agency or Department by Job Type ..
................................................................................................................................................................... 19
Table 16 Job Duties and their Relationship to the Mission and Goals of your Agency or Department by Bargaining
Unit ............................................................................................................................................................. 19
Table 17 Job Duties and their Relationship to the Mission and Goals of your Agency or Department by Gender 20
Table 18 Job duties and their Relationship to the Mission and Goals of your agency or Department by
Racial/Ethnic Group .................................................................................................................................. 21
Summary of Key Findings: Communication and Input within your Organization ............................................................ 22
Table 19 Communication and Input within your Organization – All Respondents................................................. 22
Table 20 Communication and Input within your Organization by Department ...................................................... 23
Table 21 Communication and Input within your Organization by Length of Service .............................................. 24
3
Employee Engagement Survey Results - 2013
Table 22 Communication and Input within your Organization by Age Group ........................................................ 25
Table 23 Communication and Input within your Organization by Annual Salary Range ......................................... 25
Table 24 Communication and Input within your Organization by Job Type ........................................................... 26
Table 25 Communication and Input within your Organization by Gender ............................................................. 26
Table 26 Communication and Input within your Organization by Bargaining Unit ................................................. 27
Table 27 Communication and Input within your Organization by Racial/Ethnic Group ......................................... 27
Summary of Key Findings: Relationships and Morale in your Organization .................................................................... 28
Table 28 Relationships and Morale in your Organization – All Respondents .......................................................... 28
Table 29 Relationships and Morale in your Organization by Department .............................................................. 29
Table 30 Relationships and Morale in your Organization by Length of Service ...................................................... 30
Table 31 Relationships and Morale in your Organization by Age Group................................................................. 31
Table 32 Relationships and Morale in your Organization by Annual Salary Range ................................................. 31
Table 33 Relationships and Morale in your Organization by Job Type .................................................................... 32
Table 34 Relationships and Morale in your Organization by Bargaining Unit ......................................................... 32
Table 35 Relationships and Morale in your Organization by Gender ...................................................................... 33
Table 36 Relationships and Morale in your Organization by Racial/Ethnic Group .................................................. 33
Table 37 Highest Correlations with Morale Statement .......................................................................................... 34
Summary of Key Findings: Your Supervisor ..................................................................................................................... 35
Table 38 Your Supervisor – All Respondents .......................................................................................................... 35
Table 39 Your Supervisor by Department................................................................................................................ 36
Table 40 Your Supervisor by Length of Service ....................................................................................................... 38
Table 41 Your Supervisor by Age Group .................................................................................................................. 39
Table 42 Your Supervisor by Annual Salary Range .................................................................................................. 40
Table 43 Your Supervisor by Job Type ..................................................................................................................... 40
Table 44 Your Supervisor by Bargaining Unit .......................................................................................................... 41
Table 45 Your Supervisor by Gender ....................................................................................................................... 42
Table 46 Your Supervisor by Racial/Ethnic Group ................................................................................................... 42
Summary of Key Findings: Workload, Staffing and Resources ........................................................................................ 43
Table 47 Workload, Staffing and Resources – All Respondents ............................................................................. 43
Table 48 Workload, Staffing and Resources by Department................................................................................... 44
Table 49 Workload, Staffing and Resources by Length of Service........................................................................... 46
Table 50 Workload, Staffing and Resources by Age Group ..................................................................................... 46
Table 51 Workload, Staffing and Resources by Annual Salary Range ..................................................................... 47
Table 52 Workload, Staffing and Resources by Job Type ........................................................................................ 48

4
Employee Engagement Survey Results - 2013
Table 53 Workload, Staffing and Resources by Bargaining Unit ............................................................................. 48
Table 54 Workload, Staffing and Resources by Gender .......................................................................................... 49
Table 55 Workload, Staffing and Resources by Racial/Ethnic Group ...................................................................... 49
Summary of Key Findings: Compensation and Benefits .................................................................................................. 50
Table 56 Compensation and Benefits – All Respondents ........................................................................................ 50
Table 57 Compensation and Benefits by Department ............................................................................................ 51
Table 58 Compensation and Benefits by Length of Service .................................................................................... 53
Table 59 Compensation and Benefits by Age Group ............................................................................................... 53
Table 60 Compensation and Benefits by Annual Salary Range ............................................................................... 54
Table 61 Compensation and Benefits by Job Type .................................................................................................. 54
Table 62 Compensation and Benefits by Bargaining Unit ....................................................................................... 55
Table 63 Compensation and Benefits by Gender .................................................................................................... 55
Table 64 Compensation and Benefits by Racial/Ethnic Group ................................................................................ 56
Summary of Key Findings: Overall Job Satisfaction ......................................................................................................... 57
Table 65 Overall Job Satisfaction – All Respondents ............................................................................................... 57
Table 66 Overall Job Satisfaction by Department ................................................................................................... 58
Table 67 Overall Job Satisfaction by Length of Service ........................................................................................... 59
Table 68 Overall Job Satisfaction by Age Group ...................................................................................................... 59
Table 69 Overall Job Satisfaction by Annual Salary Range ...................................................................................... 59
Table 70 Overall Job Satisfaction by Job Type ......................................................................................................... 60
Table 71 Overall Job Satisfaction by Bargaining Unit .............................................................................................. 60
Table 72 Overall Job Satisfaction by Gender ........................................................................................................... 60
Table 73 Overall Job Satisfaction by Racial/Ethnic Group ....................................................................................... 60
Transportation .................................................................................................................................................................. 61
Table 74 Commute Distance to Work – All Respondents ........................................................................................ 61
Table 75 Most Common Means of Transportation to Commute to Work – All Respondents ................................ 61
Table 76 Transportation Survey Questions – All Respondents ............................................................................... 62
Table 77 Public Transportation to my Work Site is Easily Accessible by Location .................................................. 62
Table 78 There is Ample Parking at my Work Site by Location ............................................................................... 63
Appendix A – List of Survey Items ..................................................................................................................................... 64
Appendix B – Frequencies for All Respondents by all Items ............................................................................................. 68

5
Employee Engagement Survey Results - 2013
Introduction
The mission of the Department of Human Resources (DHR) is to provide leadership to and
partnership with other departments in State Government. Our purpose is to promote managerial and
workforce excellence, and to foster understanding and observance of regulatory requirements.
DHR’s 2012 – 2015 strategic plan heavily emphasizes training and development in core skills for
supervisors and managers, and clear standards in HR best practices for recruiting, hiring, retaining
and supporting an effective and engaged workforce.
In calendar year 2013, as part of our ongoing efforts to assess the goal of developing managerial and
workforce excellence using meaningful performance targets and measures, DHR developed and
implemented a statewide survey to obtain a baseline assessment of employee engagement. We
wanted to know how state employees feel about their daily work and how they feel about working
for the State of Vermont as an employer.
While there are a number of ways to define employee engagement, simply stated it is
the degree to which an individual is committed to an organization and the extent to which he/she
works to fulfill and advance a stated mission.
This survey assessed engagement by examining the following areas:
The relationship between job duties and the organization’s mission/goals;
Communication and input;
Relationships and morale within the organization;
The employee’s relationship with supervisor;
The impact of workload, staffing and resources; and
Compensation and benefits.
The survey was conducted between March 19 and April 5, 2013, and included a web-based survey
and a hard copy version with identical content. You will note that a total of 3,389 employees
responded. That is 43% of the total 7,879 employees, a substantial response. DHR has correlated the
responses in the survey with demographic information, including the Agency/Department of the
respondents, employment type, length of service, age, gender, race/ethnicity, and annual salary.
The analysis provided in this report is designed to be helpful to Agencies and Departments, as well
as to DHR. It may be used as a guide to begin a process of discussion and dialogue that can result in
improving staff relations, service to customers, organizational communication processes, and
supervisory practices. The primary audiences for this report are all DHR stakeholders: DHR
Divisions whose purpose is to provide leadership in employee hiring, retention and development;
and Agency and Department leadership and managers, who can work with DHR to determine how
best to use this information.
6
Employee Engagement Survey Results - 2013
Next steps will be to prepare strategies to strengthen what is working, and to address areas of need.
This will call for extensive collaboration between DHR and Agencies/Departments. DHR will
conduct focus groups in key areas to define more deeply both the need, and potential ways to
address those needs.
This baseline information will enable DHR to further its strategic goal of creating managerial and
workforce excellence. The survey will be refined and repeated at regular intervals to provide data on
progress, and to stay current on the status of employee engagement in Vermont State Government.

7
Employee Engagement Survey Results - 2013
Methodology
Survey Instrument
The 2013 State of Vermont Employee Engagement Survey was designed to establish a baseline of
measurement for employee engagement across the Executive Branch of Vermont State Government.
Survey items appeared as statements for which respondents were instructed to select from a five
point scale of agreement: Strongly Agree, Agree, Neither Agree nor Disagree, Disagree, and Strongly
Disagree.
The core survey structure addressed the engagement areas of:
Relationship of job duties to the mission and goals of the agency/department (9 items)
Communication and input with the organization (5 items)
Relationships and morale in the organization (6 items)
Relationship with supervisor (8 items)
Workload, staffing and resources (7 items)
Compensation and benefits (7 items)
The items selected for this survey are standard employee satisfaction and/or engagement items, and
track substantially with the questions and categories studied in the far-reaching landmark Gallup
employee engagement poll. The survey also assessed transportation to and from work, and overall
satisfaction.
Demographic information collected for analysis included agency/department, employment type,
workplace, length of service, age, gender, race/ethnicity, annual salary, means of transportation and
length of commute.
Important to survey development and interpretation is the level of reliability of the items that that
make up the survey and its subscales. In order to assess the degree to which a set of items measures a
single construct a measure of internal consistency can be calculated Cronbach’s alpha coefficients
were calculated for all items and subscales. High internal consistency would be would be
represented by a coefficient of .90 to 1.00. Good internal consistency is seen in the range of .70 to .90.
Table 1 shows that the survey items as a whole had high internal consistency, and individual
subscales all had at least good levels of reliability.
See Appendix A for a list of all survey items.

8
Employee Engagement Survey Results - 2013
Table 1 Reliability Coefficients for Employee Engagement Survey and Subscales.
Scale
Cronbach's
alpha
coefficient
Total (42 items) .94
Job Duties and their Relationship to the Mission and Goals of Your Agency/Department (9 Items) .83
Communication and input within Your Organization (5 items) .87
Relationships and Morale in Your organization (6 items) .88
Your Supervisor (8 items) .90
Workload, Staffing and Resources (7 items) .81
Compensation and Benefits (7 items) .73
Survey Administration
The survey was administered electronically via Survey Monkey, and distributed in hard copy to
employees at the Veterans’ home and the Agency of Transportation garages. Hard copy responses
were entered into the electronic record by Department of Human Resources staff and integrated into
the data set without indication of the method received.
The survey period was active from March 19 through April 5, 2013. The survey sample included all
classified and exempt employees of the Executive Branch1 employed during the survey period,
approximately 7,879 employees.
Of the 7,879 employees, 3,389 employees responded to the survey for an overall response rate of
43.0%. Since survey participation was voluntary it should be noted that this survey was based on a
“convenience” sample of employees who chose to respond. Therefore, one should be cautions in
interpretation of results.
Data Analysis
The original survey instructed respondents to select from a five point scale of agreement: Strongly
Agree, Agree, Neither Agree nor Disagree, Disagree, and Strongly Disagree. For purposes of
presentation in this report these were recoded to: Agree (combined Strongly Agree, Agree), Neutral
(Neither Agree nor Disagree), and Disagree (Disagree, and Strongly Disagree).
To ensure anonymity certain response categories with very small numbers of respondents were
recoded. Departments with 15 or fewer respondents were recoded to “Small Department.”
Respondents who chose “Transgendered” for gender were recoded to “Prefer not to answer.”
Respondents who chose “American Indian/Alaska Native,” “Asian/Pacific Islander,” “Black or
African American,” “Hispanic or Latino,” or “Native Hawaiian/Other Pacific Islander” for
racial/ethnic group were recoded to “Minority”. See Appendix B for frequencies on all survey items.
1 The Department of State’s Attorneys and Sheriffs was not including in the sample.
9
Employee Engagement Survey Results - 2013
In examining cross tabulations the statistic Chi square2 was calculated. Results were used only to
guide interpretation. Because this survey was based on a “convenience” sample, calculations of
statistical significance of differences would be unreliable and therefore are not presented in this
report.
Response Rates and Demographic Items
To calculate approximate response rates, data was generated from the State’s Human Resource
Information System (VTHR) based on the 3/23/13 pay period end date for: (1) department, (2) length
of service, (3) age group, (4) annual salary, (5) job type, (6) gender, (7) bargaining unit, and (8)
racial/ethnic group. Number, completed surveys, and response rates for each of the eight groups are
shown in Tables 2 to 8.
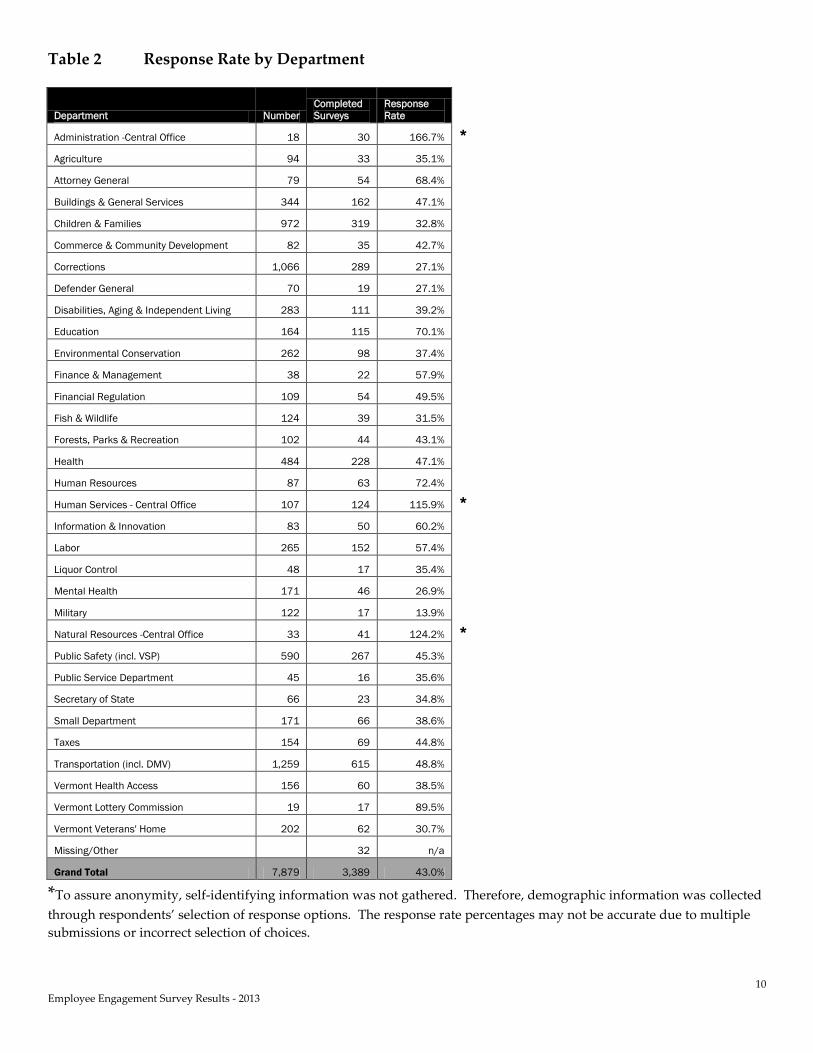
Table 2 shows response rate by department, which had wide variation. The rare instances where
response rates exceeded 100% (all with “central office” affiliation) can be attributed to respondents’
uncertainty about department affiliation.
Table 3 displays response rate by job type. Exempt employees had a higher response rate (58.3%)
than classified employees (37.9%).
Table 4 displays response rate by length of service and Table 5 shows response rate by age group.
Response rates were consistent across categories.
Table 6 displays response rate by annual salary range. Response rates were generally consistent
across categories. Only the “Less than $25,000”received a higher response rate (93.1%). Like
department affiliation, the high percentage may be attributable to confusion about the response
categories.
Table 7 displays response rate by bargaining unit. The Corrections Bargaining Unit and Excluded
from Bargaining Unit members had lower response rates (22.4% and 20.5% respectively).
Table 8 displays response rate by gender. Females had a somewhat higher than average response
rate (45.8%).
Table 9 displays response rate by racial/ethnic group. Minority respondents had a somewhat higher
than average response rate (46.6%).
In sum, the survey sample reasonably approximates the total employee population.
2 Chi square is a test used on categorical data that compares the observed count in each table cell to the count which
would be expected under the assumption of no association between the row and column classifications. Observed counts
are compared to expected counts to determine if there some significant association between the variables.
10
Employee Engagement Survey Results - 2013
Table 2 Response Rate by Department
Department Number
Completed
Surveys
Response
Rate
Administration -Central Office 18 30 166.7% *
Agriculture 94 33 35.1%
Attorney General 79 54 68.4%
Buildings & General Services 344 162 47.1%
Children & Families 972 319 32.8%
Commerce & Community Development 82 35 42.7%
Corrections 1,066 289 27.1%
Defender General 70 19 27.1%
Disabilities, Aging & Independent Living 283 111 39.2%
Education 164 115 70.1%
Environmental Conservation 262 98 37.4%
Finance & Management 38 22 57.9%
Financial Regulation 109 54 49.5%
Fish & Wildlife 124 39 31.5%
Forests, Parks & Recreation 102 44 43.1%
Health 484 228 47.1%
Human Resources 87 63 72.4%
Human Services - Central Office 107 124 115.9% *
Information & Innovation 83 50 60.2%
Labor 265 152 57.4%
Liquor Control 48 17 35.4%
Mental Health 171 46 26.9%
Military 122 17 13.9%
Natural Resources -Central Office 33 41 124.2% *
Public Safety (incl. VSP) 590 267 45.3%
Public Service Department 45 16 35.6%
Secretary of State 66 23 34.8%
Small Department 171 66 38.6%
Taxes 154 69 44.8%
Transportation (incl. DMV) 1,259 615 48.8%
Vermont Health Access 156 60 38.5%
Vermont Lottery Commission 19 17 89.5%
Vermont Veterans' Home 202 62 30.7%
Missing/Other 32 n/a
Grand Total 7,879 3,389 43.0%
*To assure anonymity, self-identifying information was not gathered. Therefore, demographic information was collected
through respondents’ selection of response options. The response rate percentages may not be accurate due to multiple
submissions or incorrect selection of choices.

11
Employee Engagement Survey Results - 2013
Table 3 Response Rate by Job Type
Job Type Number
Completed
Surveys
Response
Rate
Classified 7,447 2,820 37.9%
Exempt 432 252 58.3%
Other n/a 262 n/a
Missing n/a 55 n/a
Grand Total 7,879 3,389 43.0%
Table 4 Response Rate by Length of Service
Length of
Service Number
Completed
Surveys
Response
Rate
<5 years 2,161 828 38.3%
5-9 years 1,778 759 42.7%
10-14 years 1,328 579 43.6%
15-19 years 798 354 44.4%
20-24 years 653 272 41.7%
25-29 years 610 296 48.5%
30-35 years 368 176 47.8%
>35 years 183 89 48.6%
Missing n/a 36 n/a
Grand Total 7,879 3,389 43.0%
Table 5 Response Rate by Age Group
Age Group Number
Completed
Surveys
Response
Rate
<25 Years 161 72 44.7%
25-34 Years 1,237 472 38.2%
35-44 Years 1,864 791 42.4%
45-54 Years 2,296 984 42.9%
55-65 Years 2,112 870 41.2%
>65 Years 209 93 44.5%
Prefer not to answer n/a 55 n/a
Missing n/a 52 n/a
Grand Total 7,879 3,389 43.0%

12
Employee Engagement Survey Results - 2013
Table 6 Response Rate by Annual Salary Range
Annual Salary
Range Number
Completed
Surveys
Response
Rate
< $25,000 101 94 93.1%
$25,000 - $34,999 853 407 47.7%
$35,000 - $44,999 2,077 809 39.0%
$45,000 - $54,999 2,064 830 40.2%
$55,000 - $64,999 1,288 555 43.1%
$65,000 - $74,999 772 305 39.5%
> $75,000 724 212 29.3%
Missing 177 n/a
Grand Total 7,879 3,389 43.0%
Table 7 Response Rate by Bargaining Unit
Bargaining Unit Number
Completed
Surveys
Response
Rate
Corrections 869 195 22.4%
Excluded BU Member 974 200 20.5%
Non-Management 4,888 1,988 40.7%
State Police 276 92 33.3%
Supervisory 843 417 49.5%
Other/Missing n/a 497 n/a
Grand Total 7,879 3,389 43.0%
Table 8 Response Rate by Gender
Gender Number
Completed
Surveys
Response
Rate
Female 3,895 1,782 45.8%
Male 3,984 1,391 34.9%
Prefer not to answer n/a 116 n/a
Missing n/a 100 n/a
Grand Total 7,879 3,389 43.0%
Table 9 Response Rate by Racial/Ethnic Group
Racial/Ethnic group Number
Completed
Surveys
Response
Rate
Minority 238 111 46.6%
White 7,641 2,978 39.0%
Prefer not to Answer n/a 200 n/a
Missing n/a 100 n/a
Grand Total 7,879 3,389 43.0%

13
Employee Engagement Survey Results - 2013
Summary of Key Findings: Job Duties and their Relationship to the Mission and
Goals of Your Agency or Department
Table 10 displays percent agreement for all respondents to survey statements for “Job Duties and
their Relationship to the Mission and Goals of your Agency or Department.” Approximately 90% or
more agreed that they understand their job duties and responsibilities (93.8%), the work, goals, and
mission of their departments or agencies (89.2%), that the work they perform is linked to their
departments’ or agencies’ work (94.3%), and that the work they perform has an impact on their
departments’ or agencies’ ability to meet its goals and mission (90.3%).
To a lesser extent, all respondents agreed that the work they perform is meaningful and rewarding
(77.8%) and that the work they perform is varied and interesting (78.4%).
Approximately four out of five of all respondents agreed that they were confident that they can
accomplish their work goals (82.6%).
The lowest agreement was found among all respondents when asked if they were proud when they
tell people they work for the State of Vermont (64.4%) and whether they would recommend the State
of Vermont to others as a great place to work (59.8%). The relatively high level of “neutral” as a
response shows the ambivalence respondents felt about these statements (24.9% and 25.8%
respectively).
Table 10 Job Duties and their Relationship to the Mission and Goals of your Agency or
Department – All Respondents
Survey Items: Job Duties and their Relationship to the Mission and Goals of your
Agency or Department All Respondents
Question % Agree % Neutral % Disagree
Q12. I understand my job duties and responsibilities. 93.8% 3.7% 2.5%
Q13. I understand the work, goals, and mission of my department or agency. 89.2% 6.5% 4.2%
Q14. The work I perform is linked to my department or agency’s work. 94.3% 4.5% 1.2%
Q15. The work I perform has an impact on my department or agency meeting its goals
and mission. 90.3% 7.7% 2.1%
Q16. The work I perform is meaningful and rewarding. 77.8% 13.9% 8.3%
Q17. The work I perform is varied and interesting. 78.4% 14.6% 7.0%
Q18. I am confident that I can accomplish my work goals. 82.6% 10.2% 7.2%
Q19. I feel proud when I tell people I work for the State of Vermont. 64.4% 24.9% 10.8%
Q20. I would recommend the State of Vermont to others as a great place to work. 59.8% 25.8% 14.4%
Table 11 displays percent agreement for respondents by department to survey statements for “Job
Duties and their Relationship to the Mission and Goals of your Agency or Department.”

14
Employee Engagement Survey Results - 2013
Table 11 Job Duties and their Relationship to the Mission and Goals of your Agency or
Department by Department
Survey Items: Job Duties and their Relationship to the Mission and Goals of your Agency or Department
Q12. Q13. Q14. Q15. Q16. Q17. Q18. Q19. Q20.
Department % Agree % Agree % Agree % Agree % Agree % Agree % Agree % Agree % Agree
Administration - CO 93.1% 89.7% 89.7% 89.7% 72.4% 72.4% 89.7% 65.5% 65.5%
Agriculture 90.6% 78.1% 87.5% 90.6% 84.4% 87.5% 84.4% 62.5% 61.3%
Attorney General 100.0% 96.2% 100.0% 92.5% 90.6% 88.7% 90.4% 86.8% 73.6%
Buildings & General Services 90.5% 88.0% 94.9% 89.9% 72.2% 79.0% 88.0% 57.6% 54.4%
Children & Families 95.0% 92.4% 96.4% 93.4% 80.4% 75.5% 71.3% 64.6% 60.9%
Commerce & Comm. Dev. 97.0% 87.9% 87.9% 78.8% 84.8% 78.8% 81.8% 72.7% 66.7%
Corrections 94.3% 82.2% 87.9% 82.2% 63.1% 66.9% 82.9% 60.6% 52.5%
Defender General 100.0% 100.0% 100.0% 94.7% 78.9% 84.2% 84.2% 73.7% 73.7%
Disabilities, Aging & Ind. Liv. 91.3% 91.4% 97.1% 94.3% 86.5% 89.5% 81.7% 74.5% 72.6%
Education 89.6% 69.5% 83.8% 72.0% 71.7% 68.2% 79.4% 50.5% 41.5%
Environmental Conservation 97.9% 91.5% 96.8% 90.4% 75.5% 75.5% 75.5% 58.5% 47.9%
Finance & Management 90.5% 95.2% 100.0% 90.5% 85.7% 71.4% 81.0% 52.4% 57.1%
Financial Regulation 96.3% 94.4% 94.3% 96.3% 87.0% 79.6% 88.9% 68.5% 66.7%
Fish & Wildlife 97.2% 86.1% 94.4% 88.9% 77.8% 88.9% 80.0% 75.0% 61.1%
Forests, Parks & Recreation 95.5% 93.2% 97.7% 93.2% 88.6% 90.9% 81.8% 75.0% 65.9%
Health 95.9% 95.9% 97.3% 93.6% 86.4% 79.6% 87.7% 67.4% 62.4%
Human Resources 96.5% 91.2% 98.3% 93.1% 75.9% 87.9% 77.6% 62.1% 64.9%
Human Services - CO 87.6% 86.0% 92.6% 90.9% 75.0% 76.0% 75.8% 57.9% 55.4%
Information & Innovation 84.8% 89.1% 80.4% 80.4% 69.6% 73.9% 80.4% 56.5% 56.5%
Labor 91.9% 87.9% 95.3% 90.6% 78.5% 79.1% 81.2% 65.8% 63.1%
Liquor Control 100.0% 93.8% 100.0% 100.0% 81.3% 87.5% 87.5% 62.5% 56.3%
Lottery 86.7% 86.7% 86.7% 86.7% 73.3% 86.7% 80.0% 73.3% 80.0%
Mental Health 95.2% 95.0% 97.6% 87.8% 78.0% 82.5% 85.4% 63.4% 53.7%
Miltary 100.0% 100.0% 100.0% 100.0% 87.5% 75.0% 93.8% 62.5% 68.8%
Motor Vehicles 97.1% 98.6% 98.6% 97.1% 78.3% 81.2% 91.3% 72.1% 73.9%
Natural Resources -CO 100.0% 87.2% 97.4% 97.4% 82.1% 79.5% 84.6% 76.9% 71.8%
Public Safety (incl VSP) 97.2% 91.1% 95.9% 93.9% 80.1% 84.5% 86.2% 67.8% 59.8%
Public Service Department 86.7% 93.3% 100.0% 93.3% 85.7% 85.7% 85.7% 71.4% 50.0%
Secretary of State 90.0% 95.0% 100.0% 95.0% 80.0% 80.0% 78.9% 63.2% 60.0%
Small Department 93.4% 95.1% 100.0% 96.7% 88.5% 83.6% 93.4% 73.3% 70.5%
Taxes 90.8% 90.8% 89.2% 90.8% 75.0% 73.8% 82.5% 70.3% 67.2%
Transportation - not DMV 94.3% 88.1% 94.7% 89.3% 76.2% 78.7% 85.2% 61.3% 57.3%
Vermont Health Access 82.5% 89.5% 93.0% 93.0% 73.7% 75.4% 64.9% 63.2% 56.1%
Veterans' Home 89.5% 86.0% 94.7% 93.0% 89.5% 75.4% 86.0% 68.4% 67.3%
Average 93.8% 89.2% 94.3% 90.3% 77.8% 78.4% 82.6% 64.4% 59.8%
Q12. I understand my job duties and responsibilities.
Q13. I understand the work, goals, and mission of my department or agency.
Q14. The work I perform is linked to my department or agency’s work.
Q15. The work I perform has an impact on my department or agency meeting its goals and mission.
Q16. The work I perform is meaningful and rewarding.
Q17. The work I perform is varied and interesting.
Q18. I am confident that I can accomplish my work goals.
Q19. I feel proud when I tell people I work for the State of Vermont.
Q20. I would recommend the State of Vermont to others as a great place to work.
15
Employee Engagement Survey Results - 2013
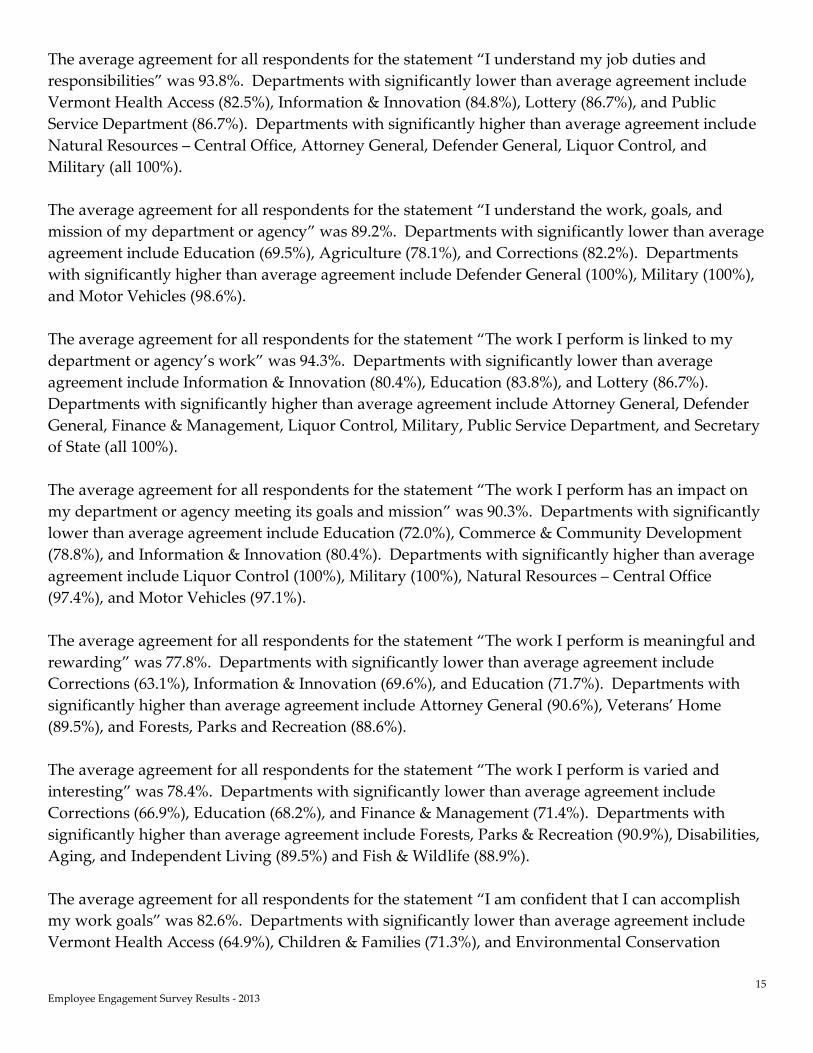
The average agreement for all respondents for the statement “I understand my job duties and
responsibilities” was 93.8%. Departments with significantly lower than average agreement include
Vermont Health Access (82.5%), Information & Innovation (84.8%), Lottery (86.7%), and Public
Service Department (86.7%). Departments with significantly higher than average agreement include
Natural Resources – Central Office, Attorney General, Defender General, Liquor Control, and
Military (all 100%).
The average agreement for all respondents for the statement “I understand the work, goals, and
mission of my department or agency” was 89.2%. Departments with significantly lower than average
agreement include Education (69.5%), Agriculture (78.1%), and Corrections (82.2%). Departments
with significantly higher than average agreement include Defender General (100%), Military (100%),
and Motor Vehicles (98.6%).
The average agreement for all respondents for the statement “The work I perform is linked to my
department or agency’s work” was 94.3%. Departments with significantly lower than average
agreement include Information & Innovation (80.4%), Education (83.8%), and Lottery (86.7%).
Departments with significantly higher than average agreement include Attorney General, Defender
General, Finance & Management, Liquor Control, Military, Public Service Department, and Secretary
of State (all 100%).
The average agreement for all respondents for the statement “The work I perform has an impact on
my department or agency meeting its goals and mission” was 90.3%. Departments with significantly
lower than average agreement include Education (72.0%), Commerce & Community Development
(78.8%), and Information & Innovation (80.4%). Departments with significantly higher than average
agreement include Liquor Control (100%), Military (100%), Natural Resources – Central Office
(97.4%), and Motor Vehicles (97.1%).
The average agreement for all respondents for the statement “The work I perform is meaningful and
rewarding” was 77.8%. Departments with significantly lower than average agreement include
Corrections (63.1%), Information & Innovation (69.6%), and Education (71.7%). Departments with
significantly higher than average agreement include Attorney General (90.6%), Veterans’ Home
(89.5%), and Forests, Parks and Recreation (88.6%).
The average agreement for all respondents for the statement “The work I perform is varied and
interesting” was 78.4%. Departments with significantly lower than average agreement include
Corrections (66.9%), Education (68.2%), and Finance & Management (71.4%). Departments with
significantly higher than average agreement include Forests, Parks & Recreation (90.9%), Disabilities,
Aging, and Independent Living (89.5%) and Fish & Wildlife (88.9%).
The average agreement for all respondents for the statement “I am confident that I can accomplish
my work goals” was 82.6%. Departments with significantly lower than average agreement include
Vermont Health Access (64.9%), Children & Families (71.3%), and Environmental Conservation

16
Employee Engagement Survey Results - 2013
(75.5%). Departments with significantly higher than average agreement include Military (93.8%),
Motor Vehicles (91.3%), and Attorney General (90.4%).
The average agreement for all respondents for the statement “I feel proud when I tell people I work
for the State of Vermont” was 64.4%. Departments with significantly lower than average agreement
include Education (50.5%), Finance & Management (52.4%), and Information & Innovation (56.5%).
Departments with significantly higher than average agreement include Attorney General (86.8%),
Natural Resources – Central Office (76.9%), Fish & Wildlife (75.0%) and Forests, Parks & Recreation
(75.0%).
The average agreement for all respondents for the statement “I would recommend the State of
Vermont to others as a great place to work” was 59.8%. Departments with significantly lower than
average agreement include Education (41.5%), Environmental Conservation (47.9%), and Public
Service Department (50%). Departments with significantly higher than average agreement include
Lottery (80.0%), Motor Vehicles (73.9%), Defender General (73.7%), and Attorney General (73.6%).
Table 12 displays percent agreement for respondents by length of service to survey statements for
“Job Duties and their Relationship to the Mission and Goals of your Agency or Department.” The
only significant finding was that respondents in the “less than 5 years” group tended to have higher
agreement that they were proud when they tell people they work for the State of Vermont (70.7%).
Table 12 Job Duties and their Relationship to the Mission and Goals of your Agency or
Department by Length of Service
Survey Items: Job Duties and their Relationship to the Mission
and Goals of your Agency or Department Length of Service
Less than
5 years
5 - 9
years
10 - 14
years
15 -19
years
20 - 24
years
25 - 29
years
30 - 35
years
More
than 35
years
Question % Agree % Agree % Agree % Agree % Agree % Agree % Agree % Agree
Q12. I understand my job duties and responsibilities. 94.3% 93.5% 93.1% 92.9% 93.1% 93.9% 94.0% 98.8%
Q13. I understand the work, goals, and mission of my
department or agency. 90.5% 88.9% 87.9% 89.7% 85.7% 91.7% 89.2% 94.0%
Q14. The work I perform is linked to my department or
agency’s work. 95.6% 93.5% 92.5% 94.7% 92.2% 97.1% 94.6% 98.8%
Q15. The work I perform has an impact on my department or
agency meeting its goals and mission. 91.1% 89.2% 88.7% 91.8% 88.0% 92.8% 90.4% 95.2%
Q16. The work I perform is meaningful and rewarding. 82.3% 77.2% 75.2% 74.6% 73.6% 77.4% 82.5% 81.9%
Q17. The work I perform is varied and interesting. 80.3% 79.1% 75.5% 76.8% 77.2% 77.1% 83.2% 81.9%
Q18. I am confident that I can accomplish my work goals. 84.5% 85.1% 81.0% 80.8% 76.8% 82.9% 81.9% 80.5%
Q19. I feel proud when I tell people I work for the State of
Vermont. 70.7% 61.2% 62.3% 62.3% 62.5% 63.4% 64.1% 65.1%
Q20. I would recommend the State of Vermont to others as a
great place to work. 65.2% 54.4% 57.9% 60.4% 60.9% 58.8% 60.5% 66.3%

17
Employee Engagement Survey Results - 2013
Table 13 displays percent agreement for respondents by age group to survey statements for “Job
Duties and their Relationship to the Mission and Goals of your Agency or Department.” The only
significant finding was that respondents in the “65 + years group tended to have higher agreement
that they were proud when they tell people they work for the State of Vermont (83.1%) and that they
would recommend the State of Vermont to others as a great place to work (78.7%).
Table 13 Job Duties and their Relationship to the Mission and Goals of your Agency or
Department by Age Group
Survey Items: Job Duties and their Relationship to the Mission
and Goals of your Agency or Department Age Group
18 - 24
years
25 - 34
years
35 - 44
years
45 - 54
years
55 - 64
years
65+
years
Prefer
not to
answer
Question % Agree % Agree % Agree % Agree % Agree % Agree % Agree
Q12. I understand my job duties and responsibilities. 95.5% 94.0% 95.4% 93.2% 93.5% 96.7% 81.6%
Q13. I understand the work, goals, and mission of my
department or agency. 89.4% 87.9% 91.3% 89.2% 89.4% 92.1% 77.6%
Q14. The work I perform is linked to my department or
agency’s work. 93.9% 93.8% 94.2% 94.4% 95.0% 98.9% 81.6%
Q15. The work I perform has an impact on my department or
agency meeting its goals and mission. 87.7% 90.7% 90.8% 89.9% 90.6% 96.7% 79.2%
Q16. The work I perform is meaningful and rewarding. 77.3% 76.8% 79.0% 76.7% 79.1% 92.1% 63.3%
Q17. The work I perform is varied and interesting. 81.8% 77.0% 80.4% 77.7% 79.2% 87.8% 57.1%
Q18. I am confident that I can accomplish my work goals. 95.4% 85.7% 83.0% 81.6% 81.5% 91.0% 61.2%
Q19. I feel proud when I tell people I work for the State of
Vermont. 65.2% 66.2% 63.2% 62.5% 66.5% 83.1% 44.9%
Q20. I would recommend the State of Vermont to others as a
great place to work. 59.1% 59.7% 59.3% 58.4% 61.5% 78.7% 38.8%
Table 14 displays percent agreement for respondents by salary range to survey statements for “Job
Duties and their Relationship to the Mission and Goals of your Agency or Department.” Those in the
$25,000-$34,999 salary range were least likely to agree that the work they perform is meaningful and
rewarding (72.5%), while respondents in the more than $75,000 were most likely to agree (89.9%).
Similarly, those in the $25,000-$34,999 salary range were least likely to agree that the work they
perform is varied and interesting (71.5%), while respondents in the “more than $75,000” range were
most likely to agree (90.4%).
Respondents in the “less than $25,000” salary range were most likely to agree that they were proud
when they tell people they work for the State of Vermont (78.4%). Respondents in the “less than
$25,000” salary range and the “more than $75,000” range tended to have higher agreement that they
would recommend the State of Vermont to others as a great place to work (70.8% and 72.1%
respectively).

18
Employee Engagement Survey Results - 2013
Table 14 Job Duties and their Relationship to the Mission and Goals of your Agency or
Department by Annual Salary Range
Survey Items: Job Duties and their Relationship to the Mission
and Goals of your Agency or Department Annual Salary Range
Less than
$25,000
$25,000 -
$34,999
$35,000 -
$44,999
$45,000 -
$54,999
$55,000 -
$64,999
$65,000 -
$74,999
More than
$75,000
Question % Agree % Agree % Agree % Agree % Agree % Agree % Agree
Q12. I understand my job duties and responsibilities. 96.6% 93.1% 93.9% 94.1% 91.5% 95.6% 97.5%
Q13. I understand the work, goals, and mission of my
department or agency. 89.9% 89.2% 89.5% 88.6% 86.5% 92.9% 95.4%
Q14. The work I perform is linked to my department or
agency’s work. 94.4% 93.4% 94.4% 94.6% 93.0% 95.2% 98.5%
Q15. The work I perform has an impact on my department or
agency meeting its goals and mission. 87.5% 89.0% 89.9% 89.7% 89.3% 92.5% 97.5%
Q16. The work I perform is meaningful and rewarding. 78.7% 72.5% 77.9% 77.3% 76.4% 83.3% 89.9%
Q17. The work I perform is varied and interesting. 76.1% 71.5% 78.3% 77.5% 79.4% 85.0% 90.4%
Q18. I am confident that I can accomplish my work goals. 92.1% 86.2% 84.8% 81.9% 76.9% 82.6% 87.4%
Q19. I feel proud when I tell people I work for the State of
Vermont. 78.4% 64.8% 64.5% 62.3% 62.5% 68.2% 69.5%
Q20. I would recommend the State of Vermont to others as a
great place to work. 70.8% 57.7% 61.7% 57.6% 57.1% 59.7% 72.1%
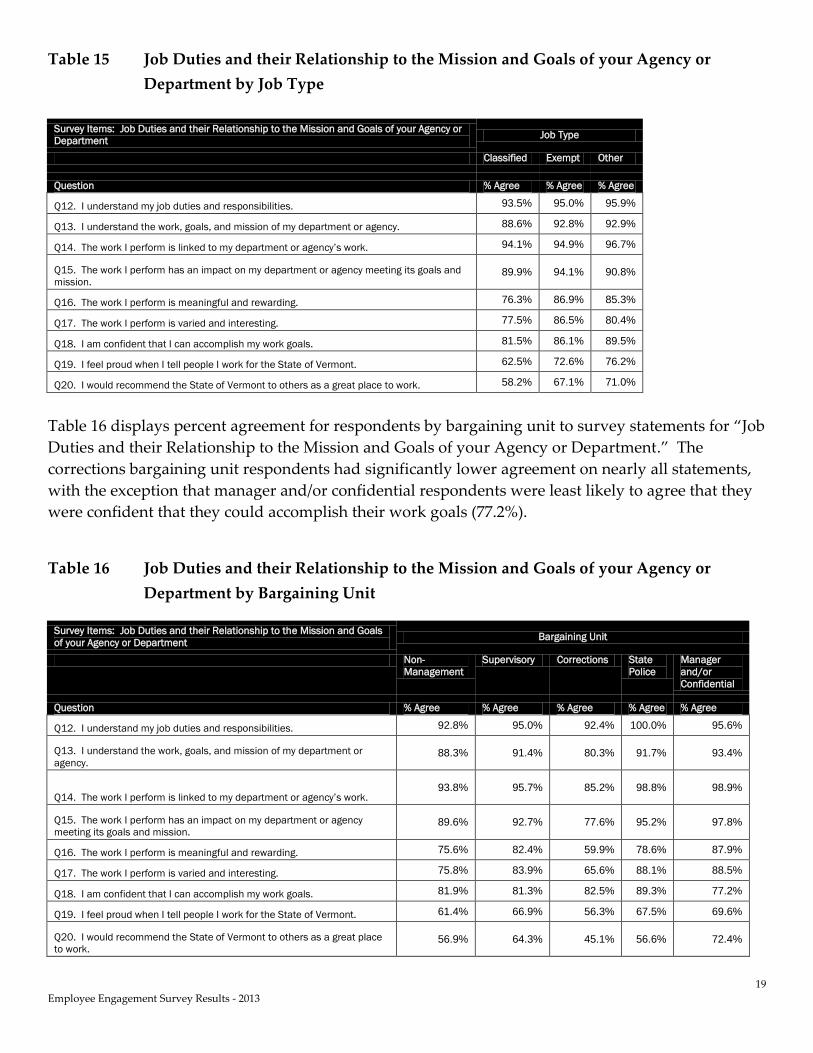
Table 15 displays percent agreement for respondents by job type to survey statements for “Job Duties
and their Relationship to the Mission and Goals of your Agency or Department.” Exempt
respondents were significantly more likely than classified respondents to agree that the work they
perform is meaningful and rewarding (86.9% and 76.3% respectively) and that the work they perform
is varied and interesting (86.5% and 77.5% respectively).
Similarly, exempt respondents were significantly more likely than classified respondents to agree that
they were proud when they tell people they work for the State of Vermont (72.6% and 62.5%
respectively) and that they would recommend the State of Vermont to others as a great place to work
(67.1% and 58.2% respectively).
19
Employee Engagement Survey Results - 2013
Table 15 Job Duties and their Relationship to the Mission and Goals of your Agency or
Department by Job Type
Survey Items: Job Duties and their Relationship to the Mission and Goals of your Agency or
Department Job Type
Classified Exempt Other
Question % Agree % Agree % Agree
Q12. I understand my job duties and responsibilities. 93.5% 95.0% 95.9%
Q13. I understand the work, goals, and mission of my department or agency. 88.6% 92.8% 92.9%
Q14. The work I perform is linked to my department or agency’s work. 94.1% 94.9% 96.7%
Q15. The work I perform has an impact on my department or agency meeting its goals and
mission. 89.9% 94.1% 90.8%
Q16. The work I perform is meaningful and rewarding. 76.3% 86.9% 85.3%
Q17. The work I perform is varied and interesting. 77.5% 86.5% 80.4%
Q18. I am confident that I can accomplish my work goals. 81.5% 86.1% 89.5%
Q19. I feel proud when I tell people I work for the State of Vermont. 62.5% 72.6% 76.2%
Q20. I would recommend the State of Vermont to others as a great place to work. 58.2% 67.1% 71.0%
Table 16 displays percent agreement for respondents by bargaining unit to survey statements for “Job
Duties and their Relationship to the Mission and Goals of your Agency or Department.” The
corrections bargaining unit respondents had significantly lower agreement on nearly all statements,
with the exception that manager and/or confidential respondents were least likely to agree that they
were confident that they could accomplish their work goals (77.2%).
Table 16 Job Duties and their Relationship to the Mission and Goals of your Agency or
Department by Bargaining Unit
Survey Items: Job Duties and their Relationship to the Mission and Goals
of your Agency or Department Bargaining Unit
Non-
Management
Supervisory Corrections State
Police
Manager
and/or
Confidential
Question % Agree % Agree % Agree % Agree % Agree
Q12. I understand my job duties and responsibilities. 92.8% 95.0% 92.4% 100.0% 95.6%
Q13. I understand the work, goals, and mission of my department or
agency. 88.3% 91.4% 80.3% 91.7% 93.4%
Q14. The work I perform is linked to my department or agency’s work. 93.8% 95.7% 85.2% 98.8% 98.9%
Q15. The work I perform has an impact on my department or agency
meeting its goals and mission. 89.6% 92.7% 77.6% 95.2% 97.8%
Q16. The work I perform is meaningful and rewarding. 75.6% 82.4% 59.9% 78.6% 87.9%
Q17. The work I perform is varied and interesting. 75.8% 83.9% 65.6% 88.1% 88.5%
Q18. I am confident that I can accomplish my work goals. 81.9% 81.3% 82.5% 89.3% 77.2%
Q19. I feel proud when I tell people I work for the State of Vermont. 61.4% 66.9% 56.3% 67.5% 69.6%
Q20. I would recommend the State of Vermont to others as a great place
to work. 56.9% 64.3% 45.1% 56.6% 72.4%
20
Employee Engagement Survey Results - 2013
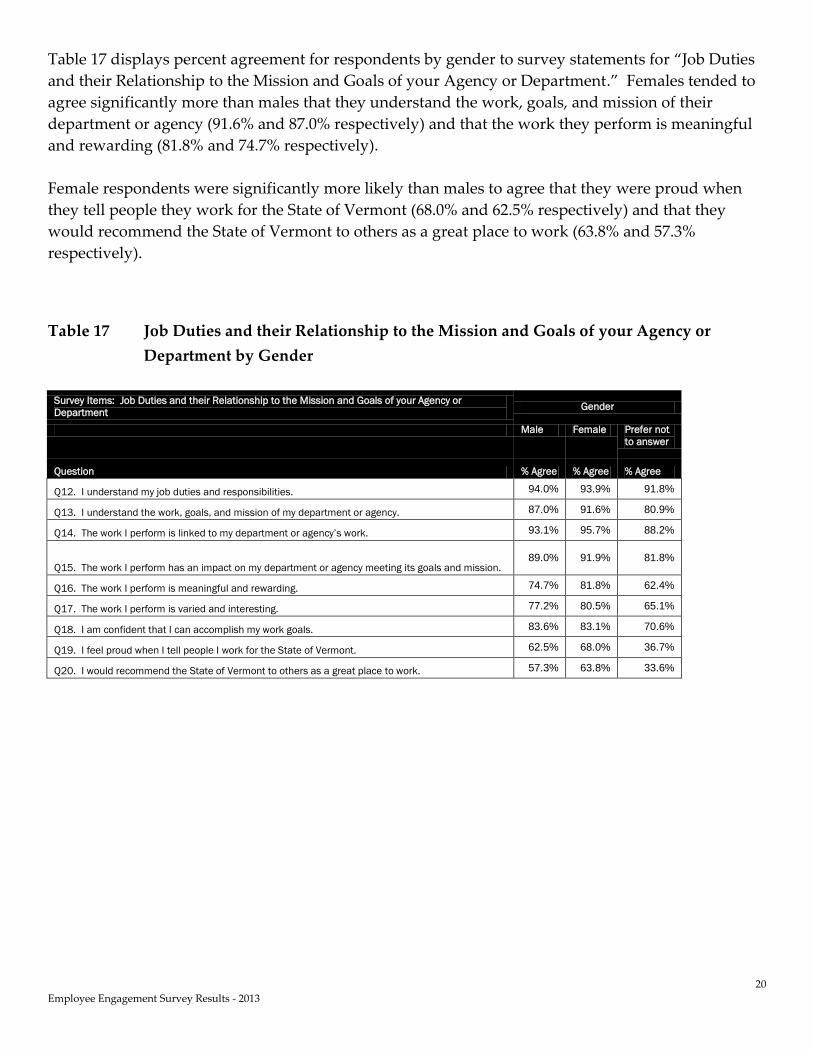
Table 17 displays percent agreement for respondents by gender to survey statements for “Job Duties
and their Relationship to the Mission and Goals of your Agency or Department.” Females tended to
agree significantly more than males that they understand the work, goals, and mission of their
department or agency (91.6% and 87.0% respectively) and that the work they perform is meaningful
and rewarding (81.8% and 74.7% respectively).
Female respondents were significantly more likely than males to agree that they were proud when
they tell people they work for the State of Vermont (68.0% and 62.5% respectively) and that they
would recommend the State of Vermont to others as a great place to work (63.8% and 57.3%
respectively).
Table 17 Job Duties and their Relationship to the Mission and Goals of your Agency or
Department by Gender
Survey Items: Job Duties and their Relationship to the Mission and Goals of your Agency or
Department Gender
Male Female Prefer not
to answer
Question % Agree % Agree % Agree
Q12. I understand my job duties and responsibilities. 94.0% 93.9% 91.8%
Q13. I understand the work, goals, and mission of my department or agency. 87.0% 91.6% 80.9%
Q14. The work I perform is linked to my department or agency’s work. 93.1% 95.7% 88.2%
Q15. The work I perform has an impact on my department or agency meeting its goals and mission. 89.0% 91.9% 81.8%
Q16. The work I perform is meaningful and rewarding. 74.7% 81.8% 62.4%
Q17. The work I perform is varied and interesting. 77.2% 80.5% 65.1%
Q18. I am confident that I can accomplish my work goals. 83.6% 83.1% 70.6%
Q19. I feel proud when I tell people I work for the State of Vermont. 62.5% 68.0% 36.7%
Q20. I would recommend the State of Vermont to others as a great place to work. 57.3% 63.8% 33.6%
21
Employee Engagement Survey Results - 2013
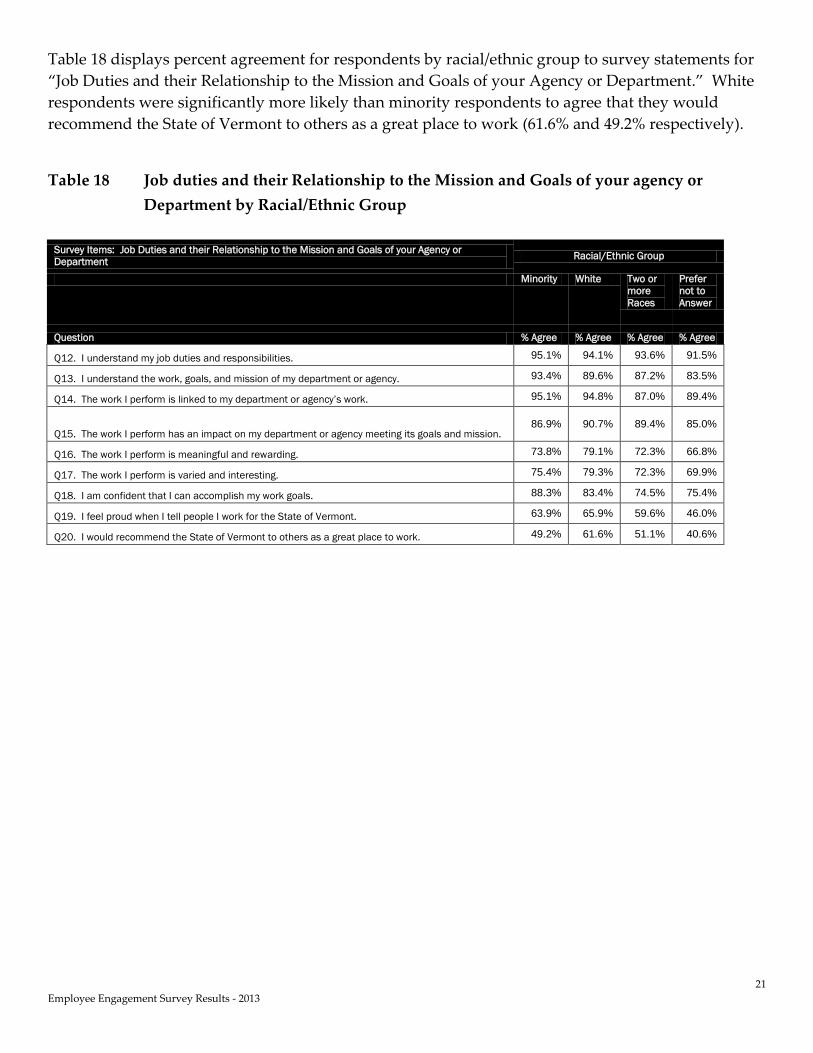
Table 18 displays percent agreement for respondents by racial/ethnic group to survey statements for
“Job Duties and their Relationship to the Mission and Goals of your Agency or Department.” White
respondents were significantly more likely than minority respondents to agree that they would
recommend the State of Vermont to others as a great place to work (61.6% and 49.2% respectively).
Table 18 Job duties and their Relationship to the Mission and Goals of your agency or
Department by Racial/Ethnic Group
Survey Items: Job Duties and their Relationship to the Mission and Goals of your Agency or
Department Racial/Ethnic Group
Minority White Two or
more
Races
Prefer
not to
Answer
Question % Agree % Agree % Agree % Agree
Q12. I understand my job duties and responsibilities. 95.1% 94.1% 93.6% 91.5%
Q13. I understand the work, goals, and mission of my department or agency. 93.4% 89.6% 87.2% 83.5%
Q14. The work I perform is linked to my department or agency’s work. 95.1% 94.8% 87.0% 89.4%
Q15. The work I perform has an impact on my department or agency meeting its goals and mission. 86.9% 90.7% 89.4% 85.0%
Q16. The work I perform is meaningful and rewarding. 73.8% 79.1% 72.3% 66.8%
Q17. The work I perform is varied and interesting. 75.4% 79.3% 72.3% 69.9%
Q18. I am confident that I can accomplish my work goals. 88.3% 83.4% 74.5% 75.4%
Q19. I feel proud when I tell people I work for the State of Vermont. 63.9% 65.9% 59.6% 46.0%
Q20. I would recommend the State of Vermont to others as a great place to work. 49.2% 61.6% 51.1% 40.6%

22
Employee Engagement Survey Results - 2013
Summary of Key Findings: Communication and Input within your Organization
Table 19 displays percent agreement for all respondents to survey statements for “Communication
and Input within your Organization.” Less than half of respondents agreed that management and
senior leadership communicate important information to staff in a timely and effective manner
(47.0%). More respondents felt they had an opportunity to communicate with and provide feedback
to management and senior leadership (57.8%) and were encouraged to share ideas on improving
either service delivery or business process efficiency (53.0%).
A majority of respondents agreed that their department or agency works well with other
departments and agencies (55.5%) and their department or agency works well with business partners
outside of State Government (56.2%). There was, however, a relatively high level of “neutral”
responses, which shows respondents’ ambivalence about these statements (31.0% and 34.4%).
Table 19 Communication and Input within your Organization – All Respondents
Survey Items: Communication and Input within Your Organization All Respondents
Question % Agree % Neutral % Disagree
Q21. Management and senior leadership communicate important information to staff in a timely and effective manner. 47.0% 21.6% 31.4%
Q22. I have an opportunity to communicate with and provide feedback to management and senior leadership. 57.8% 18.7% 23.6%
Q23. I am encouraged to share ideas on improving either service delivery or business process efficiency. 53.0% 21.1% 25.9%
Q24. My department or agency works well with other departments and agencies. 55.5% 31.0% 13.4%
Q25. My department or agency works well with business partners outside of State Government. 56.2% 34.4% 9.4%
Table 20 displays percent agreement for respondents by department to survey statements for
“Communication and Input within your Organization.”
The average agreement for all respondents for the statement “Management and senior leadership
communicate important information to staff in a timely and effective manner” was 47.0%.
Departments with significantly lower than average agreement include Veterans’ Home (19.0%),
Corrections (29.9%), and Education (30.8%). Departments with significantly higher than average
agreement include Defender General (72.2%), Lottery (66.7%), and Vermont Health Access (64.9%).
The average agreement for all respondents for the statement “I have an opportunity to communicate
with and provide feedback to management and senior leadership” was 57.8%. Departments with
significantly lower than average agreement include Veterans’ Home (34.5%), Environmental
Conservation (44.7%), and Education (46.7%). Departments with significantly higher than average
agreement include Lottery (80.0%), Forests, Parks & Recreation (72.7%), and Disabilities, Aging &
Independent Living (72.4%).

23
Employee Engagement Survey Results - 2013
Table 20 Communication and Input within your Organization by Department
Survey Items: Communication and Input within Your Organization
Q21. Q22. Q23. Q24. Q25.
Department % Agree % Agree % Agree % Agree % Agree
Administration - CO 62.1% 58.6% 58.6% 65.5% 62.1%
Agriculture 40.6% 56.3% 48.4% 59.4% 64.5%
Attorney General 62.3% 67.9% 58.5% 69.8% 51.9%
Buildings & General Services 39.2% 54.4% 47.5% 51.3% 55.7%
Children & Families 47.5% 54.5% 54.1% 53.6% 52.0%
Commerce & Comm. Dev. 48.5% 60.6% 45.5% 63.6% 75.8%
Corrections 29.9% 49.2% 37.9% 39.3% 37.3%
Defender General 72.2% 72.2% 68.4% 63.2% 52.6%
Disabilities, Aging & Ind. Liv. 61.3% 72.4% 64.4% 68.6% 63.8%
Education 30.8% 46.7% 36.4% 32.1% 37.4%
Environmental Conservation 34.0% 44.7% 37.0% 48.9% 54.3%
Finance & Management 47.6% 57.1% 57.1% 47.6% 61.9%
Financial Regulation 59.3% 64.8% 66.7% 71.7% 75.9%
Fish & Wildlife 44.4% 50.0% 41.7% 63.9% 58.3%
Forests, Parks & Recreation 61.4% 72.7% 75.0% 63.6% 72.7%
Health 54.8% 64.3% 61.1% 57.5% 57.7%
Human Resources 55.2% 58.6% 65.5% 69.0% 45.6%
Human Services - CO 44.6% 63.6% 55.4% 58.7% 64.5%
Information & Innovation 52.2% 65.2% 68.9% 63.0% 67.4%
Labor 32.4% 49.3% 46.6% 45.6% 53.0%
Liquor Control 43.8% 68.8% 75.0% 56.3% 68.8%
Lottery 66.7% 80.0% 73.3% 53.3% 53.3%
Mental Health 41.5% 48.8% 53.7% 43.9% 50.0%
Military 50.0% 68.8% 75.0% 73.3% 87.5%
Motor Vehicles 55.1% 63.8% 58.0% 63.2% 55.9%
Natural Resources -CO 33.3% 53.8% 59.0% 43.6% 50.0%
Public Safety (incl VSP) 50.4% 53.3% 45.7% 61.2% 57.7%
Public Service Department 60.0% 66.7% 53.3% 78.6% 85.7%
Secretary of State 55.0% 68.4% 57.9% 68.4% 63.2%
Small Department 72.1% 83.6% 83.3% 82.0% 78.7%
Taxes 46.2% 56.9% 47.7% 50.8% 56.9%
Transportation - not DMV 51.0% 60.2% 55.0% 59.0% 61.5%
Vermont Health Access 64.9% 64.9% 66.7% 64.3% 66.1%
Veterans' Home 19.0% 34.5% 34.5% 29.3% 27.6%
Average 47.0% 57.8% 53.0% 55.5% 56.2%
Q21. Management and senior leadership communicate important information to staff in a timely and effective manner.
Q22. I have an opportunity to communicate with and provide feedback to management and senior leadership.
Q23. I am encouraged to share ideas on improving either service delivery or business process efficiency.
Q24. My department or agency works well with other departments and agencies.
Q25. My department or agency works well with business partners outside of State Government.

24
Employee Engagement Survey Results - 2013
The average agreement for all respondents for the statement “I am encouraged to share ideas on
improving either service delivery or business process efficiency” was 53.0%. Departments with
significantly lower than average agreement include Veterans’ Home (34.5%), Education (36.4%), and
Environmental Conservation (37.0%). Departments with significantly higher than average agreement
include Forests, Parks & Recreation (75.0%), Military (75.0%), and Liquor Control (75.0%).
The average agreement for all respondents for the statement “My department or agency works well
with other departments and agencies” was 55.5%. Departments with significantly lower than
average agreement include Veterans’ Home (29.3%), Education (32.1%), and Corrections (39.3%).
Departments with significantly higher than average agreement include Public Service Department
(78.6%), Military (73.3%), and Financial Regulation (71.7%).
The average agreement for all respondents for the statement “My department or agency works well
with business partners outside of State Government” was 56.2%. Departments with significantly
lower than average agreement include Veterans’ Home (27.6%), Corrections (37.3%), and Education
(37.4%). Departments with significantly higher than average agreement include Military (87.5%),
Public Service Department (85.7%), and Financial Regulation (75.9%).
Table 21 displays percent agreement for respondents by length of service to survey statements for
“Communication and Input within your Organization.” The only significant finding was that
respondents in the “less than 5 years” group tended to have higher agreement that management and
senior leadership communicate important information to staff in a timely and effective manner
(56.8%), they have an opportunity to communicate with and provide feedback to management and
senior leadership (66.5%), and they are encouraged to share ideas on improving either service
delivery or business process (61.0%), while the 15-19 years group had the lowest agreement with
these statements (36.4%, 50.1% and 44.7% respectively).
Table 21 Communication and Input within your Organization by Length of Service
Survey Items: Communication and Input within Your
Organization Length of Service
Less
than 5
years
5 - 9
years
10 - 14
years
15 -19
years
20 - 24
years
25 - 29
years
30 - 35
years
More
than 35
years
Question % Agree % Agree % Agree % Agree % Agree % Agree % Agree % Agree
Q21. Management and senior leadership communicate important information to staff in a timely and effective manner.
56.8% 43.9% 45.9% 36.4% 45.6% 42.8% 48.2% 51.8%
Q22. I have an opportunity to communicate with and provide feedback to management and senior leadership.
66.5% 54.0% 54.2% 50.1% 57.9% 57.9% 60.5% 61.4%
Q23. I am encouraged to share ideas on improving either service delivery or business process efficiency.
61.0% 51.3% 50.5% 44.7% 51.2% 49.3% 57.5% 56.1%
Q24. My department or agency works well with other departments and agencies.
59.0% 51.9% 56.5% 51.0% 56.5% 55.4% 57.8% 61.7%
Q25. My department or agency works well with business partners outside of State Government.
59.6% 55.6% 55.3% 56.2% 54.6% 54.3% 55.4% 52.4%

25
Employee Engagement Survey Results - 2013
Table 22 displays percent agreement for respondents by age group to survey statements for
“Communication and Input within your Organization.” There were no notable differences in
agreement by age group to these statements.
Table 22 Communication and Input within your Organization by Age Group
Survey Items: Communication and Input within Your
Organization Age Group
18 - 24
years
25 - 34
years
35 - 44
years
45 - 54
years
55 - 64
years
65+
years
Prefer not
to answer
Question % Agree % Agree % Agree % Agree % Agree % Agree % Agree
Q21. Management and senior leadership communicate important information to staff in a timely and effective manner.
59.1% 49.9% 47.1% 44.7% 48.0% 56.0% 32.7%
Q22. I have an opportunity to communicate with and provide feedback to management and senior leadership.
65.2% 58.1% 59.2% 57.0% 57.9% 67.4% 40.8%
Q23. I am encouraged to share ideas on improving either service delivery or business process efficiency.
62.1% 54.6% 54.9% 51.3% 53.3% 57.8% 34.7%
Q24. My department or agency works well with other departments and agencies.
54.5% 55.2% 55.0% 55.7% 56.8% 63.2% 46.9%
Q25. My department or agency works well with business partners outside of State Government.
60.0% 59.3% 56.3% 55.6% 55.6% 66.7% 44.9%
Table 23 displays percent agreement for respondents by salary range to survey statements for
“Communication and Input within your Organization.” Respondents in the “more than $75,000”
group had significantly higher agreement than any other group with all statements related to
“Communication and Input within your Organization.”
Table 23 Communication and Input within your Organization by Annual Salary Range
Survey Items: Communication and Input within Your
Organization Annual Salary Range
Less than
$25,000
$25,000 -
$34,999
$35,000 -
$44,999
$45,000 -
$54,999
$55,000 -
$64,999
$65,000 -
$74,999
More than
$75,000
Question % Agree % Agree % Agree % Agree % Agree % Agree % Agree
Q21. Management and senior leadership communicate important information to staff in a timely and effective manner.
61.8% 47.6% 46.2% 42.0% 47.0% 48.1% 68.2%
Q22. I have an opportunity to communicate with and provide feedback to management and senior leadership.
68.2% 57.4% 54.9% 55.4% 56.6% 61.0% 77.8%
Q23. I am encouraged to share ideas on improving either service delivery or business process efficiency.
58.6% 54.8% 49.7% 50.5% 50.3% 57.8% 72.2%
Q24. My department or agency works well with other departments and agencies.
58.0% 52.7% 52.6% 55.8% 51.7% 59.5% 75.8%
Q25. My department or agency works well with business partners outside of State Government.
58.6% 54.2% 56.6% 54.5% 52.5% 59.7% 72.1%
26
Employee Engagement Survey Results - 2013
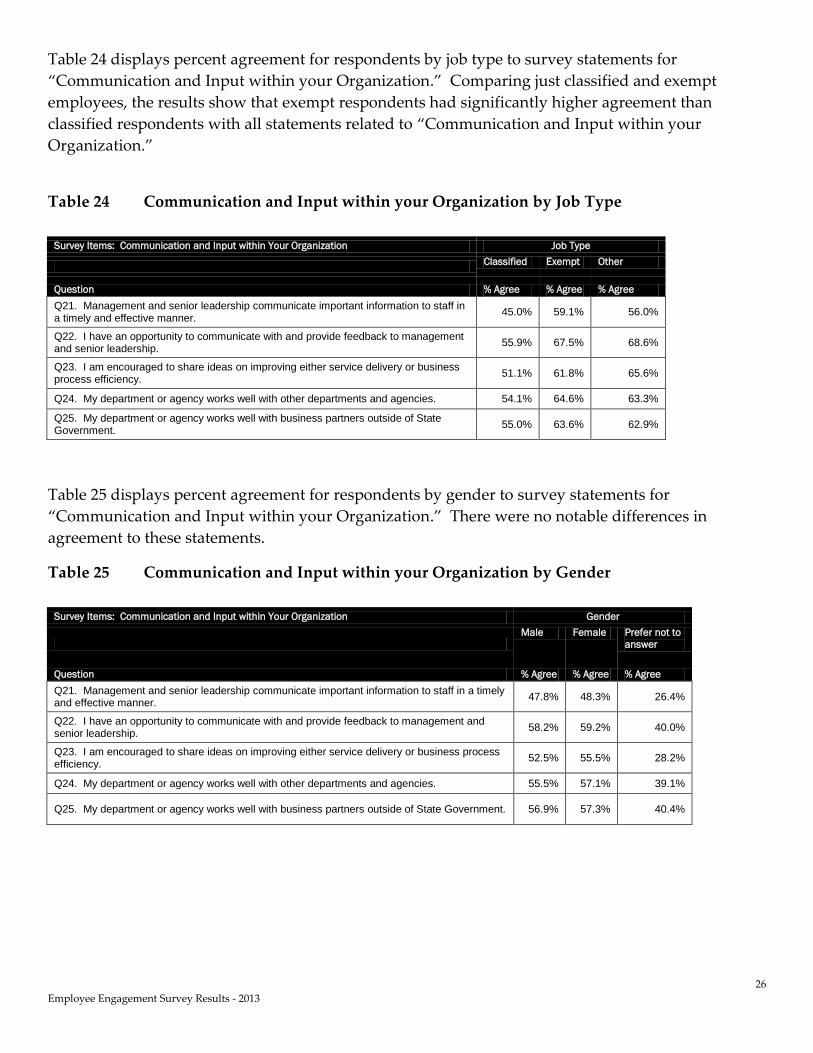
Table 24 displays percent agreement for respondents by job type to survey statements for
“Communication and Input within your Organization.” Comparing just classified and exempt
employees, the results show that exempt respondents had significantly higher agreement than
classified respondents with all statements related to “Communication and Input within your
Organization.”
Table 24 Communication and Input within your Organization by Job Type
Survey Items: Communication and Input within Your Organization Job Type
Classified Exempt Other
Question % Agree % Agree % Agree
Q21. Management and senior leadership communicate important information to staff in a timely and effective manner.
45.0% 59.1% 56.0%
Q22. I have an opportunity to communicate with and provide feedback to management and senior leadership.
55.9% 67.5% 68.6%
Q23. I am encouraged to share ideas on improving either service delivery or business process efficiency.
51.1% 61.8% 65.6%
Q24. My department or agency works well with other departments and agencies. 54.1% 64.6% 63.3%
Q25. My department or agency works well with business partners outside of State Government.
55.0% 63.6% 62.9%
Table 25 displays percent agreement for respondents by gender to survey statements for
“Communication and Input within your Organization.” There were no notable differences in
agreement to these statements.
Table 25 Communication and Input within your Organization by Gender
Survey Items: Communication and Input within Your Organization Gender
Male Female Prefer not to
answer
Question % Agree % Agree % Agree
Q21. Management and senior leadership communicate important information to staff in a timely and effective manner.
47.8% 48.3% 26.4%
Q22. I have an opportunity to communicate with and provide feedback to management and senior leadership.
58.2% 59.2% 40.0%
Q23. I am encouraged to share ideas on improving either service delivery or business process efficiency.
52.5% 55.5% 28.2%
Q24. My department or agency works well with other departments and agencies. 55.5% 57.1% 39.1%
Q25. My department or agency works well with business partners outside of State Government. 56.9% 57.3% 40.4%

27
Employee Engagement Survey Results - 2013
Table 26 displays percent agreement for respondents by bargaining unit to survey statements for
“Communication and Input within your Organization.” The Corrections Bargaining Unit
respondents had significantly lower agreement on nearly all statements related to “Communication
and Input within your Organization,” with the exception that State Police respondents also had low
agreement that they have an opportunity to communicate with and provide feedback to management
and senior leadership (47.6%).
Table 26 Communication and Input within your Organization by Bargaining Unit
Survey Items: Communication and Input within Your Organization Bargaining Unit
Non-
Management
Supervisory Corrections State
Police
Manager
and/or
Confidential
Question % Agree % Agree % Agree % Agree % Agree
Q21. Management and senior leadership communicate important information to staff in a timely and effective manner.
42.7% 55.5% 27.3% 58.3% 65.4%
Q22. I have an opportunity to communicate with and provide feedback to management and senior leadership.
52.8% 71.4% 47.5% 47.6% 74.2%
Q23. I am encouraged to share ideas on improving either service delivery or business process efficiency.
49.3% 62.1% 35.0% 42.9% 72.4%
Q24. My department or agency works well with other departments and agencies.
51.5% 62.1% 36.1% 70.2% 75.3%
Q25. My department or agency works well with business partners outside of State Government.
54.4% 62.7% 35.2% 60.7% 66.1%
Table 27 displays percent agreement for respondents by racial/ethnic group to survey statements for
“Communication and Input within your Organization.” There were no notable differences in
agreement by Racial/Ethnic group to these statements.
Table 27 Communication and Input within your Organization by Racial/Ethnic Group
Survey Items: Communication and Input within Your Organization Racial/Ethnic Group
Minority White Two or more
Races
Prefer not
to Answer
Question % Agree % Agree % Agree % Agree
Q21. Management and senior leadership communicate important information to staff in a timely and effective manner.
56.7% 48.2% 38.3% 33.0%
Q22. I have an opportunity to communicate with and provide feedback to management and senior leadership.
55.0% 58.7% 57.4% 51.1%
Q23. I am encouraged to share ideas on improving either service delivery or business process efficiency.
55.0% 54.0% 53.2% 41.0%
Q24. My department or agency works well with other departments and agencies. 52.5% 56.5% 54.3% 45.2%
Q25. My department or agency works well with business partners outside of State Government. 63.9% 56.8% 51.1% 49.7%

28
Employee Engagement Survey Results - 2013
Summary of Key Findings: Relationships and Morale in your Organization
Table 28 displays percent agreement for all respondents to survey statements for “Relationships and
Morale in your Organization.” The largest percentage of respondents disagreed that morale within
their department or agency is good (42.1%). (For further examination of morale see discussion and
Table 37 on page 34).
Over 60% of all respondents agreed that the people they work with treat each other respectfully
(62.4%) and the people they work with care about them (61.0%).
Nearly three out of four of all respondents agreed that harassment is not tolerated in their workplace
(71.2%) and discrimination is not tolerated in their workplace (74.5%). Fewer respondents agreed
that they were confident that any misconduct that they report will be handled properly (54.6%),
which had a relatively high percent disagreeing with the statement (23.4%).
Table 28 Relationships and Morale in your Organization – All Respondents
Survey Items: Relationships and Morale in Your Organization All Respondents
Question % Agree % Neutral % Disagree
Q26. Morale within my department or agency is good. 35.5% 22.4% 42.1%
Q27. The people I work with treat each other respectfully. 62.4% 19.0% 18.7%
Q28. The people I work with care about me. 61.0% 25.0% 14.0%
Q29. Harassment is not tolerated in my workplace. 71.2% 16.0% 12.8%
Q30. Discrimination is not tolerated in my workplace. 74.5% 15.8% 9.7%
Q31. I am confident that any misconduct that I report will be handled properly. 54.6% 22.0% 23.4%
Table 29 displays percent agreement for respondents by department to survey statements for
“Relationships and Morale in your Organization.”
The average agreement for all respondents for the statement “Morale within my department or
agency is good” was 35.5%. Departments with significantly lower than average agreement include
Education (13.2%), Corrections (16.8%), Environmental Conservation (20.2%), and Labor (21.2%).
Departments with significantly higher than average agreement include Forests, Parks & Recreation
(63.6%), Defender General (63.2%), and Military (62.5%).
The average agreement for all respondents for the statement “The people I work with treat each other
respectfully” was 62.4%. Departments with significantly lower than average agreement include
Veterans’ Home (28.1%), Corrections (42.5%), and Education (43.0%). Departments with significantly
higher than average agreement include Defender General (89.5%), Attorney General (88.2%), and
Commerce & Community Development (84.4%).

29
Employee Engagement Survey Results - 2013
Table 29 Relationships and Morale in your Organization by Department
Survey Items: Relationships and Morale in Your Organization
Q26. Q27. Q28. Q29. Q30. Q31.
Department % Agree % Agree % Agree % Agree % Agree % Agree
Administration - CO 51.7% 65.5% 58.6% 65.5% 72.4% 51.7%
Agriculture 31.3% 62.5% 62.5% 68.8% 68.8% 46.9%
Attorney General 54.9% 88.2% 86.5% 90.4% 90.4% 80.8%
Buildings & General Services 28.6% 48.1% 46.8% 67.5% 65.6% 46.4%
Children & Families 24.6% 56.3% 60.3% 71.2% 76.3% 51.3%
Commerce & Comm. Dev. 40.6% 84.4% 65.6% 75.0% 84.4% 53.1%
Corrections 16.8% 42.5% 41.8% 57.5% 63.1% 40.8%
Defender General 63.2% 89.5% 84.2% 89.5% 89.5% 73.7%
Disabilities, Aging & Ind. Liv. 49.5% 81.9% 79.8% 84.8% 88.5% 63.8%
Education 13.2% 43.0% 53.8% 55.1% 57.5% 38.3%
Environmental Conservation 20.2% 70.2% 68.1% 74.2% 74.2% 45.7%
Finance & Management 47.6% 57.1% 71.4% 66.7% 76.2% 47.6%
Financial Regulation 55.8% 76.9% 65.4% 75.0% 84.6% 59.6%
Fish & Wildlife 38.9% 72.2% 61.1% 75.0% 77.8% 63.9%
Forests, Parks & Recreation 63.6% 79.5% 86.0% 84.1% 90.9% 63.6%
Health 47.3% 73.8% 72.9% 78.3% 82.8% 62.4%
Human Resources 46.6% 74.1% 75.9% 86.0% 86.0% 75.4%
Human Services - CO 31.7% 66.1% 63.3% 74.2% 75.8% 51.2%
Information & Innovation 45.7% 65.2% 60.9% 71.7% 71.7% 60.9%
Labor 21.2% 45.9% 51.7% 56.2% 62.8% 39.7%
Liquor Control 31.3% 43.8% 50.0% 75.0% 75.0% 43.8%
Lottery 57.1% 57.1% 85.7% 85.7% 92.9% 78.6%
Mental Health 26.8% 70.7% 61.0% 78.0% 73.2% 61.0%
Military 62.5% 68.8% 56.3% 62.5% 81.3% 56.3%
Motor Vehicles 50.7% 65.2% 73.9% 79.7% 78.3% 50.7%
Natural Resources -CO 40.5% 70.3% 54.1% 73.7% 73.7% 55.3%
Public Safety (incl VSP) 33.9% 67.6% 62.3% 75.0% 80.8% 64.9%
Public Service Department 53.3% 73.3% 64.3% 100.0% 92.9% 66.7%
Secretary of State 30.0% 50.0% 60.0% 63.2% 70.0% 40.0%
Small Department 63.8% 72.9% 82.8% 83.1% 86.4% 83.1%
Taxes 31.3% 68.8% 65.6% 78.1% 67.2% 65.6%
Transportation - not DMV 42.1% 63.8% 57.6% 71.1% 74.1% 55.7%
Vermont Health Access 43.9% 75.4% 78.2% 66.7% 75.4% 57.1%
Veterans' Home 22.4% 28.1% 25.9% 43.1% 50.0% 36.2%
Average 35.5% 62.4% 61.0% 71.2% 74.5% 54.6%
Q26. Morale within my department or agency is good.
Q27. The people I work with treat each other respectfully.
Q28. The people I work with care about me.
Q29. Harassment is not tolerated in my workplace.
Q30. Discrimination is not tolerated in my workplace.
Q31. I am confident that any misconduct that I report will be handled properly.

30
Employee Engagement Survey Results - 2013
The average agreement for all respondents for the statement “The people I work with care about me”
was 61.0%. Departments with significantly lower than average agreement include Veterans’ Home
(25.9%), Corrections (41.8%), and Buildings & General Services (46.8%). Departments with
significantly higher than average agreement include Attorney General (86.5%), Forests, Parks &
Recreation (86.0%), and Lottery (85.7%).
The average agreement for all respondents for the statement “Harassment is not tolerated in my
workplace” was 71.2%. Departments with significantly lower than average agreement include
Veterans’ Home (43.1%), Education (55.1%), and Labor (56.2%). Departments with significantly
higher than average agreement include Public Service Department (100%), Attorney General (90.4%),
and Defender General (89.5%).
The average agreement for all respondents for the statement “Discrimination is not tolerated in my
workplace” was 74.5%. Departments with significantly lower than average agreement include
Veterans’ Home (50.0%), Education (57.5%), and Labor (62.8%). Departments with significantly
higher than average agreement include Public Service Department (92.9%), Lottery (92.9%), and
Forests, Parks & Recreation (90.9%).
The average agreement for all respondents for the statement “I am confident that any misconduct
that I report will be handled properly” was 54.6%. Departments with significantly lower than
average agreement include Veterans’ Home (36.2%), Education (38.3%), and Labor (39.7%).
Departments with significantly higher than average agreement include Attorney General (80.8%),
Lottery (78.6%), and Human Resources (75.4%).
Table 30 displays percent agreement for respondents by length of service to survey statements for
“Relationships and Morale in your Organization.” Notable is that those in the “less than 5 years” of
service tended to have higher agreement on nearly all statements related to “Relationships and
Morale in your Organization.”
Table 30 Relationships and Morale in your Organization by Length of Service
Survey Items: Relationships and Morale in Your Organization Length of Service
Less than
5 years
5 - 9
years
10 - 14
years
15 -19
years
20 - 24
years
25 - 29
years
30 - 35
years
More
than 35
years
Question % Agree % Agree % Agree % Agree % Agree % Agree % Agree % Agree
Q26. Morale within my department or agency is good. 49.1% 31.9% 33.0% 27.5% 33.6% 26.1% 32.7% 35.4%
Q27. The people I work with treat each other respectfully. 67.5% 60.4% 61.7% 56.7% 64.3% 56.1% 65.5% 68.3%
Q28. The people I work with care about me. 67.1% 61.2% 58.3% 52.6% 65.0% 54.3% 62.2% 62.2%
Q29. Harassment is not tolerated in my workplace. 77.7% 68.3% 68.3% 65.1% 70.4% 70.0% 77.6% 73.2%
Q30. Discrimination is not tolerated in my workplace. 80.4% 72.2% 71.5% 69.6% 74.7% 72.6% 80.5% 75.6%
Q31. I am confident that any misconduct that I report will be handled properly.
67.5% 49.8% 48.4% 46.1% 55.8% 51.1% 55.8% 54.9%

31
Employee Engagement Survey Results - 2013
Table 31 displays percent agreement for respondents by age group to survey statements for
“Relationships and Morale in your Organization.” The significant findings were that respondents in
the “18 – 24 years” age group had higher agreement that morale within their department or agency is
good (56.1%), that discrimination is not tolerated in their workplace (83.3%) and that they were
confident that any misconduct that they report will be handled properly (74.2%). Those in the “65+
years” age group had higher agreement that people they work with care about them (76.1%).
Table 31 Relationships and Morale in your Organization by Age Group
Survey Items: Relationships and Morale in Your Organization Age Group
18 - 24
years
25 - 34
years
35 - 44
years
45 - 54
years
55 - 64
years
65+
years
Prefer
not to
answer
Question % Agree % Agree % Agree % Agree % Agree % Agree % Agree
Q26. Morale within my department or agency is good. 56.1% 39.1% 35.1% 33.5% 35.3% 45.5% 25.0%
Q27. The people I work with treat each other respectfully. 73.8% 63.3% 60.4% 60.3% 65.5% 71.6% 45.8%
Q28. The people I work with care about me. 72.3% 64.1% 61.4% 57.2% 62.3% 76.1% 43.8%
Q29. Harassment is not tolerated in my workplace. 83.1% 73.8% 71.3% 69.5% 71.6% 73.9% 54.2%
Q30. Discrimination is not tolerated in my workplace. 83.3% 79.8% 74.8% 72.2% 74.2% 81.6% 58.3%
Q31. I am confident that any misconduct that I report will be handled properly.
74.2% 62.6% 54.4% 51.7% 52.6% 61.4% 41.7%
Table 32 displays percent agreement for respondents by annual salary range to survey statements for
“Relationships and Morale in your Organization.” Respondents in the “more than $75,000” group
had significantly higher agreement than any other group with all statements related to “Relationships
and Morale in your Organization.”
Table 32 Relationships and Morale in your Organization by Annual Salary Range
Survey Items: Relationships and Morale in Your Organization Annual Salary Range
Less than
$25,000
$25,000 -
$34,999
$35,000 -
$44,999
$45,000 -
$54,999
$55,000 -
$64,999
$65,000 -
$74,999
More than
$75,000
Question % Agree % Agree % Agree % Agree % Agree % Agree % Agree
Q26. Morale within my department or agency is good. 51.1% 42.3% 35.1% 29.1% 31.7% 38.3% 54.1%
Q27. The people I work with treat each other respectfully. 68.2% 57.1% 58.9% 59.4% 61.0% 74.0% 82.7%
Q28. The people I work with care about me. 69.0% 57.8% 60.8% 58.2% 59.5% 66.4% 78.6%
Q29. Harassment is not tolerated in my workplace. 79.5% 65.3% 70.1% 67.6% 70.4% 79.2% 88.8%
Q30. Discrimination is not tolerated in my workplace. 77.3% 70.4% 73.1% 71.7% 73.2% 82.9% 92.3%
Q31. I am confident that any misconduct that I report will be handled properly.
72.7% 54.4% 51.4% 50.4% 52.4% 58.7% 75.0%
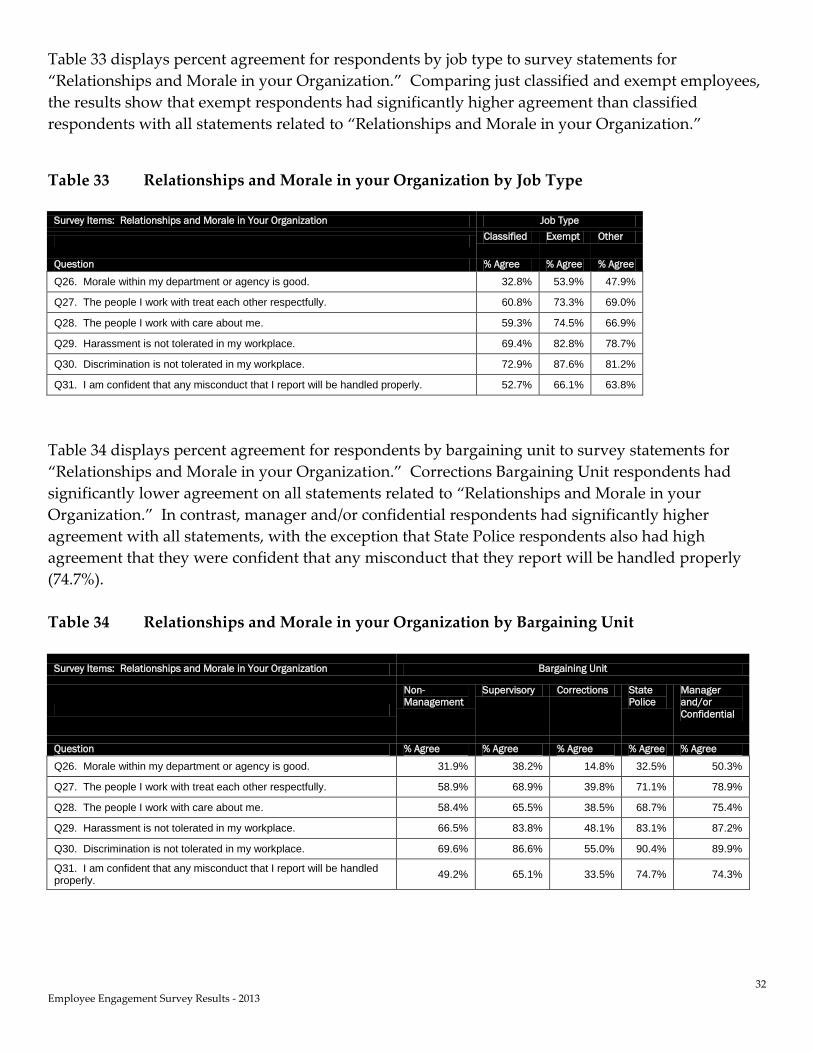
32
Employee Engagement Survey Results - 2013
Table 33 displays percent agreement for respondents by job type to survey statements for
“Relationships and Morale in your Organization.” Comparing just classified and exempt employees,
the results show that exempt respondents had significantly higher agreement than classified
respondents with all statements related to “Relationships and Morale in your Organization.”
Table 33 Relationships and Morale in your Organization by Job Type
Survey Items: Relationships and Morale in Your Organization Job Type
Classified Exempt Other
Question % Agree % Agree % Agree
Q26. Morale within my department or agency is good. 32.8% 53.9% 47.9%
Q27. The people I work with treat each other respectfully. 60.8% 73.3% 69.0%
Q28. The people I work with care about me. 59.3% 74.5% 66.9%
Q29. Harassment is not tolerated in my workplace. 69.4% 82.8% 78.7%
Q30. Discrimination is not tolerated in my workplace. 72.9% 87.6% 81.2%
Q31. I am confident that any misconduct that I report will be handled properly. 52.7% 66.1% 63.8%
Table 34 displays percent agreement for respondents by bargaining unit to survey statements for
“Relationships and Morale in your Organization.” Corrections Bargaining Unit respondents had
significantly lower agreement on all statements related to “Relationships and Morale in your
Organization.” In contrast, manager and/or confidential respondents had significantly higher
agreement with all statements, with the exception that State Police respondents also had high
agreement that they were confident that any misconduct that they report will be handled properly
(74.7%).
Table 34 Relationships and Morale in your Organization by Bargaining Unit
Survey Items: Relationships and Morale in Your Organization Bargaining Unit
Non-
Management
Supervisory Corrections State
Police
Manager
and/or
Confidential
Question % Agree % Agree % Agree % Agree % Agree
Q26. Morale within my department or agency is good. 31.9% 38.2% 14.8% 32.5% 50.3%
Q27. The people I work with treat each other respectfully. 58.9% 68.9% 39.8% 71.1% 78.9%
Q28. The people I work with care about me. 58.4% 65.5% 38.5% 68.7% 75.4%
Q29. Harassment is not tolerated in my workplace. 66.5% 83.8% 48.1% 83.1% 87.2%
Q30. Discrimination is not tolerated in my workplace. 69.6% 86.6% 55.0% 90.4% 89.9%
Q31. I am confident that any misconduct that I report will be handled properly.
49.2% 65.1% 33.5% 74.7% 74.3%

33
Employee Engagement Survey Results - 2013
Table 35 displays percent agreement for respondents by gender to survey statements for
“Relationships and Morale in your Organization.” Female respondents where significantly more
likely to agree that the people they work with care about them (64.0%) than were male respondents
(59.6%), while male respondents where significantly more likely to agree that discrimination is not
tolerated in my workplace (76.8%) than were female respondents (74.4%).
Table 35 Relationships and Morale in your Organization by Gender
Survey Items: Relationships and Morale in Your Organization Gender
Male Female Prefer not
to answer
Question % Agree % Agree % Agree
Q26. Morale within my department or agency is good. 36.9% 36.1% 16.7%
Q27. The people I work with treat each other respectfully. 64.9% 62.1% 41.7%
Q28. The people I work with care about me. 59.6% 64.0% 40.7%
Q29. Harassment is not tolerated in my workplace. 73.5% 70.8% 52.8%
Q30. Discrimination is not tolerated in my workplace. 76.8% 74.4% 56.5%
Q31. I am confident that any misconduct that I report will be handled properly. 57.8% 53.5% 38.9%
Table 36 displays percent agreement for respondents by racial/ethnic group to survey statements for
“Relationships and Morale in your Organization.” White respondents were significantly more likely
than minority respondents to agree that the people they work with care about them (62.7% and 54.1%
respectively), harassment is not tolerated in their workplace (72.4% and 62.3% respectively),
discrimination is not tolerated in my workplace (76.1% and 60.0% respectively), and they were
confident that any misconduct that they report will be handled properly (55.8% and 49.2%
respectively).
Table 36 Relationships and Morale in your Organization by Racial/Ethnic Group
Survey Items: Relationships and Morale in Your Organization Racial/Ethnic Group
Minority White Two or more
Races
Prefer not
to Answer
Question % Agree % Agree % Agree % Agree
Q26. Morale within my department or agency is good. 40.0% 36.5% 29.8% 23.9%
Q27. The people I work with treat each other respectfully. 60.0% 63.3% 61.7% 51.6%
Q28. The people I work with care about me. 54.1% 62.7% 51.1% 44.3%
Q29. Harassment is not tolerated in my workplace. 62.3% 72.4% 59.6% 59.2%
Q30. Discrimination is not tolerated in my workplace. 60.0% 76.1% 59.6% 62.0%
Q31. I am confident that any misconduct that I report will be handled properly. 49.2% 55.8% 53.2% 42.4%

34
Employee Engagement Survey Results - 2013
Morale
In Table 28 of this section the results show that the largest percentage of respondents disagreed that
morale within their department or agency is good (42.1%), and only a little more than a third of
respondents agreed with this statement (35.5%). Morale can mean different things to employees.
However, this low agreement appears to contradict other results of this survey, such as the relatively
high level of general job satisfaction – nearly 70% agreed that in general they were satisfied with their
job (69.7%; Table 66).
To further analyze this finding, responses for the “Morale within my department or agency is good”
statement were correlated with every other statement and demographic variable. Table 37 shows the
highest correlations. The strongest correlation was with “management and senior leadership
communicate important information to staff in a timely and effective manner” (.57). This shows that
morale is highly correlated with statements related to “Communication and Input with your
Organization” (Q21, Q23, Q22, Q24) and “Your Supervisor” (Q38, Q33, Q36).
Table 37 Highest Correlations with Morale Statement
Item Correlation
Q21 Management and senior leadership communicate important information to staff in a timely and effective manner. 0.57
Q31 I am confident that any misconduct that I report will be handled properly. 0.55
Q27 The people I work with treat each other respectfully. 0.54
Q23 I am encouraged to share ideas on improving either service delivery or business process efficiency. 0.53
Q22 I have an opportunity to communicate with and provide feedback to management and senior leadership. 0.50
Q57 In general, I am satisfied with my job. 0.48
Q28 The people I work with care about me. 0.46
Q24 My department or agency works well with other departments and agencies. 0.46
Q38 My supervisor provides me with the guidance and training resources that I need to improve my performance. 0.45
Q33 My supervisor regularly provides me with timely and useful feedback. 0.43
Q36 My supervisor treats employees fairly and respectfully. 0.43

35
Employee Engagement Survey Results - 2013
Summary of Key Findings: Your Supervisor
Table 38 displays percent agreement for all respondents to survey statements for “Your Supervisor.”
Generally there were relatively high levels of agreement across the range of statements, including
that the respondent’s supervisor clearly communicates to them what their job performance standards
and expectations are (66.1%), regularly provides them with timely and useful feedback (57.7%), gives
them recognition and praise when they have excelled at performing their duties (62.0%), provides
them with the autonomy to make decisions when it’s appropriate (75.6%), treats employees fairly and
respectfully (70.3%), and seems to care about them as a person (72.6%).
To a lesser extent, all respondents agreed that their supervisor provides them with the guidance and
training resources they need to improve their performance (59.5%).
For all respondents, 55.9% agreed that their performance evaluations are completed annually, with a
relatively high percent disagreeing with the statement (27.3%).
Table 38 Your Supervisor – All Respondents
Survey Items: Your Supervisor All Respondents
Question % Agree % Neutral % Disagree
Q32. My supervisor clearly communicates to me what my job performance standards and expectations are. 66.1% 16.1% 17.7%
Q33. My supervisor regularly provides me with timely and useful feedback. 57.7% 20.1% 22.2%
Q34. My supervisor gives me recognition and praise when I have excelled at performing my duties. 62.0% 17.6% 20.4%
Q35. My supervisor provides me with the autonomy to make decisions when it’s appropriate. 75.6% 12.6% 11.8%
Q36. My supervisor treats employees fairly and respectfully. 70.3% 15.3% 14.4%
Q37. My supervisor seems to care about me as a person. 72.6% 15.6% 11.9%
Q38. My supervisor provides me with the guidance and training resources that I need to improve my performance. 59.5% 21.3% 19.3%
Q39. My performance evaluations are completed annually. 55.9% 16.8% 27.3%
Table 39 displays percent agreement for respondents by department to survey statements for “Your
Supervisor.”
The average agreement for all respondents for the statement “My supervisor clearly communicates to
me what my job performance standards and expectations are” was 66.1%. Departments with
significantly lower than average agreement include Veterans’ Home (43.6%), Labor (46.6%), and
Mental Health (53.7%). Departments with significantly higher than average agreement include
Defender General (89.5%), Lottery (85.7%), and Attorney General (80.8%).

36
Employee Engagement Survey Results - 2013
Table 39 Your Supervisor by Department
Survey Items: Your Supervisor
Q32. Q33. Q34. Q35. Q36. Q37. Q38. Q39.
Department % Agree % Agree % Agree % Agree % Agree % Agree % Agree % Agree
Administration - CO 69.0% 58.6% 65.5% 78.6% 75.9% 65.5% 62.1% 61.5%
Agriculture 71.9% 68.8% 68.8% 90.6% 78.1% 84.4% 62.5% 38.7%
Attorney General 80.8% 67.3% 76.5% 82.7% 84.6% 84.6% 69.2% 40.0%
Buildings & General Services 60.4% 51.0% 56.5% 69.5% 61.0% 63.6% 55.8% 63.2%
Children & Families 67.9% 59.9% 65.2% 76.2% 75.1% 79.4% 58.9% 42.3%
Commerce & Comm. Dev. 75.0% 56.3% 75.0% 84.4% 78.1% 81.3% 59.4% 65.6%
Corrections 59.5% 49.6% 52.3% 66.7% 61.9% 59.5% 52.7% 40.2%
Defender General 89.5% 78.9% 84.2% 94.7% 84.2% 94.7% 78.9% 84.2%
Disabilities, Aging & Ind. Liv. 77.7% 68.3% 76.9% 89.3% 82.5% 89.2% 66.3% 64.1%
Education 54.2% 46.7% 47.6% 64.2% 55.1% 66.4% 45.8% 30.8%
Environmental Conservation 66.7% 55.9% 66.7% 77.4% 77.4% 80.6% 47.8% 55.4%
Finance & Management 66.7% 47.6% 57.1% 61.9% 52.4% 85.0% 55.0% 21.1%
Financial Regulation 76.9% 72.5% 70.6% 84.6% 78.4% 82.4% 73.1% 68.6%
Fish & Wildlife 58.3% 47.2% 58.3% 72.2% 75.0% 72.2% 52.8% 61.8%
Forests, Parks & Recreation 68.2% 61.4% 75.0% 90.9% 79.5% 81.8% 65.9% 79.5%
Health 75.1% 67.4% 71.9% 83.3% 80.5% 81.2% 70.6% 82.2%
Human Resources 58.9% 50.9% 64.9% 73.7% 73.7% 73.7% 51.8% 37.5%
Human Services - CO 55.4% 50.4% 52.1% 73.6% 65.5% 69.2% 57.0% 34.5%
Information & Innovation 56.5% 50.0% 56.5% 80.4% 69.6% 60.9% 60.9% 30.4%
Labor 46.6% 39.7% 48.6% 63.0% 54.1% 61.4% 40.7% 19.2%
Liquor Control 56.3% 43.8% 75.0% 87.5% 62.5% 81.3% 50.0% 50.0%
Lottery 85.7% 85.7% 78.6% 92.9% 78.6% 85.7% 78.6% 71.4%
Mental Health 53.7% 53.7% 48.8% 68.3% 63.4% 70.0% 56.1% 14.6%
Military 68.8% 56.3% 56.3% 93.8% 81.3% 81.3% 68.8% 43.8%
Motor Vehicles 72.5% 62.3% 66.7% 73.9% 73.9% 73.9% 69.6% 91.3%
Natural Resources -CO 68.4% 56.8% 60.5% 81.1% 68.4% 81.6% 57.9% 55.6%
Public Safety (incl VSP) 70.6% 61.2% 63.7% 76.6% 71.0% 69.3% 61.3% 53.9%
Public Service Department 78.6% 60.0% 46.7% 86.7% 85.7% 78.6% 66.7% 53.3%
Secretary of State 70.0% 80.0% 68.4% 65.0% 70.0% 75.0% 55.0% 78.9%
Small Department 71.2% 59.3% 78.0% 83.1% 83.1% 84.5% 67.8% 43.1%
Taxes 67.2% 60.9% 60.9% 76.6% 70.3% 75.0% 57.8% 45.3%
Transportation - not DMV 70.1% 62.5% 62.0% 77.8% 71.6% 72.7% 65.6% 83.1%
Vermont Health Access 66.7% 61.4% 71.9% 78.9% 76.8% 71.4% 71.4% 56.4%
Veterans' Home 43.6% 32.7% 35.2% 40.0% 34.5% 36.4% 22.2% 43.6%
Average 66.1% 57.7% 62.0% 75.6% 70.3% 72.6% 59.5% 55.9%
Q32. My supervisor clearly communicates to me what my job performance standards and expectations are.
Q33. My supervisor regularly provides me with timely and useful feedback.
Q34. My supervisor gives me recognition and praise when I have excelled at performing my duties.
Q35. My supervisor provides me with the autonomy to make decisions when it’s appropriate.
Q36. My supervisor treats employees fairly and respectfully.
Q37. My supervisor seems to care about me as a person.
Q38. My supervisor provides me with the guidance and training resources that I need to improve my performance.
Q39. My performance evaluations are completed annually.

37
Employee Engagement Survey Results - 2013
The average agreement for all respondents for the statement “My supervisor regularly provides me
with timely and useful feedback” was 57.7%. Departments with significantly lower than average
agreement include Veterans’ Home (32.7%), Labor (39.7%), and Liquor Control (43.8%). Departments
with significantly higher than average agreement include Lottery (85.7%), Secretary of State (80.0%),
Defender General (78.9%).
The average agreement for all respondents for the statement “My supervisor gives me recognition
and praise when I have excelled at performing my duties” was 62.0%. Departments with
significantly lower than average agreement include Veterans’ Home (35.2%), Public Service
Department (46.7%), and Education (47.6%). Departments with significantly higher than average
agreement include Defender General (84.2%), Lottery (78.6%), and Disabilities, Aging & Independent
Living (76.9%).
The average agreement for all respondents for the statement “My supervisor provides me with the
autonomy to make decisions when it’s appropriate” was 75.6%. Departments with significantly
lower than average agreement include Veterans’ Home (40.0%), Finance & Management (61.9%), and
Labor (63.0%). Departments with significantly higher than average agreement include Defender
General (94.7%), Military (93.8%), and Lottery (92.9%).
The average agreement for all respondents for the statement “My supervisor treats employees fairly
and respectfully” was 70.3%. Departments with significantly lower than average agreement include
Veterans’ Home (34.5%), Finance & Management (52.4%), and Labor (54.1%). Departments with
significantly higher than average agreement include Public Service Department (85.7%), Attorney
General (84.6%), and Defender General (84.2%).
The average agreement for all respondents for the statement “My supervisor seems to care about me
as a person” was 72.6%. Departments with significantly lower than average agreement include
Veterans’ Home (36.4%), Corrections (59.5%), and Information & Innovation (60.9%). Departments
with significantly higher than average agreement include Defender General (94.7%), Disabilities,
Aging & Independent Living (89.2%), and Lottery (85.7%).
The average agreement for all respondents for the statement “My supervisor provides me with the
guidance and training resources that I need to improve my performance” was 59.5%. Departments
with significantly lower than average agreement include Veterans’ Home (22.2%), Labor (40.7%), and
Education (45.8%). Departments with significantly higher than average agreement include Defender
General (78.9%), Lottery (78.6%), and Financial Regulation (73.1%).
The average agreement for all respondents for the statement “My performance evaluations are
completed annually” was 55.9%. Departments with significantly lower than average agreement
include Mental Health (14.6%), Labor (19.2%), and Finance & Management (21.1%). Departments
with significantly higher than average agreement include Motor Vehicles (91.3%), Defender General
(84.2%), and Transportation (not Motor Vehicles) (83.1%).

38
Employee Engagement Survey Results - 2013
Table 40 displays percent agreement for respondents by length of service to survey statements for
“Your Supervisor.” The only significant finding was that respondents in the “less than 5 years”
group tended to have higher agreement on several of the statements related to “Your Supervisor,”
including that their supervisor regularly provides them with timely and useful feedback (66.1%),
their supervisor gives them recognition and praise when they have excelled at performing their
duties (69.6%), their supervisor treats employees fairly and respectfully (76.6%), their supervisor
seems to care about them as a person (77.3%), and their supervisor provides them with the guidance
and training resources that they need to improve their performance (66.1%).
Table 40 Your Supervisor by Length of Service
Survey Items: Your Supervisor Length of Service
Less
than 5
years
5 - 9
years
10 - 14
years
15 -19
years
20 - 24
years
25 - 29
years
30 - 35
years
More
than 35
years
Question % Agree % Agree % Agree % Agree % Agree % Agree % Agree % Agree
Q32. My supervisor clearly communicates to me what my job performance standards and expectations are.
71.2% 65.4% 65.4% 62.8% 65.3% 62.6% 62.2% 65.9%
Q33. My supervisor regularly provides me with timely and useful feedback.
66.1% 55.7% 57.5% 48.2% 56.4% 54.3% 56.7% 53.7%
Q34. My supervisor gives me recognition and praise when I have excelled at performing my duties.
69.6% 60.5% 61.0% 56.1% 60.3% 58.0% 59.8% 56.1%
Q35. My supervisor provides me with the autonomy to make decisions when it’s appropriate.
79.1% 75.9% 72.5% 73.1% 74.9% 71.4% 76.8% 84.1%
Q36. My supervisor treats employees fairly and respectfully.
76.6% 69.0% 68.8% 64.9% 68.0% 66.1% 71.3% 74.4%
Q37. My supervisor seems to care about me as a person. 77.3% 72.9% 71.6% 68.7% 72.6% 66.1% 73.0% 69.5%
Q38. My supervisor provides me with the guidance and training resources that I need to improve my performance.
66.1% 56.0% 59.2% 56.3% 59.1% 56.7% 57.7% 54.3%
Q39. My performance evaluations are completed annually. 60.5% 51.8% 60.6% 56.6% 55.2% 51.5% 43.2% 56.8%
Table 41 displays percent agreement for respondents by age group to survey statements for “Your
Supervisor.” The significant finding was that respondents in the “18 – 24 years” age group had
higher agreement for several statements related to “Your Supervisor,” including that their supervisor
clearly communicates to them what their job performance standards and expectations are (80.3%),
their supervisor regularly provides them with timely and useful feedback (77.3%), their supervisor
gives them recognition and praise when they have excelled at performing their duties (72.7%), their
supervisor provides them with the guidance and training resources that they need to improve their
performance (78.8%), and their performance evaluations are completed annually (68.8%).
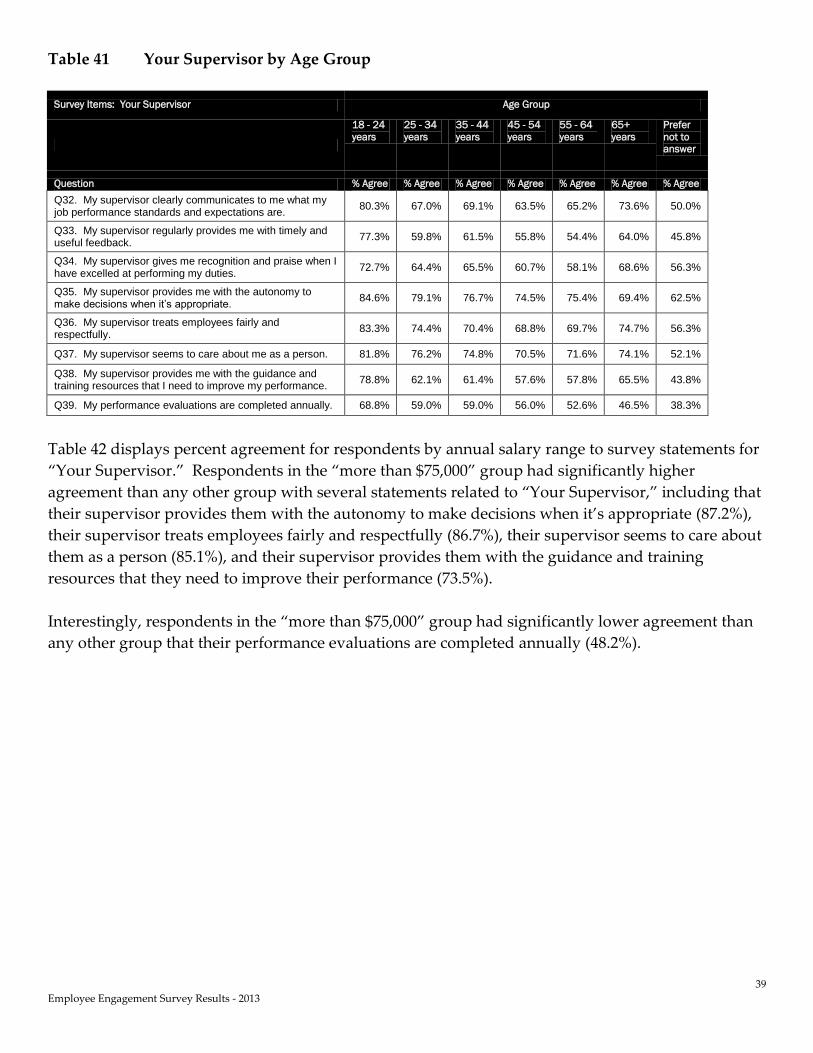
39
Employee Engagement Survey Results - 2013
Table 41 Your Supervisor by Age Group
Survey Items: Your Supervisor Age Group
18 - 24
years
25 - 34
years
35 - 44
years
45 - 54
years
55 - 64
years
65+
years
Prefer
not to
answer
Question % Agree % Agree % Agree % Agree % Agree % Agree % Agree
Q32. My supervisor clearly communicates to me what my job performance standards and expectations are.
80.3% 67.0% 69.1% 63.5% 65.2% 73.6% 50.0%
Q33. My supervisor regularly provides me with timely and useful feedback.
77.3% 59.8% 61.5% 55.8% 54.4% 64.0% 45.8%
Q34. My supervisor gives me recognition and praise when I have excelled at performing my duties.
72.7% 64.4% 65.5% 60.7% 58.1% 68.6% 56.3%
Q35. My supervisor provides me with the autonomy to make decisions when it’s appropriate.
84.6% 79.1% 76.7% 74.5% 75.4% 69.4% 62.5%
Q36. My supervisor treats employees fairly and respectfully.
83.3% 74.4% 70.4% 68.8% 69.7% 74.7% 56.3%
Q37. My supervisor seems to care about me as a person. 81.8% 76.2% 74.8% 70.5% 71.6% 74.1% 52.1%
Q38. My supervisor provides me with the guidance and training resources that I need to improve my performance.
78.8% 62.1% 61.4% 57.6% 57.8% 65.5% 43.8%
Q39. My performance evaluations are completed annually. 68.8% 59.0% 59.0% 56.0% 52.6% 46.5% 38.3%
Table 42 displays percent agreement for respondents by annual salary range to survey statements for
“Your Supervisor.” Respondents in the “more than $75,000” group had significantly higher
agreement than any other group with several statements related to “Your Supervisor,” including that
their supervisor provides them with the autonomy to make decisions when it’s appropriate (87.2%),
their supervisor treats employees fairly and respectfully (86.7%), their supervisor seems to care about
them as a person (85.1%), and their supervisor provides them with the guidance and training
resources that they need to improve their performance (73.5%).
Interestingly, respondents in the “more than $75,000” group had significantly lower agreement than
any other group that their performance evaluations are completed annually (48.2%).
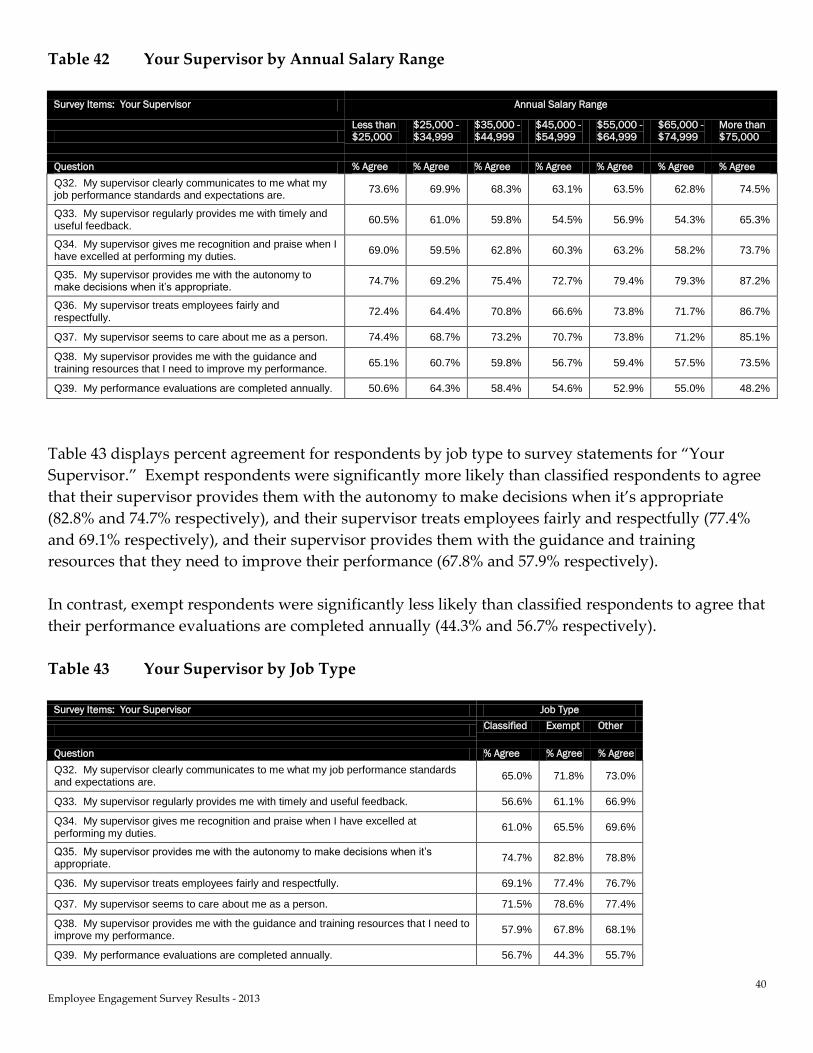
40
Employee Engagement Survey Results - 2013
Table 42 Your Supervisor by Annual Salary Range
Survey Items: Your Supervisor Annual Salary Range
Less than
$25,000
$25,000 -
$34,999
$35,000 -
$44,999
$45,000 -
$54,999
$55,000 -
$64,999
$65,000 -
$74,999
More than
$75,000
Question % Agree % Agree % Agree % Agree % Agree % Agree % Agree
Q32. My supervisor clearly communicates to me what my job performance standards and expectations are.
73.6% 69.9% 68.3% 63.1% 63.5% 62.8% 74.5%
Q33. My supervisor regularly provides me with timely and useful feedback.
60.5% 61.0% 59.8% 54.5% 56.9% 54.3% 65.3%
Q34. My supervisor gives me recognition and praise when I have excelled at performing my duties.
69.0% 59.5% 62.8% 60.3% 63.2% 58.2% 73.7%
Q35. My supervisor provides me with the autonomy to make decisions when it’s appropriate.
74.7% 69.2% 75.4% 72.7% 79.4% 79.3% 87.2%
Q36. My supervisor treats employees fairly and respectfully.
72.4% 64.4% 70.8% 66.6% 73.8% 71.7% 86.7%
Q37. My supervisor seems to care about me as a person. 74.4% 68.7% 73.2% 70.7% 73.8% 71.2% 85.1%
Q38. My supervisor provides me with the guidance and training resources that I need to improve my performance.
65.1% 60.7% 59.8% 56.7% 59.4% 57.5% 73.5%
Q39. My performance evaluations are completed annually. 50.6% 64.3% 58.4% 54.6% 52.9% 55.0% 48.2%
Table 43 displays percent agreement for respondents by job type to survey statements for “Your
Supervisor.” Exempt respondents were significantly more likely than classified respondents to agree
that their supervisor provides them with the autonomy to make decisions when it’s appropriate
(82.8% and 74.7% respectively), and their supervisor treats employees fairly and respectfully (77.4%
and 69.1% respectively), and their supervisor provides them with the guidance and training
resources that they need to improve their performance (67.8% and 57.9% respectively).
In contrast, exempt respondents were significantly less likely than classified respondents to agree that
their performance evaluations are completed annually (44.3% and 56.7% respectively).
Table 43 Your Supervisor by Job Type
Survey Items: Your Supervisor Job Type
Classified Exempt Other
Question % Agree % Agree % Agree
Q32. My supervisor clearly communicates to me what my job performance standards and expectations are.
65.0% 71.8% 73.0%
Q33. My supervisor regularly provides me with timely and useful feedback. 56.6% 61.1% 66.9%
Q34. My supervisor gives me recognition and praise when I have excelled at performing my duties.
61.0% 65.5% 69.6%
Q35. My supervisor provides me with the autonomy to make decisions when it’s appropriate.
74.7% 82.8% 78.8%
Q36. My supervisor treats employees fairly and respectfully. 69.1% 77.4% 76.7%
Q37. My supervisor seems to care about me as a person. 71.5% 78.6% 77.4%
Q38. My supervisor provides me with the guidance and training resources that I need to improve my performance.
57.9% 67.8% 68.1%
Q39. My performance evaluations are completed annually. 56.7% 44.3% 55.7%

41
Employee Engagement Survey Results - 2013
Table 44 displays percent agreement for respondents by bargaining unit to survey statements for
“Your Supervisor.” The Corrections Bargaining Unit respondents had significantly lower agreement
on all statements.
State Police Bargaining Unit respondents had significantly higher agreement that their supervisor
clearly communicates to them what their job performance standards and expectations are (79.5%),
their supervisor regularly provides them with timely and useful feedback (72.3%), their supervisor
provides them with the guidance and training resources that they need to improve their performance
(71.1%), and their performance evaluations are completed annually (89.0%).
Manager and/or confidential respondents had significantly higher agreement that their supervisor
provides them with the autonomy to make decisions when it’s appropriate (86.0%), their supervisor
treats employees fairly and respectfully (84.4%), and their supervisor seems to care about them as a
person (82.5%).
Table 44 Your Supervisor by Bargaining Unit
Survey Items: Your Supervisor Bargaining Unit
Non-
Management
Supervisory Corrections State
Police
Manager
and/or
Confidential
Question % Agree % Agree % Agree % Agree % Agree
Q32. My supervisor clearly communicates to me what my job performance standards and expectations are.
64.4% 67.0% 59.3% 79.5% 69.7%
Q33. My supervisor regularly provides me with timely and useful feedback.
55.8% 61.2% 48.4% 72.3% 63.7%
Q34. My supervisor gives me recognition and praise when I have excelled at performing my duties.
59.8% 67.3% 49.5% 69.9% 73.2%
Q35. My supervisor provides me with the autonomy to make decisions when it’s appropriate.
72.7% 82.4% 64.8% 80.7% 86.0%
Q36. My supervisor treats employees fairly and respectfully. 66.8% 78.9% 60.2% 74.7% 84.4%
Q37. My supervisor seems to care about me as a person. 70.7% 78.6% 56.9% 73.2% 82.5%
Q38. My supervisor provides me with the guidance and training resources that I need to improve my performance.
56.4% 62.4% 52.7% 71.1% 68.5%
Q39. My performance evaluations are completed annually. 57.9% 58.8% 41.8% 89.0% 45.5%
Table 45 displays percent agreement for respondents by gender to survey statements for “Your
Supervisor.” Female respondents where significantly more likely to agree that their supervisor seems
to care about them as a person (75.2% and 70.7% respectively), while male respondents where
significantly more likely to agree that their performance evaluations are completed annually 60.5%
and 53.0% respectively).
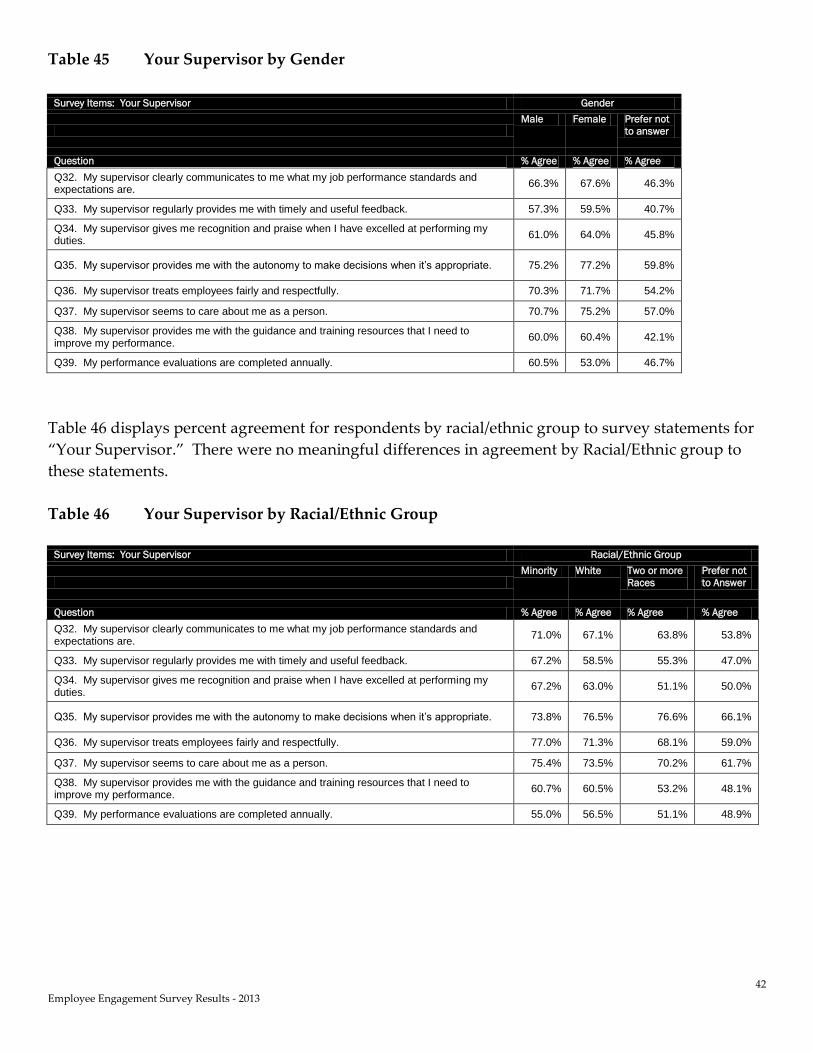
42
Employee Engagement Survey Results - 2013
Table 45 Your Supervisor by Gender
Survey Items: Your Supervisor Gender
Male Female Prefer not
to answer
Question % Agree % Agree % Agree
Q32. My supervisor clearly communicates to me what my job performance standards and expectations are.
66.3% 67.6% 46.3%
Q33. My supervisor regularly provides me with timely and useful feedback. 57.3% 59.5% 40.7%
Q34. My supervisor gives me recognition and praise when I have excelled at performing my duties.
61.0% 64.0% 45.8%
Q35. My supervisor provides me with the autonomy to make decisions when it’s appropriate. 75.2% 77.2% 59.8%
Q36. My supervisor treats employees fairly and respectfully. 70.3% 71.7% 54.2%
Q37. My supervisor seems to care about me as a person. 70.7% 75.2% 57.0%
Q38. My supervisor provides me with the guidance and training resources that I need to improve my performance.
60.0% 60.4% 42.1%
Q39. My performance evaluations are completed annually. 60.5% 53.0% 46.7%
Table 46 displays percent agreement for respondents by racial/ethnic group to survey statements for
“Your Supervisor.” There were no meaningful differences in agreement by Racial/Ethnic group to
these statements.
Table 46 Your Supervisor by Racial/Ethnic Group
Survey Items: Your Supervisor Racial/Ethnic Group
Minority White Two or more
Races
Prefer not
to Answer
Question % Agree % Agree % Agree % Agree
Q32. My supervisor clearly communicates to me what my job performance standards and expectations are.
71.0% 67.1% 63.8% 53.8%
Q33. My supervisor regularly provides me with timely and useful feedback. 67.2% 58.5% 55.3% 47.0%
Q34. My supervisor gives me recognition and praise when I have excelled at performing my duties.
67.2% 63.0% 51.1% 50.0%
Q35. My supervisor provides me with the autonomy to make decisions when it’s appropriate. 73.8% 76.5% 76.6% 66.1%
Q36. My supervisor treats employees fairly and respectfully. 77.0% 71.3% 68.1% 59.0%
Q37. My supervisor seems to care about me as a person. 75.4% 73.5% 70.2% 61.7%
Q38. My supervisor provides me with the guidance and training resources that I need to improve my performance.
60.7% 60.5% 53.2% 48.1%
Q39. My performance evaluations are completed annually. 55.0% 56.5% 51.1% 48.9%

43
Employee Engagement Survey Results - 2013
Summary of Key Findings: Workload, Staffing and Resources
Table 47 displays percent agreement for all respondents to survey statements for “Workload, Staffing
and Resources.” The highest percentage of respondents disagreed that their department or agency
has the staffing and resources necessary to achieve its mission (48.3%).
A majority of all respondents agreed that the amount of work they are expected to perform is
reasonable (50.8%) and that their job and work environment allow for a good balance between work
and their personal life (54.0%).
A somewhat higher percentage of all respondents agreed that they have the materials and tools that
they need to perform their duties effectively (60.3%) and that their department or agency provides
them with the technology needed to perform their duties effectively (59.6%).
Approximately two out of three of all respondents agreed that their work site is well maintained and
meets their needs (65.3%) and that they feel safe and secure in their work environment (73.7%).
Table 47 Workload, Staffing and Resources – All Respondents
Survey Items: Workload, Staffing and Resources All Respondents
Question % Agree % Neutral % Disagree
Q40. My department or agency has the staffing and resources necessary to achieve its mission. 32.2% 19.5% 48.3%
Q41. The amount of work I am expected to perform is reasonable. 50.8% 20.3% 28.9%
Q42. My job and work environment allow for a good balance between work and my personal life. 54.0% 21.5% 24.5%
Q43. I have the materials and tools that I need to perform my duties effectively. 60.3% 19.0% 20.7%
Q44. My department or agency provides me with the technology needed to perform my duties effectively. 59.6% 17.4% 23.0%
Q45. My work site is well maintained and meets my needs. 65.3% 18.2% 16.4%
Q46. I feel safe and secure in my work environment. 73.7% 15.2% 11.2%
Table 48 displays percent agreement for respondents by department to survey statements for
“Workload, Staffing and Resources.”
The average agreement for all respondents for the statement “My department or agency has the
staffing and resources necessary to achieve its mission” was 32.2%. Departments with significantly
lower than average agreement include Forests, Parks & Recreation (9.1%), Liquor Control (12.5%),
and Environmental Conservation (15.2%). Departments with significantly higher than average
agreement include Lottery (71.4%), Financial Regulation (68.6%), and Finance & Management
(60.0%).
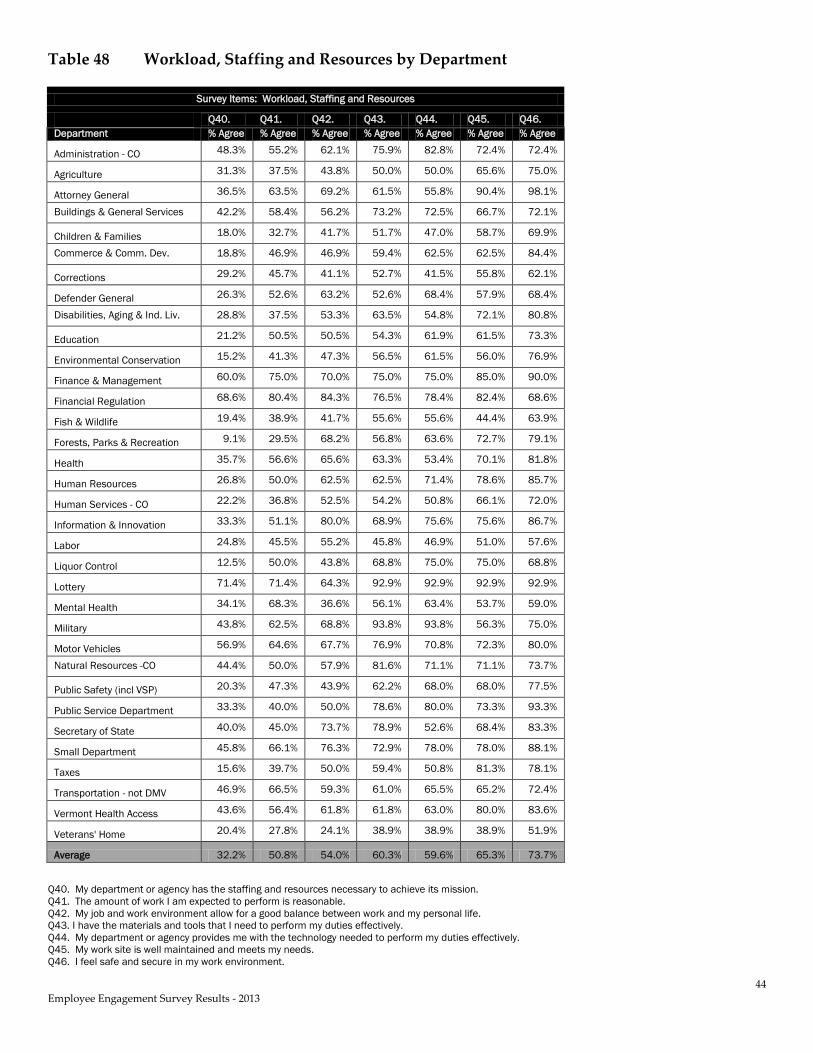
44
Employee Engagement Survey Results - 2013
Table 48 Workload, Staffing and Resources by Department
Survey Items: Workload, Staffing and Resources
Q40. Q41. Q42. Q43. Q44. Q45. Q46.
Department % Agree % Agree % Agree % Agree % Agree % Agree % Agree
Administration - CO 48.3% 55.2% 62.1% 75.9% 82.8% 72.4% 72.4%
Agriculture 31.3% 37.5% 43.8% 50.0% 50.0% 65.6% 75.0%
Attorney General 36.5% 63.5% 69.2% 61.5% 55.8% 90.4% 98.1%
Buildings & General Services 42.2% 58.4% 56.2% 73.2% 72.5% 66.7% 72.1%
Children & Families 18.0% 32.7% 41.7% 51.7% 47.0% 58.7% 69.9%
Commerce & Comm. Dev. 18.8% 46.9% 46.9% 59.4% 62.5% 62.5% 84.4%
Corrections 29.2% 45.7% 41.1% 52.7% 41.5% 55.8% 62.1%
Defender General 26.3% 52.6% 63.2% 52.6% 68.4% 57.9% 68.4%
Disabilities, Aging & Ind. Liv. 28.8% 37.5% 53.3% 63.5% 54.8% 72.1% 80.8%
Education 21.2% 50.5% 50.5% 54.3% 61.9% 61.5% 73.3%
Environmental Conservation 15.2% 41.3% 47.3% 56.5% 61.5% 56.0% 76.9%
Finance & Management 60.0% 75.0% 70.0% 75.0% 75.0% 85.0% 90.0%
Financial Regulation 68.6% 80.4% 84.3% 76.5% 78.4% 82.4% 68.6%
Fish & Wildlife 19.4% 38.9% 41.7% 55.6% 55.6% 44.4% 63.9%
Forests, Parks & Recreation 9.1% 29.5% 68.2% 56.8% 63.6% 72.7% 79.1%
Health 35.7% 56.6% 65.6% 63.3% 53.4% 70.1% 81.8%
Human Resources 26.8% 50.0% 62.5% 62.5% 71.4% 78.6% 85.7%
Human Services - CO 22.2% 36.8% 52.5% 54.2% 50.8% 66.1% 72.0%
Information & Innovation 33.3% 51.1% 80.0% 68.9% 75.6% 75.6% 86.7%
Labor 24.8% 45.5% 55.2% 45.8% 46.9% 51.0% 57.6%
Liquor Control 12.5% 50.0% 43.8% 68.8% 75.0% 75.0% 68.8%
Lottery 71.4% 71.4% 64.3% 92.9% 92.9% 92.9% 92.9%
Mental Health 34.1% 68.3% 36.6% 56.1% 63.4% 53.7% 59.0%
Military 43.8% 62.5% 68.8% 93.8% 93.8% 56.3% 75.0%
Motor Vehicles 56.9% 64.6% 67.7% 76.9% 70.8% 72.3% 80.0%
Natural Resources -CO 44.4% 50.0% 57.9% 81.6% 71.1% 71.1% 73.7%
Public Safety (incl VSP) 20.3% 47.3% 43.9% 62.2% 68.0% 68.0% 77.5%
Public Service Department 33.3% 40.0% 50.0% 78.6% 80.0% 73.3% 93.3%
Secretary of State 40.0% 45.0% 73.7% 78.9% 52.6% 68.4% 83.3%
Small Department 45.8% 66.1% 76.3% 72.9% 78.0% 78.0% 88.1%
Taxes 15.6% 39.7% 50.0% 59.4% 50.8% 81.3% 78.1%
Transportation - not DMV 46.9% 66.5% 59.3% 61.0% 65.5% 65.2% 72.4%
Vermont Health Access 43.6% 56.4% 61.8% 61.8% 63.0% 80.0% 83.6%
Veterans' Home 20.4% 27.8% 24.1% 38.9% 38.9% 38.9% 51.9%
Average 32.2% 50.8% 54.0% 60.3% 59.6% 65.3% 73.7%
Q40. My department or agency has the staffing and resources necessary to achieve its mission.
Q41. The amount of work I am expected to perform is reasonable.
Q42. My job and work environment allow for a good balance between work and my personal life.
Q43. I have the materials and tools that I need to perform my duties effectively.
Q44. My department or agency provides me with the technology needed to perform my duties effectively.
Q45. My work site is well maintained and meets my needs.
Q46. I feel safe and secure in my work environment.
45
Employee Engagement Survey Results - 2013
The average agreement for all respondents for the statement “The amount of work I am expected to
perform is reasonable” was 50.8%. Departments with significantly lower than average agreement
include Veterans’ Home (27.8%), Forests, Parks & Recreation (29.5%), and Children & Families
(32.7%). Departments with significantly higher than average agreement include Financial Regulation
(80.4%), Finance & Management (75.0%), and Lottery (71.4%).
The average agreement for all respondents for the statement “My job and work environment allow
for a good balance between work and my personal life” was 54.0%. Departments with significantly
lower than average agreement include Veterans’ Home (24.1%), Mental Health (36.6%), Corrections
(41.1%) and Children & Families (41.7%). Departments with significantly higher than average
agreement include Financial Regulation (84.3%), Information & Innovation (80.0%), and Secretary of
State (73.7%).
The average agreement for all respondents for the statement “I have the materials and tools that I
need to perform my duties effectively” was 60.3%. Departments with significantly lower than
average agreement include Veterans’ Home (38.9%), Labor (45.8%), and Agriculture (50.0%).
Departments with significantly higher than average agreement include Military (93.8%), Lottery
(92.9%), and Natural Resources – Central Office (81.6%).
The average agreement for all respondents for the statement “My department or agency provides me
with the technology needed to perform my duties effectively” was 59.6%. Departments with
significantly lower than average agreement include Veterans’ Home (38.9%), Corrections (41.5%),
Labor (46.9%), and Children & Families (47.0%). Departments with significantly higher than average
agreement include Military (93.8%), Lottery (92.9%), and Administration – Central Office (82.8%).
The average agreement for all respondents for the statement “My work site is well maintained and
meets my needs” was 65.3%. Departments with significantly lower than average agreement include
Veterans’ Home (38.9%), Fish & Wildlife (44.4%), and Labor (51.0%). Departments with significantly
higher than average agreement include Lottery (92.9%), Attorney General (90.4%), and Finance &
Management (85.0%).
The average agreement for all respondents for the statement “I feel safe and secure in my work
environment” was 73.7%. Departments with significantly lower than average agreement include
Veterans’ Home (51.9%), Labor (57.6%), and Mental Health (59.0%). Departments with significantly
higher than average agreement include Attorney General (98.1%), Public Service Department (93.3%),
and Lottery (92.9%).

46
Employee Engagement Survey Results - 2013
Table 49 displays percent agreement for respondents by length of service to survey statements for
“Workload, Staffing and Resources.” There were no statistically meaningful differences in agreement
by length of service to these statements.
Table 49 Workload, Staffing and Resources by Length of Service
Survey Items: Workload, Staffing and Resources Length of Service
Less
than 5
years
5 - 9
years
10 - 14
years
15 -19
years
20 - 24
years
25 - 29
years
30 - 35
years
More
than 35
years
Question % Agree % Agree % Agree % Agree % Agree % Agree % Agree % Agree
Q40. My department or agency has the staffing and resources necessary to achieve its mission.
38.0% 30.6% 34.2% 26.5% 24.9% 30.4% 26.4% 42.5%
Q41. The amount of work I am expected to perform is reasonable.
63.0% 49.3% 50.4% 42.8% 41.7% 43.8% 42.1% 53.8%
Q42. My job and work environment allow for a good balance between work and my personal life.
62.9% 53.8% 51.8% 46.5% 49.2% 47.8% 50.6% 61.3%
Q43. I have the materials and tools that I need to perform my duties effectively.
65.2% 58.5% 61.5% 56.9% 60.5% 55.4% 56.7% 60.0%
Q44. My department or agency provides me with the technology needed to perform my duties effectively.
63.2% 56.8% 60.3% 57.4% 56.5% 60.1% 59.1% 66.3%
Q45. My work site is well maintained and meets my needs. 72.2% 62.8% 63.3% 61.4% 62.8% 62.7% 63.4% 70.0%
Q46. I feel safe and secure in my work environment. 76.8% 74.0% 71.6% 67.4% 71.4% 71.9% 79.8% 78.5%
Table 50 displays percent agreement for respondents by age group to survey statements for
“Workload, Staffing and Resources.” The only significant finding was that respondents in the “18-24
years” group tended to have higher agreement than other age groups that the amount of work they
are expected to perform is reasonable (69.7%).
Table 50 Workload, Staffing and Resources by Age Group
Survey Items: Workload, Staffing and Resources Age Group
18 - 24
years
25 - 34
years
35 - 44
years
45 - 54
years
55 - 64
years
65+
years
Prefer
not to
answer
Question % Agree % Agree % Agree % Agree % Agree % Agree % Agree
Q40. My department or agency has the staffing and resources necessary to achieve its mission.
41.5% 32.4% 30.2% 31.6% 33.8% 39.8% 23.4%
Q41. The amount of work I am expected to perform is reasonable.
69.7% 57.0% 49.8% 48.6% 48.8% 63.6% 42.6%
Q42. My job and work environment allow for a good balance between work and my personal life.
62.1% 58.3% 54.2% 51.3% 53.9% 64.8% 44.7%
Q43. I have the materials and tools that I need to perform my duties effectively.
68.2% 61.3% 60.3% 60.2% 59.8% 67.4% 48.9%
Q44. My department or agency provides me with the technology needed to perform my duties effectively.
65.2% 61.2% 58.0% 60.8% 58.8% 67.8% 53.2%
Q45. My work site is well maintained and meets my needs. 72.7% 68.8% 64.8% 64.3% 63.3% 79.1% 63.0%
Q46. I feel safe and secure in my work environment. 83.3% 75.9% 74.0% 73.5% 71.3% 82.8% 63.8%

47
Employee Engagement Survey Results - 2013
Table 51 displays percent agreement for respondents by annual salary range to survey statements for
“Workload, Staffing and Resources.” Respondents at the higher annual salary ranges – “$55,000 -
$64,999” and “$65,000 - $74,999” – tended to have lower agreement that their department or agency
has the staffing and resources necessary to achieve its mission (26.0% and 25.9% respectively) than
respondents at the lower annual salary ranges – “Less than $25,000” and “$25,000 – 34,999” (41.0%
and 42.5%). A similar result was found in the lower agreement among those in these same higher
annual salary ranges that the amount of work they are expected to perform is reasonable (41.7% and
44.1% respectively) compared to the same lower annual salary ranges (72.4% and 64.7% respectively).
Those respondents at the top two annual salary ranges (“$65,000 - $74,999” and “More than $75,000”)
had higher agreement that they feel safe and secure in their work environment (81.0% and 86.8%
respectively).
Table 51 Workload, Staffing and Resources by Annual Salary Range
Survey Items: Workload, Staffing and Resources Annual Salary Range
Less than
$25,000
$25,000 -
$34,999
$35,000 -
$44,999
$45,000 -
$54,999
$55,000 -
$64,999
$65,000 -
$74,999
More than
$75,000
Question % Agree % Agree % Agree % Agree % Agree % Agree % Agree
Q40. My department or agency has the staffing and resources necessary to achieve its mission.
41.9% 42.5% 33.7% 32.0% 26.0% 25.9% 29.5%
Q41. The amount of work I am expected to perform is reasonable.
72.4% 64.7% 54.9% 48.7% 41.7% 44.1% 45.1%
Q42. My job and work environment allow for a good balance between work and my personal life.
65.1% 59.7% 59.7% 50.2% 49.4% 50.3% 53.4%
Q43. I have the materials and tools that I need to perform my duties effectively.
72.1% 64.1% 62.4% 58.3% 55.3% 59.0% 68.9%
Q44. My department or agency provides me with the technology needed to perform my duties effectively.
63.5% 63.6% 59.1% 58.8% 54.9% 60.7% 72.4%
Q45. My work site is well maintained and meets my needs. 75.6% 69.2% 64.4% 62.3% 63.3% 66.2% 73.6%
Q46. I feel safe and secure in my work environment. 76.7% 70.1% 70.9% 71.8% 73.8% 81.0% 86.8%
Table 52 displays percent agreement for respondents by job type to survey statements for “Workload,
Staffing and Resources.” Exempt respondents were significantly more likely than classified
respondents to agree that they have the materials and tools that they need to perform their duties
effectively (67.1% and 59.0% respectively), their work site is well maintained and meets their needs
(74.3% and 64.1% respectively), and they feel safe and secure in their work environment (80.7% and
72.5% respectively).

48
Employee Engagement Survey Results - 2013
Table 52 Workload, Staffing and Resources by Job Type
Survey Items: Workload, Staffing and Resources Job Type
Classified Exempt Other
Question % Agree % Agree % Agree
Q40. My department or agency has the staffing and resources necessary to achieve its mission.
31.1% 35.9% 40.7%
Q41. The amount of work I am expected to perform is reasonable. 49.6% 50.6% 64.7%
Q42. My job and work environment allow for a good balance between work and my personal life.
53.2% 56.7% 61.7%
Q43. I have the materials and tools that I need to perform my duties effectively. 59.0% 67.1% 69.7%
Q44. My department or agency provides me with the technology needed to perform my duties effectively.
58.4% 63.9% 68.0%
Q45. My work site is well maintained and meets my needs. 64.1% 74.3% 70.9%
Q46. I feel safe and secure in my work environment. 72.5% 80.7% 81.4%
Table 53 displays percent agreement for respondents by bargaining unit to survey statements for
“Workload, Staffing and Resources.” State Police Bargaining Unit respondents had significantly
lower agreement that their department or agency has the staffing and resources necessary to achieve
its mission (15.9%). However, the highest agreement among bargaining unit respondents that they
have the materials and tools that they need to perform their duties effectively was found for State
Police Bargaining Unit (76.8%). Corrections Bargaining Unit respondents had the lowest agreement
that they feel safe and secure in their work environment (59.6%).
Table 53 Workload, Staffing and Resources by Bargaining Unit
Survey Items: Workload, Staffing and Resources Bargaining Unit
Non-
Management
Supervisory Corrections State
Police
Manager
and/or
Confidential
Question % Agree % Agree % Agree % Agree % Agree
Q40. My department or agency has the staffing and resources necessary to achieve its mission.
32.4% 29.3% 27.2% 15.9% 35.2%
Q41. The amount of work I am expected to perform is reasonable. 52.0% 42.1% 46.1% 43.9% 47.2%
Q42. My job and work environment allow for a good balance between work and my personal life.
55.7% 48.6% 40.6% 36.6% 53.4%
Q43. I have the materials and tools that I need to perform my duties effectively.
58.6% 59.1% 51.7% 76.8% 64.2%
Q44. My department or agency provides me with the technology needed to perform my duties effectively.
58.5% 57.2% 42.2% 79.3% 70.5%
Q45. My work site is well maintained and meets my needs. 64.3% 61.8% 55.0% 69.5% 79.5%
Q46. I feel safe and secure in my work environment. 71.1% 78.7% 59.6% 78.0% 86.8%

49
Employee Engagement Survey Results - 2013
Table 54 displays percent agreement for respondents by gender to survey statements for “Workload,
Staffing and Resources.” Female respondents were significantly more likely to agree that amount of
work they are expected to perform is reasonable (48.8%) than were male respondents (54.8%).
Table 54 Workload, Staffing and Resources by Gender
Survey Items: Workload, Staffing and Resources Gender
Male Female Prefer not
to answer
Question % Agree % Agree % Agree
Q40. My department or agency has the staffing and resources necessary to achieve its mission.
34.3% 31.5% 23.4%
Q41. The amount of work I am expected to perform is reasonable. 54.8% 48.8% 39.6%
Q42. My job and work environment allow for a good balance between work and my personal life.
54.5% 55.0% 38.3%
Q43. I have the materials and tools that I need to perform my duties effectively. 60.1% 61.7% 46.3%
Q44. My department or agency provides me with the technology needed to perform my duties effectively.
60.5% 59.9% 48.1%
Q45. My work site is well maintained and meets my needs. 65.8% 65.6% 55.7%
Q46. I feel safe and secure in my work environment. 74.4% 74.3% 56.5%
Table 55 displays percent agreement for respondents by racial/ethnic group to survey statements for
“Workload, Staffing and Resources.” White respondents were significantly more likely than minority
respondents to agree that their job and work environment allow for a good balance between work
and their personal life (55.5% and 46.7% respectively) and that they feel safe and secure in their work
environment (74.9% and 61.7% respectively).
Table 55 Workload, Staffing and Resources by Racial/Ethnic Group
Survey Items: Workload, Staffing and Resources Racial/Ethnic Group
Minority White Two or more
Races
Prefer not
to Answer
Question % Agree % Agree % Agree % Agree
Q40. My department or agency has the staffing and resources necessary to achieve its mission.
40.7% 32.9% 19.1% 25.6%
Q41. The amount of work I am expected to perform is reasonable. 51.7% 51.9% 42.6% 39.1%
Q42. My job and work environment allow for a good balance between work and my personal life.
46.7% 55.5% 40.4% 38.9%
Q43. I have the materials and tools that I need to perform my duties effectively. 56.7% 61.8% 42.6% 47.0%
Q44. My department or agency provides me with the technology needed to perform my duties effectively.
56.7% 60.9% 34.0% 50.8%
Q45. My work site is well maintained and meets my needs. 58.3% 66.2% 57.4% 57.5%
Q46. I feel safe and secure in my work environment. 61.7% 74.9% 63.8% 63.3%
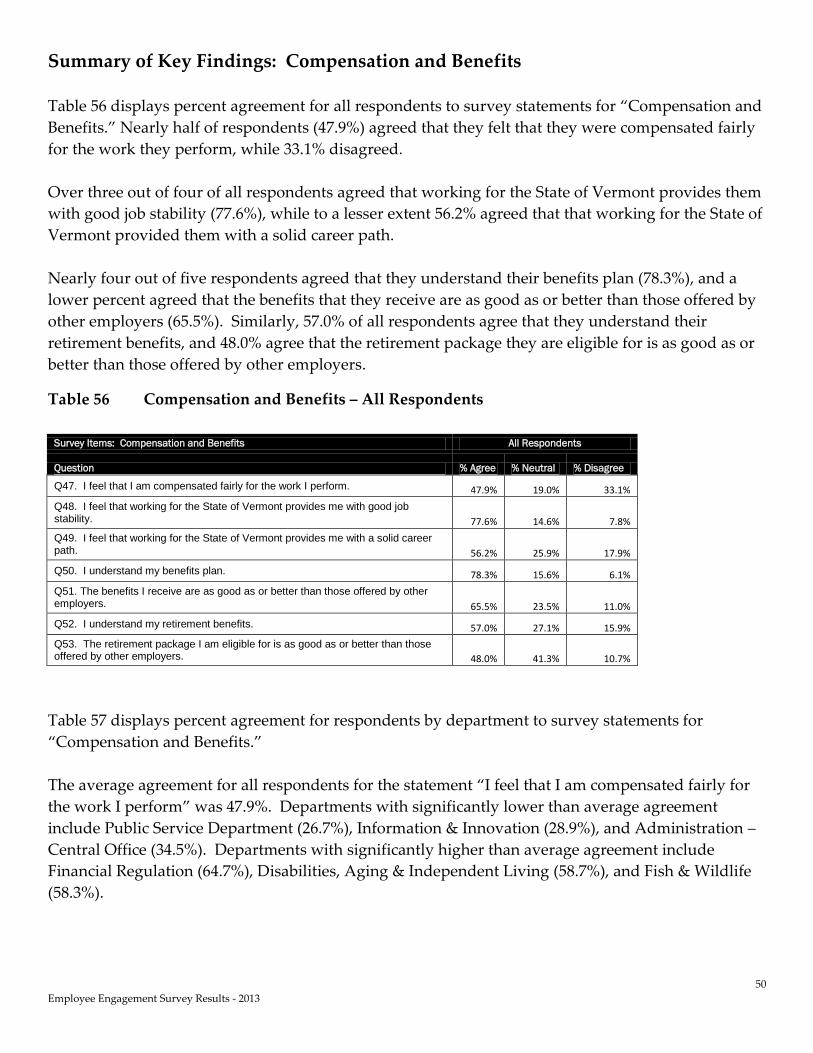
50
Employee Engagement Survey Results - 2013
Summary of Key Findings: Compensation and Benefits
Table 56 displays percent agreement for all respondents to survey statements for “Compensation and
Benefits.” Nearly half of respondents (47.9%) agreed that they felt that they were compensated fairly
for the work they perform, while 33.1% disagreed.
Over three out of four of all respondents agreed that working for the State of Vermont provides them
with good job stability (77.6%), while to a lesser extent 56.2% agreed that that working for the State of
Vermont provided them with a solid career path.
Nearly four out of five respondents agreed that they understand their benefits plan (78.3%), and a
lower percent agreed that the benefits that they receive are as good as or better than those offered by
other employers (65.5%). Similarly, 57.0% of all respondents agree that they understand their
retirement benefits, and 48.0% agree that the retirement package they are eligible for is as good as or
better than those offered by other employers.
Table 56 Compensation and Benefits – All Respondents
Survey Items: Compensation and Benefits All Respondents
Question % Agree % Neutral % Disagree
Q47. I feel that I am compensated fairly for the work I perform. 47.9% 19.0% 33.1%
Q48. I feel that working for the State of Vermont provides me with good job stability. 77.6% 14.6% 7.8%
Q49. I feel that working for the State of Vermont provides me with a solid career path. 56.2% 25.9% 17.9%
Q50. I understand my benefits plan. 78.3% 15.6% 6.1%
Q51. The benefits I receive are as good as or better than those offered by other employers. 65.5% 23.5% 11.0%
Q52. I understand my retirement benefits. 57.0% 27.1% 15.9%
Q53. The retirement package I am eligible for is as good as or better than those offered by other employers. 48.0% 41.3% 10.7%
Table 57 displays percent agreement for respondents by department to survey statements for
“Compensation and Benefits.”
The average agreement for all respondents for the statement “I feel that I am compensated fairly for
the work I perform” was 47.9%. Departments with significantly lower than average agreement
include Public Service Department (26.7%), Information & Innovation (28.9%), and Administration –
Central Office (34.5%). Departments with significantly higher than average agreement include
Financial Regulation (64.7%), Disabilities, Aging & Independent Living (58.7%), and Fish & Wildlife
(58.3%).

51
Employee Engagement Survey Results - 2013
Table 57 Compensation and Benefits by Department
Survey Items: Compensation and Benefits
Q47. Q48. Q49. Q50. Q51. Q52. Q53.
Department % Agree % Agree % Agree % Agree % Agree % Agree % Agree
Administration - CO 34.5% 72.4% 53.6% 75.9% 72.4% 55.2% 44.8%
Agriculture 43.8% 75.0% 59.4% 78.1% 81.3% 56.3% 65.6%
Attorney General 46.2% 82.7% 59.6% 80.8% 69.2% 63.5% 44.2%
Buildings & General Services 41.6% 74.0% 43.8% 73.9% 63.8% 57.2% 46.4%
Children & Families 47.5% 82.6% 59.2% 77.0% 71.2% 51.9% 45.4%
Commerce & Comm. Dev. 46.9% 84.4% 50.0% 84.4% 68.8% 59.4% 59.4%
Corrections 45.7% 81.0% 59.7% 75.6% 61.2% 50.0% 40.3%
Defender General 52.6% 78.9% 47.4% 78.9% 68.4% 63.2% 22.2%
Disabilities, Aging & Ind. Liv. 58.7% 78.1% 63.8% 77.9% 69.6% 57.1% 49.0%
Education 49.5% 75.2% 42.9% 72.4% 56.2% 50.0% 42.9%
Environmental Conservation 42.4% 67.4% 53.8% 79.3% 65.2% 56.0% 37.8%
Finance & Management 55.0% 75.0% 55.0% 85.0% 70.0% 70.0% 55.0%
Financial Regulation 64.7% 76.5% 62.7% 92.0% 76.0% 70.6% 64.7%
Fish & Wildlife 58.3% 77.8% 52.8% 68.6% 63.9% 57.1% 51.4%
Forests, Parks & Recreation 54.5% 70.5% 47.7% 81.8% 59.1% 65.1% 50.0%
Health 45.7% 77.4% 47.1% 83.7% 67.4% 57.3% 48.9%
Human Resources 55.4% 87.5% 64.3% 91.1% 83.9% 57.1% 60.7%
Human Services - CO 50.0% 73.5% 49.2% 83.9% 63.2% 59.0% 49.2%
Information & Innovation 28.9% 84.4% 48.9% 71.1% 46.7% 57.8% 46.7%
Labor 46.5% 68.1% 49.3% 77.8% 67.4% 53.8% 49.3%
Liquor Control 37.5% 81.3% 56.3% 75.0% 50.0% 50.0% 50.0%
Lottery 35.7% 78.6% 85.7% 64.3% 71.4% 57.1% 64.3%
Mental Health 48.8% 78.0% 56.1% 70.7% 65.9% 51.2% 48.8%
Military 43.8% 93.8% 68.8% 87.5% 87.5% 56.3% 37.5%
Motor Vehicles 56.9% 84.6% 69.2% 70.8% 64.6% 49.2% 46.2%
Natural Resources -CO 36.8% 68.4% 52.6% 81.1% 62.2% 54.1% 43.2%
Public Safety (incl VSP) 47.5% 79.2% 62.8% 76.8% 58.5% 62.8% 52.1%
Public Service Department 26.7% 73.3% 60.0% 80.0% 73.3% 60.0% 50.0%
Secretary of State 50.0% 80.0% 60.0% 73.7% 65.0% 65.0% 55.0%
Small Department 66.1% 91.5% 69.0% 87.9% 76.3% 66.1% 56.9%
Taxes 42.2% 67.2% 43.8% 79.7% 73.4% 59.4% 47.6%
Transportation - not DMV 47.9% 79.3% 60.5% 78.4% 61.3% 58.8% 47.9%
Vermont Health Access 52.7% 67.3% 56.4% 80.0% 65.5% 63.6% 56.4%
Veterans' Home 53.8% 69.2% 56.9% 71.2% 84.6% 50.0% 50.0%
Average 47.9% 77.6% 56.2% 78.3% 65.5% 57.0% 48.0%
Q47. I feel that I am compensated fairly for the work I perform.
Q48. I feel that working for the State of Vermont provides me with good job stability.
Q49. I feel that working for the State of Vermont provides me with a solid career path.
Q50. I understand my benefits plan.
Q51. The benefits I receive are as good as or better than those offered by other employers.
Q52. I understand my retirement benefits.
Q53. The retirement package I am eligible for is as good as or better than those offered by other employers.

52
Employee Engagement Survey Results - 2013
The average agreement for all respondents for the statement “I feel that working for the State of
Vermont provides me with good job stability” was 77.6%. Departments with significantly lower than
average agreement include Taxes (67.2%), Vermont Health Access (67.3%), and Environmental
Conservation (67.4%). Departments with significantly higher than average agreement include
Military (93.8%), Human Resources (87.5%), and Motor Vehicles (84.6%).
The average agreement for all respondents for the statement “I feel that working for the State of
Vermont provides me with a solid career path” was 56.2%. Departments with significantly lower
than average agreement include Education (42.9%), Taxes (43.8%), and Buildings & General Services
(43.8%). Departments with significantly higher than average agreement include Lottery (85.7%),
Motor Vehicles (69.2%), and Military (68.8%).
The average agreement for all respondents for the statement “I understand my benefits plan” was
78.3%. Departments with significantly lower than average agreement include Lottery (64.3%) and
Fish & Wildlife (68.6%). Departments with significantly higher than average agreement include
Financial Regulation (92.0%) and Human Resources (91.1%).
The average agreement for all respondents for the statement “The benefits I receive are as good as or
better than those offered by other employers” was 65.5%. Departments with significantly lower than
average agreement include Information & Innovation (46.7%), Liquor Control (50.0%), and Education
(56.2%). Departments with significantly higher than average agreement include Military (87.5%),
Veterans’ Home (84.6%), and Human Resources (83.9%).
The average agreement for all respondents for the statement “I understand my retirement benefits.”
was 57.0%. Departments with significantly lower than average agreement include Motor Vehicles
(49.2%), Corrections (50.0%), Education (50.0%), Liquor Control (50.0%), and Veterans’ Home (50.0%),
Departments with significantly higher than average agreement include Financial Regulation (70.6%),
and Finance & Management (70.0%)
The average agreement for all respondents for the statement “The retirement package I am eligible
for is as good as or better than those offered by other employers” was 48.0%. Departments with
significantly lower than average agreement include Defender General (22.2%), Military (37.5%), and
Environmental Conservation (37.8%). Departments with significantly higher than average agreement
include Agriculture (65.6%), Financial Regulation (64.7%), and Lottery (64.3%).
Table 58 displays percent agreement for respondents by length of service to survey statements for
“Compensation and Benefits.” Respondents with greater length of service had higher agreement that
they feel that working for the State of Vermont provides them with good job stability, with the “more
than 35 years” group having the highest agreement (87.5%). Respondents with “more than 35 years”
of service had significantly higher agreement that they understand their retirement benefits than did
the “less than five years” group (81.3% and 49.4% respectively).

53
Employee Engagement Survey Results - 2013
Table 58 Compensation and Benefits by Length of Service
Survey Items: Compensation and Benefits Length of Service
Less
than 5
years
5 - 9
years
10 - 14
years
15 -19
years
20 - 24
years
25 - 29
years
30 - 35
years
More
than 35
years
Question % Agree % Agree % Agree % Agree % Agree % Agree % Agree % Agree
Q47. I feel that I am compensated fairly for the work I perform.
44.6% 41.0% 51.2% 51.2% 53.0% 52.2% 59.5% 56.3%
Q48. I feel that working for the State of Vermont provides me with good job stability.
76.8% 72.8% 78.7% 77.3% 79.8% 82.9% 83.4% 87.5%
Q49. I feel that working for the State of Vermont provides me with a solid career path.
62.4% 50.1% 57.6% 49.8% 56.3% 54.5% 61.3% 63.3%
Q50. I understand my benefits plan. 62.4% 50.1% 57.6% 49.8% 56.3% 54.5% 61.3% 63.3%
Q51. The benefits I receive are as good as or better than those offered by other employers.
61.8% 63.2% 67.5% 68.3% 68.3% 70.1% 67.3% 71.3%
Q52. I understand my retirement benefits. 49.4% 55.4% 60.1% 55.2% 61.0% 62.0% 69.2% 81.3%
Q53. The retirement package I am eligible for is as good as or better than those offered by other employers.
46.0% 47.6% 49.4% 46.4% 44.4% 52.6% 50.9% 62.0%
Table 59 displays percent agreement for respondents by age group to survey statements for
“Compensation and Benefits.” Respondents in the “65+ years” group had significantly higher
agreement that they feel that they are compensated fairly for the work they perform than those in the
“25 – 34 years” group (67.8% and 42.3% respectively). Respondents in the “65+” years group had
significantly higher agreement than those in the “18 – 24 years” group that they understand their
retirement benefits (69.4% and 36.9% respectively) and that the retirement package they are eligible
for is as good as or better than those offered by other employers (57.0% and 32.3% respectively).
Table 59 Compensation and Benefits by Age Group
Survey Items: Compensation and Benefits Age Group
18 - 24
years
25 - 34
years
35 - 44
years
45 - 54
years
55 - 64
years
65+
years
Prefer
not to
answer
Question % Agree % Agree % Agree % Agree % Agree % Agree % Agree
Q47. I feel that I am compensated fairly for the work I perform.
50.0% 42.3% 45.5% 47.7% 51.9% 67.8% 46.8%
Q48. I feel that working for the State of Vermont provides me with good job stability.
80.3% 82.4% 79.3% 76.5% 75.7% 80.7% 61.7%
Q49. I feel that working for the State of Vermont provides me with a solid career path.
65.2% 67.1% 59.6% 52.9% 52.2% 56.3% 29.8%
Q50. I understand my benefits plan. 60.0% 73.0% 75.3% 78.8% 85.9% 79.1% 69.6%
Q51. The benefits I receive are as good as or better than those offered by other employers.
60.0% 63.9% 63.4% 67.6% 67.3% 70.6% 51.1%
Q52. I understand my retirement benefits. 36.9% 53.4% 54.8% 56.3% 63.4% 69.4% 48.9%
Q53. The retirement package I am eligible for is as good as or better than those offered by other employers.
32.3% 45.6% 49.4% 46.6% 51.4% 57.0% 30.4%

54
Employee Engagement Survey Results - 2013
Table 60 displays percent agreement for respondents by annual salary range to survey statements for
“Compensation and Benefits.” Respondents in the “More than $75,000” group had significantly
higher agreement with all statements related to “Compensation and Benefits.”
Table 60 Compensation and Benefits by Annual Salary Range
Survey Items: Compensation and Benefits Annual Salary Range
Less than
$25,000
$25,000 -
$34,999
$35,000 -
$44,999
$45,000 -
$54,999
$55,000 -
$64,999
$65,000 -
$74,999
More than
$75,000
Question % Agree % Agree % Agree % Agree % Agree % Agree % Agree
Q47. I feel that I am compensated fairly for the work I perform.
43.0% 41.8% 46.5% 48.6% 47.4% 51.7% 63.7%
Q48. I feel that working for the State of Vermont provides me with good job stability.
62.1% 70.7% 79.4% 78.1% 78.2% 83.0% 83.4%
Q49. I feel that working for the State of Vermont provides me with a solid career path.
52.9% 55.8% 59.3% 55.2% 51.7% 57.3% 69.4%
Q50. I understand my benefits plan. 48.8% 67.4% 76.1% 80.6% 82.5% 85.9% 90.7%
Q51. The benefits I receive are as good as or better than those offered by other employers.
38.8% 63.1% 67.6% 68.1% 64.6% 62.8% 74.1%
Q52. I understand my retirement benefits. 38.1% 46.9% 52.0% 56.1% 60.9% 69.2% 79.3%
Q53. The retirement package I am eligible for is as good as or better than those offered by other employers.
31.0% 42.3% 45.0% 47.9% 52.2% 53.1% 63.7%
Table 61 displays percent agreement for respondents by job type to survey statements for
“Compensation and Benefits.” There were no statistically meaningful differences in agreement by job
type to these statements.
Table 61 Compensation and Benefits by Job Type
Survey Items: Compensation and Benefits Job Type
Classified Exempt Other
Question % Agree % Agree % Agree
Q47. I feel that I am compensated fairly for the work I perform. 48.0% 42.4% 53.7%
Q48. I feel that working for the State of Vermont provides me with good job stability. 78.8% 73.9% 68.1%
Q49. I feel that working for the State of Vermont provides me with a solid career path. 55.3% 61.1% 62.9%
Q50. I understand my benefits plan. 79.6% 79.2% 64.3%
Q51. The benefits I receive are as good as or better than those offered by other employers.
66.1% 67.8% 56.4%
Q52. I understand my retirement benefits. 57.4% 62.3% 48.0%
Q53. The retirement package I am eligible for is as good as or better than those offered by other employers.
48.4% 51.7% 40.1%

55
Employee Engagement Survey Results - 2013
Table 62 displays percent agreement for respondents by bargaining unit to survey statements for
“Compensation and Benefits.” The corrections bargaining unit respondents had lower agreement on
almost all statements related to “Compensation and Benefits.” State Police bargaining unit
respondents had significantly lower agreement that they feel that they are compensated fairly for the
work they perform (35.8%).
Table 62 Compensation and Benefits by Bargaining Unit
Survey Items: Compensation and Benefits Bargaining Unit
Non-
Management
Supervisory Corrections State
Police
Manager
and/or
Confidential
Question % Agree % Agree % Agree % Agree % Agree
Q47. I feel that I am compensated fairly for the work I perform. 46.9% 52.2% 44.4% 35.8% 59.1%
Q48. I feel that working for the State of Vermont provides me with good job stability.
76.9% 82.3% 79.4% 81.7% 88.1%
Q49. I feel that working for the State of Vermont provides me with a solid career path.
51.9% 61.8% 57.2% 72.0% 69.1%
Q50. I understand my benefits plan. 78.1% 86.4% 72.2% 76.8% 90.9%
Q51. The benefits I receive are as good as or better than those offered by other employers.
66.3% 68.5% 61.1% 54.9% 73.3%
Q52. I understand my retirement benefits. 54.9% 65.5% 45.3% 75.3% 71.6%
Q53. The retirement package I am eligible for is as good as or better than those offered by other employers.
46.6% 51.8% 41.1% 64.6% 59.8%
Table 63 displays percent agreement for respondents by gender to survey statements for
“Compensation and Benefits.” Female respondents had higher agreement than males that the
benefits they receive are as good as or better than those offered by other employers (69.7% and 61.5%
respectively), while male respondents had higher agreement that they understand their retirement
benefits (61.7% and 54.3% respectively).
Table 63 Compensation and Benefits by Gender
Survey Items: Compensation and Benefits Gender
Male Female Prefer not
to answer
Question % Agree % Agree % Agree
Q47. I feel that I am compensated fairly for the work I perform. 45.2% 50.7% 43.5%
Q48. I feel that working for the State of Vermont provides me with good job stability. 78.0% 78.5% 66.4%
Q49. I feel that working for the State of Vermont provides me with a solid career path. 56.6% 57.8% 34.3%
Q50. I understand my benefits plan. 76.8% 80.0% 72.4%
Q51. The benefits I receive are as good as or better than those offered by other employers. 61.5% 69.7% 52.8%
Q52. I understand my retirement benefits. 61.7% 54.3% 44.9%
Q53. The retirement package I am eligible for is as good as or better than those offered by other employers.
49.7% 47.9% 33.7%

56
Employee Engagement Survey Results - 2013
Table 64 displays percent agreement for respondents by racial/ethnic group to survey statements for
“Compensation and Benefits.” White respondents had significantly higher agreement than minority
respondents that they feel that working for the State of Vermont provides them with good job
stability (78.9% and 65.0% respectively) and that they feel that working for the State of Vermont
provides them with a solid career path (58.2% and 48.3% respectively).
Table 64 Compensation and Benefits by Racial/Ethnic Group
Survey Items: Compensation and Benefits Racial/Ethnic Group
Minority White Two or more
Races
Prefer not
to Answer
Question % Agree % Agree % Agree % Agree
Q47. I feel that I am compensated fairly for the work I perform. 51.7% 48.6% 40.4% 39.8%
Q48. I feel that working for the State of Vermont provides me with good job stability. 65.0% 78.9% 68.1% 68.9%
Q49. I feel that working for the State of Vermont provides me with a solid career path. 48.3% 58.2% 48.9% 34.3%
Q50. I understand my benefits plan. 71.2% 79.0% 70.2% 72.6%
Q51. The benefits I receive are as good as or better than those offered by other employers. 67.8% 66.1% 70.2% 55.6%
Q52. I understand my retirement benefits. 45.0% 57.9% 45.7% 52.8%
Q53. The retirement package I am eligible for is as good as or better than those offered by other employers.
46.7% 48.8% 44.7% 38.6%

57
Employee Engagement Survey Results - 2013
Summary of Key Findings: Overall Job Satisfaction
Table 65 displays percent agreement for all respondents for “Overall Job Satisfaction.” Nearly 70%
agreed that in general they were satisfied with their job (69.7%).
Table 65 Overall Job Satisfaction – All Respondents
Survey Items: Overall Job Satisfaction All Respondents
Question % Agree % Neutral % Disagree
Q57. In general, I am satisfied with my job. 69.7% 16.9% 13.4%
Table 66 displays percent agreement for respondents by department for “Overall Job Satisfaction.”
The average agreement for all respondents for the statement “In general, I am satisfied with my job”
was 69.7%.
Fish & Wildlife had significantly lower than average agreement (55.6%). The relatively high level of
“neutral” as a response shows the ambivalence respondents felt about this statement (30.6%).
Veterans’ Home respondents also had low agreement (59.3%) and had the highest level of
disagreement (27.8%). Other departments with low agreement include Corrections (60.2%) and
Education (60.6%).
Departments with significantly higher than average overall satisfaction agreement include Lottery
(85.7%), Defender General (84.2%), Forests, Parks & Recreation (84.1%), Attorney General (82.7%),
and Health (81.3%).

58
Employee Engagement Survey Results - 2013
Table 66 Overall Job Satisfaction by Department
Survey Items: Overall Job Satisfaction
Q57. In general, I am satisfied with my job.
Department % Agree % Neutral % Disagree
Administration - CO 71.4% 10.7% 17.9%
Agriculture 68.8% 18.8% 12.5%
Attorney General 82.7% 9.6% 7.7%
Buildings & General Services 60.8% 23.5% 15.7%
Children & Families 66.9% 17.2% 15.9%
Commerce & Comm. Dev. 71.9% 21.9% 6.3%
Corrections 60.2% 22.0% 17.7%
Defender General 84.2% 15.8% 0.0%
Disabilities, Aging & Ind. Liv. 77.1% 8.6% 14.3%
Education 60.6% 17.3% 22.1%
Environmental Conservation 65.9% 22.0% 12.1%
Finance & Management 75.0% 10.0% 15.0%
Financial Regulation 78.4% 15.7% 5.9%
Fish & Wildlife 55.6% 30.6% 13.9%
Forests, Parks & Recreation 84.1% 13.6% 2.3%
Health 81.3% 10.0% 8.7%
Human Resources 74.5% 20.0% 5.5%
Human Services - CO 63.2% 21.4% 15.4%
Information & Innovation 71.1% 15.6% 13.3%
Labor 61.5% 19.6% 18.9%
Liquor Control 75.0% 12.5% 12.5%
Lottery 85.7% 7.1% 7.1%
Mental Health 62.5% 17.5% 20.0%
Military 68.8% 31.3% 0.0%
Motor Vehicles 76.6% 18.8% 4.7%
Natural Resources -CO 73.7% 7.9% 18.4%
Public Safety (incl VSP) 70.8% 16.7% 12.5%
Public Service Department 80.0% 6.7% 13.3%
Secretary of State 75.0% 15.0% 10.0%
Small Department 86.4% 6.8% 6.8%
Taxes 70.3% 14.1% 15.6%
Transportation - not DMV 71.8% 16.7% 11.6%
Vermont Health Access 70.4% 18.5% 11.1%
Veterans' Home 59.3% 13.0% 27.8%
Average 69.7% 16.9% 13.4%

59
Employee Engagement Survey Results - 2013
Table 67 displays percent agreement for respondents by length of service for “Overall Job
Satisfaction.” Overall job satisfaction does not appear to be significantly related to length of service.
Table 67 Overall Job Satisfaction by Length of Service
Survey Items: Overall Job Satisfaction Length of Service
Less than
5 years
5 - 9
years
10 - 14
years
15 -19
years
20 - 24
years
25 - 29
years
30 - 35
years
More
than 35
years
Question % Agree % Agree % Agree % Agree % Agree % Agree % Agree % Agree
Q57. In general, I am satisfied with my job. 74.8% 67.3% 70.0% 64.5% 68.8% 65.5% 73.3% 73.4%
Table 68 displays percent agreement for respondents by age group for “Overall Job Satisfaction.”
Overall job satisfaction does not appear to be significantly related to length of service.
Table 68 Overall Job Satisfaction by Age Group
Survey Items: Overall Job Satisfaction Age Group
18 - 24
years
25 - 34
years
35 - 44
years
45 - 54
years
55 - 64
years
65+
years
Prefer
not to
answer
Question % Agree % Agree % Agree % Agree % Agree % Agree % Agree
Q57. In general, I am satisfied with my job. 75.8% 69.6% 71.2% 69.0% 69.2% 79.3% 56.5%
Table 69 displays percent agreement for respondents by annual salary range for “Overall Job
Satisfaction.” Respondents in the “more than $75,000” salary range had significantly higher
agreement that, in general, they were satisfied with their job (81.9%).
Table 69 Overall Job Satisfaction by Annual Salary Range
Survey Items: Overall Job Satisfaction Annual Salary Range
Less than
$25,000
$25,000 -
$34,999
$35,000 -
$44,999
$45,000 -
$54,999
$55,000 -
$64,999
$65,000 -
$74,999
More than
$75,000
Question % Agree % Agree % Agree % Agree % Agree % Agree % Agree
Q57. In general, I am satisfied with my job. 74.7% 66.8% 70.6% 68.3% 69.1% 69.6% 81.9%
Table 70 displays percent agreement for respondents by job type for “Overall Job Satisfaction.”
Exempt respondents had significantly higher agreement that, in general, they were satisfied with
their job (81.1%).

60
Employee Engagement Survey Results - 2013
Table 70 Overall Job Satisfaction by Job Type
Survey Items: Overall Job Satisfaction Job Type
Classified Exempt Other
Question % Agree % Agree % Agree
Q57. In general, I am satisfied with my job. 68.1% 81.1% 77.4%
Table 71 displays percent agreement for respondents by bargaining unit for “Overall Job
Satisfaction.” The corrections bargaining unit respondents had significantly lower agreement that, in
general, they were satisfied with their job (56.8%), while manager and/or confidential respondents
had the highest level of agreement (82.8%).
Table 71 Overall Job Satisfaction by Bargaining Unit
Survey Items: Overall Job Satisfaction Bargaining Unit
Non-
Management
Supervisory Corrections State
Police
Manager
and/or
Confidential
Question % Agree % Agree % Agree % Agree % Agree
Q57. In general, I am satisfied with my job. 66.9% 74.0% 56.8% 70.7% 82.8%
Table 72 displays percent agreement for respondents by gender or “Overall Job Satisfaction.” Female
respondents where significantly more likely to agree that, in general, they were satisfied with their
job (73.5%) than were male respondents (66.5%).
Table 72 Overall Job Satisfaction by Gender
Survey Items: Overall Job Satisfaction Gender
Male Female Prefer not to
answer
Question % Agree % Agree % Agree
Q57. In general, I am satisfied with my job. 66.5% 73.5% 54.8%
Table 73 displays percent agreement for respondents by racial/ethnic group for “Overall Job
Satisfaction.” White respondents where significantly more likely to agree that, in general, they were
satisfied with their job (71.1%) than were minority (61.0%) or “two or more races” respondents
(61.7%).
Table 73 Overall Job Satisfaction by Racial/Ethnic Group
Survey Items: Overall Job Satisfaction Racial/Ethnic Group
Minority White Two or more
Races
Prefer not
to Answer
Question % Agree % Agree % Agree % Agree
Q57. In general, I am satisfied with my job. 61.0% 71.1% 61.7% 58.3%

61
Employee Engagement Survey Results - 2013
Transportation
The survey also presented several items that assessed employees’ transportation to and from work.
Table 74 displays all respondents reported commute distance to work. The highest percent of
respondents reported a 10.1 to 20 mile commute (23.8%). Over 50% report a commute of 10.1 to 50
miles (54.6%).
Table 74 Commute Distance to Work – All Respondents
Q11. How far is your commute to work?
Distance Number Percent
Less than 1 mile 173 5.1%
1 to 3 miles 332 9.8%
3.1 to 5 miles 215 6.3%
5.1 to 10 miles 533 15.7%
10.1 to 20 miles 807 23.8%
20.1 to 35 miles 576 17.0%
35.1 to 50 miles 466 13.8%
More than 50 miles 177 5.2%
Missing 110 3.2%
Total 3,389 100.0%
Table 75 displays all respondents reported most common mean of transportation to commute to
work. The vast majority of respondents reported that they drive their own car with no other
passengers (77.8%).
Table 75 Most Common Means of Transportation to Commute to Work – All Respondents
Q10. What is the means of transportation you most commonly use when
commuting to work?
Response Number Percent
Drive my own car with no other passengers 2,636 77.8%
Carpool 287 8.5%
Public bus 90 2.7%
Van Pool 21 0.6%
Bicycle 11 0.3%
Walk 76 2.2%
State vehicle 153 4.5%
Missing 113 3.3%
Total 3,389 100.0%
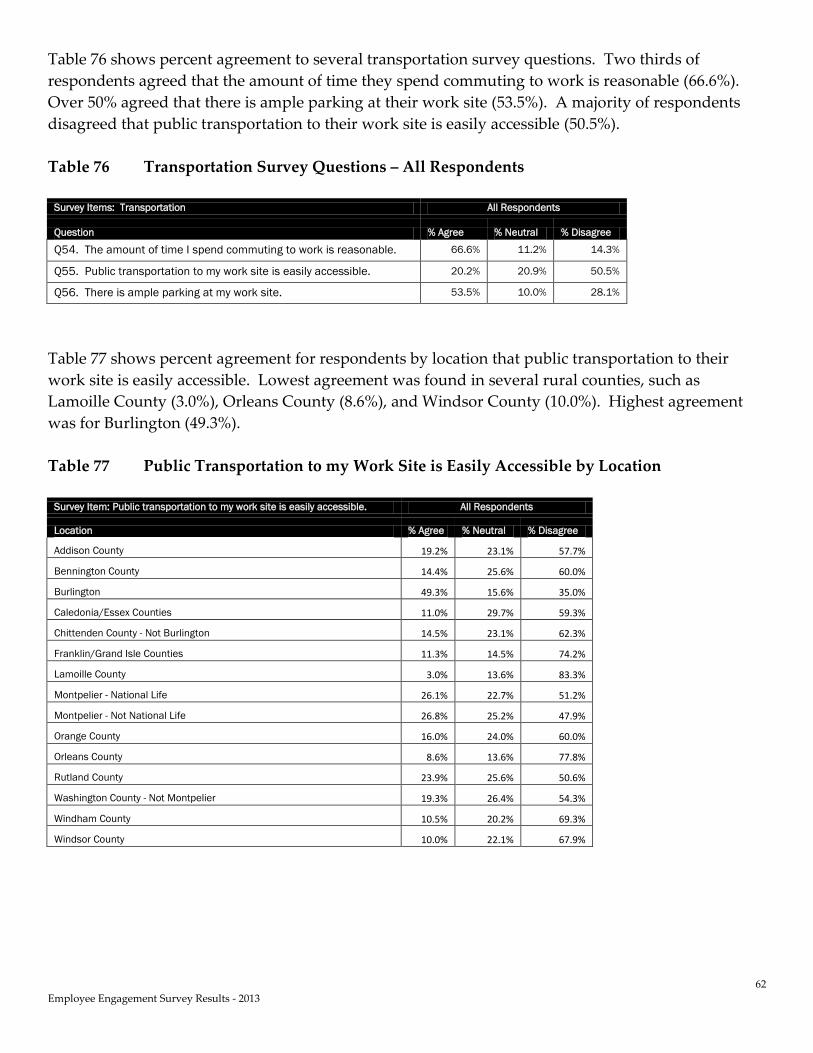
62
Employee Engagement Survey Results - 2013
Table 76 shows percent agreement to several transportation survey questions. Two thirds of
respondents agreed that the amount of time they spend commuting to work is reasonable (66.6%).
Over 50% agreed that there is ample parking at their work site (53.5%). A majority of respondents
disagreed that public transportation to their work site is easily accessible (50.5%).
Table 76 Transportation Survey Questions – All Respondents
Survey Items: Transportation All Respondents
Question % Agree % Neutral % Disagree
Q54. The amount of time I spend commuting to work is reasonable. 66.6% 11.2% 14.3%
Q55. Public transportation to my work site is easily accessible. 20.2% 20.9% 50.5%
Q56. There is ample parking at my work site. 53.5% 10.0% 28.1%
Table 77 shows percent agreement for respondents by location that public transportation to their
work site is easily accessible. Lowest agreement was found in several rural counties, such as
Lamoille County (3.0%), Orleans County (8.6%), and Windsor County (10.0%). Highest agreement
was for Burlington (49.3%).
Table 77 Public Transportation to my Work Site is Easily Accessible by Location
Survey Item: Public transportation to my work site is easily accessible. All Respondents
Location % Agree % Neutral % Disagree
Addison County 19.2% 23.1% 57.7%
Bennington County 14.4% 25.6% 60.0%
Burlington 49.3% 15.6% 35.0%
Caledonia/Essex Counties 11.0% 29.7% 59.3%
Chittenden County - Not Burlington 14.5% 23.1% 62.3%
Franklin/Grand Isle Counties 11.3% 14.5% 74.2%
Lamoille County 3.0% 13.6% 83.3%
Montpelier - National Life 26.1% 22.7% 51.2%
Montpelier - Not National Life 26.8% 25.2% 47.9%
Orange County 16.0% 24.0% 60.0%
Orleans County 8.6% 13.6% 77.8%
Rutland County 23.9% 25.6% 50.6%
Washington County - Not Montpelier 19.3% 26.4% 54.3%
Windham County 10.5% 20.2% 69.3%
Windsor County 10.0% 22.1% 67.9%

63
Employee Engagement Survey Results - 2013
Table 78 shows percent agreement for respondents by location that there is ample parking at their
work site. For most locations over 70% agreed that there was ample parking. The notable exception
was in Montpelier, where 43.1% of “Montpelier – National Life” respondents disagreed and 68.2% of
“Montpelier - Not National Life” disagreed.
Table 78 There is Ample Parking at my Work Site by Location
Survey Item: There is ample parking at my work site All Respondents
Location % Agree % Neutral % Disagree
Addison County 80.8% 15.4% 3.8%
Bennington County 84.9% 7.9% 7.1%
Burlington 72.2% 9.2% 18.6%
Caledonia/Essex Counties 71.9% 5.6% 22.5%
Chittenden County - Not Burlington 78.9% 8.2% 12.9%
Franklin/Grand Isle Counties 76.4% 12.2% 11.4%
Lamoille County 58.5% 9.2% 32.3%
Montpelier – National Life 35.7% 21.2% 43.1%
Montpelier - Not National Life 20.0% 11.8% 68.2%
Orange County 76.0% 8.0% 16.0%
Orleans County 62.2% 6.1% 31.7%
Rutland County 84.1% 6.6% 9.3%
Washington County - Not Montpelier 81.3% 6.1% 12.6%
Windham County 71.9% 13.2% 14.9%
Windsor County 69.1% 8.6% 22.3%
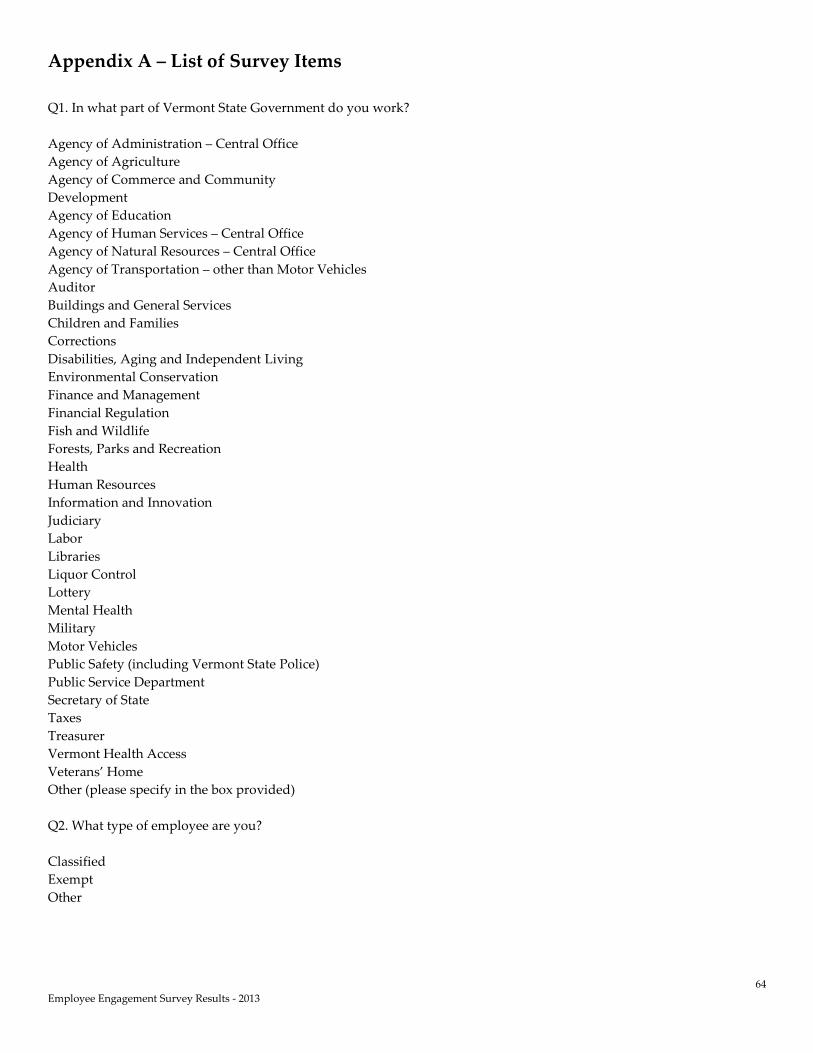
64
Employee Engagement Survey Results - 2013
Appendix A – List of Survey Items
Q1. In what part of Vermont State Government do you work?
Agency of Administration – Central Office
Agency of Agriculture
Agency of Commerce and Community
Development
Agency of Education
Agency of Human Services – Central Office
Agency of Natural Resources – Central Office
Agency of Transportation – other than Motor Vehicles
Auditor
Buildings and General Services
Children and Families
Corrections
Disabilities, Aging and Independent Living
Environmental Conservation
Finance and Management
Financial Regulation
Fish and Wildlife
Forests, Parks and Recreation
Health
Human Resources
Information and Innovation
Judiciary
Labor
Libraries
Liquor Control
Lottery
Mental Health
Military
Motor Vehicles
Public Safety (including Vermont State Police)
Public Service Department
Secretary of State
Taxes
Treasurer
Vermont Health Access
Veterans’ Home
Other (please specify in the box provided)
Q2. What type of employee are you?
Classified
Exempt
Other
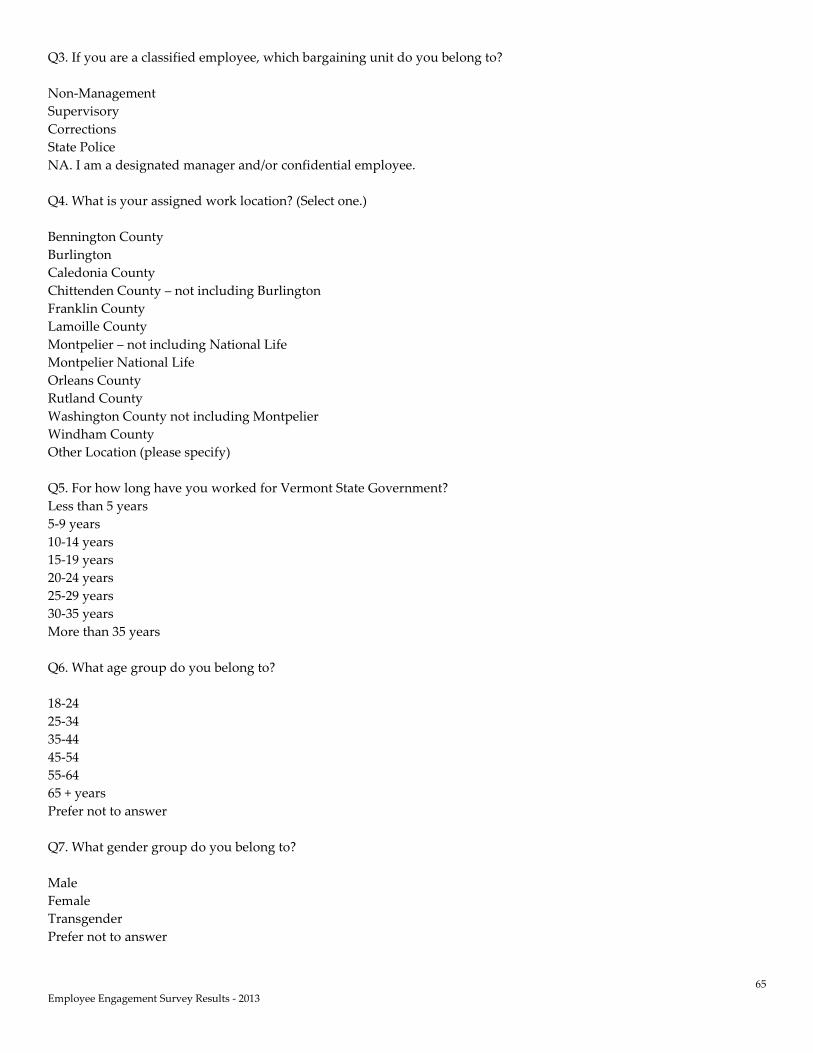
65
Employee Engagement Survey Results - 2013
Q3. If you are a classified employee, which bargaining unit do you belong to?
Non-Management
Supervisory
Corrections
State Police
NA. I am a designated manager and/or confidential employee.
Q4. What is your assigned work location? (Select one.)
Bennington County
Burlington
Caledonia County
Chittenden County – not including Burlington
Franklin County
Lamoille County
Montpelier – not including National Life
Montpelier National Life
Orleans County
Rutland County
Washington County not including Montpelier
Windham County
Other Location (please specify)
Q5. For how long have you worked for Vermont State Government?
Less than 5 years
5-9 years
10-14 years
15-19 years
20-24 years
25-29 years
30-35 years
More than 35 years
Q6. What age group do you belong to?
18-24
25-34
35-44
45-54
55-64
65 + years
Prefer not to answer
Q7. What gender group do you belong to?
Male
Female
Transgender
Prefer not to answer

66
Employee Engagement Survey Results - 2013
Q8. What racial/ethnic group do you belong to?
American Indian/Alaskan Native
Asian/Pacific Islander
Black or African American
Hispanic or Latino
Native Hawaiian/Other Pacific Islander
White
Two or more races
Prefer not to answer
Q9. What is your annual salary range before taxes?
Less than $25,000
Between $25,000 and $34,999
Between $35,000 and $44,999
Between $45,000 and $54,999
Between $55,000 and $64,999
Between $65,000 and $74,999
More than $75,000
Q10. What is the means of transportation you most commonly use when commuting to work?
Drive my own car with no other passengers
Carpool
Public bus
Van Pool
Bicycle
Walk
Other (please specify)
Q11. How far is your commute to work?
Less than 1 mile
Between 1 mile and 3 miles
Between 3.1 miles and 5 miles
Between 5.1 miles and 10 miles
Between 10.1 and 20 miles
Between 20.1 and 35 miles
Between 35.1 and 50 miles
More than 50 miles
For the following items the response scale was: Strongly Agree, Agree, Neither Agree nor Disagree, Disagree, and
Strongly Disagree.
Q12. I understand my job duties and responsibilities.
Q13. I understand the work, goals, and mission of my department or agency.
Q14. The work I perform is linked to my department or agency’s work.
Q15. The work I perform has an impact on my department or agency meeting its goals and mission.
Q16. The work I perform is meaningful and rewarding.
Q17. The work I perform is varied and interesting.
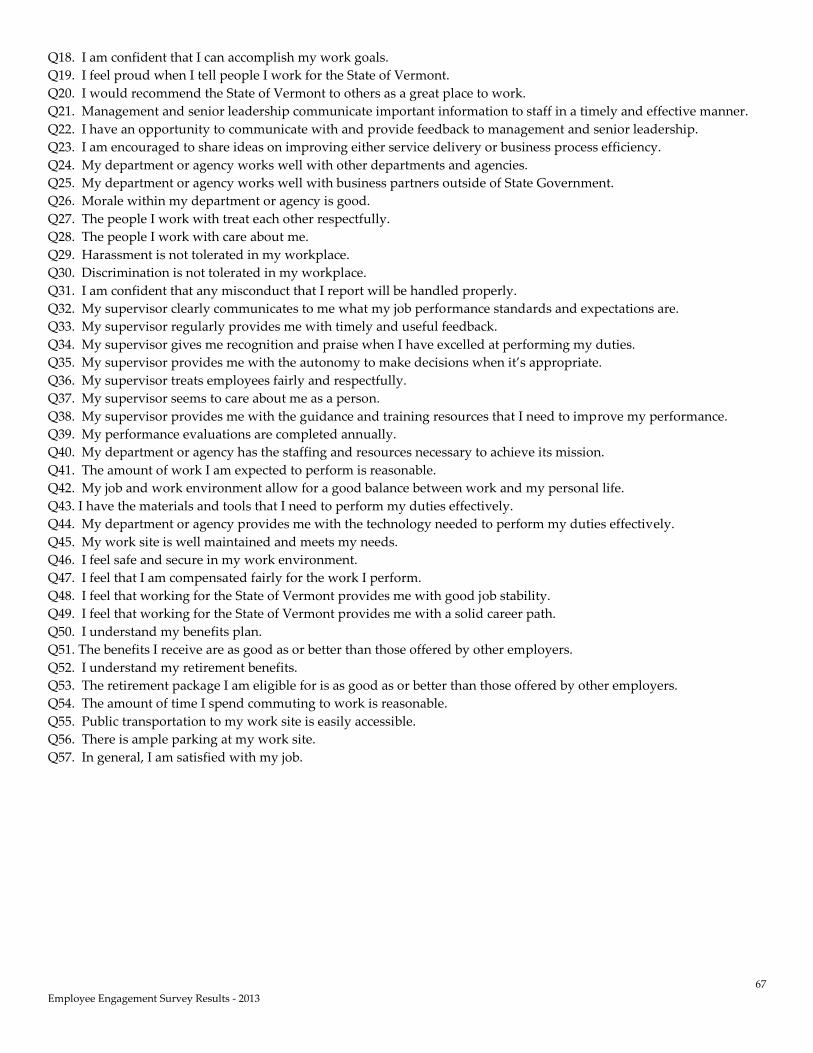
67
Employee Engagement Survey Results - 2013
Q18. I am confident that I can accomplish my work goals.
Q19. I feel proud when I tell people I work for the State of Vermont.
Q20. I would recommend the State of Vermont to others as a great place to work.
Q21. Management and senior leadership communicate important information to staff in a timely and effective manner.
Q22. I have an opportunity to communicate with and provide feedback to management and senior leadership.
Q23. I am encouraged to share ideas on improving either service delivery or business process efficiency.
Q24. My department or agency works well with other departments and agencies.
Q25. My department or agency works well with business partners outside of State Government.
Q26. Morale within my department or agency is good.
Q27. The people I work with treat each other respectfully.
Q28. The people I work with care about me.
Q29. Harassment is not tolerated in my workplace.
Q30. Discrimination is not tolerated in my workplace.
Q31. I am confident that any misconduct that I report will be handled properly.
Q32. My supervisor clearly communicates to me what my job performance standards and expectations are.
Q33. My supervisor regularly provides me with timely and useful feedback.
Q34. My supervisor gives me recognition and praise when I have excelled at performing my duties.
Q35. My supervisor provides me with the autonomy to make decisions when it’s appropriate.
Q36. My supervisor treats employees fairly and respectfully.
Q37. My supervisor seems to care about me as a person.
Q38. My supervisor provides me with the guidance and training resources that I need to improve my performance.
Q39. My performance evaluations are completed annually.
Q40. My department or agency has the staffing and resources necessary to achieve its mission.
Q41. The amount of work I am expected to perform is reasonable.
Q42. My job and work environment allow for a good balance between work and my personal life.
Q43. I have the materials and tools that I need to perform my duties effectively.
Q44. My department or agency provides me with the technology needed to perform my duties effectively.
Q45. My work site is well maintained and meets my needs.
Q46. I feel safe and secure in my work environment.
Q47. I feel that I am compensated fairly for the work I perform.
Q48. I feel that working for the State of Vermont provides me with good job stability.
Q49. I feel that working for the State of Vermont provides me with a solid career path.
Q50. I understand my benefits plan.
Q51. The benefits I receive are as good as or better than those offered by other employers.
Q52. I understand my retirement benefits.
Q53. The retirement package I am eligible for is as good as or better than those offered by other employers.
Q54. The amount of time I spend commuting to work is reasonable.
Q55. Public transportation to my work site is easily accessible.
Q56. There is ample parking at my work site.
Q57. In general, I am satisfied with my job.

68
Employee Engagement Survey Results - 2013
Appendix B – Frequencies for All Respondents by all Items
Q1 Agency/Department
Frequency Percent Valid
Percent Cumulative
Percent
Valid Administration - CO 30 0.9 0.9 0.9
Agriculture 33 1.0 1.0 1.9
ACCD 35 1.0 1.0 2.9
Education 115 3.4 3.4 6.3
Human Services - CO 124 3.7 3.7 10.0
ANR - CO 41 1.2 1.2 11.3
Transportation - not DMV 543 16.0 16.2 27.4
Auditor 7 0.2 0.2 27.7
BGS 162 4.8 4.8 32.5
Children & Families 319 9.4 9.5 42.0
Corrections 289 8.5 8.6 50.6
DAIL 111 3.3 3.3 53.9
Environmental Conservation 98 2.9 2.9 56.8
Finance & Management 22 0.6 0.7 57.5
Financial Regulation 54 1.6 1.6 59.1
Fish & Wildlife 39 1.2 1.2 60.3
Forests, Parks & Recreation 44 1.3 1.3 61.6
Health 228 6.7 6.8 68.4
Human Resources 63 1.9 1.9 70.2
Information & Innovation 50 1.5 1.5 71.7
Labor 152 4.5 4.5 76.3
Libraries 12 0.4 0.4 76.6
Liquor Control 17 0.5 0.5 77.1
Lottery 17 0.5 0.5 77.6
Mental Health 46 1.4 1.4 79.0
Miltary 17 0.5 0.5 79.5
Motor Vehicles 72 2.1 2.1 81.6
Public Safety (incl VSP) 267 7.9 8.0 89.6
Public Service Department 16 0.5 0.5 90.1
Secretary of State 23 0.7 0.7 90.8
Taxes 69 2.0 2.1 92.8
Treasurer 14 0.4 0.4 93.2
Vermont Health Access 60 1.8 1.8 95.0
Veterans' Home 62 1.8 1.8 96.9
Attorney General 54 1.6 1.6 98.5
Criminal Justice Training Council 3 0.1 0.1 98.6
Defender General 19 0.6 0.6 99.1
E 911 3 0.1 0.1 99.2
Green Mountain Care Board 11 0.3 0.3 99.6
Natural Resources Board 13 0.4 0.4 99.9
Public Service Board 2 0.1 0.1 100.0
Total 3,356 99.0 100.0
Missing 0 32 0.9
44 1 0.0
Total 33 1.0
Total 3,389 100.0

69
Employee Engagement Survey Results - 2013
Q2 Type of Employee
Frequency Percent Valid
Percent Cumulative
Percent
Valid Classified 2,820 83.2 84.6 84.6
Exempt 252 7.4 7.6 92.1
Other 262 7.7 7.9 100.0
Total 3,334 98.4 100.0
Missing 0 55 1.6
Total 3,389 100.0
Q3 Bargaining Unit
Frequency Percent Valid
Percent Cumulative
Percent
Valid Non-Management 1,988 58.7 68.7 68.7
Supervisory 417 12.3 14.4 83.2
Corrections 195 5.8 6.7 89.9
State Police 92 2.7 3.2 93.1
NA Manager and/or Confidential 200 5.9 6.9 100.0
Total 2,892 85.3 100.0
Missing 0 497 14.7
Total 3,389 100.0
Q4 Work Location
Frequency Percent Valid
Percent Cumulative
Percent
Valid Bennington County 141 4.2 4.3 4.3
Burlington 305 9.0 9.3 13.6
Caledonia County 98 2.9 3.0 16.6
Chittenden County - Not Burlington 432 12.7 13.2 29.7
Franklin County 122 3.6 3.7 33.5
Lamoille County 73 2.2 2.2 35.7
Montpelier - Not Nat. Life 751 22.2 22.9 58.6
Montpelier - Nat Life 407 12.0 12.4 71.0
Orleans County 89 2.6 2.7 73.7
Rutland County 201 5.9 6.1 79.8
Washington County - Not Montpelier 334 9.9 10.2 90.0
Windham County 121 3.6 3.7 93.7
Windsor County 144 4.2 4.4 98.0
Addison County 28 0.8 0.9 98.9
Essex County 3 0.1 0.1 99.0
Grand Isle County 6 0.2 0.2 99.2
Orange County 27 0.8 0.8 100.0
Total 3,282 96.8 100.0
Missing System 107 3.2
Total 3,389 100.0

70
Employee Engagement Survey Results - 2013
Q5 How Long worked for SOV
Frequency Percent Valid
Percent Cumulative
Percent
Valid Less than 5 years 828 24.4 24.7 24.7
5 - 9 years 759 22.4 22.6 47.3
10 - 14 years 579 17.1 17.3 64.6
15 -19 years 354 10.4 10.6 75.2
20 - 24 years 272 8.0 8.1 83.3
25 - 29 years 296 8.7 8.8 92.1
30 - 35 years 176 5.2 5.2 97.3
More than 35 years 89 2.6 2.7 100.0
Total 3,353 98.9 100.0
Missing 0 36 1.1
Total 3,389 100.0
Q6 Age Group
Frequency Percent Valid
Percent Cumulative
Percent
Valid 18 - 24 years 72 2.1 2.2 2.2
25 - 34 years 472 13.9 14.1 16.3
35 - 44 years 791 23.3 23.7 40.0
45 - 54 years 984 29.0 29.5 69.5
55 - 64 years 870 25.7 26.1 95.6
65+ years 93 2.7 2.8 98.4
Prefer not to answer 55 1.6 1.6 100.0
Total 3,337 98.5 100.0
Missing 0 52 1.5
Total 3,389 100.0
Q7 Gender
Frequency Percent Valid
Percent Cumulative
Percent
Valid Male 1,391 41.0 42.3 42.3
Female 1,782 52.6 54.2 96.5
Transgender 5 0.1 0.2 96.6
Prefer not to answer 111 3.3 3.4 100.0
Total 3,289 97.0 100.0
Missing 0 100 3.0
Total 3,389 100.0
Q8 Racial/Ethnic Group
Frequency Percent Valid
Percent Cumulative
Percent
Valid American Indian/Alaskan Native 32 0.9 1.0 1.0
Asian/Pacific Islander 15 0.4 0.5 1.4
Black or African American 4 0.1 0.1 1.6
Hispanic or Latino 11 0.3 0.3 1.9
Native Hawaiian/Other Pacific Islander 2 0.1 0.1 1.9
White 2,978 87.9 90.5 92.5
Two or more races 47 1.4 1.4 93.9
Prefer not to answer 200 5.9 6.1 100.0
Total 3,289 97.0 100.0
Missing 0 100 3.0
Total 3,389 100.0

71
Employee Engagement Survey Results - 2013
Q9 Annual salary range
Frequency Percent Valid
Percent Cumulative
Percent
Valid Less than $25,000 94 2.8 2.9 2.9
$25,000 - $34,999 407 12.0 12.7 15.6
$35,000 - $44,999 809 23.9 25.2 40.8
$45,000 - $54,999 830 24.5 25.8 66.6
$55,000 - $64,999 555 16.4 17.3 83.9
$65,000 - $74,999 305 9.0 9.5 93.4
More than $75,000 212 6.3 6.6 100.0
Total 3,212 94.8 100.0
Missing 0 177 5.2
Total 3,389 100.0
Q10 Means of Transportation
Frequency Percent Valid
Percent Cumulative
Percent
Valid Drive my own car with no other passengers 2,636 77.8 80.5 80.5
Carpool 287 8.5 8.8 89.3
Public bus 90 2.7 2.7 92.0
Van Pool 21 0.6 0.6 92.7
Bicycle 11 0.3 0.3 93.0
Walk 76 2.2 2.3 95.3
State vehicle 153 4.5 4.7 100.0
Total 3,274 96.6 100.0
Missing 0 2 0.1
System 113 3.3
Total 115 3.4
Total 3,389 100.0
Q11 How far is commute
Frequency Percent Valid
Percent Cumulative
Percent
Valid Less than 1 mile 173 5.1 5.3 5.3
1 to 3 miles 332 9.8 10.1 15.4
3.1 to 5 miles 215 6.3 6.6 22.0
5.1 to 10 miles 533 15.7 16.3 38.2
10.1 to 20 miles 807 23.8 24.6 62.8
20.1 to 35 miles 576 17.0 17.6 80.4
35.1 to 50 miles 466 13.8 14.2 94.6
More than 50 miles 177 5.2 5.4 100.0
Total 3,279 96.8 100.0
Missing 0 110 3.2
Total 3,389 100.0

72
Employee Engagement Survey Results - 2013
Q12 I understand my job duties and responsibilities.
Frequency Percent Valid
Percent Cumulative
Percent
Valid Strongly Agree 1,904 56.2 59.4 59.4
Agree 1,101 32.5 34.4 93.8
Neither Agree nor Disagree 119 3.5 3.7 97.5
Disagree 66 1.9 2.1 99.5
Strongly Disagree 15 0.4 0.5 100.0
Total 3,205 94.6 100.0
Missing System 184 5.4
Total 3,389 100.0
Q13 I understand the work, goals, and mission of my department or agency.
Frequency Percent Valid
Percent Cumulative
Percent
Valid Strongly Agree 1,630 48.1 51.0 51.0
Agree 1,224 36.1 38.3 89.2
Neither Agree nor Disagree 209 6.2 6.5 95.8
Disagree 103 3.0 3.2 99.0
Strongly Disagree 32 0.9 1.0 100.0
Total 3,198 94.4 100.0
Missing System 191 5.6
Total 3,389 100.0
Q14 The work I perform is linked to my department or agency’s work.
Frequency Percent Valid
Percent Cumulative
Percent
Valid Strongly Agree 1,891 55.8 59.1 59.1
Agree 1,126 33.2 35.2 94.3
Neither Agree nor Disagree 144 4.2 4.5 98.8
Disagree 23 0.7 0.7 99.5
Strongly Disagree 16 0.5 0.5 100.0
Total 3,200 94.4 100.0
Missing System 189 5.6
Total 3,389 100.0
Q15 The work I perform has an impact on my department or agency meeting its goals and mission.
Frequency Percent Valid
Percent Cumulative
Percent
Valid Strongly Agree 1,791 52.8 55.9 55.9
Agree 1,099 32.4 34.3 90.3
Neither Agree nor Disagree 246 7.3 7.7 97.9
Disagree 44 1.3 1.4 99.3
Strongly Disagree 22 0.6 0.7 100.0
Total 3,202 94.5 100.0
Missing System 187 5.5
Total 3,389 100.0

73
Employee Engagement Survey Results - 2013
Q16 The work I perform is meaningful and rewarding.
Frequency Percent Valid
Percent Cumulative
Percent
Valid Strongly Agree 1,332 39.3 41.7 41.7
Agree 1,156 34.1 36.2 77.8
Neither Agree nor Disagree 444 13.1 13.9 91.7
Disagree 185 5.5 5.8 97.5
Strongly Disagree 79 2.3 2.5 100.0
Total 3,196 94.3 100.0
Missing System 193 5.7
Total 3,389 100.0
Q17 The work I perform is varied and interesting.
Frequency Percent Valid
Percent Cumulative
Percent
Valid Strongly Agree 1,337 39.5 41.8 41.8
Agree 1,168 34.5 36.5 78.4
Neither Agree nor Disagree 468 13.8 14.6 93.0
Disagree 156 4.6 4.9 97.9
Strongly Disagree 68 2.0 2.1 100.0
Total 3,197 94.3 100.0
Missing System 192 5.7
Total 3,389 100.0
Q18 I am confident that I can accomplish my work goals.
Frequency Percent Valid
Percent Cumulative
Percent
Valid Strongly Agree 1,438 42.4 45.1 45.1
Agree 1,198 35.3 37.5 82.6
Neither Agree nor Disagree 326 9.6 10.2 92.8
Disagree 176 5.2 5.5 98.3
Strongly Disagree 53 1.6 1.7 100.0
Total 3,191 94.2 100.0
Missing System 198 5.8
Total 3,389 100.0
Q19 I feel proud when I tell people I work for the State of Vermont.
Frequency Percent Valid
Percent Cumulative
Percent
Valid Strongly Agree 982 29.0 30.7 30.7
Agree 1,075 31.7 33.6 64.4
Neither Agree nor Disagree 794 23.4 24.9 89.2
Disagree 231 6.8 7.2 96.5
Strongly Disagree 113 3.3 3.5 100.0
Total 3,195 94.3 100.0
Missing System 194 5.7
Total 3,389 100.0

74
Employee Engagement Survey Results - 2013
Q20 I would recommend the State of Vermont to others as a great place to work.
Frequency Percent Valid
Percent Cumulative
Percent
Valid Strongly Agree 822 24.3 25.7 25.7
Agree 1,089 32.1 34.1 59.8
Neither Agree nor Disagree 825 24.3 25.8 85.6
Disagree 296 8.7 9.3 94.8
Strongly Disagree 166 4.9 5.2 100.0
Total 3,198 94.4 100.0
Missing System 191 5.6
Total 3,389 100.0
Q21 Management and senior leadership communicate important information to staff in a timely and effective manner.
Frequency Percent Valid
Percent Cumulative
Percent
Valid Strongly Agree 448 13.2 14.0 14.0
Agree 1,058 31.2 33.0 47.0
Neither Agree nor Disagree 692 20.4 21.6 68.6
Disagree 672 19.8 21.0 89.6
Strongly Disagree 333 9.8 10.4 100.0
Total 3,203 94.5 100.0
Missing System 186 5.5
Total 3,389 100.0
Q22 I have an opportunity to communicate with and provide feedback to management and senior leadership.
Frequency Percent Valid
Percent Cumulative
Percent
Valid Strongly Agree 662 19.5 20.7 20.7
Agree 1,189 35.1 37.1 57.8
Neither Agree nor Disagree 598 17.6 18.7 76.4
Disagree 475 14.0 14.8 91.3
Strongly Disagree 280 8.3 8.7 100.0
Total 3,204 94.5 100.0
Missing System 185 5.5
Total 3,389 100.0
Q23 I am encouraged to share ideas on improving either service delivery or business process efficiency.
Frequency Percent Valid
Percent Cumulative
Percent
Valid Strongly Agree 655 19.3 20.5 20.5
Agree 1,039 30.7 32.5 53.0
Neither Agree nor Disagree 675 19.9 21.1 74.1
Disagree 522 15.4 16.3 90.4
Strongly Disagree 306 9.0 9.6 100.0
Total 3,197 94.3 100.0
Missing System 192 5.7
Total 3,389 100.0
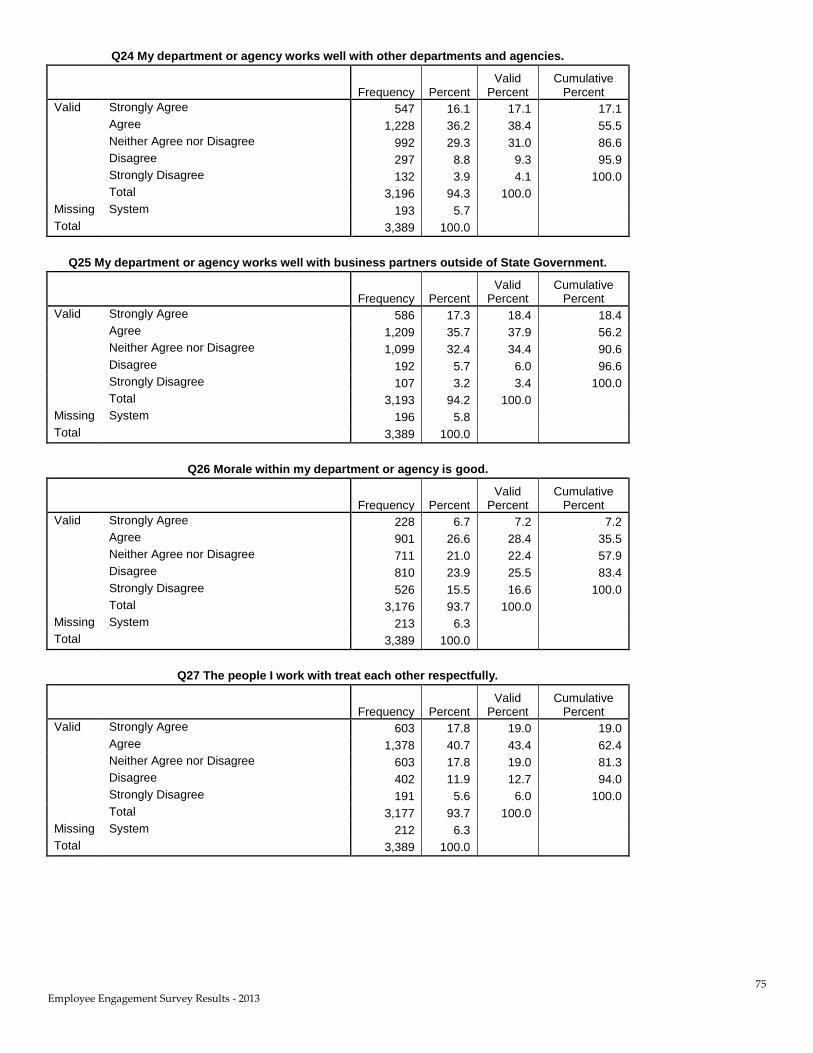
75
Employee Engagement Survey Results - 2013
Q24 My department or agency works well with other departments and agencies.
Frequency Percent Valid
Percent Cumulative
Percent
Valid Strongly Agree 547 16.1 17.1 17.1
Agree 1,228 36.2 38.4 55.5
Neither Agree nor Disagree 992 29.3 31.0 86.6
Disagree 297 8.8 9.3 95.9
Strongly Disagree 132 3.9 4.1 100.0
Total 3,196 94.3 100.0
Missing System 193 5.7
Total 3,389 100.0
Q25 My department or agency works well with business partners outside of State Government.
Frequency Percent Valid
Percent Cumulative
Percent
Valid Strongly Agree 586 17.3 18.4 18.4
Agree 1,209 35.7 37.9 56.2
Neither Agree nor Disagree 1,099 32.4 34.4 90.6
Disagree 192 5.7 6.0 96.6
Strongly Disagree 107 3.2 3.4 100.0
Total 3,193 94.2 100.0
Missing System 196 5.8
Total 3,389 100.0
Q26 Morale within my department or agency is good.
Frequency Percent Valid
Percent Cumulative
Percent
Valid Strongly Agree 228 6.7 7.2 7.2
Agree 901 26.6 28.4 35.5
Neither Agree nor Disagree 711 21.0 22.4 57.9
Disagree 810 23.9 25.5 83.4
Strongly Disagree 526 15.5 16.6 100.0
Total 3,176 93.7 100.0
Missing System 213 6.3
Total 3,389 100.0
Q27 The people I work with treat each other respectfully.
Frequency Percent Valid
Percent Cumulative
Percent
Valid Strongly Agree 603 17.8 19.0 19.0
Agree 1,378 40.7 43.4 62.4
Neither Agree nor Disagree 603 17.8 19.0 81.3
Disagree 402 11.9 12.7 94.0
Strongly Disagree 191 5.6 6.0 100.0
Total 3,177 93.7 100.0
Missing System 212 6.3
Total 3,389 100.0

76
Employee Engagement Survey Results - 2013
Q28 The people I work with care about me.
Frequency Percent Valid
Percent Cumulative
Percent
Valid Strongly Agree 598 17.6 18.9 18.9
Agree 1,332 39.3 42.1 61.0
Neither Agree nor Disagree 790 23.3 25.0 86.0
Disagree 279 8.2 8.8 94.8
Strongly Disagree 164 4.8 5.2 100.0
Total 3,163 93.3 100.0
Missing System 226 6.7
Total 3,389 100.0
Q29 Harassment is not tolerated in my workplace.
Frequency Percent Valid
Percent Cumulative
Percent
Valid Strongly Agree 1,035 30.5 32.6 32.6
Agree 1,223 36.1 38.6 71.2
Neither Agree nor Disagree 508 15.0 16.0 87.2
Disagree 263 7.8 8.3 95.5
Strongly Disagree 143 4.2 4.5 100.0
Total 3,172 93.6 100.0
Missing System 217 6.4
Total 3,389 100.0
Q30 Discrimination is not tolerated in my workplace.
Frequency Percent Valid
Percent Cumulative
Percent
Valid Strongly Agree 1,121 33.1 35.4 35.4
Agree 1,242 36.6 39.2 74.5
Neither Agree nor Disagree 501 14.8 15.8 90.3
Disagree 185 5.5 5.8 96.2
Strongly Disagree 121 3.6 3.8 100.0
Total 3,170 93.5 100.0
Missing System 219 6.5
Total 3,389 100.0
Q31 I am confident that any misconduct that I report will be handled properly.
Frequency Percent Valid
Percent Cumulative
Percent
Valid Strongly Agree 708 20.9 22.3 22.3
Agree 1,026 30.3 32.3 54.6
Neither Agree nor Disagree 699 20.6 22.0 76.6
Disagree 439 13.0 13.8 90.4
Strongly Disagree 305 9.0 9.6 100.0
Total 3,177 93.7 100.0
Missing System 212 6.3
Total 3,389 100.0

77
Employee Engagement Survey Results - 2013
Q32 My supervisor clearly communicates to me what my job performance standards and expectations are.
Frequency Percent Valid
Percent Cumulative
Percent
Valid Strongly Agree 884 26.1 27.9 27.9
Agree 1,214 35.8 38.3 66.1
Neither Agree nor Disagree 512 15.1 16.1 82.3
Disagree 387 11.4 12.2 94.5
Strongly Disagree 176 5.2 5.5 100.0
Total 3,173 93.6 100.0
Missing System 216 6.4
Total 3,389 100.0
Q33 My supervisor regularly provides me with timely and useful feedback.
Frequency Percent Valid
Percent Cumulative
Percent
Valid Strongly Agree 787 23.2 24.8 24.8
Agree 1,045 30.8 32.9 57.7
Neither Agree nor Disagree 637 18.8 20.1 77.8
Disagree 482 14.2 15.2 93.0
Strongly Disagree 222 6.6 7.0 100.0
Total 3,173 93.6 100.0
Missing System 216 6.4
Total 3,389 100.0
Q34 My supervisor gives me recognition and praise when I have excelled at performing my duties.
Frequency Percent Valid
Percent Cumulative
Percent
Valid Strongly Agree 911 26.9 28.8 28.8
Agree 1,053 31.1 33.2 62.0
Neither Agree nor Disagree 557 16.4 17.6 79.6
Disagree 398 11.7 12.6 92.2
Strongly Disagree 248 7.3 7.8 100.0
Total 3,167 93.4 100.0
Missing System 222 6.6
Total 3,389 100.0
Q35 My supervisor provides me with the autonomy to make decisions when it’s appropriate.
Frequency Percent Valid
Percent Cumulative
Percent
Valid Strongly Agree 1,148 33.9 36.2 36.2
Agree 1,246 36.8 39.3 75.6
Neither Agree nor Disagree 398 11.7 12.6 88.2
Disagree 209 6.2 6.6 94.8
Strongly Disagree 166 4.9 5.2 100.0
Total 3,167 93.4 100.0
Missing System 222 6.6
Total 3,389 100.0

78
Employee Engagement Survey Results - 2013
Q36 My supervisor treats employees fairly and respectfully.
Frequency Percent Valid
Percent Cumulative
Percent
Valid Strongly Agree 1,173 34.6 37.0 37.0
Agree 1,055 31.1 33.3 70.3
Neither Agree nor Disagree 485 14.3 15.3 85.6
Disagree 242 7.1 7.6 93.3
Strongly Disagree 213 6.3 6.7 100.0
Total 3,168 93.5 100.0
Missing System 221 6.5
Total 3,389 100.0
Q37 My supervisor seems to care about me as a person.
Frequency Percent Valid
Percent Cumulative
Percent
Valid Strongly Agree 1,182 34.9 37.5 37.5
Agree 1,108 32.7 35.1 72.6
Neither Agree nor Disagree 491 14.5 15.6 88.1
Disagree 201 5.9 6.4 94.5
Strongly Disagree 173 5.1 5.5 100.0
Total 3,155 93.1 100.0
Missing System 234 6.9
Total 3,389 100.0
Q38 My supervisor provides me with the guidance and training resources that I need to improve my performance.
Frequency Percent Valid
Percent Cumulative
Percent
Valid Strongly Agree 852 25.1 26.9 26.9
Agree 1,031 30.4 32.6 59.5
Neither Agree nor Disagree 673 19.9 21.3 80.7
Disagree 372 11.0 11.7 92.5
Strongly Disagree 238 7.0 7.5 100.0
Total 3,166 93.4 100.0
Missing System 223 6.6
Total 3,389 100.0
Q39 My performance evaluations are completed annually.
Frequency Percent Valid
Percent Cumulative
Percent
Valid Strongly Agree 856 25.3 27.3 27.3
Agree 899 26.5 28.6 55.9
Neither Agree nor Disagree 527 15.6 16.8 72.7
Disagree 345 10.2 11.0 83.6
Strongly Disagree 514 15.2 16.4 100.0
Total 3,141 92.7 100.0
Missing System 248 7.3
Total 3,389 100.0

79
Employee Engagement Survey Results - 2013
Q40 My department or agency has the staffing and resources necessary to achieve its mission.
Frequency Percent Valid
Percent Cumulative
Percent
Valid Strongly Agree 205 6.0 6.5 6.5
Agree 806 23.8 25.7 32.2
Neither Agree nor Disagree 611 18.0 19.5 51.7
Disagree 944 27.9 30.1 81.7
Strongly Disagree 573 16.9 18.3 100.0
Total 3,139 92.6 100.0
Missing System 250 7.4
Total 3,389 100.0
Q41 The amount of work I am expected to perform is reasonable.
Frequency Percent Valid
Percent Cumulative
Percent
Valid Strongly Agree 317 9.4 10.1 10.1
Agree 1,280 37.8 40.7 50.8
Neither Agree nor Disagree 637 18.8 20.3 71.1
Disagree 616 18.2 19.6 90.7
Strongly Disagree 293 8.6 9.3 100.0
Total 3,143 92.7 100.0
Missing System 246 7.3
Total 3,389 100.0
Q42 My job and work environment allow for a good balance between work and my personal life.
Frequency Percent Valid
Percent Cumulative
Percent
Valid Strongly Agree 448 13.2 14.3 14.3
Agree 1,247 36.8 39.7 54.0
Neither Agree nor Disagree 675 19.9 21.5 75.5
Disagree 496 14.6 15.8 91.3
Strongly Disagree 273 8.1 8.7 100.0
Total 3,139 92.6 100.0
Missing System 250 7.4
Total 3,389 100.0
Q43 I have the materials and tools that I need to perform my duties effectively.
Frequency Percent Valid
Percent Cumulative
Percent
Valid Strongly Agree 454 13.4 14.5 14.5
Agree 1,440 42.5 45.8 60.3
Neither Agree nor Disagree 597 17.6 19.0 79.3
Disagree 462 13.6 14.7 94.0
Strongly Disagree 188 5.5 6.0 100.0
Total 3,141 92.7 100.0
Missing System 248 7.3
Total 3,389 100.0
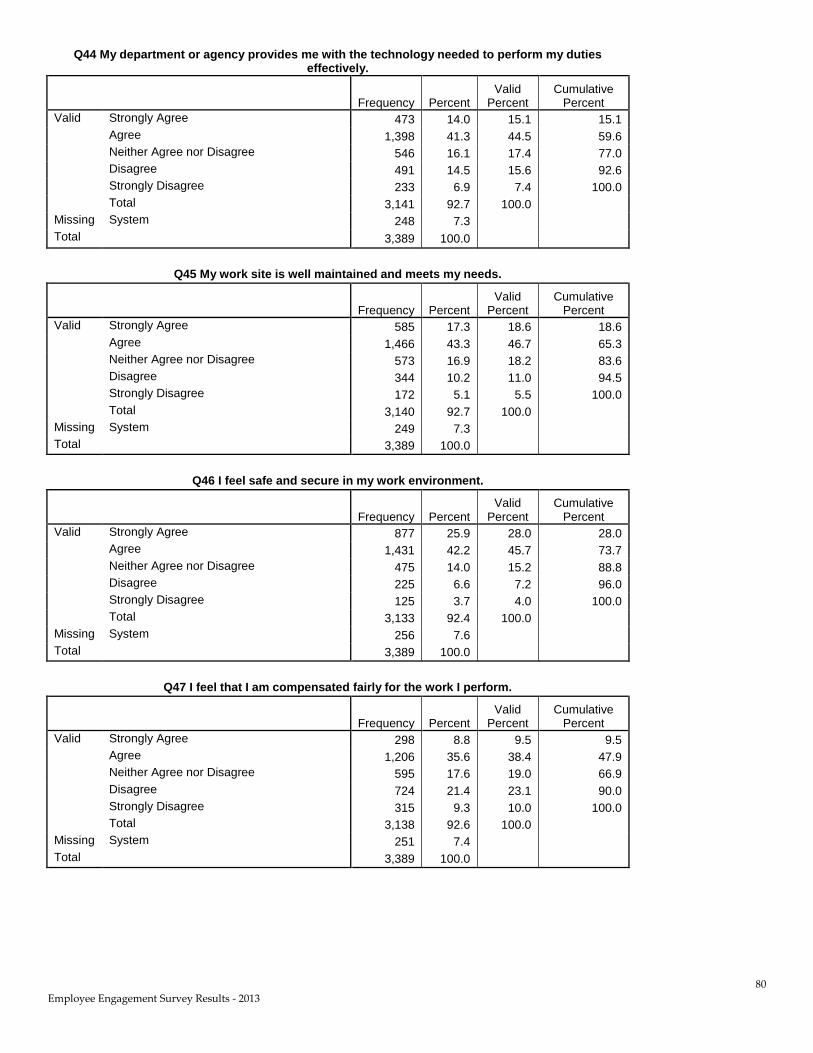
80
Employee Engagement Survey Results - 2013
Q44 My department or agency provides me with the technology needed to perform my duties effectively.
Frequency Percent Valid
Percent Cumulative
Percent
Valid Strongly Agree 473 14.0 15.1 15.1
Agree 1,398 41.3 44.5 59.6
Neither Agree nor Disagree 546 16.1 17.4 77.0
Disagree 491 14.5 15.6 92.6
Strongly Disagree 233 6.9 7.4 100.0
Total 3,141 92.7 100.0
Missing System 248 7.3
Total 3,389 100.0
Q45 My work site is well maintained and meets my needs.
Frequency Percent Valid
Percent Cumulative
Percent
Valid Strongly Agree 585 17.3 18.6 18.6
Agree 1,466 43.3 46.7 65.3
Neither Agree nor Disagree 573 16.9 18.2 83.6
Disagree 344 10.2 11.0 94.5
Strongly Disagree 172 5.1 5.5 100.0
Total 3,140 92.7 100.0
Missing System 249 7.3
Total 3,389 100.0
Q46 I feel safe and secure in my work environment.
Frequency Percent Valid
Percent Cumulative
Percent
Valid Strongly Agree 877 25.9 28.0 28.0
Agree 1,431 42.2 45.7 73.7
Neither Agree nor Disagree 475 14.0 15.2 88.8
Disagree 225 6.6 7.2 96.0
Strongly Disagree 125 3.7 4.0 100.0
Total 3,133 92.4 100.0
Missing System 256 7.6
Total 3,389 100.0
Q47 I feel that I am compensated fairly for the work I perform.
Frequency Percent Valid
Percent Cumulative
Percent
Valid Strongly Agree 298 8.8 9.5 9.5
Agree 1,206 35.6 38.4 47.9
Neither Agree nor Disagree 595 17.6 19.0 66.9
Disagree 724 21.4 23.1 90.0
Strongly Disagree 315 9.3 10.0 100.0
Total 3,138 92.6 100.0
Missing System 251 7.4
Total 3,389 100.0

81
Employee Engagement Survey Results - 2013
Q48 I feel that working for the State of Vermont provides me with good job stability.
Frequency Percent Valid
Percent Cumulative
Percent
Valid Strongly Agree 688 20.3 21.9 21.9
Agree 1,748 51.6 55.7 77.6
Neither Agree nor Disagree 458 13.5 14.6 92.2
Disagree 174 5.1 5.5 97.7
Strongly Disagree 72 2.1 2.3 100.0
Total 3,140 92.7 100.0
Missing System 249 7.3
Total 3,389 100.0
Q49 I feel that working for the State of Vermont provides me with a solid career path.
Frequency Percent Valid
Percent Cumulative
Percent
Valid Strongly Agree 498 14.7 15.9 15.9
Agree 1,262 37.2 40.3 56.2
Neither Agree nor Disagree 811 23.9 25.9 82.1
Disagree 405 12.0 12.9 95.0
Strongly Disagree 156 4.6 5.0 100.0
Total 3,132 92.4 100.0
Missing System 257 7.6
Total 3,389 100.0
Q50 I understand my benefits plan.
Frequency Percent Valid
Percent Cumulative
Percent
Valid Strongly Agree 638 18.8 20.4 20.4
Agree 1,811 53.4 57.9 78.3
Neither Agree nor Disagree 489 14.4 15.6 93.9
Disagree 155 4.6 5.0 98.8
Strongly Disagree 36 1.1 1.2 100.0
Total 3,129 92.3 100.0
Missing System 260 7.7
Total 3,389 100.0
Q51 The benefits I receive are as good as or better than those offered by other employers.
Frequency Percent Valid
Percent Cumulative
Percent
Valid Strongly Agree 683 20.2 21.8 21.8
Agree 1,365 40.3 43.6 65.5
Neither Agree nor Disagree 736 21.7 23.5 89.0
Disagree 248 7.3 7.9 96.9
Strongly Disagree 96 2.8 3.1 100.0
Total 3,128 92.3 100.0
Missing System 261 7.7
Total 3,389 100.0

82
Employee Engagement Survey Results - 2013
Q52 I understand my retirement benefits.
Frequency Percent Valid
Percent Cumulative
Percent
Valid Strongly Agree 439 13.0 14.1 14.1
Agree 1,341 39.6 42.9 57.0
Neither Agree nor Disagree 847 25.0 27.1 84.1
Disagree 421 12.4 13.5 97.6
Strongly Disagree 75 2.2 2.4 100.0
Total 3,123 92.2 100.0
Missing System 266 7.8
Total 3,389 100.0
Q53 The retirement package I am eligible for is as good as or better than those offered by other employers.
Frequency Percent Valid
Percent Cumulative
Percent
Valid Strongly Agree 449 13.2 14.4 14.4
Agree 1,050 31.0 33.6 48.0
Neither Agree nor Disagree 1,289 38.0 41.3 89.3
Disagree 255 7.5 8.2 97.5
Strongly Disagree 78 2.3 2.5 100.0
Total 3,121 92.1 100.0
Missing System 268 7.9
Total 3,389 100.0
Q54 The amount of time I spend commuting to work is reasonable.
Frequency Percent Valid
Percent Cumulative
Percent
Valid Strongly Agree 932 27.5 29.8 29.8
Agree 1,326 39.1 42.4 72.3
Neither Agree nor Disagree 381 11.2 12.2 84.5
Disagree 300 8.9 9.6 94.1
Strongly Disagree 185 5.5 5.9 100.0
Total 3,124 92.2 100.0
Missing System 265 7.8
Total 3,389 100.0
Q55 Public transportation to my work site is easily accessible.
Frequency Percent Valid
Percent Cumulative
Percent
Valid Strongly Agree 257 7.6 8.3 8.3
Agree 427 12.6 13.8 22.0
Neither Agree nor Disagree 708 20.9 22.8 44.9
Disagree 736 21.7 23.7 68.6
Strongly Disagree 975 28.8 31.4 100.0
Total 3,103 91.6 100.0
Missing System 286 8.4
Total 3,389 100.0

83
Employee Engagement Survey Results - 2013
Q56 There is ample parking at my work site.
Frequency Percent Valid
Percent Cumulative
Percent
Valid Strongly Agree 683 20.2 22.0 22.0
Agree 1,130 33.3 36.4 58.4
Neither Agree nor Disagree 340 10.0 11.0 69.4
Disagree 405 12.0 13.0 82.4
Strongly Disagree 546 16.1 17.6 100.0
Total 3,104 91.6 100.0
Missing System 285 8.4
Total 3,389 100.0
Q57 In general, I am satisfied with my job.
Frequency Percent Valid
Percent Cumulative
Percent
Valid Strongly Agree 610 18.0 19.6 19.6
Agree 1,564 46.1 50.2 69.7
Neither Agree nor Disagree 526 15.5 16.9 86.6
Disagree 313 9.2 10.0 96.7
Strongly Disagree 104 3.1 3.3 100.0
Total 3,117 92.0 100.0
Missing System 272 8.0
Total 3,389 100.0


