T he long-term economic forecast calls for the continuation of the economic recovery in 2014 and steady employment growth through 2050. Figures 1 through 8, respectively, report the employment, Gross Regional Product (GRP), and personal income predictions for Clark County from the calibrated model. Employment forecast Our forecast of total employment for Clark County is shown in Figure 1. The forecast predicts a steady economic recovery for Southern Nevada from 2014 onward. The Las Vegas economy is forecasted to add 32,000 new jobs in 2014. The forecast also predicts that the Las Vegas economy will return to the 2007 peak employment level (1.18 million jobs) by 2015. It is projected that by 2050 Clark County’s total employment would be slightly over 1.8 million. The employment growth forecasts for the region are shown in Figure 2. In the long term, we are forecasting that the Clark County economy will enjoy steady job gains through 2050. Between 2014 and 2015 total employment in the region is expected to grow at about 3.1 percent per year. The growth rate then declines to about 2.4 percent per year between 2016 and 2020 and eventually stabilizes at around 1 percent as the Southern Nevada economy reaches maturity. We forecast that the Clark County workforce will be roughly 1.8 million by the year 2050. Analysis of the Long-Term Economic Forecast Figure 1: Total Employment (1990-2050) Source: Center for Business and Economic Research, UNLV Source: Center for Business and Economic Research, UNLV Figure 2: Annual Growth in Employment (2014-2050) CENTER FOR BUSINESS & ECONOMIC RESEARCH LEE BUSINESS SCHOOL CLARK COUNTY ANNUAL LONG-TERM ECONOMIC FORECAST 2013
Transcript
The long-term economic forecast calls for the continuation of the economic recovery in 2014 and
steady employment growth through 2050. Figures 1 through 8, respectively, report the employment, Gross Regional Product (GRP), and personal income predictions for Clark County from the calibrated model.
Employment forecast
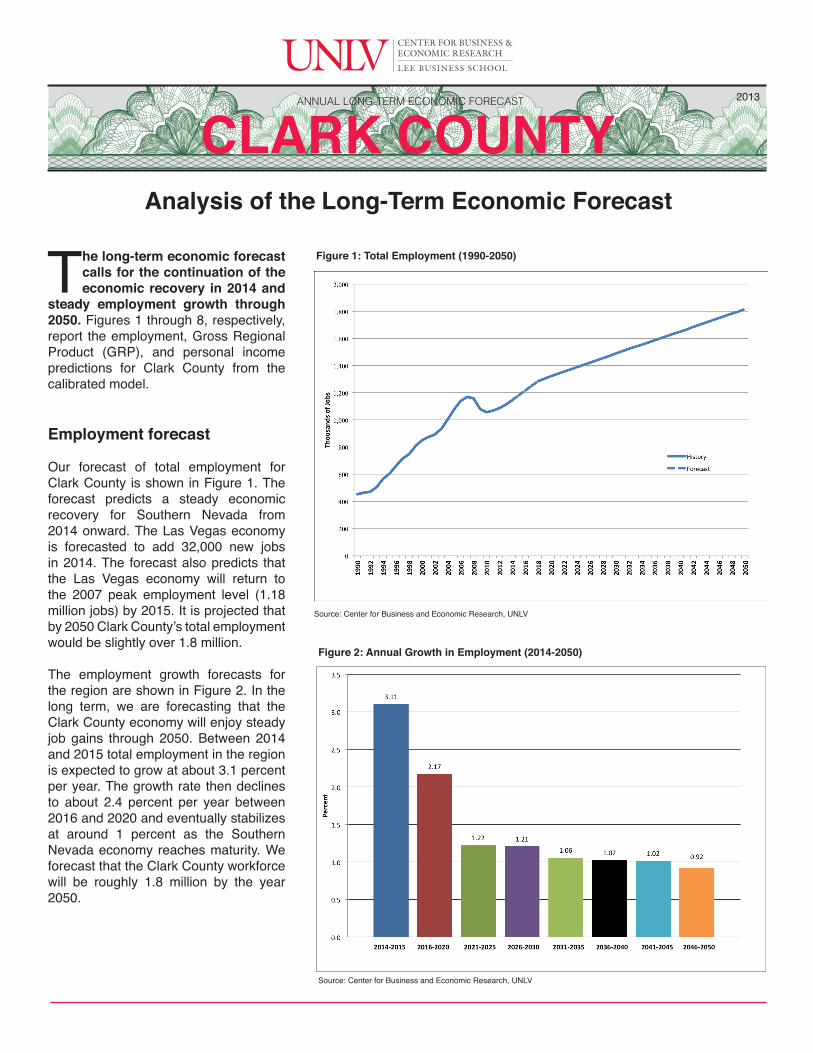
Our forecast of total employment for Clark County is shown in Figure 1. The forecast predicts a steady economic recovery for Southern Nevada from 2014 onward. The Las Vegas economy is forecasted to add 32,000 new jobs in 2014. The forecast also predicts that the Las Vegas economy will return to the 2007 peak employment level (1.18 million jobs) by 2015. It is projected that by 2050 Clark County’s total employment would be slightly over 1.8 million.
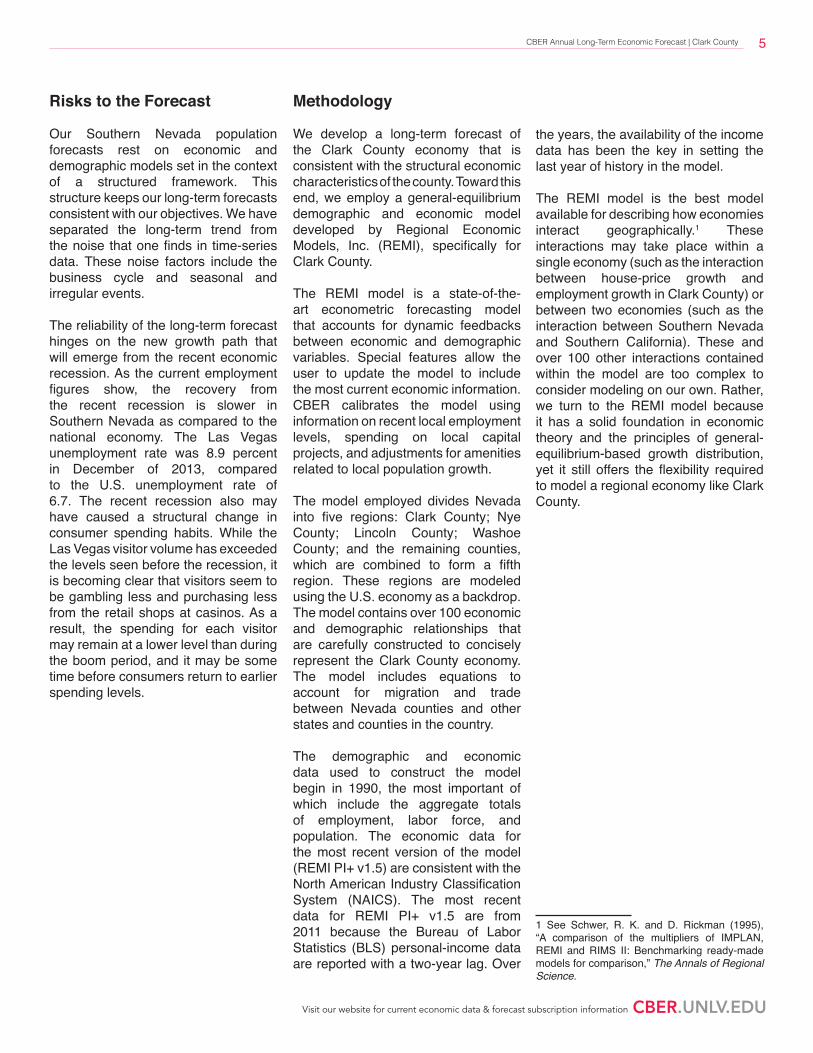
The employment growth forecasts for the region are shown in Figure 2. In the long term, we are forecasting that the Clark County economy will enjoy steady job gains through 2050. Between 2014 and 2015 total employment in the region is expected to grow at about 3.1 percent per year. The growth rate then declines to about 2.4 percent per year between 2016 and 2020 and eventually stabilizes at around 1 percent as the Southern Nevada economy reaches maturity. We forecast that the Clark County workforce will be roughly 1.8 million by the year 2050.
Analysis of the Long-Term Economic Forecast
Figure 1: Total Employment (1990-2050)
Source: Center for Business and Economic Research, UNLV
Source: Center for Business and Economic Research, UNLV
Figure 2: Annual Growth in Employment (2014-2050)
CENTER FOR BUSINESS &ECONOMIC RESEARCH
LEE BUSINESS SCHOOL
CLARK COUNTYANNUAL LONG-TERM ECONOMIC FORECAST 2013
The future path of Clark County employement is a product of the employement outlooks for the major industries of the region. Figure 3 shows the employment forecast for the major industries of the Clark County economy. We predict that the tourism sector, accommodation and food services, will continue to dominate the economy of the region. Accomodation and food services remains by far the leading sector of the region’s economy, followed by retail trade. As the demand for elderly care services continues to increase in the United States. In the long term, our forecast predicts that the health care industry surpasses the retail trade sector to become the second leading industry in the region after 2034. Over the entire period 2014 to 2050, total employment in Southern Nevada is forecasted to grow by an average of 1.6 percent, as show in Figure 4, with a wide variation in performance across the major sectors of the region. The strongest growth is expected in the health care services sector, which is expected to expand at a rate of 4.4 percent per year. This is no surprise as the retired population in the United States continues to grow and new retirees look for cheaper and warmer places to live across the nation. The construction sector, which suffered the biggest employment losses during the recent recession, is expected to see a strong growth over the long-term horizon.
We project an average growth rate of 4.2 percent per year for the construction industry. Accommodation and food services, the largest sector of the Southern Nevada economy, is projected to grow steadily at an average rate of 1.2 percent per year over the long term. Modest growth is projected in real estate services, finance, and governement jobs. Slightly faster growth is anticipated for the “other industries” category which comprises farming, mining, manufacturing, education, and professional and business services.
Figure 3: Employment by Industry (2014-2050)
Figure 4: Average Annual Employment Growth by Industry (2014-2050)
Source: Center for Business and Economic Research, UNLV
Source: Center for Business and Economic Research, UNLV
2 CBER Annual Long-Term Economic Forecast | Clark County
Gross regional product forecast
Gross Regional Product (GRP) is defined as the dollar value of all final goods and services for sale in a regional economy. As such, it reflects the output of a local economy and avoids double-counting initial and intermediate goods. The long-term forecast for the inflation-adjusted (real) GRP of Clark County, shown in Figure 5, basically mirrors the pattern of local employment but also reflects continued growth in productivity throughout the majority of the forecast. Personal consumption expenditures will continue to dominate the region’s GRP. The GRP share of personal consumption is also projected to grow larger in the long term, as Figure 5 shows.
Figure 6 shows the average annual growth rates in the region’s real GRP over the range of the long-term forecast. Coming out of the Great Recession, the Clark County economy is projected to experience a fast-paced growth with annual rates around 4.5 percent between 2014 and 2020. Then the annual GRP growth rates are projected to stabilize at around 2.5 percent as the Southern Nevada economy reaches maturity.
Source: Center for Business and Economic Research, UNLV
Source: Center for Business and Economic Research, UNLV
Figure 6: Average Annual Growth in GRP (2014-2050)
3CBER Annual Long-Term Economic Forecast | Clark County
Personal income forecast
Income is another key dimension of the region’s economic profile. Real personal income per capita is regarded by most economists as one of the key measures of well-being for a region. Figure 7 shows the long-term forecast of real personal income per capita for the Southern Nevada economy. We project that the region will see a steady growth in real personal income per capita through 2050. Figure 8 shows the average annual growth rates in real personal income per capita for the period 2014 through 2050. The recovery from the growth recession provides a boost to per capita income. The first two years of the forecast, 2014 to 2015, are the strongest with real income per capita increasing by an average of 2.1 percent per year. Then we project a gradual slowdown in income growth in the next ten years. We expect that real income per capita will grow at an average rate of 1.8 percent during the years 2016 to 2020. From 2021 to 2025 real income per capita in Southern Nevada is projected to grow at an average rate of 1 percent per year. After 2025, real personal income growth is projected to gradually increase and eventually stabilize to an average rate of 1.7 percent in the 2031 to 2050 period.
Source: Center for Business and Economic Research, UNLV
Source: Center for Business and Economic Research, UNLV
Figure 7: Real Personal Income Per Capita (2014-2050)
Figure 8: Average Annual Growth in Personal Income Per Capita (2014-2050)
4 CBER Annual Long-Term Economic Forecast | Clark County
Risks to the Forecast
Our Southern Nevada population forecasts rest on economic and demographic models set in the context of a structured framework. This structure keeps our long-term forecasts consistent with our objectives. We have separated the long-term trend from the noise that one finds in time-series data. These noise factors include the business cycle and seasonal and irregular events.
The reliability of the long-term forecast hinges on the new growth path that will emerge from the recent economic recession. As the current employment figures show, the recovery from the recent recession is slower in Southern Nevada as compared to the national economy. The Las Vegas unemployment rate was 8.9 percent in December of 2013, compared to the U.S. unemployment rate of 6.7. The recent recession also may have caused a structural change in consumer spending habits. While the Las Vegas visitor volume has exceeded the levels seen before the recession, it is becoming clear that visitors seem to be gambling less and purchasing less from the retail shops at casinos. As a result, the spending for each visitor may remain at a lower level than during the boom period, and it may be some time before consumers return to earlier spending levels.
the years, the availability of the income data has been the key in setting the last year of history in the model. The REMI model is the best model available for describing how economies interact geographically.1 These interactions may take place within a single economy (such as the interaction between house-price growth and employment growth in Clark County) or between two economies (such as the interaction between Southern Nevada and Southern California). These and over 100 other interactions contained within the model are too complex to consider modeling on our own. Rather, we turn to the REMI model because it has a solid foundation in economic theory and the principles of general-equilibrium-based growth distribution, yet it still offers the flexibility required to model a regional economy like Clark County.
1 See Schwer, R. K. and D. Rickman (1995), “A comparison of the multipliers of IMPLAN, REMI and RIMS II: Benchmarking ready-made models for comparison,” The Annals of Regional Science.
Methodology
We develop a long-term forecast of the Clark County economy that is consistent with the structural economic characteristics of the county. Toward this end, we employ a general-equilibrium demographic and economic model developed by Regional Economic Models, Inc. (REMI), specifically for Clark County. The REMI model is a state-of-the-art econometric forecasting model that accounts for dynamic feedbacks between economic and demographic variables. Special features allow the user to update the model to include the most current economic information. CBER calibrates the model using information on recent local employment levels, spending on local capital projects, and adjustments for amenities related to local population growth. The model employed divides Nevada into five regions: Clark County; Nye County; Lincoln County; Washoe County; and the remaining counties, which are combined to form a fifth region. These regions are modeled using the U.S. economy as a backdrop. The model contains over 100 economic and demographic relationships that are carefully constructed to concisely represent the Clark County economy. The model includes equations to account for migration and trade between Nevada counties and other states and counties in the country. The demographic and economic data used to construct the model begin in 1990, the most important of which include the aggregate totals of employment, labor force, and population. The economic data for the most recent version of the model (REMI PI+ v1.5) are consistent with the North American Industry Classification System (NAICS). The most recent data for REMI PI+ v1.5 are from 2011 because the Bureau of Labor Statistics (BLS) personal-income data are reported with a two-year lag. Over
5CBER Annual Long-Term Economic Forecast | Clark County
Variable 2014 2015 2016 2017 2018 2019 2020 2021
Total Employment 1145.669 1181.241 1216.514 1251.396 1285.547 1304.888 1322.260 1338.733
Total Employment as Share of Nation 0.622 0.628 0.634 0.639 0.643 0.647 0.650 0.653
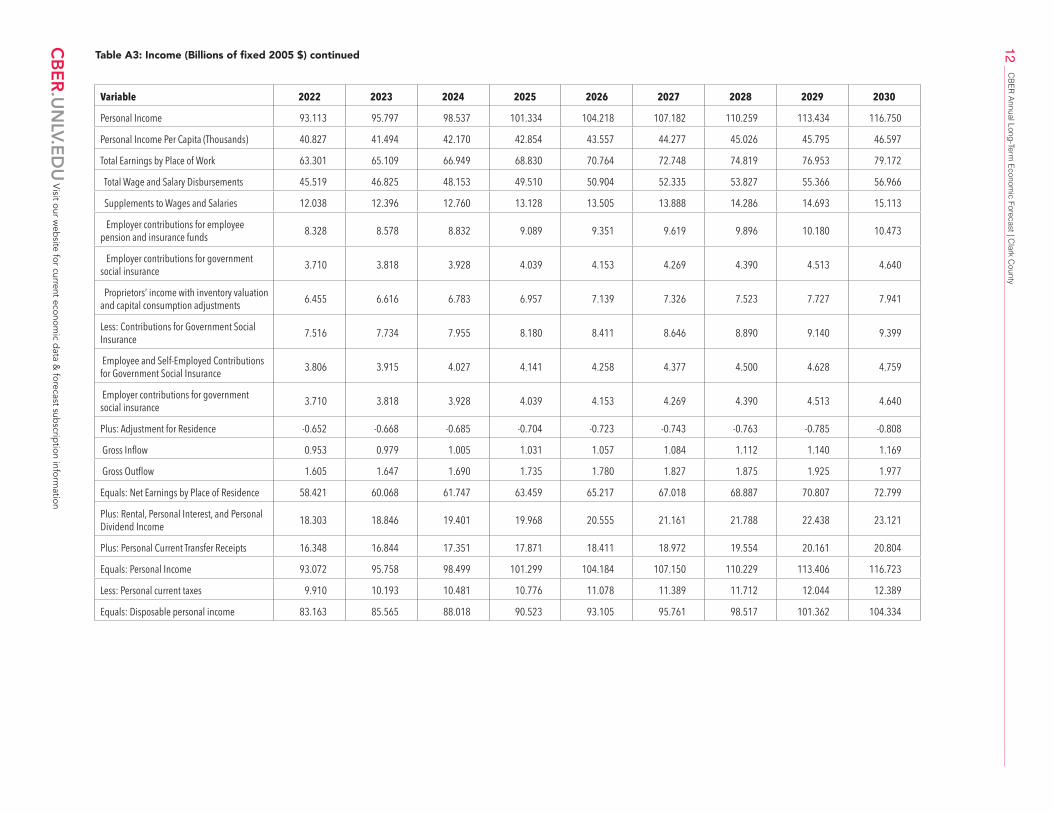
Equals: Net Earnings by Place of Residence 58.421 60.068 61.747 63.459 65.217 67.018 68.887 70.807 72.799
Plus: Rental, Personal Interest, and Personal Dividend Income 18.303 18.846 19.401 19.968 20.555 21.161 21.788 22.438 23.121
Plus: Personal Current Transfer Receipts 16.348 16.844 17.351 17.871 18.411 18.972 19.554 20.161 20.804
Equals: Personal Income 93.072 95.758 98.499 101.299 104.184 107.150 110.229 113.406 116.723
Less: Personal current taxes 9.910 10.193 10.481 10.776 11.078 11.389 11.712 12.044 12.389
Equals: Disposable personal income 83.163 85.565 88.018 90.523 93.105 95.761 98.517 101.362 104.334
Table A3: Income (Billions of fixed 2005 $) continued12
CBER Annual Long-Term
Economic Forecast | C
lark County
Variable 2035 2040 2045 2050
Personal Income 133.034 151.398 172.003 194.721
Personal Income Per Capita (Thousands) 50.240 54.198 58.387 62.729
Total Earnings by Place of Work 89.904 101.750 115.064 130.087
Total Wage and Salary Disbursements 64.706 73.296 82.970 93.917
Supplements to Wages and Salaries 17.129 19.345 21.796 24.503
Employer contributions for employee pension and insurance funds 11.879 13.423 15.131 17.018
Employer contributions for government social insurance 5.251 5.922 6.665 7.485
Proprietors’ income with inventory valuation and capital consumption adjustments 8.980 10.061 11.231 12.463
Less: Contributions for Government Social Insurance 10.643 12.008 13.519 15.187
Employee and Self-Employed Contributions for Government Social Insurance 5.392 6.086 6.854 7.701
Employer contributions for government social insurance 5.251 5.922 6.665 7.485
Plus: Adjustment for Residence -0.923 -1.058 -1.211 -1.368
Gross Inflow 1.305 1.453 1.617 1.805
Gross Outflow 2.228 2.511 2.828 3.173
Equals: Net Earnings by Place of Residence 82.372 92.814 104.340 117.006
Plus: Rental, Personal Interest, and Personal Dividend Income 26.540 30.524 35.064 40.108
Plus: Personal Current Transfer Receipts 24.103 28.048 32.595 37.612
Equals: Personal Income 133.015 151.386 171.999 194.726
Less: Personal current taxes 14.067 15.930 18.006 20.293
Equals: Disposable personal income 118.948 135.456 153.994 174.433
Table A3: Income (Billions of fixed 2005 $) continued13
CBER Annual Long-Term
Economic Forecast | C
lark County
14CBER Annual Long-Term Economic Forecast | Clark County
The Center for Business and Economic Research produces regular economic forecasts. We invite you to become a Forecast Sponsor. The Silver sponsorship level entitles you to the quarterly economic forecast for Southern Nevada. The Gold sponsorship level entitles you to the quarterly economic forecasts for Southern Nevada, Southern Nevada Gaming and Hospitality, and the United States, plus the semi-annual economic forecast for Asia/Pacific. At the Platinum sponsorship level, you will receive these forecast publications, plus the annual long-term economic forecasts for Southern Nevada.
Custom forecasting services for your business are also available. For information on becoming a forecast sponsor or for an evaluation of your custom forecasting needs, please contact:
Stephen P. A. Brown, PhDDirector & Professor of Economics(702) 895-3191
Ryan T. KennellyEconomic Analyst & Forecast Manager(702) 895-0994
Center for Business & Economic Research • Box 456002 • 4505 South Maryland Parkway • Las Vegas, Nevada 89154-6002 • Telephone (702) 895-3191 • Email: [email protected]
CENTER FOR BUSINESS &ECONOMIC RESEARCH
LEE BUSINESS SCHOOL
Stephen P. A. Brown, PhDDirector & Professor of Economics
Constant Tra, PhDAssociate Director & Associate Professor of Economics
Rennae Daneshvary, PhDAssociate Director of Research & Administration, Director of Surveys, Director of Nevada KIDS COUNT