Analysis of the Schemes Risk Measurement Returns - 2016
Research and Monitoring Unit
Prepared by: Carrie-Anne Cairncross, Mondi Govuzela and Martin Moabelo [Email: / [email protected] [email protected] [email protected]] Approved by: Dr Anton de Villiers Research and Monitoring Unit, Council for Medical Schemes, Block A, Eco Glades 2 Office Park, 420 Witch-Hazel Avenue, Eco Park, Centurion, 0157 [email: [email protected]] Publication date: 22 December 2017
i
Table of Contents
Executive summary ........................................................................................................................................................ 1
1. Introduction ............................................................................................................................................................. 3
2. Purpose of the analysis ......................................................................................................................................... 3
3. Methodology ........................................................................................................................................................... 3
3.1. Data source .................................................................................................................................................. 3
3.2. Case definitions and benchmarks ............................................................................................................... 4
3.3. Entry and verification criteria ....................................................................................................................... 5
3.4. Estimation of expected values .................................................................................................................... 5
3.5. Categorisation .............................................................................................................................................. 5
4. Scheme evaluation results .................................................................................................................................... 7
4.1. SRM data submitted for analysis ................................................................................................................ 7
4.2. Data quality .................................................................................................................................................. 7
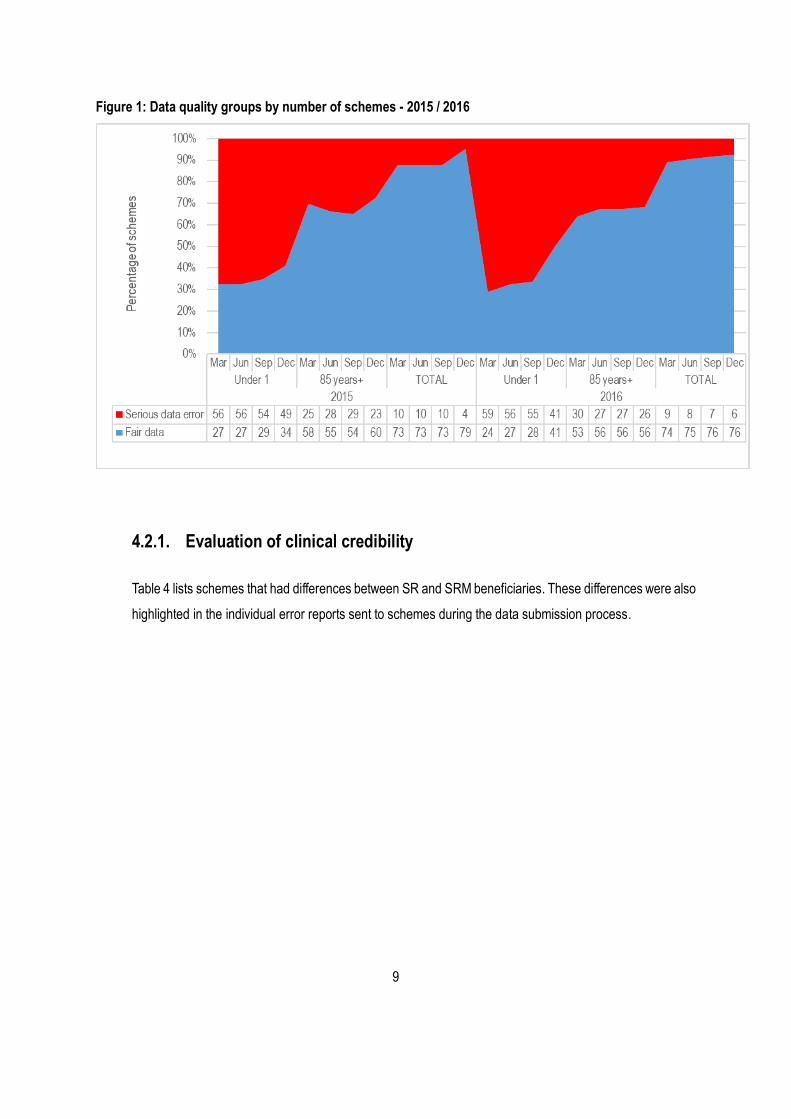
4.2.1. Evaluation of clinical credibility ................................................................................................................... 9
4.2.2. SRM health risk factors with financially significant deviations from expected levels ............................. 14
4.3. Reported CDL conditions count analysis.................................................................................................. 17
4.3.1. Asthma........................................................................................................................................................ 17
4.3.2. Bipolar Mood Disorder ............................................................................................................................... 19
4.3.3. Cardiomyopathy ......................................................................................................................................... 20
4.3.4. Chronic Obstructive Pulmonary Disease .................................................................................................. 22
4.3.5. Chronic Renal Disease .............................................................................................................................. 23
4.3.6. Diabetes Mellitus Type 1 ........................................................................................................................... 24
4.3.7. Diabetes Mellitus Type 2 ........................................................................................................................... 26
4.3.8. Human Immunodeficiency Virus (HIV/AIDS) cases on antiretroviral therapy ........................................ 28
4.3.9. Hyperlipidaemia ......................................................................................................................................... 29
4.3.10. Hypertension (HYP) ................................................................................................................................... 30
4.3.11. Maternity ..................................................................................................................................................... 32
4.3.12. Two simultaneous conditions .................................................................................................................... 33
4.3.13. Three simultaneous conditions ................................................................................................................. 34
4.3.14. Four or more simultaneous conditions ..................................................................................................... 36
4.3.15. Multiple CDL conditions ............................................................................................................................. 37
4.3.16. SRM price by age and community rate analysis ...................................................................................... 39
4.4. Variation in the risk profiles by medical schemes .................................................................................... 40
4.4.1. Analysis of the potential financial impact .................................................................................................. 40
ii
4.5. Community rate trend analysis ................................................................................................................. 48
5. Summary of the findings ...................................................................................................................................... 51
5.1. Scheme participation ........................................................................................................................................... 51
5.2. Data quality and application of the Entry and Verification Criteria .................................................................... 51
5.3. Chronic disease prevalence ...................................................................................................................... 51
5.4. Variation in the risk profiles by medical schemes .................................................................................... 51
5.5. Price by age and community rate analyses ............................................................................................. 52
5.6. Conclusion .................................................................................................................................................. 52
6. References ........................................................................................................................................................... 53
iii
Table of Figures
Figure 1: Data quality groups by number of schemes - 2015 / 2016 .......................................................................... 9
Figure 2: Total CDL count per 1 000 lives per 1 000 lives (2015 / 2016) .................................................................. 12
Figure 3: Distribution of chronic disease (December 2016) ...................................................................................... 12
Figure 4: Relative weight of the top 10 risk factors (December 2016) ...................................................................... 13
Figure 5: Expected and reported AST rates by month (2015 / 2016) ....................................................................... 18
Figure 6: Expected and reported AST rates by age (December 2016)..................................................................... 18
Figure 7: Expected and reported BMD count rates by month (2015 / 2016) ............................................................ 19
Figure 8: Expected and reported BMD rates by age (December 2016) ................................................................... 20
Figure 9: Expected and reported CMY count rates by month (2015 / 2016) ............................................................ 21
Figure 10: Expected and reported CMY count rates by age (December 2016) ....................................................... 22
Figure 11: Expected and reported COPD count rates by month (2015 / 2016) ....................................................... 22
Figure 12: Expected and reported COPD count rates by age (December 2016) .................................................... 23
Figure 13: Expected and reported CRF count rates by month (2015 / 2016) .......................................................... 24
Figure 14: Expected and reported CRF count rates by age (December 2016)........................................................ 24
Figure 15: Expected and reported DM1 count rates by age (2015 / 2016) .............................................................. 25
Figure 16: Expected and reported DM1 count rates by age (December 2016) ....................................................... 26
Figure 17: Expected and reported DM2 count rates by age (2015 / 2016) .............................................................. 27
Figure 18: Expected and reported DM2 count rates by age (December 2016) ....................................................... 27
Figure 19: Expected and reported HIV count rates by age (2015 / 2016) ................................................................ 28
Figure 20: Expected and reported HIV count rates by age (December 2015 / 2016) ............................................. 29
Figure 21: Expected and reported HYL count rates by month (2015 / 2016) ........................................................... 30
Figure 22: Expected and reported HYL count rates by age (December 2016) ........................................................ 30
Figure 23: Expected and reported HYP count rates by month (2015 / 2016) .......................................................... 31
Figure 24: Expected and reported HYP count rates by age (December 2016)........................................................ 32
Figure 25: Expected and reported MAT count rates by month (2015 / 2016) .......................................................... 32
Figure 26: Expected and reported MAT count rates by age (December 2016) ........................................................ 33
Figure 27: Expected and reported two simultaneous CDL conditions count rates by month (2015 / 2016)........... 34
Figure 28: Expected and reported two simultaneous CDL conditions count rates by age (December 2016) ........ 34
Figure 29: Expected and reported three simultaneous CDL conditions count rates by month (2015 / 2016) ........ 35
Figure 30: Expected and reported three simultaneous CDL conditions count rates by age (December 2016) ..... 36
Figure 31: Expected and reported four or more simultaneous CDL conditions count rates by month (2015 / 2016)
....................................................................................................................................................................................... 37
Figure 32: Expected and reported four or more simultaneous CDL conditions count rates by age (December 2016)
iv
....................................................................................................................................................................................... 37
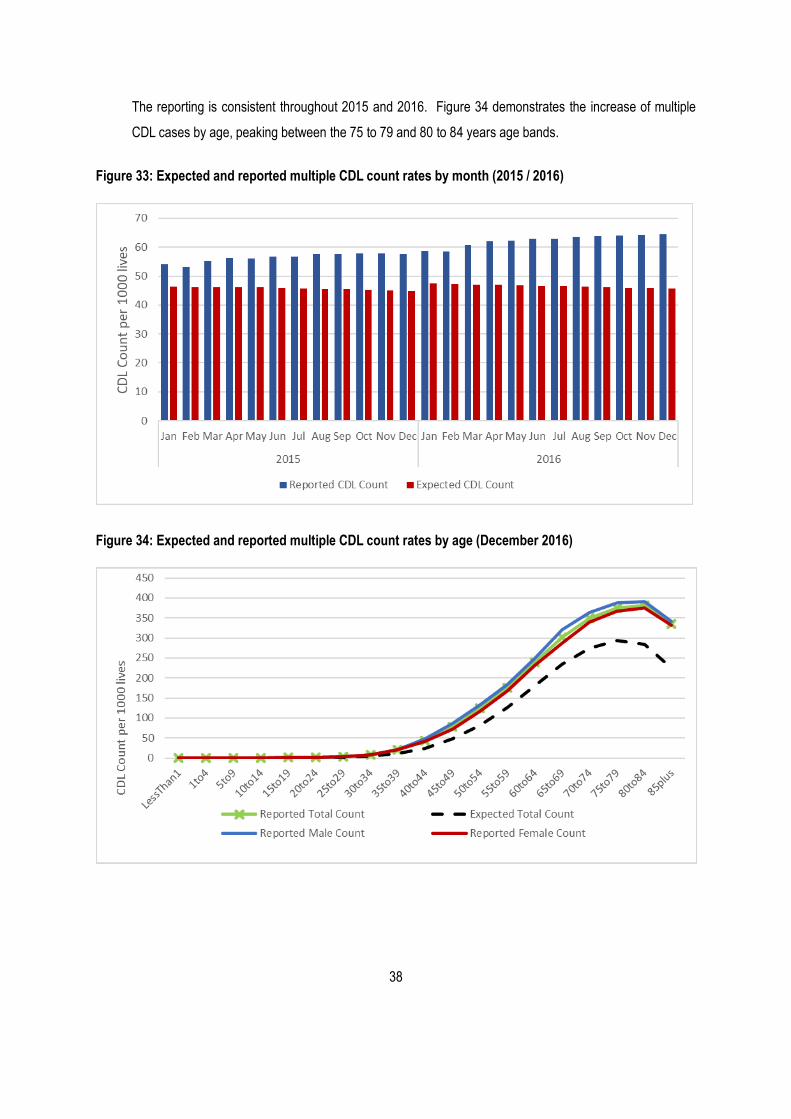
Figure 33: Expected and reported multiple CDL count rates by month (2015 / 2016)............................................. 38
Figure 34: Expected and reported multiple CDL count rates by age (December 2016) .......................................... 38
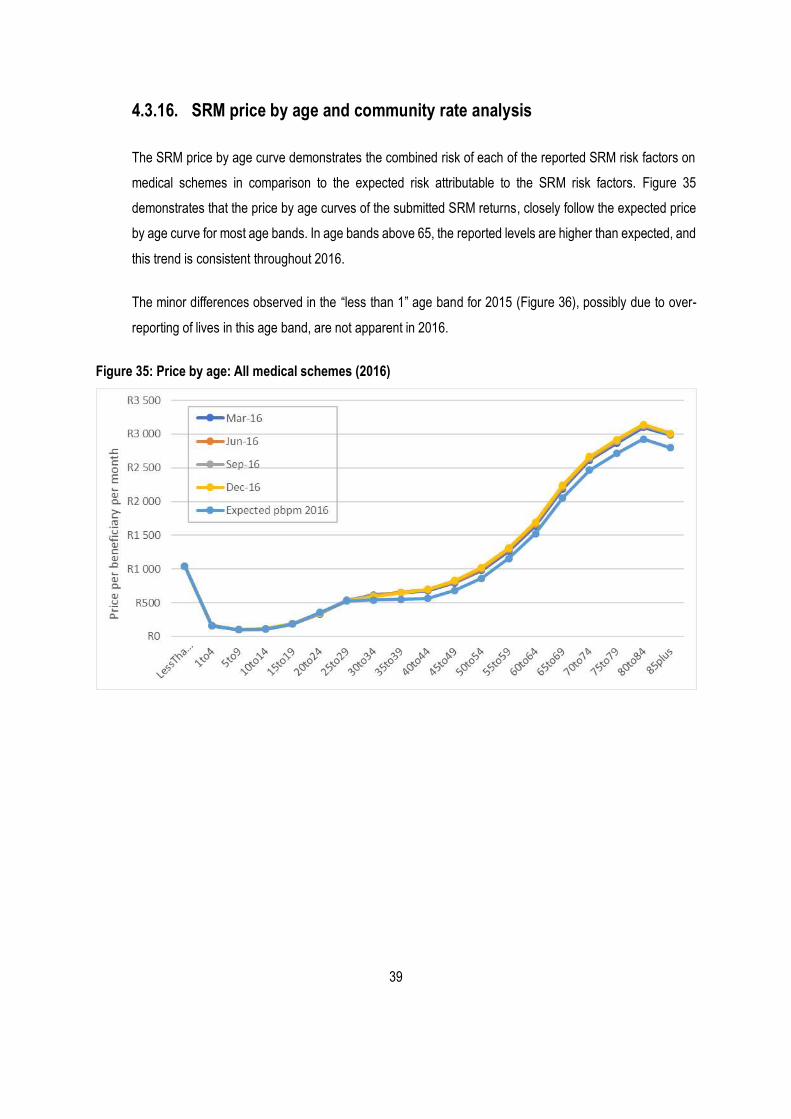
Figure 35: Price by age: All medical schemes (2016) ................................................................................................ 39
Figure 36: Price by age: All medical schemes (2015) ................................................................................................ 40
Figure 37: Number of beneficiaries by scheme risk category ................................................................................... 45
Figure 38: Number of beneficiaries by scheme risk category (December 2016) ..................................................... 46
Figure 39: Scheme community rate on the Full table (December 2016) .................................................................. 47
Figure 40: Benefit option rate on the Full table (December 2016) ............................................................................ 48
Figure 41: Actual and expected industry community rate .......................................................................................... 49
Figure 42: Actual industry community rate (2016 prices) .......................................................................................... 49
Figure 43: Industry community rate for open and restricted medical schemes ........................................................ 50
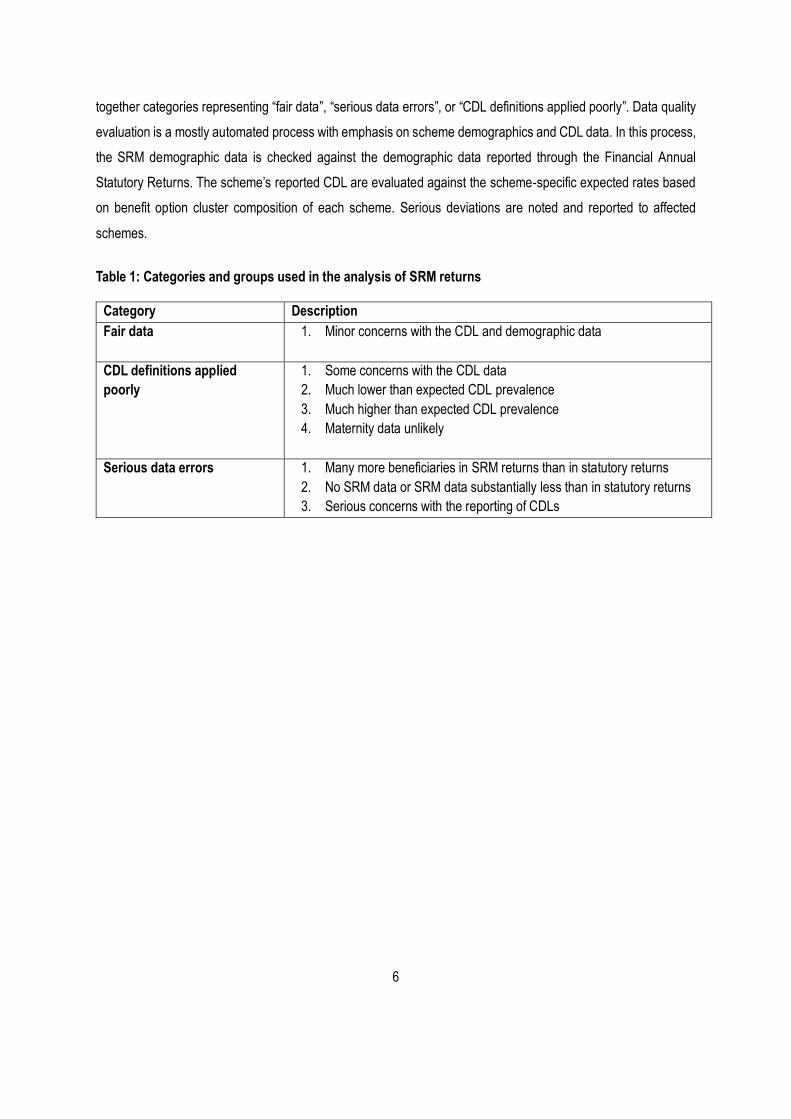
List of Tables Table 1: Categories and groups used in the analysis of SRM returns ........................................................................ 6
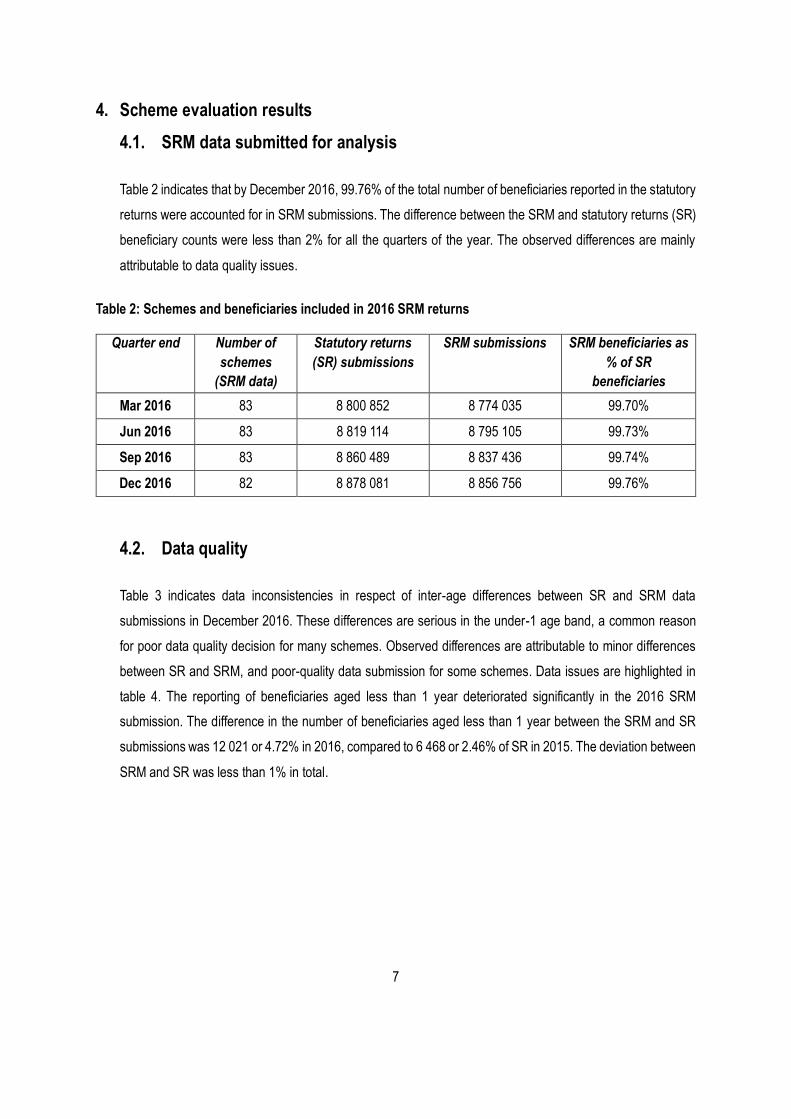
Table 2: Schemes and beneficiaries included in 2016 SRM returns ........................................................................... 7
Table 3: Beneficiaries included in 2016 SRM returns .................................................................................................. 8
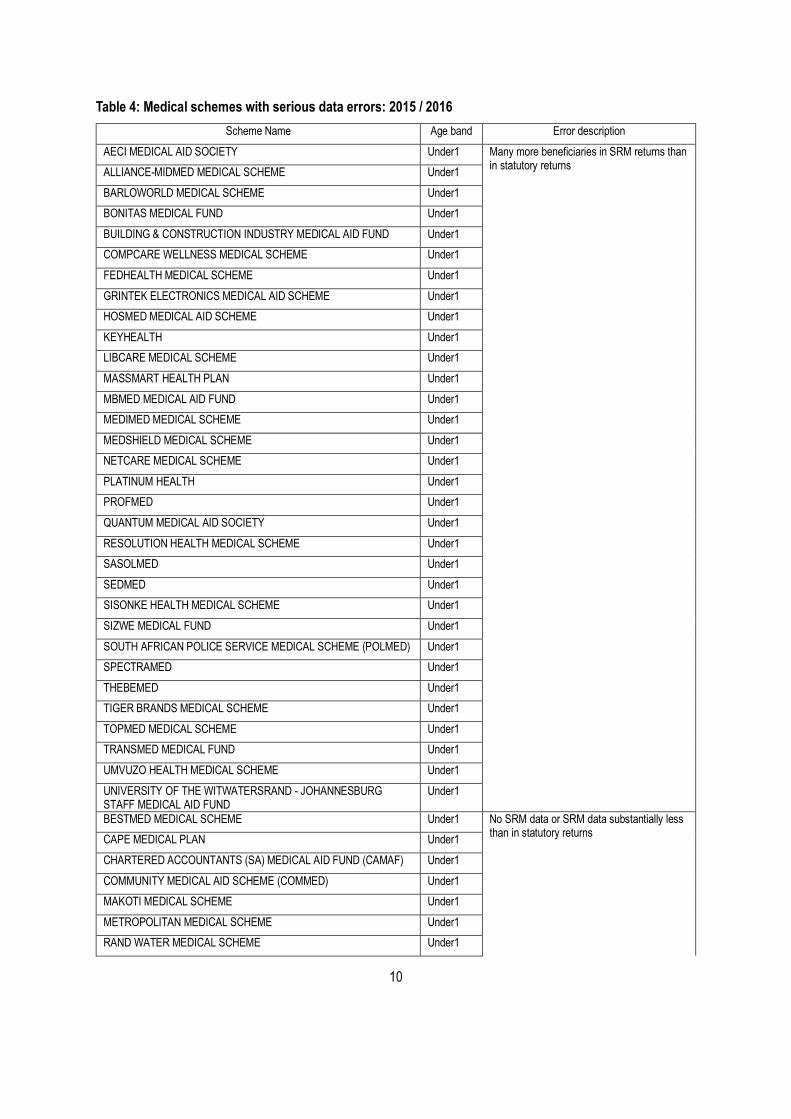
Table 4: Medical schemes with serious data errors: 2015 / 2016 ............................................................................. 10
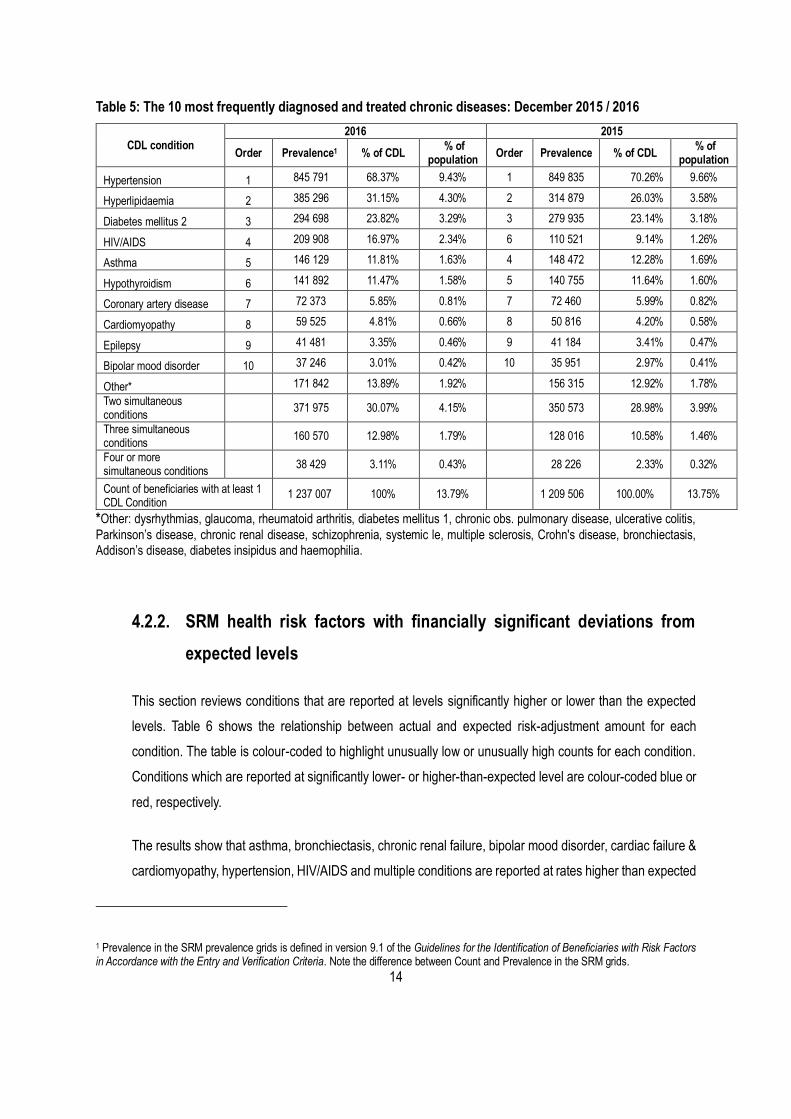
Table 5: The 10 most frequently diagnosed and treated chronic diseases: December 2015 / 2016 ...................... 14
Table 6: Expected and actual estimated SRM risk factor costs ................................................................................ 16
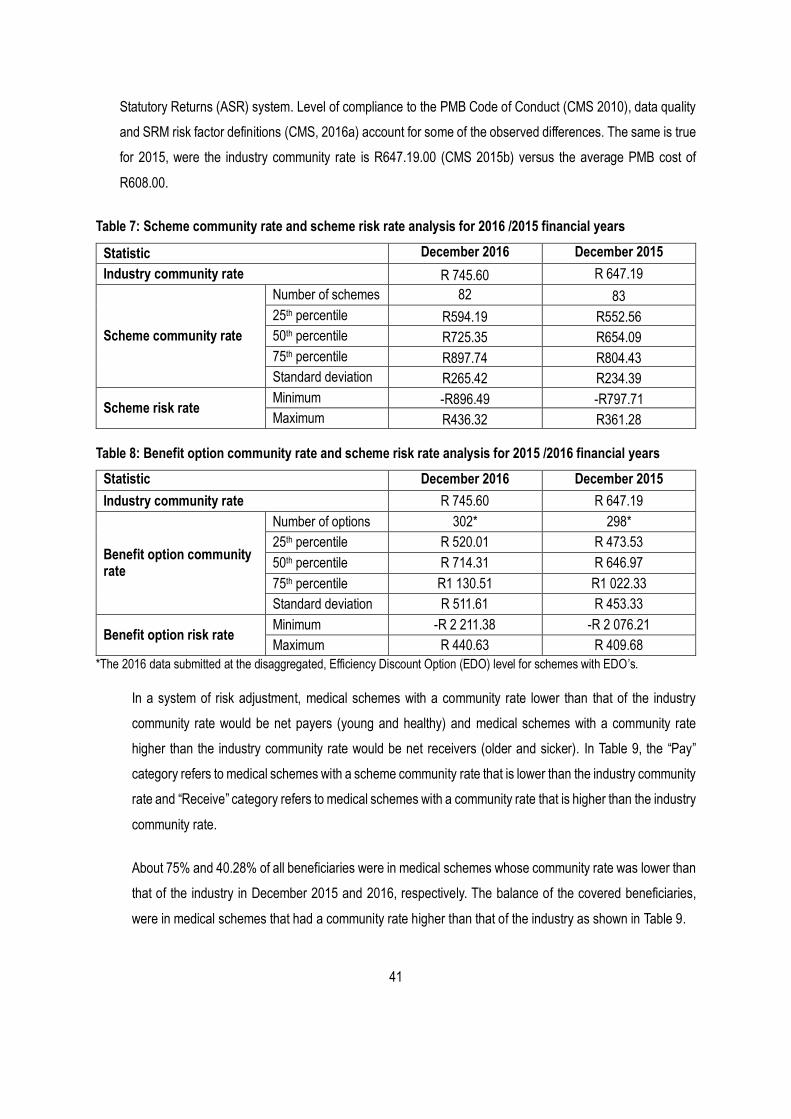
Table 7: Scheme community rate and scheme risk rate analysis for 2016 /2015 financial years ........................... 41
Table 8: Benefit option community rate and scheme risk rate analysis for 2015 /2016 financial years .................. 41
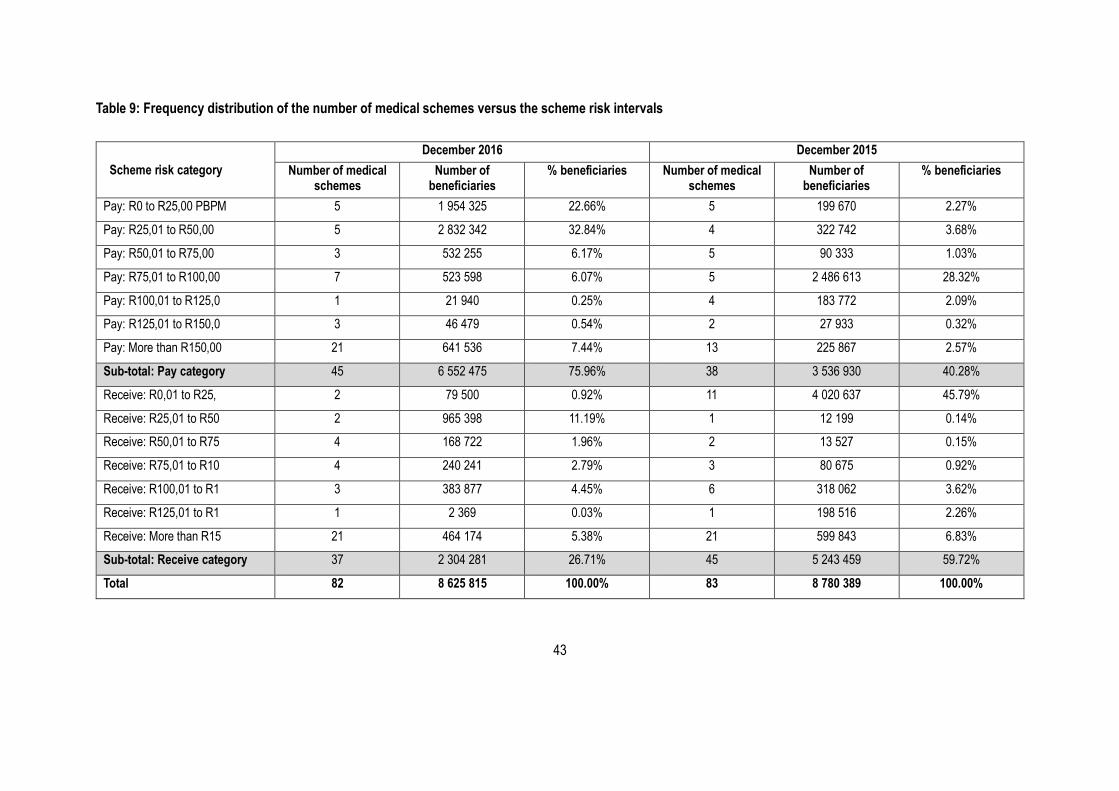
Table 9: Frequency distribution of the number of medical schemes versus the scheme risk intervals .................. 43
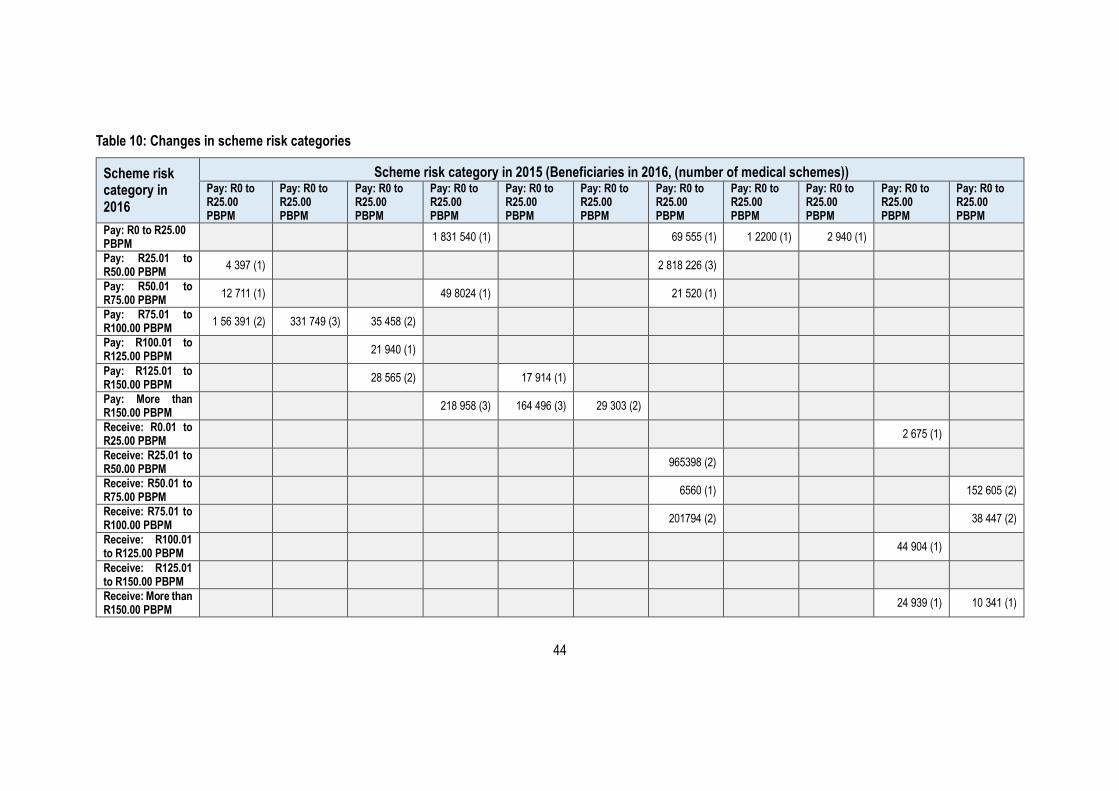
Table 10: Changes in scheme risk categories ............................................................................................................ 44
1
Executive summary
The Scheme Risk Measurement (SRM) project, which replaced the Risk Equalisation Fund (REF) shadow period
in the 2011/12 financial year, medical schemes submit consolidated monthly SRM returns to the Council for Medical
Schemes (CMS) annually as part of the Healthcare Utilisation Annual Statutory Return (ASR).
The main purpose of the SRM project is to measure and report on the risk profiles of medical schemes.
This report presents the analysis of the Schemes Risk Measurement (SRM) returns submitted to the Council for
Medical Schemes (CMS) for 2016. As at December 2016, 99.76% of beneficiaries (8 856 756) were represented
in data submissions from schemes.
The quality of data submitted to the CMS for the 2016 financial year has deteriorated in respect of certain schemes,
but showed an improvement for others. Schemes that were excluded from the 2015 analysis have now been
included in the 2016 analysis. Data for several risk factors has increased slightly due to the inclusion of these
previously omitted schemes. There has been a noticeable increase in certain prevalence rates for the Government
Employees Medical Scheme (GEMS); the South African Police Medical Scheme (Polmed); and Samwumed, which
are highlighted in section 4 of this document. Furthermore, actual count rates that outweigh expected count rates
are attributable to benchmark data for certain Chronic Disease List (CDL) conditions that may be outdated.
The approach in assessing the credibility of reported data has mainly been to observe CDL prevalence trends over
time, including epidemiological and clinical soundness of the reported data. Once the revision of the Prescribed
Minimum Benefits (PMBs) is completed, a new SRM benchmark study will be undertaken to establish the correct
CDL benchmarks.
The area of improvement remains the correct classification of beneficiaries in the correct age bands, especially
beneficiaries in the under 1 and the 85 plus age groups, as well as the correct application of the guidelines for the
identification of beneficiaries with risk factors, in accordance with the entry and verification criteria.
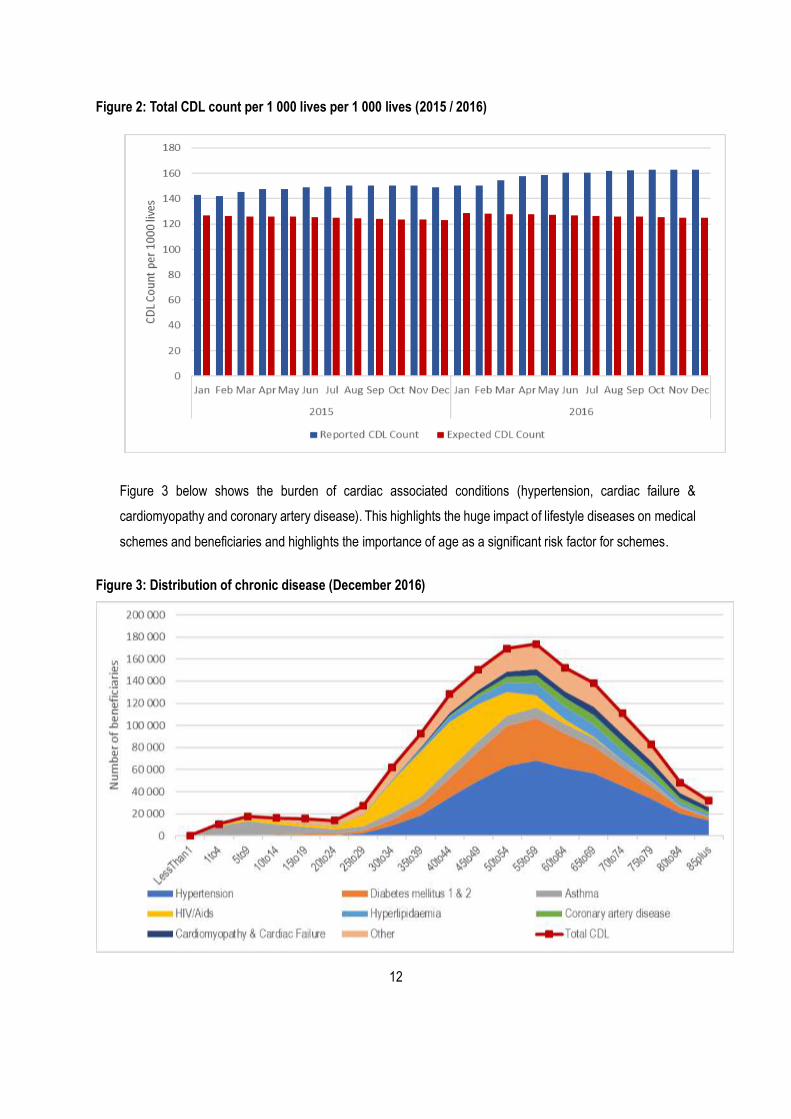
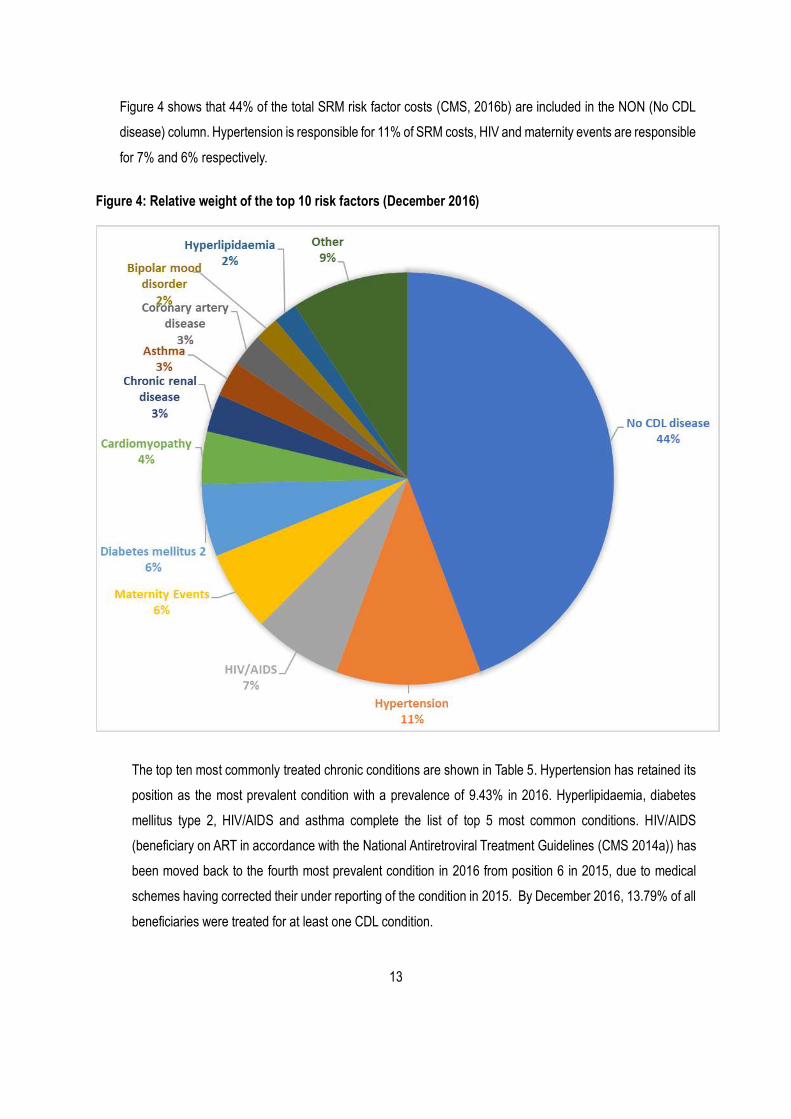
The prevalence of diagnosed and treated CDL conditions has remained unchanged between 2015 and 2016. There
has been a slight increase in the absolute number of beneficiaries diagnosed and treated for CDL conditions.
Hypertension remains the most prevalent CDL condition, followed by hyperlipidaemia, diabetes mellitus type 2,
Human Immunodeficiency Virus/Acquired Immune Deficiency Syndrome (HIV/AIDS), asthma and hypothyroidism.
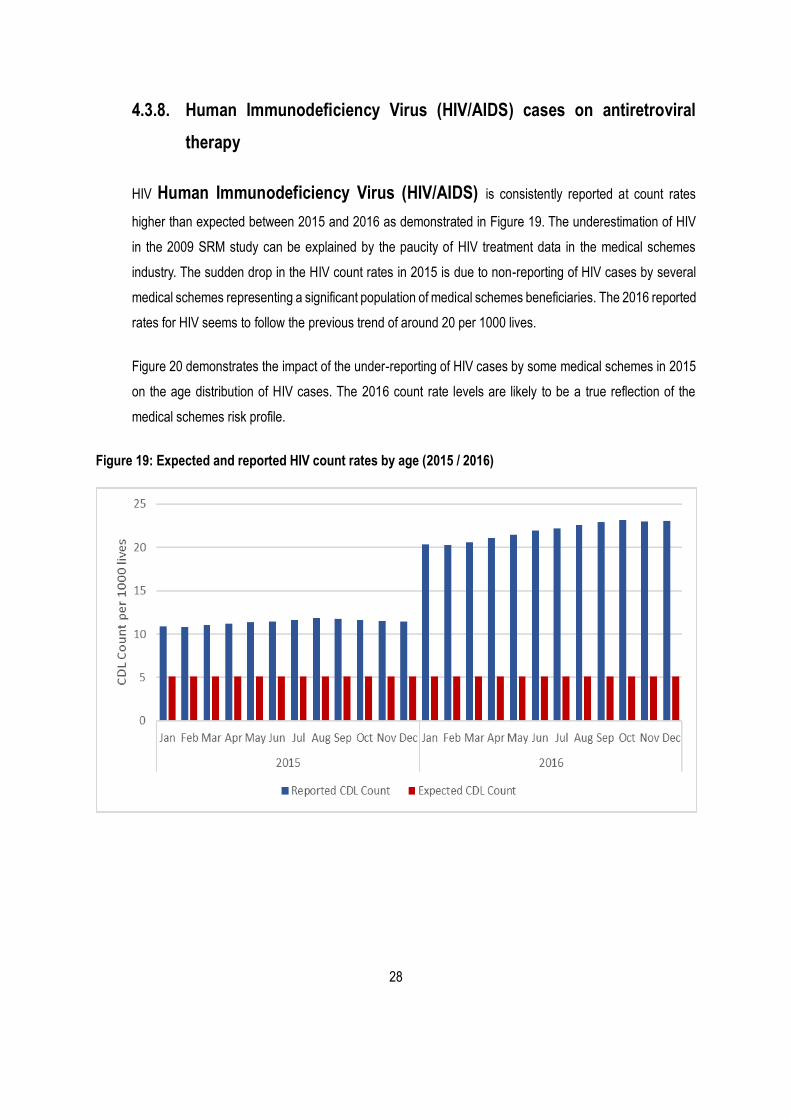
HIV/AIDS cases on antiretroviral therapy (ART), one of the most prevalent SRM risk factors, has moved back to
fourth in the list when all schemes were included in the 2016 analysis.
2
It must be noted that the reported prevalence is that of diagnosed and treated cases as per entry and verification
criteria, and must not be mistaken as the number of beneficiaries registered on a chronic disease management
programme, or directly compared to the prevalence in the general population. This prevalence will therefore be
lower than the true population prevalence of chronic diseases. The observed trends are valuable in the
understanding of changes in the risk profiles of medical schemes.
The December 2016 calculations of the cost of the risk-adjusted community rate based on age distribution, CDLs,
HIV and maternity data show that the scheme community rate of the most unfavourable risk profile is about
R896.49 above the industry average (R745.60), whereas the cost for a scheme with the most favourable risk profile
is about R436.32 below the industry average. The variations in the scheme risk have remained largely unchanged
between 2015 and 2016. The findings indicate that a large portion of the variation in risk between schemes is
directly attributable to the true differences in the risk profile of individual schemes. The increase in the reported
industry community rate is likely attributable to a change in the risk profile of medical schemes’ beneficiaries, as
well as upward inflationary pressure. The industry community rate (ICR) increased by 15.21% from R647.19 in
December 2015 to R745.60 in December 2016.
3
1. Introduction
Medical schemes participated in the voluntary Risk Equalisation Fund (REF) shadow period from January 2005 by
submitting monthly risk profile data to the Council for Medical Schemes (CMS) on a quarterly basis. The purpose
of the REF shadow period was to provide an opportunity for the CMS and medical schemes to prepare for a system
of risk equalisation. The CMS stopped the REF shadow process in December 2011 (Council for Medical Schemes
[CMS] 2011). It however continued to collect risk profile data from medical schemes to measure and report on the
risk profiles of medical schemes. Risk factor data is now collected for the Scheme Risk Measurement (SRM) project
as part of the Healthcare Utilisation Annual Statutory Return (ASR).
2. Purpose of the analysis
The purpose of this report is to illustrate the impact of age and chronic diseases on the risk profile of medical
schemes. Medical schemes should consider this report to assist them in the adjustment of processes and systems
to meet the requirements of the SRM before submitting SRM risk factor data in the future. The report contains
high-level information that schemes can use for benchmarking against the industry profile, or community rate.
3. Methodology
3.1. Data source
Two types of SRM grids are collected to count the number of beneficiaries with CDL conditions, the “count”
and “prevalence” grids.
The SRM grid count contains the total number of beneficiaries in each cell for the period. Each beneficiary
must be placed in only one cell in Columns 1 to 28. For a person with two or more CDL conditions (or HIV/AIDS
and one or more CDL conditions), the scheme chooses the highest cost cell of the combination. Thus, the
total number of beneficiaries for Columns 1 to 28 must equal the number of beneficiaries in the scheme for
the period under review. Counts of beneficiaries for the modifiers are done separately. Modifiers refer to
beneficiaries with more than one CDL condition and maternity events. For the purposes of SRM, beneficiaries
with two (CC2), three (CC3), four (CC4) or more simultaneous CDL conditions, are counted separately. This
SRM grid count used in the calculation of the SRM contribution table is not the prevalence of the disease; it is
arrived at by taking the most expensive disease in any multiple disease combination. It therefore cannot be
compared directly to prevalence in published medical literature.
The SRM grid prevalence contains the total number of beneficiaries in each cell for the period under review.
4
Each beneficiary must be placed in as many cells in Columns 1 to 28 as they have chronic conditions (CDL
conditions or HIV/AIDS). For a person with three CDL conditions, the scheme places the beneficiary in the
three relevant columns. Thus, the total number of beneficiaries for Columns 1 to 28 will amount to more than
the total number of beneficiaries in the scheme for the period.
The 2015 SRM data analysis is restated in this report.
3.2. Case definitions and benchmarks
Version 10.1 of the Guidelines for the Identification of Beneficiaries with Risk Factors in Accordance with the
Entry and Verification Criteria (E&V) (CMS, 2016a) was used to identify qualifying beneficiaries for 2016. The
purpose of this guideline document is to define the criteria which must be met in the identification of
beneficiaries with the risk factors used in the SRM. The E&V is intended for this purpose alone and is not to
be construed as a limitation or expansion on the entitlements of medical scheme beneficiaries to Prescribed
Minimum Benefits (PMBs) in terms of the Medical Schemes Act 131 of 1998. There might therefore be
instances where a beneficiary is legally entitled to a PMB level of treatment in respect of a particular condition,
but cannot be included in the CDL portion of the SRM returns. Similarly, certain medicines that are not included
in the CDL therapeutic algorithms may be included as proof of treatment for the purpose of identifying a
beneficiary with a condition qualifying for inclusion in the SRM returns. The inclusion of such medicines in the
entry and verification criteria does not create an entitlement for a beneficiary to access that medicine as a
PMB.
The entry and verification criteria was developed with emphasis on the verifiability of cases and will be used
to ensure that there is uniformity in the way that medical schemes identify SRM risk factors. These guidelines
provide specific clinical codes which serve to identify beneficiaries who were treated for CDL conditions. The
guidelines are reviewed annually.
5
3.3. Entry and verification criteria
Changes made to version 10.1 (applicable from 1 January 2016)
The Chronic Renal Disease (Table 8) diagnostic criteria ACR rate was corrected to be Albumin-to-
Creatinine Ratio (ACR) of ≥ (equal to or greater than) 3.4 mg/mmol (or 30mg/g).
The CD4 count that was used to determine eligibility for treatment is not applicable anymore, as the new
National Antiretroviral Treatment Guidelines removed the CD4 count as treatment criteria.
The sentence “This includes Rheumatoid Arthritis in cases where a DMARD is not used” was added in
paragraph 5.17.
ICD-10 code I27.9 was removed from Table 7 (Cardiac Failure & Cardiomyopathy).
The ATC codes J05AX09 and J05AX12 has been added to Table 28 – HIV and to the list of ATC codes.
ICD-10 codes (E10.2, E11.2, E12.2, and Z94.0) were added to the Chronic Renal Disease as these
codes indicate diabetes mellitus with renal complications. The ICD-10 coding rules determine that the
combination of Diabetes Mellitus that lead to renal disease be coded with the added codes.
Codes E13.0, E13.1, E13.2, E13.3, E13.4, E13.5, E13.6, E13.7, E13.8, E13.9, E14.0, E14.1, E14.2,
E14.3, E14.4, E14.5, E14.6, E14.7, E14.8 and E14.9 were added to tables 13 and 14 (Diabetes Mellitus
Type 1 and Type 2) in the previous version, as the codes indicate PMB conditions under specific
Diagnostic Treatment Pairs and in the Chronic Disease List.
Codes N18.0 and N18.8 were deleted from Table 8 (Chronic Renal Disease) and Table 19
(Hyperlipidaemia) as the codes were discontinued in the ICD-10 Master Industry Table.
3.4. Estimation of expected values
In the evaluation of a scheme’s data submissions for CDL conditions, maternity and HIV/AIDS, it is often
difficult to determine whether the submissions reflect the true risk of the scheme or whether the submissions
reflect data definition problems. The CMS applies statistical techniques to submissions to overcome this
problem, whereby deviation from expected values (as determined in the PMB Costing Study 2009) is
compared to the submitted data. Large deviations from the expected values and inconsistent reporting of SRM
risk factors from one period to the next are an indication of data errors.
3.5. Categorisation
SRM returns were evaluated in accordance with the categories listed in Table 1 below. The table groups
6
together categories representing “fair data”, “serious data errors”, or “CDL definitions applied poorly”. Data quality
evaluation is a mostly automated process with emphasis on scheme demographics and CDL data. In this process,
the SRM demographic data is checked against the demographic data reported through the Financial Annual
Statutory Returns. The scheme’s reported CDL are evaluated against the scheme-specific expected rates based
on benefit option cluster composition of each scheme. Serious deviations are noted and reported to affected
schemes.
Table 1: Categories and groups used in the analysis of SRM returns
Category Description
Fair data 1. Minor concerns with the CDL and demographic data
CDL definitions applied
poorly
1. Some concerns with the CDL data
2. Much lower than expected CDL prevalence
3. Much higher than expected CDL prevalence
4. Maternity data unlikely
Serious data errors 1. Many more beneficiaries in SRM returns than in statutory returns
2. No SRM data or SRM data substantially less than in statutory returns
3. Serious concerns with the reporting of CDLs
7
4. Scheme evaluation results
4.1. SRM data submitted for analysis
Table 2 indicates that by December 2016, 99.76% of the total number of beneficiaries reported in the statutory
returns were accounted for in SRM submissions. The difference between the SRM and statutory returns (SR)
beneficiary counts were less than 2% for all the quarters of the year. The observed differences are mainly
attributable to data quality issues.
Table 2: Schemes and beneficiaries included in 2016 SRM returns
Quarter end Number of
schemes
(SRM data)
Statutory returns
(SR) submissions
SRM submissions SRM beneficiaries as
% of SR
beneficiaries
Mar 2016 83 8 800 852 8 774 035 99.70%
Jun 2016 83 8 819 114 8 795 105 99.73%
Sep 2016 83 8 860 489 8 837 436 99.74%
Dec 2016 82 8 878 081 8 856 756 99.76%
4.2. Data quality
Table 3 indicates data inconsistencies in respect of inter-age differences between SR and SRM data
submissions in December 2016. These differences are serious in the under-1 age band, a common reason
for poor data quality decision for many schemes. Observed differences are attributable to minor differences
between SR and SRM, and poor-quality data submission for some schemes. Data issues are highlighted in
table 4. The reporting of beneficiaries aged less than 1 year deteriorated significantly in the 2016 SRM
submission. The difference in the number of beneficiaries aged less than 1 year between the SRM and SR
submissions was 12 021 or 4.72% in 2016, compared to 6 468 or 2.46% of SR in 2015. The deviation between
SRM and SR was less than 1% in total.
8
Table 3: Beneficiaries included in 2016 SRM returns
Age band Statutory Return Dec 2016
SRM Grid Count Dec 2016
Difference Difference as % of Statutory Return
Under 1 254 911 266 932 -12 021 -4.72%
1-4 631 259 630 053 1 206 0.19%
5-9 794 328 793 176 1 152 0.15%
10-14 686 144 684 051 2 093 0.31%
15-19 621 104 620 156 948 0.15%
20-24 451 200 444 310 6 890 1.53%
25-29 605 632 601 486 4 146 0.68%
30-34 761 370 758 407 2 963 0.39%
35-39 702 674 701 071 1 603 0.23%
40-44 687 961 686 983 978 0.14%
45-49 624 391 623 621 770 0.12%
50-54 554 061 553 065 996 0.18%
55-59 465 757 463 670 2 087 0.45%
60-64 335 543 332 777 2 766 0.82%
65-69 257 791 257 410 381 0.15%
70-74 187 342 185 952 1 390 0.74%
75-79 130 982 130 143 839 0.64%
80-84 74 374 73 731 643 0.86%
85+ 51 257 49 762 1 495 2.92%
Total 8 878 081 8 856 756 21 325 0.24%
Figure 1 below shows the level of agreement in the data submitted for SR and SRM returns. The correlation
between the two data sets was very high for the total number of beneficiaries for over 90% of schemes. Major
differences where observed in the data submitted for SR and SRM for the under 1 age group, with 50% of
schemes reporting unreliable data for this age group. Between 32% and 36% of schemes reported unreliable
data for the 85+ age group.
9
Figure 1: Data quality groups by number of schemes - 2015 / 2016
4.2.1. Evaluation of clinical credibility
Table 4 lists schemes that had differences between SR and SRM beneficiaries. These differences were also
highlighted in the individual error reports sent to schemes during the data submission process.
10
Table 4: Medical schemes with serious data errors: 2015 / 2016
Scheme Name Age band Error description
AECI MEDICAL AID SOCIETY Under1 Many more beneficiaries in SRM returns than in statutory returns
ALLIANCE-MIDMED MEDICAL SCHEME Under1
BARLOWORLD MEDICAL SCHEME Under1
BONITAS MEDICAL FUND Under1
BUILDING & CONSTRUCTION INDUSTRY MEDICAL AID FUND Under1
COMPCARE WELLNESS MEDICAL SCHEME Under1
FEDHEALTH MEDICAL SCHEME Under1
GRINTEK ELECTRONICS MEDICAL AID SCHEME Under1
HOSMED MEDICAL AID SCHEME Under1
KEYHEALTH Under1
LIBCARE MEDICAL SCHEME Under1
MASSMART HEALTH PLAN Under1
MBMED MEDICAL AID FUND Under1
MEDIMED MEDICAL SCHEME Under1
MEDSHIELD MEDICAL SCHEME Under1
NETCARE MEDICAL SCHEME Under1
PLATINUM HEALTH Under1
PROFMED Under1
QUANTUM MEDICAL AID SOCIETY Under1
RESOLUTION HEALTH MEDICAL SCHEME Under1
SASOLMED Under1
SEDMED Under1
SISONKE HEALTH MEDICAL SCHEME Under1
SIZWE MEDICAL FUND Under1
SOUTH AFRICAN POLICE SERVICE MEDICAL SCHEME (POLMED) Under1
SPECTRAMED Under1
THEBEMED Under1
TIGER BRANDS MEDICAL SCHEME Under1
TOPMED MEDICAL SCHEME Under1
TRANSMED MEDICAL FUND Under1
UMVUZO HEALTH MEDICAL SCHEME Under1
UNIVERSITY OF THE WITWATERSRAND - JOHANNESBURG STAFF MEDICAL AID FUND
Under1
BESTMED MEDICAL SCHEME Under1 No SRM data or SRM data substantially less than in statutory returns
CAPE MEDICAL PLAN Under1
CHARTERED ACCOUNTANTS (SA) MEDICAL AID FUND (CAMAF) Under1
COMMUNITY MEDICAL AID SCHEME (COMMED) Under1
MAKOTI MEDICAL SCHEME Under1
METROPOLITAN MEDICAL SCHEME Under1
RAND WATER MEDICAL SCHEME Under1
11
Scheme Name Age band Error description
SELFMED MEDICAL SCHEME Under1 No SRM data or SRM data substantially less than in statutory returns
WITBANK COALFIELDS MEDICAL AID SCHEME Under1
CHARTERED ACCOUNTANTS (SA) MEDICAL AID FUND (CAMAF) 85 years+ Many more beneficiaries in SRM returns than in statutory returns
MBMED MEDICAL AID FUND 85 years+
SELFMED MEDICAL SCHEME 85 years+
SPECTRAMED 85 years+
ALLIANCE-MIDMED MEDICAL SCHEME 85 years+ No SRM data or SRM data substantially less than in statutory returns
BESTMED MEDICAL SCHEME 85 years+
BUILDING & CONSTRUCTION INDUSTRY MEDICAL AID FUND 85 years+
CAPE MEDICAL PLAN 85 years+
COMPCARE WELLNESS MEDICAL SCHEME 85 years+
FEDHEALTH MEDICAL SCHEME 85 years+
GRINTEK ELECTRONICS MEDICAL AID SCHEME 85 years+
HORIZON MEDICAL SCHEME 85 years+
HOSMED MEDICAL AID SCHEME 85 years+
KEYHEALTH 85 years+
MALCOR MEDICAL SCHEME 85 years+
MASSMART HEALTH PLAN 85 years+
MEDSHIELD MEDICAL SCHEME 85 years+
PLATINUM HEALTH 85 years+
PROFMED 85 years+
QUANTUM MEDICAL AID SOCIETY 85 years+
SEDMED 85 years+
SIZWE MEDICAL FUND 85 years+
TFG MEDICAL AID SCHEME 85 years+
TIGER BRANDS MEDICAL SCHEME 85 years+
TOPMED MEDICAL SCHEME 85 years+
WITBANK COALFIELDS MEDICAL AID SCHEME 85 years+
FOOD WORKERS MEDICAL BENEFIT FUND Total More beneficiaries in SRM returns than in statutory returns
TIGER BRANDS MEDICAL SCHEME Total
BESTMED MEDICAL SCHEME Total No SRM data or SRM data substantially less than in statutory returns
FEDHEALTH MEDICAL SCHEME Total
SIZWE MEDICAL FUND Total
WITBANK COALFIELDS MEDICAL AID SCHEME Total
Figure 2 below demonstrates reporting of CDL conditions at levels higher than expected, ranging from 8.62%
to 16.78% more than expected in 2015, and 5.26% to 16.64% in 2016. Previous reports on SRM / REF have
shown smaller differences between the expected and reported CDL count.
12
Figure 2: Total CDL count per 1 000 lives per 1 000 lives (2015 / 2016)
Figure 3 below shows the burden of cardiac associated conditions (hypertension, cardiac failure &
cardiomyopathy and coronary artery disease). This highlights the huge impact of lifestyle diseases on medical
schemes and beneficiaries and highlights the importance of age as a significant risk factor for schemes.
Figure 3: Distribution of chronic disease (December 2016)
13
Figure 4 shows that 44% of the total SRM risk factor costs (CMS, 2016b) are included in the NON (No CDL
disease) column. Hypertension is responsible for 11% of SRM costs, HIV and maternity events are responsible
for 7% and 6% respectively.
Figure 4: Relative weight of the top 10 risk factors (December 2016)
The top ten most commonly treated chronic conditions are shown in Table 5. Hypertension has retained its
position as the most prevalent condition with a prevalence of 9.43% in 2016. Hyperlipidaemia, diabetes
mellitus type 2, HIV/AIDS and asthma complete the list of top 5 most common conditions. HIV/AIDS
(beneficiary on ART in accordance with the National Antiretroviral Treatment Guidelines (CMS 2014a)) has
been moved back to the fourth most prevalent condition in 2016 from position 6 in 2015, due to medical
schemes having corrected their under reporting of the condition in 2015. By December 2016, 13.79% of all
beneficiaries were treated for at least one CDL condition.
14
Table 5: The 10 most frequently diagnosed and treated chronic diseases: December 2015 / 2016
CDL condition 2016 2015
Order Prevalence1 % of CDL % of
population Order Prevalence % of CDL
% of population
Hypertension 1 845 791 68.37% 9.43% 1 849 835 70.26% 9.66%
Hyperlipidaemia 2 385 296 31.15% 4.30% 2 314 879 26.03% 3.58%
Diabetes mellitus 2 3 294 698 23.82% 3.29% 3 279 935 23.14% 3.18%
HIV/AIDS 4 209 908 16.97% 2.34% 6 110 521 9.14% 1.26%
Asthma 5 146 129 11.81% 1.63% 4 148 472 12.28% 1.69%
Hypothyroidism 6 141 892 11.47% 1.58% 5 140 755 11.64% 1.60%
Coronary artery disease 7 72 373 5.85% 0.81% 7 72 460 5.99% 0.82%
Cardiomyopathy 8 59 525 4.81% 0.66% 8 50 816 4.20% 0.58%
Epilepsy 9 41 481 3.35% 0.46% 9 41 184 3.41% 0.47%
Bipolar mood disorder 10 37 246 3.01% 0.42% 10 35 951 2.97% 0.41%
Other* 171 842 13.89% 1.92% 156 315 12.92% 1.78%
Two simultaneous conditions
371 975 30.07% 4.15% 350 573 28.98% 3.99%
Three simultaneous conditions
160 570 12.98% 1.79% 128 016 10.58% 1.46%
Four or more simultaneous conditions
38 429 3.11% 0.43% 28 226 2.33% 0.32%
Count of beneficiaries with at least 1 CDL Condition
1 237 007 100% 13.79% 1 209 506 100.00% 13.75%
*Other: dysrhythmias, glaucoma, rheumatoid arthritis, diabetes mellitus 1, chronic obs. pulmonary disease, ulcerative colitis,
Parkinson’s disease, chronic renal disease, schizophrenia, systemic le, multiple sclerosis, Crohn's disease, bronchiectasis, Addison’s disease, diabetes insipidus and haemophilia.
4.2.2. SRM health risk factors with financially significant deviations from
expected levels
This section reviews conditions that are reported at levels significantly higher or lower than the expected
levels. Table 6 shows the relationship between actual and expected risk-adjustment amount for each
condition. The table is colour-coded to highlight unusually low or unusually high counts for each condition.
Conditions which are reported at significantly lower- or higher-than-expected level are colour-coded blue or
red, respectively.
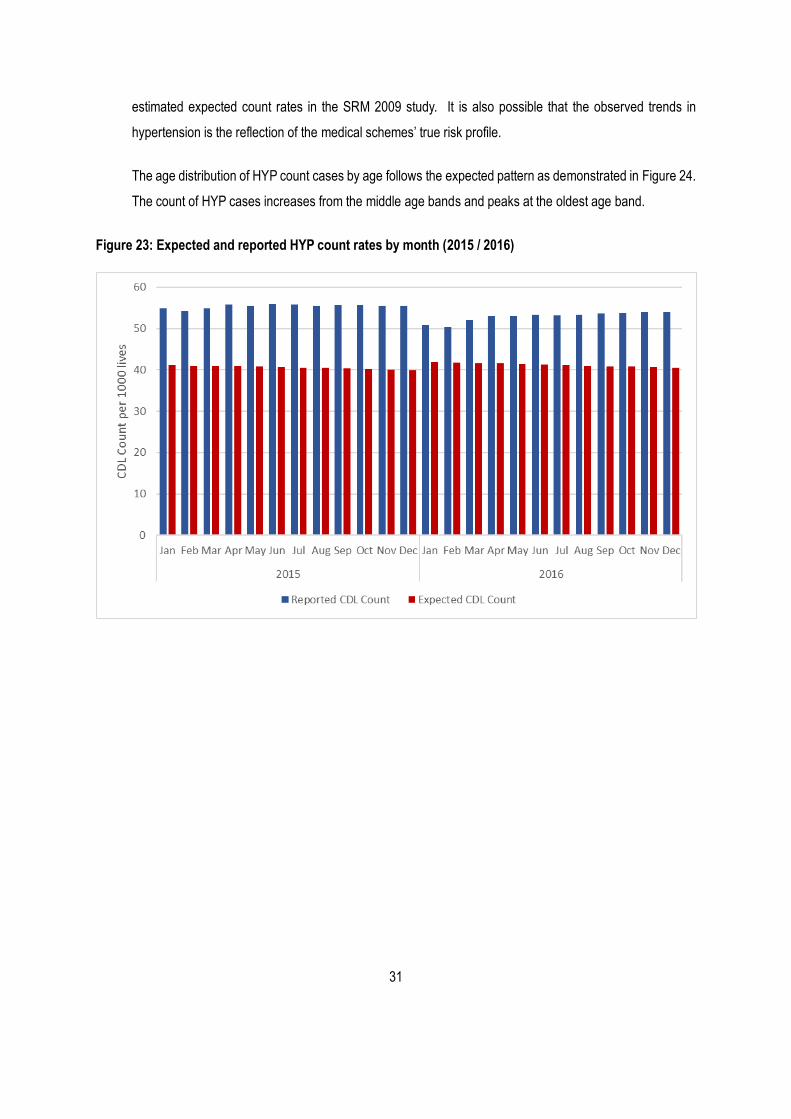
The results show that asthma, bronchiectasis, chronic renal failure, bipolar mood disorder, cardiac failure &
cardiomyopathy, hypertension, HIV/AIDS and multiple conditions are reported at rates higher than expected
1 Prevalence in the SRM prevalence grids is defined in version 9.1 of the Guidelines for the Identification of Beneficiaries with Risk Factors in Accordance with the Entry and Verification Criteria. Note the difference between Count and Prevalence in the SRM grids.
15
in the population covered by medical schemes (CMS, 2016b). This observation can be explained by poor
application of entry and verification criteria by medical schemes, coupled with expected “count” rates for the
industry that may be outdated and therefore result in an underestimate of the CDL prevalence amongst
beneficiaries.
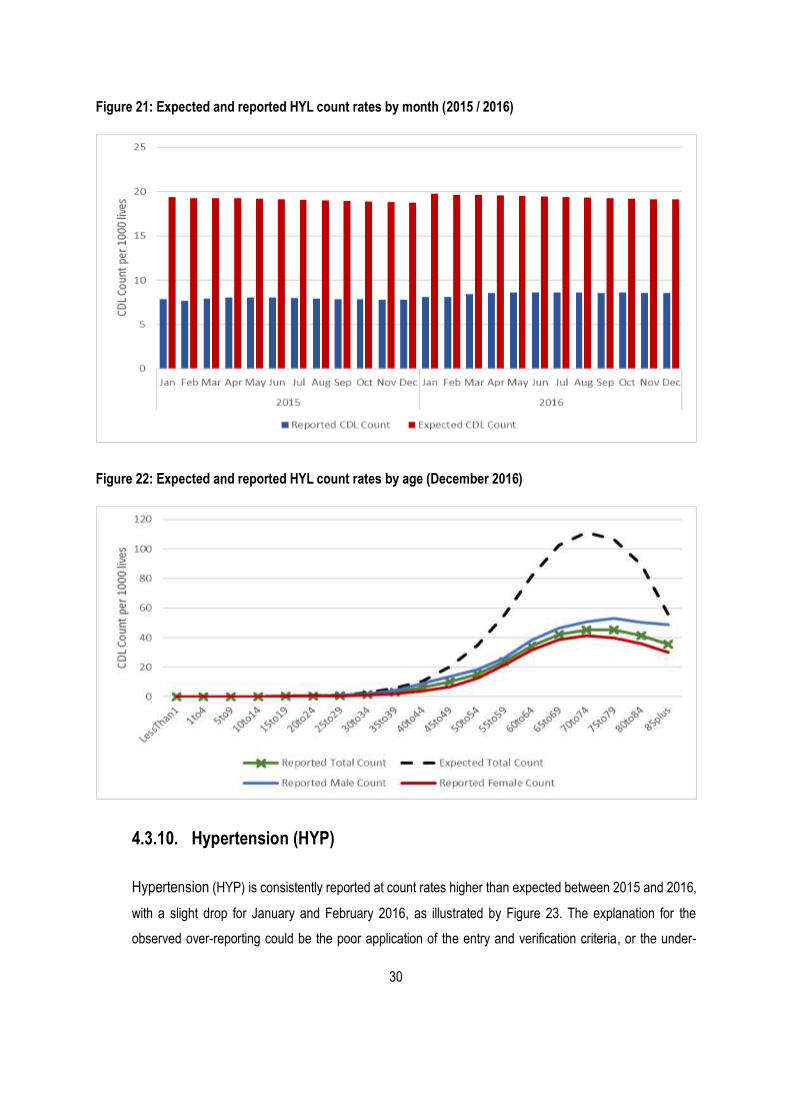
On the other hand, diabetes mellitus 1, hyperlipidaemia and maternity events are under-reported by up to
89.31% percentage points less than the expected rate for these conditions. Same as with the over-reporting
of CDLs, under-reporting of CDLs might reflect the less than appropriate application of entry criteria or
outdated expected rates.
Overall, the difference between the estimated actual and expected total risk-adjustment amount was about
10.91 percentage points or R649.5 million.
16
Table 6: Expected and actual estimated SRM risk factor costs
(CDLs, Maternity & HIV/AIDS) December 2016
Difference (A - E)* Expected Actual A / E*
No CDL disease -R219 125 381.38 R2 920 206 031.37 R2 701 080 649.99 92.50%
Addison's Disease -R114 386.28 R1 049 618.63 R935 232.35 89.10%
Asthma R8 368 493.79 R161 846 020.50 R170 214 514.30 105.17%
Bronchiectasis R3 832 705.01 R1 217 062.08 R5 049 767.09 414.91%
Bipolar Mood Disorder R56 094 571.62 R64 275 625.82 R120 370 197.44 187.27%
Cardiac failure & Cardiomyopathy R75 676 355.57 R181 020 117.78 R256 696 473.35 141.81%
Chronic Obs. Pulmonary Disease R6 581 246.66 R86 141 256.94 R92 722 503.60 107.64%
Chronic Renal Disease R41 978 886.19 R153 348 117.76 R195 327 003.96 127.37%
Crohn's Disease R1 083 957.21 R7 093 297.31 R8 177 254.52 115.28%
Diabetes Insipidus R78 957.40 R735 433.64 R814 391.04 110.74%
Diabetes Mellitus 1 -R41 999 282.34 R109 360 164.23 R67 360 881.89 61.60%
Diabetes Mellitus 2 R160 713 987.82 R194 198 855.38 R354 912 843.19 182.76%
Dysrhythmias R27 104 846.79 R64 922 673.42 R92 027 520.21 141.75%
Epilepsy R16 290 094.17 R70 901 383.45 R87 191 477.63 122.98%
Glaucoma R4 087 662.42 R13 973 637.41 R18 061 299.83 129.25%
Haemophilia -R514 166.34 R5 806 556.78 R5 292 390.44 91.15%
Hyperlipidaemia -R145 425 233.05 R258 844 603.05 R113 419 370.00 43.82%
Hypertension R173 597 687.82 R527 206 189.99 R700 803 877.81 132.93%
Ulcerative Colitis R1 559 601.06 R8 025 966.29 R9 585 567.36 119.43%
Coronary Artery Disease -R4 713 519.07 R165 130 576.28 R160 417 057.21 97.15%
Multiple Sclerosis R10 883 380.56 R18 240 161.27 R29 123 541.83 159.67%
Parkinson's Disease R2 084 792.97 R29 337 651.14 R31 422 444.11 107.11%
Rheumatoid Arthritis R11 669 814.91 R42 537 421.11 R54 207 236.03 127.43%
Schizophrenia R434 585.79 R11 317 863.39 R11 752 449.18 103.84%
Systemic LE R3 108 130.81 R5 692 091.22 R8 800 222.03 154.60%
Hypothyroidism R3 730 575.86 R38 302 288.43 R42 032 864.30 109.74%
HIV/AIDS R346 812 358.31 R97 028 737.75 R443 841 096.06 457.43%
Maternity Events -R43 801 257.28 R409 620 387.90 R365 819 130.62 89.31%
Two simultaneous conditions R45 744 918.52 R146 620 565.88 R192 365 484.39 131.20%
Three simultaneous conditions R67 728 018.01 R111 934 716.97 R179 662 734.97 160.51%
4 or more simultaneous conditions R35 971 735.97 R48 106 513.41 R84 078 249.38 174.78%
Total CDL Conditions R416 193 747.37 R2 220 524 633.30 R2 636 718 380.67 118.74%
Multiple CDL Conditions R149 444 672.50 R306 661 796.26 R456 106 468.75 148.73%
Total R649 524 139.51 R5 954 041 586.57 R6 603 565 726.08 110.91%
* “Difference (A - E)” means the difference between actual and reported values while “A / E” means actual divided by expected
17
4.3. Reported CDL conditions count analysis
This section reviews the “count”2 for CDL conditions with financially significant deviations for 2016. Table 6
(page 16) lists these risk factors and deviations from the expected.
4.3.1. Asthma
The reported cases of Asthma (AST) are reported at rates lower than expected in the early months of
2015 and increase to levels higher than expected in the winter months of 2016 as demonstrated in
Figure 5. The reporting of asthma has followed the same seasonal trend as in the previous reporting
period.
Figure 6 shows that asthma peaks at the young age bands (“1 to 4” to “15 to 19” years age bands)
and in the older age bands (“65 to 69” to “80 to 84” years age bands). The peak is higher for male
beneficiaries in the younger age bands and female beneficiaries have a higher count rate in the older
age bands. The reported asthma rates are generally higher than expected in the older age bands.
2 Count in the SRM prevalence grids is defined in version 10.1 of the Guidelines for the Identification of Beneficiaries with Risk Factors in
Accordance with the Entry and Verification Criteria. Note the difference between Count and Prevalence in the SRM grids.
18
Figure 5: Expected and reported AST rates by month (2015 / 2016)
Figure 6: Expected and reported AST rates by age (December 2016)
19
4.3.2. Bipolar Mood Disorder
Bipolar Mood Disorder (BMD) is reported at count rates higher than expected levels starting from
162.21% of the expected levels in January 2015 to 186.38% of the expected levels in December
2016, as shown in Figure 7. The results depicted below show an increase in reported BMD rate
at a decreasing rate from January to December. Possible reasons for the observed over-reporting
is likely to be up-coding by providers in order to gain access to PMB benefits for mental illnesses.
Figure 8 illustrates the distribution of BMD by age bands; the distribution of BMD appeared to be
slightly symmetrical as illustrated by lower rate at childhood, high in middle age group (40 to 44),
and lower for population above 69 years. These changes correlate with the period it takes to
diagnose a child with BMD, and the decrease in life expectancy. Comparably, more female than
male beneficiaries get diagnosed with BMD
Figure 7: Expected and reported BMD count rates by month (2015 / 2016)
20
Figure 8: Expected and reported BMD rates by age (December 2016)
4.3.3. Cardiomyopathy
Cardiomyopathy (CMY) is reported at 114.26% to 146.21% of expected count rate levels between January
2015 and December 2016 as demonstrated in Figure 9. Table 6 (page 16) shows that the estimated CMY
cost is R75 million more than expected in December 2016. This amounts to a 130% increase, attributable
to higher than expected rates reported by certain schemes.
Figure 10 shows that the CMY cases are reported or diagnosed in beneficiaries older than 40 years and
peak in the “85 plus” year age band, as depicted by the exponential increase in the number of beneficiaries
with the CMY condition at an older age. Males have a higher count rate of CMY cases compared to females
across all age bands. The reported cases of CMY seem to be a true reflection of the medical schemes’ risk
profile.
22
Figure 10: Expected and reported CMY count rates by age (December 2016)
4.3.4. Chronic Obstructive Pulmonary Disease
Chronic Obstructive Pulmonary Disease (COPD) is consistently reported at rates lower than the expected
count rates for 2015, but drastically increased for 2016 as demonstrated in Figure 11. This is due to the
significant increase in reported rates for several schemes in 2016. Figure 11 shows that the reported count
rate in the female beneficiaries is responsible for the apparent lower than expected count rate levels.
Figure 11: Expected and reported COPD count rates by month (2015 / 2016)
23
Figure 12: Expected and reported COPD count rates by age (December 2016)
4.3.5. Chronic Renal Disease
Table 6 (page 16) shows that the estimated Chronic Renal Disease (CRF) cost is R41.9 million higher than
expected in December 2016. CRF was consistently reported at rates lower than the expected count rates
for 2015, but has increased substantially to 127% of the expected count rates in 2016, as demonstrated in
Figure 13. This is due to many schemes reporting rates higher than expected.
Figure 14 shows that low reported count rate in the female beneficiaries is responsible for the apparent
lower than expected count rate levels.
24
Figure 13: Expected and reported CRF count rates by month (2015 / 2016)
Figure 14: Expected and reported CRF count rates by age (December 2016)
4.3.6. Diabetes Mellitus Type 1
Diabetes Mellitus Type 1 (DM1) is consistently reported at rates lower than the expected count rates for
both 2015 and 2016, as demonstrated in Figure 15. The explanation for the observed under-reporting could
25
be the poor application of the entry and verification criteria, or the overestimated expected count rates in
the SRM 2009 study.
Figure 11 shows that low reported DM1 count rates have a different pattern from the expected count by age.
Future pricing studies will have to confirm the rates of DM1 and DM2.
Figure 15: Expected and reported DM1 count rates by age (2015 / 2016)
26
Figure 16: Expected and reported DM1 count rates by age (December 2016)
4.3.7. Diabetes Mellitus Type 2
Medical schemes consistently reported Diabetes Mellitus Type 2 (DM2) at rates higher than the expected
count rates for both 2015 and 2016, as demonstrated in Figure 17 and Figure 18. For the same reason
advanced for DM1, the explanation for the observed under-reporting of DM2 could be the poor application
of the entry and verification criteria, or the overestimated expected count rates in the SRM 2009 study. In
addition, there could be up-coding by providers to assist patients in obtaining PMB benefits for metabolic
syndrome.
27
Figure 17: Expected and reported DM2 count rates by age (2015 / 2016)
Figure 18: Expected and reported DM2 count rates by age (December 2016)
28
4.3.8. Human Immunodeficiency Virus (HIV/AIDS) cases on antiretroviral
therapy
HIV Human Immunodeficiency Virus (HIV/AIDS) is consistently reported at count rates
higher than expected between 2015 and 2016 as demonstrated in Figure 19. The underestimation of HIV
in the 2009 SRM study can be explained by the paucity of HIV treatment data in the medical schemes
industry. The sudden drop in the HIV count rates in 2015 is due to non-reporting of HIV cases by several
medical schemes representing a significant population of medical schemes beneficiaries. The 2016 reported
rates for HIV seems to follow the previous trend of around 20 per 1000 lives.
Figure 20 demonstrates the impact of the under-reporting of HIV cases by some medical schemes in 2015
on the age distribution of HIV cases. The 2016 count rate levels are likely to be a true reflection of the
medical schemes risk profile.
Figure 19: Expected and reported HIV count rates by age (2015 / 2016)
29
Figure 20: Expected and reported HIV count rates by age (December 2015 / 2016)
4.3.9. Hyperlipidaemia
Hyperlipidaemia (HYL) continues to be reported at extremely lower than expected count rates. This gross
under-reporting has resulted in the lower than expected HYL at the industry level as demonstrated in Figure
21 and Figure 22. This under-reporting translates to over R145 million under estimation of the HYL treatment
cost, consistent with the previous reporting period (2014/2015).
30
Figure 21: Expected and reported HYL count rates by month (2015 / 2016)
Figure 22: Expected and reported HYL count rates by age (December 2016)
4.3.10. Hypertension (HYP)
Hypertension (HYP) is consistently reported at count rates higher than expected between 2015 and 2016,
with a slight drop for January and February 2016, as illustrated by Figure 23. The explanation for the
observed over-reporting could be the poor application of the entry and verification criteria, or the under-
31
estimated expected count rates in the SRM 2009 study. It is also possible that the observed trends in
hypertension is the reflection of the medical schemes’ true risk profile.
The age distribution of HYP count cases by age follows the expected pattern as demonstrated in Figure 24.
The count of HYP cases increases from the middle age bands and peaks at the oldest age band.
Figure 23: Expected and reported HYP count rates by month (2015 / 2016)
32
Figure 24: Expected and reported HYP count rates by age (December 2016)
4.3.11. Maternity
Maternity (MAT) cases are reported at rates close to the expected levels for most of the months during 2015
and 2016. A very small number of maternity cases were reported for male beneficiaries, very young or very
old female beneficiaries which were excluded from the analysis.
Figure 25: Expected and reported MAT count rates by month (2015 / 2016)
33
Figure 26: Expected and reported MAT count rates by age (December 2016)
4.3.12. Two simultaneous conditions
Two simultaneous CDL conditions (CC2) count cases (beneficiaries treated for two CDL conditions at the
same time) are reported at levels higher than expected levels as demonstrated in Figure 33. About 40 per
1 000 beneficiaries were treated for two simultaneous CDL conditions in 2015 and 2016. This translates to
R45.7 million above the expected cost in 2016, as shown in Table 6 (page 16).
The 2016 prevalence of CC2 is consistently higher than the expected levels for all age bands above 30 –
34 years as depicted in Figure 34. The gap in prevalence between males and females widens in older age
bands, with males treated for CC2 at higher rates than females. The gender prevalence gap closes at ages
greater than 84 years.
34
Figure 27: Expected and reported two simultaneous CDL conditions count rates by month (2015 / 2016)
Figure 28: Expected and reported two simultaneous CDL conditions count rates by age (December 2016)
4.3.13. Three simultaneous conditions
Three simultaneous CDL conditions (CC3) count cases (beneficiaries treated for three CDL conditions at
the same time) are reported at levels higher than expected levels as demonstrated in Figure 29. There has
35
been a slight increase in the reported count of beneficiaries treated for three simultaneous conditions. Nearly
18 out of every 1 000 medical schemes beneficiaries are treated for three simultaneous conditions during
the period under review. This translates to R67.7 million above the expected cost in 2016, as shown in Table
6 (page 16).
Similar to CC2, the 2016 prevalence of CC3 is consistently higher than the expected levels for all age bands
above 30 – 34 years as depicted in Figure 30. The gap in prevalence between males and females widens
in older age bands, with males treated for CC3 at higher rates than females. The gender prevalence gap
closes at ages greater than 84 years.
Figure 29: Expected and reported three simultaneous CDL conditions count rates by month (2015 / 2016)
36
Figure 30: Expected and reported three simultaneous CDL conditions count rates by age (December 2016)
4.3.14. Four or more simultaneous conditions
Four or more simultaneous CDL conditions (CC4) count cases (beneficiaries treated for four or more CDL
conditions at the same time) are reported at levels higher than expected levels as demonstrated in Figure
31. There has been an increase in the count of beneficiaries per 1 000 lives, treated for four or more
simultaneous conditions in 2016. Around 4.5 beneficiaries per 1000 in 2016 were treated for four or more
simultaneous conditions, compared to about 3 per 1000 beneficiaries in 2015. This is due to an increase in
rates above the expected count rates, reported by some schemes. This translates to R35.9 million above
the expected cost in 2016, as shown in Table 6 (page 6). The 2016 prevalence of CC4 is consistently higher
than the expected levels for all age bands above 40 – 44 years as depicted in Figure 32.
37
Figure 31: Expected and reported four or more simultaneous CDL conditions count rates by month (2015 / 2016)
Figure 32: Expected and reported four or more simultaneous CDL conditions count rates by age (December 2016)
4.3.15. Multiple CDL conditions
As seen with CC2, CC3 and CC4, the total multiple CDL conditions count cases are reported at levels higher
than expected levels, as demonstrated in Figure 33. This translates to R149 million above expected costs.
38
The reporting is consistent throughout 2015 and 2016. Figure 34 demonstrates the increase of multiple
CDL cases by age, peaking between the 75 to 79 and 80 to 84 years age bands.
Figure 33: Expected and reported multiple CDL count rates by month (2015 / 2016)
Figure 34: Expected and reported multiple CDL count rates by age (December 2016)
39
4.3.16. SRM price by age and community rate analysis
The SRM price by age curve demonstrates the combined risk of each of the reported SRM risk factors on
medical schemes in comparison to the expected risk attributable to the SRM risk factors. Figure 35
demonstrates that the price by age curves of the submitted SRM returns, closely follow the expected price
by age curve for most age bands. In age bands above 65, the reported levels are higher than expected, and
this trend is consistent throughout 2016.
The minor differences observed in the “less than 1” age band for 2015 (Figure 36), possibly due to over-
reporting of lives in this age band, are not apparent in 2016.
Figure 35: Price by age: All medical schemes (2016)
40
Figure 36: Price by age: All medical schemes (2015)
4.4. Variation in the risk profiles by medical schemes
The scheme’s risk, which is the difference between the industry community rate and the scheme community
rate, was calculated for December in 2015 and 2016 based on the full contribution table (CMS 2015b) (CMS,
2016b). The scheme risk is a proxy to illustrate the differences in the risk profiles of medical schemes. All the
medical schemes that submitted reasonable or fair quality SRM data were included in the calculation of the
industry community rate.
4.4.1. Analysis of the potential financial impact
Table 8 demonstrates the variation in the December 2015 and 2016 community rate for medical schemes and
benefit options, respectively. The variation in the community rate amongst schemes has widened in 2016
compared to 2015. The variation in the community rate is larger between benefit options than it is for medical
schemes. A scheme with the most favourable age structure and low disease burden will pay R361.28 towards
the theoretical risk adjustment system, while a scheme with the most unfavourable risk profile will receive
R797.71 in terms of the December 2016 calculations as shown in Table 7.
The 2016 industry community rate of R745.60 is significantly higher than the reported average PMB cost of
R666.92 (CMS, 2016b). The difference between the industry community rate and reported PMB costs is likely
to be mainly as a result of lower than expected reporting of PMB costs in the Healthcare Utilisation Annual
41
Statutory Returns (ASR) system. Level of compliance to the PMB Code of Conduct (CMS 2010), data quality
and SRM risk factor definitions (CMS, 2016a) account for some of the observed differences. The same is true
for 2015, were the industry community rate is R647.19.00 (CMS 2015b) versus the average PMB cost of
R608.00.
Table 7: Scheme community rate and scheme risk rate analysis for 2016 /2015 financial years
Statistic December 2016 December 2015
Industry community rate R 745.60 R 647.19
Scheme community rate
Number of schemes 82 83
25th percentile R594.19 R552.56
50th percentile R725.35 R654.09
75th percentile R897.74 R804.43
Standard deviation R265.42 R234.39
Scheme risk rate Minimum -R896.49 -R797.71
Maximum R436.32 R361.28
Table 8: Benefit option community rate and scheme risk rate analysis for 2015 /2016 financial years
Statistic December 2016 December 2015
Industry community rate R 745.60 R 647.19
Benefit option community rate
Number of options 302* 298*
25th percentile R 520.01 R 473.53
50th percentile R 714.31 R 646.97
75th percentile R1 130.51 R1 022.33
Standard deviation R 511.61 R 453.33
Benefit option risk rate Minimum -R 2 211.38 -R 2 076.21
Maximum R 440.63 R 409.68
*The 2016 data submitted at the disaggregated, Efficiency Discount Option (EDO) level for schemes with EDO ’s.
In a system of risk adjustment, medical schemes with a community rate lower than that of the industry
community rate would be net payers (young and healthy) and medical schemes with a community rate
higher than the industry community rate would be net receivers (older and sicker). In Table 9, the “Pay”
category refers to medical schemes with a scheme community rate that is lower than the industry community
rate and “Receive” category refers to medical schemes with a community rate that is higher than the industry
community rate.
About 75% and 40.28% of all beneficiaries were in medical schemes whose community rate was lower than
that of the industry in December 2015 and 2016, respectively. The balance of the covered beneficiaries,
were in medical schemes that had a community rate higher than that of the industry as shown in Table 9.
42
Table 10 demonstrates the changes in scheme risk categories between 2015 and 2016. Changes in medical
schemes risk might be due to changes in the medical schemes’ demographic of disease burden profile or poor
data in one of the reporting periods. In 2015, the Government Employees Medical Scheme was classified in the
“Pay: R75 to R100.00 pbpm” payment category in terms of its risk profile, but moved to the more favourable
community rate category of “Pay: R0 to R25.00 pbpm” in 2016 mainly due to the non-reporting of HIV in 2015.
43
Table 9: Frequency distribution of the number of medical schemes versus the scheme risk intervals
Scheme risk category
December 2016 December 2015
Number of medical schemes
Number of beneficiaries
% beneficiaries Number of medical schemes
Number of beneficiaries
% beneficiaries
Pay: R0 to R25,00 PBPM 5 1 954 325 22.66% 5 199 670 2.27%
Pay: R25,01 to R50,00 5 2 832 342 32.84% 4 322 742 3.68%
Pay: R50,01 to R75,00 3 532 255 6.17% 5 90 333 1.03%
Pay: R75,01 to R100,00 7 523 598 6.07% 5 2 486 613 28.32%
Pay: R100,01 to R125,0 1 21 940 0.25% 4 183 772 2.09%
Pay: R125,01 to R150,0 3 46 479 0.54% 2 27 933 0.32%
Pay: More than R150,00 21 641 536 7.44% 13 225 867 2.57%
Sub-total: Pay category 45 6 552 475 75.96% 38 3 536 930 40.28%
Receive: R0,01 to R25, 2 79 500 0.92% 11 4 020 637 45.79%
Receive: R25,01 to R50 2 965 398 11.19% 1 12 199 0.14%
Receive: R50,01 to R75 4 168 722 1.96% 2 13 527 0.15%
Receive: R75,01 to R10 4 240 241 2.79% 3 80 675 0.92%
Receive: R100,01 to R1 3 383 877 4.45% 6 318 062 3.62%
Receive: R125,01 to R1 1 2 369 0.03% 1 198 516 2.26%
Receive: More than R15 21 464 174 5.38% 21 599 843 6.83%
Sub-total: Receive category 37 2 304 281 26.71% 45 5 243 459 59.72%
Total 82 8 625 815 100.00% 83 8 780 389 100.00%
44
Table 10: Changes in scheme risk categories
Scheme risk category in 2016
Scheme risk category in 2015 (Beneficiaries in 2016, (number of medical schemes)) Pay: R0 to R25.00 PBPM
Pay: R0 to R25.00 PBPM
1 831 540 (1) 69 555 (1) 1 2200 (1) 2 940 (1)
Pay: R25.01 to R50.00 PBPM
4 397 (1) 2 818 226 (3)
Pay: R50.01 to R75.00 PBPM
12 711 (1) 49 8024 (1) 21 520 (1)
Pay: R75.01 to R100.00 PBPM
1 56 391 (2) 331 749 (3) 35 458 (2)
Pay: R100.01 to R125.00 PBPM
21 940 (1)
Pay: R125.01 to R150.00 PBPM
28 565 (2) 17 914 (1)
Pay: More than R150.00 PBPM
218 958 (3) 164 496 (3) 29 303 (2)
Receive: R0.01 to R25.00 PBPM
2 675 (1)
Receive: R25.01 to R50.00 PBPM
965398 (2)
Receive: R50.01 to R75.00 PBPM
6560 (1) 152 605 (2)
Receive: R75.01 to R100.00 PBPM
201794 (2) 38 447 (2)
Receive: R100.01 to R125.00 PBPM
44 904 (1)
Receive: R125.01 to R150.00 PBPM
Receive: More than R150.00 PBPM
24 939 (1) 10 341 (1)
45
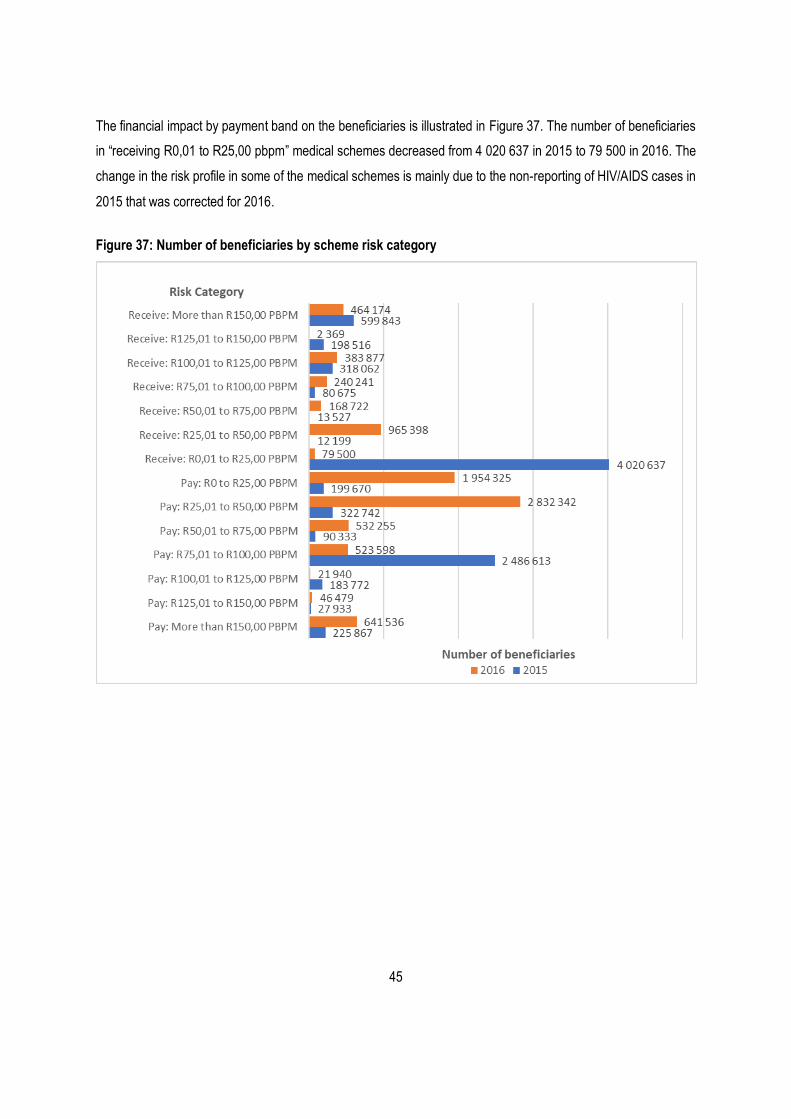
The financial impact by payment band on the beneficiaries is illustrated in Figure 37. The number of beneficiaries
in “receiving R0,01 to R25,00 pbpm” medical schemes decreased from 4 020 637 in 2015 to 79 500 in 2016. The
change in the risk profile in some of the medical schemes is mainly due to the non-reporting of HIV/AIDS cases in
2015 that was corrected for 2016.
Figure 37: Number of beneficiaries by scheme risk category
46
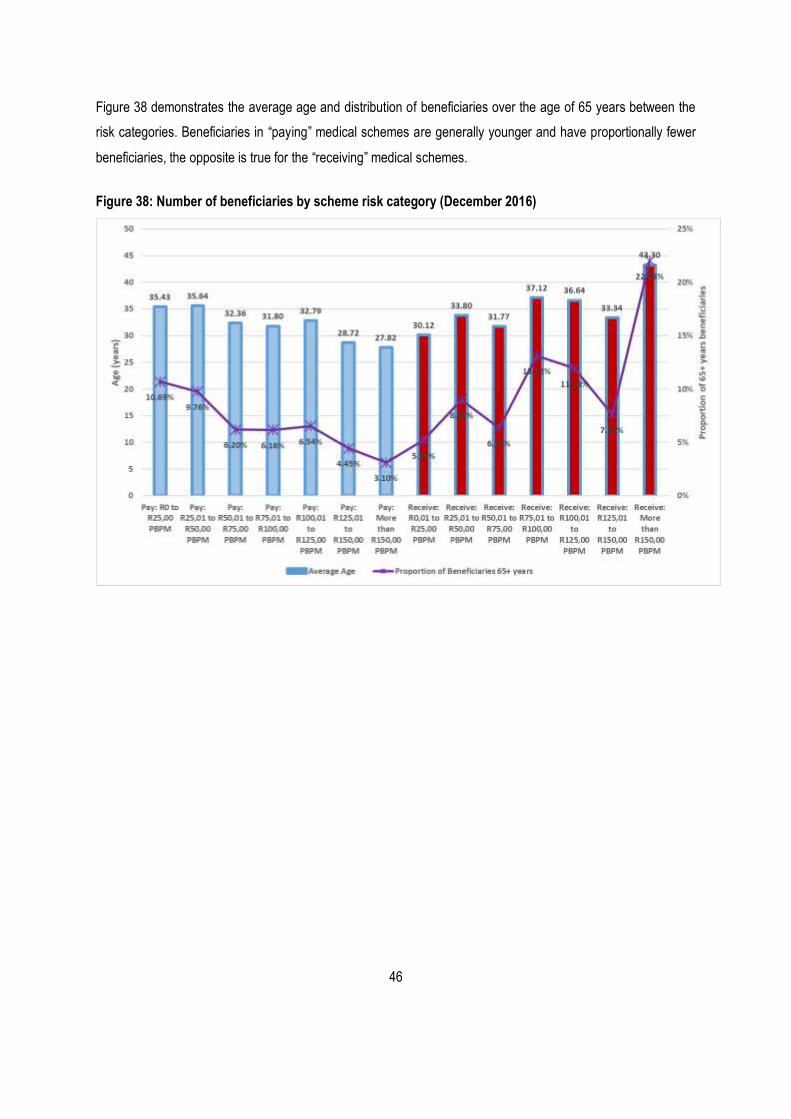
Figure 38 demonstrates the average age and distribution of beneficiaries over the age of 65 years between the
risk categories. Beneficiaries in “paying” medical schemes are generally younger and have proportionally fewer
beneficiaries, the opposite is true for the “receiving” medical schemes.
Figure 38: Number of beneficiaries by scheme risk category (December 2016)
47
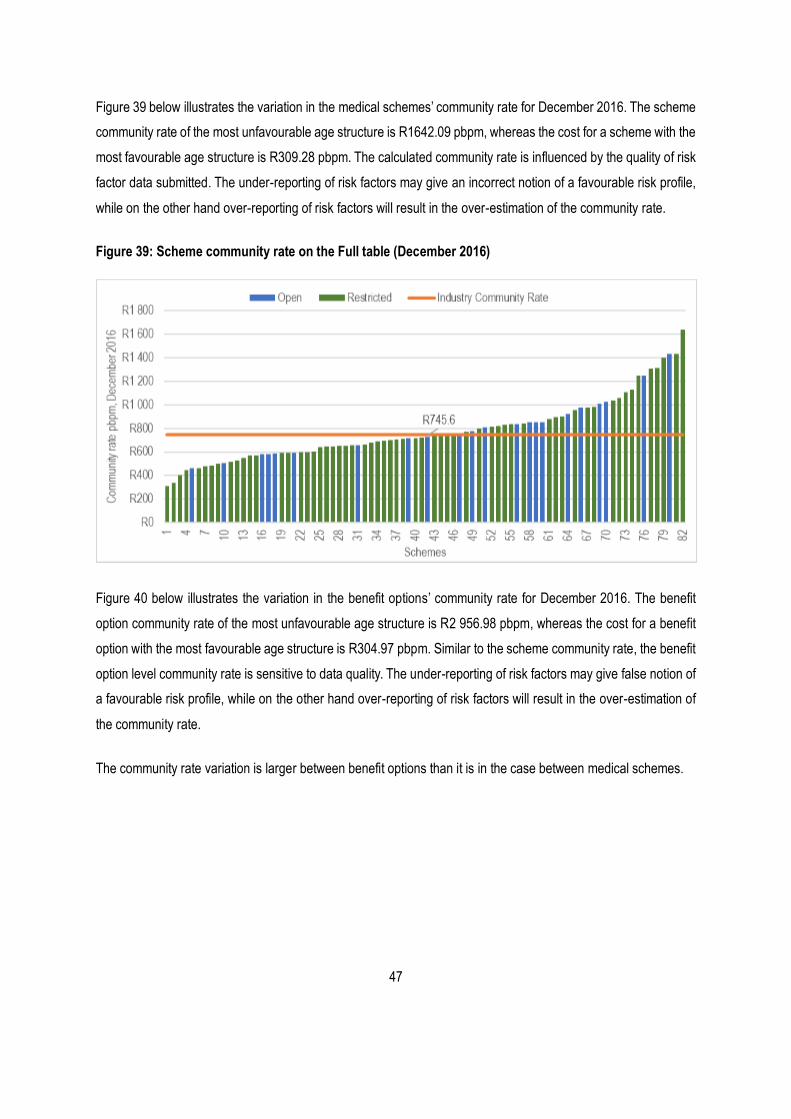
Figure 39 below illustrates the variation in the medical schemes’ community rate for December 2016. The scheme
community rate of the most unfavourable age structure is R1642.09 pbpm, whereas the cost for a scheme with the
most favourable age structure is R309.28 pbpm. The calculated community rate is influenced by the quality of risk
factor data submitted. The under-reporting of risk factors may give an incorrect notion of a favourable risk profile,
while on the other hand over-reporting of risk factors will result in the over-estimation of the community rate.
Figure 39: Scheme community rate on the Full table (December 2016)
Figure 40 below illustrates the variation in the benefit options’ community rate for December 2016. The benefit
option community rate of the most unfavourable age structure is R2 956.98 pbpm, whereas the cost for a benefit
option with the most favourable age structure is R304.97 pbpm. Similar to the scheme community rate, the benefit
option level community rate is sensitive to data quality. The under-reporting of risk factors may give false notion of
a favourable risk profile, while on the other hand over-reporting of risk factors will result in the over-estimation of
the community rate.
The community rate variation is larger between benefit options than it is in the case between medical schemes.
48
Figure 40: Benefit option rate on the Full table (December 2016)
4.5. Community rate trend analysis
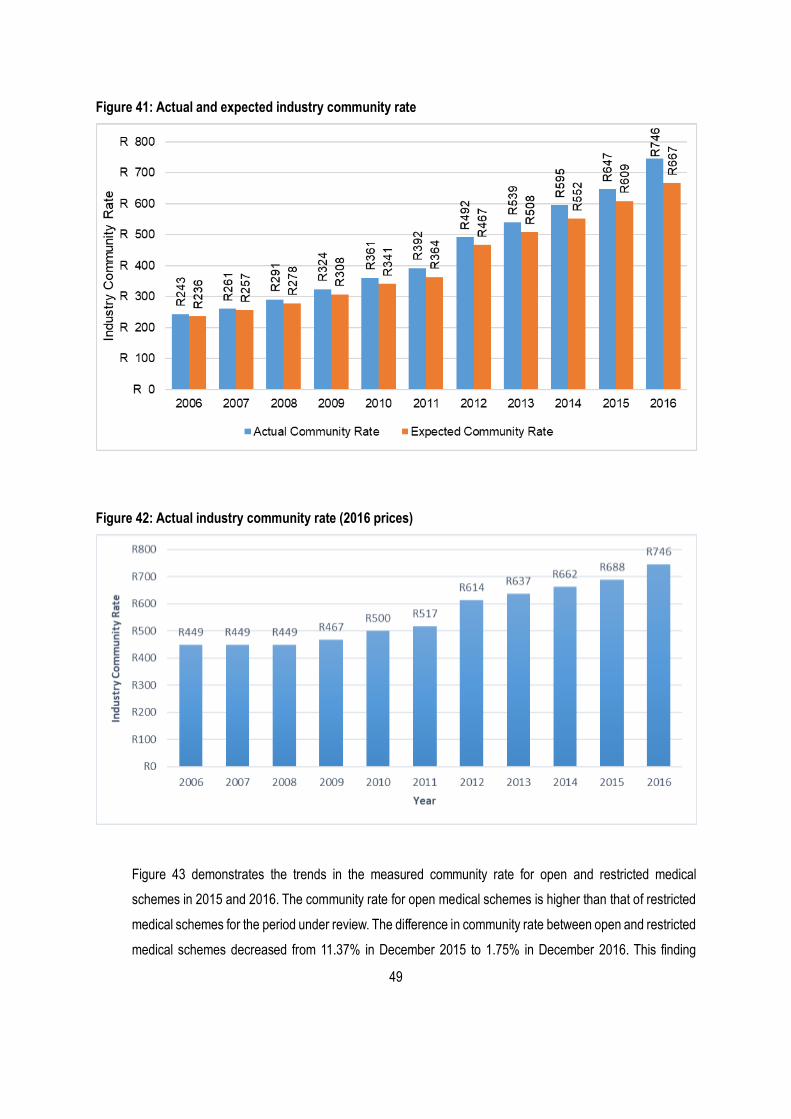
There has been a gradual increase in the measured community between 2006 and 2016 owing to changes in
the scheme risk profiles, healthcare utilisation and inflation as depicted in Figure 41. The 2005 – 2011 industry
community rate analysis was based on the 2005 PMB costing study, while the 2009 PMB costing study was
used for the years from 2012. This explains the sharp increase in the community rate between 2011 and 2012.
It is also worth noting that the expected industry community rate is lower than the actual community for all the
years during which medical schemes’ risk factor data has been collected. This could be attributed to the fast-
changing scheme demographics, utilisation patterns and improved identification of beneficiaries with SRM risk
factors.
Figure 42 demonstrates the impact of risk factor variables and probable changes in the utilisation behaviour
when prices are kept constant. The industry community rate, the indirect measure for PMB costs, increased
by 66% from R449 in 2006 to R746 in 2016 (2016 prices). This large increase, from 2006 to 2016, can be
attributed to changing scheme demographics, (e.g. aging), increased utilisation of healthcare services (e.g.
hospitals and specialists) and improved identification of beneficiaries with SRM risk factors. Further studies
are needed to unpack the contribution of each of these factors to the changes observed in estimated costs
between 2006 and 2016. The industry community rate is expected to continue to increase at levels above
inflation as risk profiles of medical schemes continue to deteriorate. The increase from 2015 to 2016 amounted
to 8.34%.
49
Figure 41: Actual and expected industry community rate
Figure 42: Actual industry community rate (2016 prices)
Figure 43 demonstrates the trends in the measured community rate for open and restricted medical
schemes in 2015 and 2016. The community rate for open medical schemes is higher than that of restricted
medical schemes for the period under review. The difference in community rate between open and restricted
medical schemes decreased from 11.37% in December 2015 to 1.75% in December 2016. This finding
50
suggests that, on average, restricted medical schemes have a more favourable risk profile compared to
open medical schemes.
Figure 43: Industry community rate for open and restricted medical schemes
51
5. Summary of the findings
5.1. Scheme participation
The shift from the voluntary submission of SRM risk factors via e-mailed excel grids to the Annual Statutory
Returns Healthcare Utilisation has guaranteed full participation of medical schemes in the SRM process. This
change is likely to reduce the administrative burden on the part of medical schemes with regards to submitting
data to the CMS.
5.2. Data quality and application of the Entry and Verification Criteria
There has been a significant decline in the submission of risk factor data to the CMS over the last few years.
Many medical schemes failed to correctly apply the Entry and Verification Criteria in 2014 and 2015. It has
become difficult to assess the quality of CDL data submitted by medical schemes because the 2009 weighting
and count tables have become outdated due to a change in the risk profiles of medical schemes. Nevertheless,
these tools remain useful as a standard in comparing differences in risk profiles between medical schemes.
Individual reports will be sent to medical schemes comparing the submission with the expected CDL
Prevalence. The area of improvement remains the correct classification of beneficiaries in the correct age
bands, especially beneficiaries under 1 and the 85 plus age groups. The calculated community rate is not
likely to be accurate because of the large number of medical schemes that submitted poor demographic data.
5.3. Chronic disease prevalence
The prevalence of diagnosed and treated CDL conditions has changed slightly between 2015 and 2016.
Hypertension remains the most prevalent CDL condition, followed by hyperlipidaemia, diabetes mellitus type
2, hypothyroidism and asthma. It must be noted that the reported prevalence is that of diagnosed and treated
cases as per entry and verification criteria, and must not be mistaken with the number of beneficiaries
registered on a disease management programme or prevalence as reported in medical literature. This
prevalence will therefore be lower than the actual population prevalence of chronic diseases. The observed
trends are valuable in understanding the changes in the risk profiles of medical schemes.
5.4. Variation in the risk profiles by medical schemes
The findings indicate that a large degree in the variation in risk profile between medical schemes is directly
attributable to the actual differences in the risk profile of individual medical schemes. The increase in the
reported industry community rate is possibly due to a change in the risk profile of medical schemes’
52
beneficiaries. The inflation adjusted 2009 weighting table is likely to be outdated, and may be the cause of a
possible underestimation of the industry community rate. The variation in the observed scheme community
rate is a clear indication that schemes are facing different risks and that a system of risk adjustment is still
applicable in the private medical scheme industry.
5.5. Price by age and community rate analyses
The cost of treating beneficiaries under 1 and those over 60 years of age is very high. The costs are relatively
low in the older children and adults under the age of 60 years. The relatively high costs in the 20 to 40 years
could be explained by the demand for maternity services in these age bands. Diseases such as hypertension,
bipolar mood disorder, diabetes mellitus type 2, HIV/AIDS and occurrence of multiple concurrent condition are
contributory to higher costs in the older age bands.
5.6. Conclusion
Despite the data challenges and possible outdated expected values, there are still significant differences in
the risk profiles of schemes and schemes do not compete at the same level. The most significant area of
concern related to the SRM process is the quality of data submitted by medical schemes. The accurate
analysis of scheme risk profiles is highly dependent on the quality of data. Poor data quality will invariably lead
to unreliable estimates and wrong conclusions. The CMS will in future introduce more validation rules in the
ASR in order to improve the quality of the submitted SRM data.
53
6. References
Council for Medical Schemes. 2010. Code of Conduct in respect of PMB benefits [Online]. Pretoria: Council for Medical Schemes. Available: http://www.medicalschemes.com/files/Guidelines%20and%20Manuals/CodeOfConduct_20100803.pdf [Accessed 19 October 2016].
Council for Medical Schemes. 2011. Circular 47 of 2011: Update on the Implementation of the Risk Equalisation Fund [Online]. Pretoria: Council for Medical Schemes. Available: http://www.medicalschemes.com/Publications.aspx [Accessed 19 September 2016].
Council for Medical Schemes. 2014a. Guidelines for the Identification of Beneficiaries with Risk Factors in Accordance with the Entry and Verification Criteria Version 8.1 Applicable from 1 January 2014 [Online]. Pretoria: Council for Medical Schemes. Available: http://www.medicalschemes.com/Publications.aspx [Accessed 19 September 2016].
Council for Medical Schemes. 2014b. Scheme Risk Measurement Weighting and Count Tables for 2014 [Online]. Pretoria: Council for Medical Schemes. Available: http://www.medicalschemes.com/Publications.aspx [Accessed 19 September 2016].
Council for Medical Schemes. 2015a. Guidelines for the Identification of Beneficiaries with Risk Factors in Accordance with the Entry and Verification Criteria Version 9.1 Applicable from 1 January 2015 [Online]. Pretoria: Council for Medical Schemes. Available: http://www.medicalschemes.com/Publications.aspx [Accessed 19 September 2016].
Council for Medical Schemes. 2015b. Scheme Risk Measurement Weighting and Count Tables for 2015 [Online]. Pretoria: Council for Medical Schemes. Available: http://www.medicalschemes.com/Publications.aspx [Accessed 6 September 2016].
Council for Medical Schemes. 2016. CMS Annual Report 2015-2016 [Online]. Pretoria: Council for Medical Schemes. [Accessed 18 October 2016].
Council for Medical Schemes. 2016a. Guidelines for the Identification of Beneficiaries with Risk Factors in Accordance with the Entry and Verification Criteria Version 9.1 Applicable from 1 January 2016 [Online]. Pretoria: Council for Medical Schemes. Available: http://www.medicalschemes.com/files/ITAP%20Documents/10.1guidelines.pdf [Accessed 1 November 2017]
Council for Medical Schemes. 2016b. Scheme Risk Measurement Weighting and Count Tables for 2016 [Online]. Pretoria: Council for Medical Schemes. Available: http://www.medicalschemes.com/files/ITAP%20Documents/SRMWeightingandCountTables.xlsx [Accessed 1 November 2017].