ANalysis Of Translational Activity (anota) Ola Larsson <[email protected]>, Nahum Sonenberg <[email protected]>, Robert Nadon <[email protected]> October 30, 2018 Contents 1 Introduction 1 2 Data set quality control in anota 4 3 Using anota to identify differential translation 6 4 Random variance model (RVM) to improve power in detection of differ- ential translational activity within anota 10 5 Data set requirements for application of anota 11 6 Example 11 1 Introduction Translational control of gene expression is a mechanism that affects the relationship between mRNA level and protein level. Translation is commonly deregulated in human diseases such as cancer and understanding which mRNAs are targeted for translational deregulation and the mechanisms that mediate such effects is of high importance. Estimates of global transla- tional activity has primarily been generated using the poly(ribo)some microarray approach (reviewed in [1]) but sequencing based methods have also recently been developed [2]. Both approaches are based on a parallel quantification of cytosolic mRNA level and the level of those mRNAs that are actively utilized for translation. During poly(ribo)some prepa- rations, the cytosolic mRNA is isolated and separated based on the number of associated ribosomes. Fractions of mRNAs associated with several ribosomes are pooled and designated the translationally active pool. A parallel cytosolic mRNA sample, which is used to assess the cytosolic mRNA level, is also collected. More details are found in [1]. The recent sequencing 1
3 Using anota to identify differential translation 6
4 Random variance model (RVM) to improve power in detection of differ-ential translational activity within anota 10
5 Data set requirements for application of anota 11
6 Example 11
1 Introduction
Translational control of gene expression is a mechanism that affects the relationship betweenmRNA level and protein level. Translation is commonly deregulated in human diseases suchas cancer and understanding which mRNAs are targeted for translational deregulation andthe mechanisms that mediate such effects is of high importance. Estimates of global transla-tional activity has primarily been generated using the poly(ribo)some microarray approach(reviewed in [1]) but sequencing based methods have also recently been developed [2]. Bothapproaches are based on a parallel quantification of cytosolic mRNA level and the levelof those mRNAs that are actively utilized for translation. During poly(ribo)some prepa-rations, the cytosolic mRNA is isolated and separated based on the number of associatedribosomes. Fractions of mRNAs associated with several ribosomes are pooled and designatedthe translationally active pool. A parallel cytosolic mRNA sample, which is used to assess thecytosolic mRNA level, is also collected. More details are found in [1]. The recent sequencing
1
based method utilizes the ribosome protection assay where the mRNA part that is boundto a ribosome is resistant to mild RNA degradation treatment and mRNA fragments, whichcorrespond to the expected size that is protected from degradation (hence bound to ribo-somes and actively translated), are isolated. This sample is similar to the actively translatedsample from the polysome microarray approach. Analogous to the cytosolic mRNA samplethat is isolated during the polysome microarray approach, a parallel sample which has beenprocessed similarly but without applying the protection assay is also collected. Thus, bothapproaches generate two data types, one from cytosolic mRNA and a second from activelytranslating mRNA.
After isolation of cytosolic mRNA and translationally active mRNA, both samples arelabelled and probed with microarrays in the case of the polysome microarray approach orsubjected to deep sequencing in the case of the ribosome profiling approach. The result forboth methods is, sample per sample, data for cytosolic mRNA level and data for transla-tionally active mRNA. In the simplest case, changes in translational control between twosample classes could be assessed by comparing the data obtained from the translationallyactive mRNA. However, a change in transcription, mRNA transport from the nucleus to thecytosol or mRNA stability would be expected to also lead to changes in the data derivedfrom translationally active mRNA despite being unrelated to translational activity. It istherefore necessary to correct for differences in the cytosolic mRNA pool when comparingdata from translationally active mRNA. To date, correction has primarily been performedby creating per sample differences (log scale) between the translationally active mRNA leveland the cytosolic mRNA level [1]. These have then been compared directly between sampleclasses. However, as discussed in [3] the corrected values often show spurious correlation tothe data derived from the cytosolic mRNA. There are also several examples of where the logratio approach will lead to false conclusions [3].
Most of these problems can be solved by using regression analysis between the translation-ally active mRNA levels and the cytosolic mRNA levels. Such analysis produces residualsthat are uncorrelated with the cytosolic mRNA levels and differential translation can beidentified using Analysis of Partial Variance (APV) [3]. However, to apply linear regressionsand APV, various assumptions need to be fulfilled for tens of thousands of genes, thus offer-ing substantial challenges. Due to the high dimensionality of the data, anota takes multipletesting into account when assessing assumption violations. If we observe the same numberof problematic features as expected, we assume that we can apply anota.
The first issue that needs consideration is the appearance of highly influential data pointswhich may cause errors in the regression analyses. On the one hand, we expect that a numberof highly influential data points will appear merely by chance because of the large numberof analyses performed. Thus we attempt to establish if we, when considering all analysedgenes, observe more influential data points compared to what would be expected by chance.If the answer is no, then there are no concerns with the overall analysis. On the other hand,
2
influential data points may nonetheless affect the specific APV analyses in which they arefound. For this reason, anota provides an output that can be used to flag these results sothat they can be examined in more detail if desired.
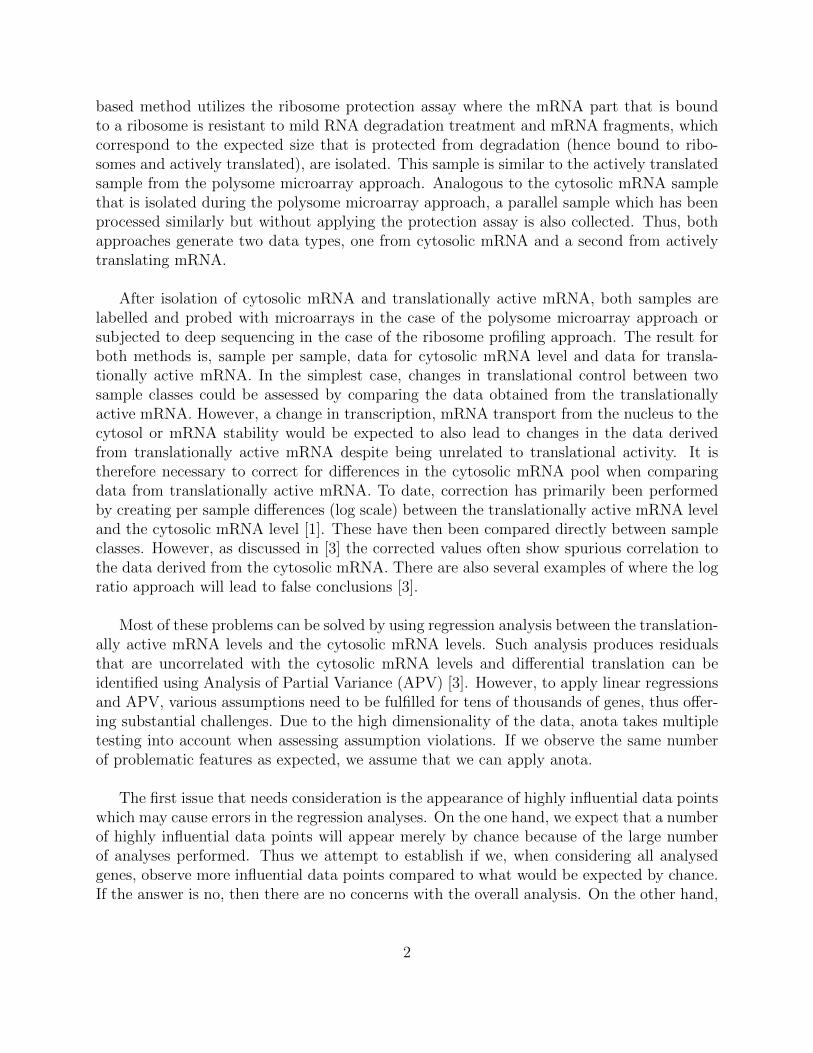
For detection of influential data points, anota uses standardized dfbeta for the slope ofthe regression and several thresholds to determine whether or not a data point is highlyinfluential. As there is no known distribution of the dfbetas when the underlying data arenormally distributed, anota simulates data sets to obtain estimates of the expected numberof outliers. The simulation is performed by sampling N (corresponding to the number ofsamples in the analysis) data points from the normal distribution and calling these datapoints the cytosolic mRNA level. The translationally active mRNA levels are obtained bysampling data points from a normal distribution with a mean of the cytosolic mRNA levelfor each cytosolic mRNA level data point. Ten different such data sets are obtained withdifferent variances when sampling the translationally active mRNA level data. These datasets are then merged and frequencies of outlier dfbetas are calculated and compared to thefrequencies of outlier dfbetas from the analyzed data. This level of quality control is per-formed in the anotaPerformQc function.
A second issue concerns the APV assumption that the slopes of the regressions from eachsample class are the same so that using the common slope is valid. This assumption postu-lates that the relationship between the translationally active mRNA level and the cytosolicmRNA level shows the same slope for each sample class, i.e., sample class and cytosolicmRNA levels do not interact in predicting translation mRNA levels. Again, because weanalyse tens of thousands of regressions, we expect that a number of interactions will arisesimply due to chance. If the number of interactions does not exceed what is expected bychance, their p-values should follow a uniform NULL distribution. Thus the second levelof quality control compares the distribution of the interaction significances as well as thedistribution after adjusting the interaction p-values for multiple testing. This level of qualitycontrol is performed in the anotaPerformQc function.
The third issue relates to the significance testing within the APV framework which as-sumes that the residuals from the regressions are normally distributed. The anotaResid-
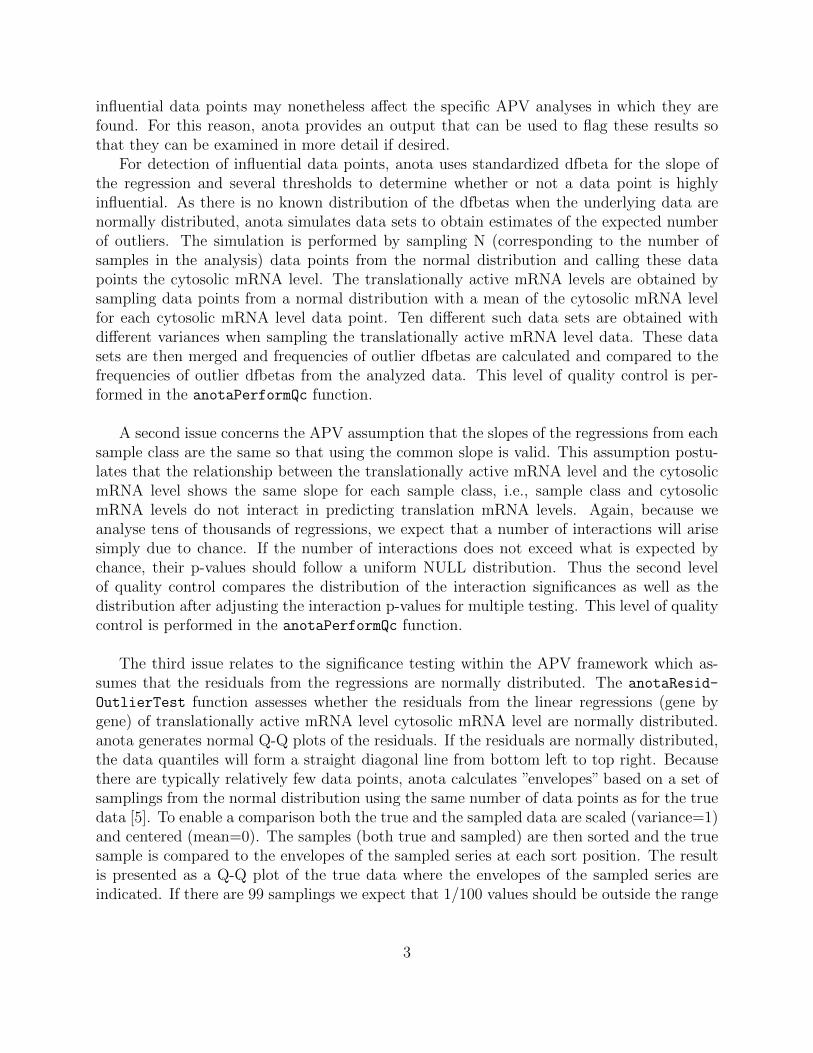
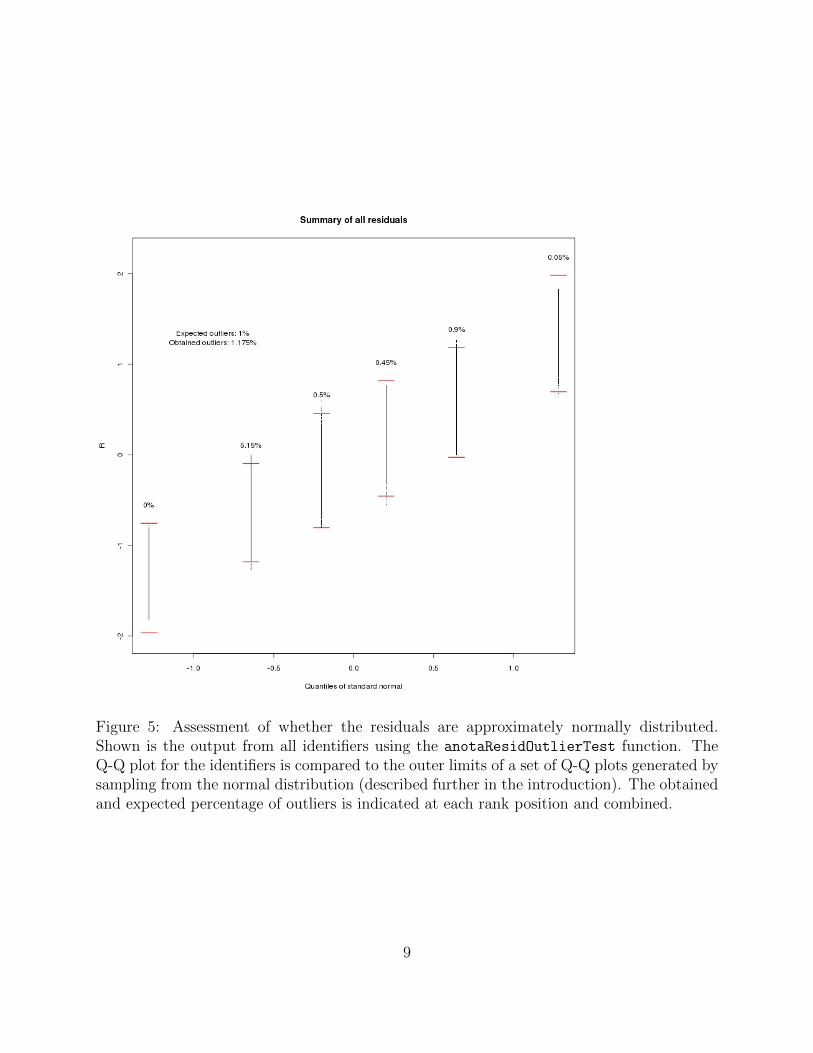
OutlierTest function assesses whether the residuals from the linear regressions (gene bygene) of translationally active mRNA level cytosolic mRNA level are normally distributed.anota generates normal Q-Q plots of the residuals. If the residuals are normally distributed,the data quantiles will form a straight diagonal line from bottom left to top right. Becausethere are typically relatively few data points, anota calculates ”envelopes” based on a set ofsamplings from the normal distribution using the same number of data points as for the truedata [5]. To enable a comparison both the true and the sampled data are scaled (variance=1)and centered (mean=0). The samples (both true and sampled) are then sorted and the truesample is compared to the envelopes of the sampled series at each sort position. The resultis presented as a Q-Q plot of the true data where the envelopes of the sampled series areindicated. If there are 99 samplings we expect that 1/100 values should be outside the range
3
obtained from the samplings. Thus it is possible to assess if approximately the expectednumber of outlier residuals are obtained.
The slopes that are used within anota can take unrealistic values that will influencethe analysis of differential translation. These are random events that are likely to be morecommon when fewer samples and fewer sample classes are analysed. anota therefore testswhether slopes that are <0 (representing unlikely but not impossible translational control[3]) or >1 (slopes >1 are not realistic) differ from 0 and 1 respectively and reports a p-valuein the output of the anotaPerformQc and anotaGetSigGenes functions. This p-value canbe used to filter or flag genes with unrealistic slopes.
While anota enables testing of the issues discussed above it is left to the user to decidewhether it is possible to use anota to identify differential translation. A few issues that maycause problems in the quality control are:
1. Outlier samples. One or a few outlier samples in the analysis (either from the transla-tion data or the cytosolic mRNA data) could give rise to many influential data points.Thus, if there are more influential data points than would be expected, a careful qualitycontrol of the data followed by identification and exclusion of outlier samples might beneeded to resolve such issues.
2. More significant interactions compared to what is expected by chance could be causedby bias in the data set. One essential component during the polysome preparations isthe consistent isolation of the same stratum of the polysomes across all samples (i.e.,so that the >n ribosome threshold is met when pooling fractions, not >n+1 or >n-1)because the cut off point will influence the slope. A systematic error in the cut offcould cause a high abundance of interactions. If one retrospectively can go back andassess which samples may have error in the cut off one could try to either remove theseor use established methods to remove systematic bias.
3. If the resulting residuals deviate strongly from normality an alternative normalizationmethod could be tested.
2 Data set quality control in anota
The anotaPerformQc checks whether the data set shows the expected number of highlyinfluential data points and whether there are more significant interactions compared to whatis expected by chance. anotaPerformQc can also output a set of identifier per identifierregressions (not default) which may be a good approach to see how well regressions seem towork (1).
Further, anota generates an output from the influential data point analysis where theobtained number of influential data points using several suggested thresholds are comparedto a simulated data set 2.
4
6 7 8 9 10
45
67
89
NM_000014_at
dataT[i, ]
data
P[i,
]
HLF
HLF
HLF
HLF
HLF
HLF
HLF
HLF
HLF
HLF
HLF
HLF
IPF
IPF
IPF
IPF
IPF
IPFIPF
IPF
IPF IPFIPF
IPF
3.0 3.1 3.2 3.3 3.4 3.5 3.6
3.1
3.2
3.3
3.4
3.5
3.6
3.7
NM_000015_at
dataT[i, ]
data
P[i,
]
HLF
HLF
HLF
HLF
HLF
HLF
HLF
HLF
HLF
HLF
HLF
HLF
IPF
IPF
IPF
IPF
IPF
IPF
IPF
IPF
IPF
IPF
IPF
IPF
7.6 7.8 8.0 8.2 8.4
7.6
7.8
8.0
8.2
8.4
8.6
8.8
NM_000016_at
dataT[i, ]
data
P[i,
]
HLF
HLF
HLFHLF
HLF
HLF
HLF
HLF
HLF
HLF
HLF
HLF
IPF
IPF
IPF
IPF
IPF
IPF
IPF
IPF
IPF
IPF
IPF
IPF
5.8 6.0 6.2 6.4 6.6
6.0
6.2
6.4
6.6
6.8
7.0
NM_000017_at
dataT[i, ]
data
P[i,
]
HLF
HLF
HLF
HLF
HLF
HLF
HLF
HLF
HLF
HLFHLF
HLF
IPF
IPF
IPF
IPF
IPF
IPF
IPF
IPF
IPF
IPFIPF
IPF
9.6 9.8 10.0 10.2 10.4 10.6
9.0
9.5
10.0
10.5
11.0
NM_000018_at
dataT[i, ]
data
P[i,
]
HLF
HLF
HLF
HLF
HLF
HLF
HLFHLF
HLF
HLF
HLF
HLF
IPF
IPF
IPF IPF
IPF
IPF
IPF
IPFIPF
IPF
IPF
IPF
9.0 9.2 9.4 9.6 9.8 10.0 10.2
8.5
9.0
9.5
10.0
10.5
NM_000019_at
dataT[i, ]
data
P[i,
]
HLF
HLF
HLF
HLF
HLF
HLFHLF
HLFHLF
HLFHLF
HLF
IPF
IPF
IPF
IPF
IPF
IPFIPF
IPF
IPF
IPF
IPF
IPF
4.8 5.0 5.2 5.4 5.6 5.8
4.4
4.6
4.8
5.0
5.2
5.4
NM_000020_at
dataT[i, ]
data
P[i,
] HLF
HLF
HLF
HLF
HLF
HLF
HLF
HLF
HLF
HLF
HLF
HLF
IPF
IPF
IPFIPF
IPF
IPF
IPF
IPF
IPF
IPF
IPF
IPF
7.4 7.6 7.8 8.0 8.2 8.4 8.6
6.5
7.0
7.5
8.0
NM_000021_at
dataT[i, ]
data
P[i,
]
HLFHLF
HLF
HLFHLF
HLF
HLF
HLF
HLF
HLF
HLF
HLF
IPF
IPF
IPF
IPF
IPF
IPF
IPF
IPF
IPF
IPF
IPF
IPF
Figure 1: anota can be set to output identifier per identifier regressions between transla-tionally active and cytosolic mRNA levels. Plotting symbols are taken from the phenoVec
argument and the lines are the regressions lines per samples class
5
0.00
0.05
0.10
0.15
Proportion of outliers in regression assessment using dfbetas
Figure 2: A bar graph showing the obtained and expected (based on a simulation) numberof influential data points as judged by different thresholds. For each threshold the differencebetween the obtained and the simulated frequency of outliers is shown.
anota also generates an output from the analysis of interactions 3. Here the distributionof the obtained interaction significances is assessed to examine if these follow the uniformNULL distribution.
anota also allows for examination of the residuals from the linear regression within theanotaResidOutlierTest. As discussed in the introduction, the test allows for examinationif the residuals are approximately normally distributed. The single identifier output fromanotaResidOutlierTest is shown in figure 4 and the summary output output is shown infigure 5.
Finally, as described above, anota reports p-values for unlikely or unrealistic slopes whichcan be used to filter or flag genes.
3 Using anota to identify differential translation
Once the data set has been validated as suitable for analysis, significant translational regu-lation is identified. anotaPerformQc performs an omnibus group effect test when there aremore than 2 sample classes. Within the anotaGetSigGenes the user can set custom contraststo identify significantly differentially translated genes. The output from anotaGetSigGenes
can be visualized and filtered using the anotaPlotSigGenes function to generate both asummary table and per gene plots. The graphical output shows both the graphical inter-
Figure 3: Assessment of whether the significances for the interactions follow the uniformNULL distribution. Shown are both density plots and histograms of the nominal and adjustedp-values (in this case adjusted using Benjamini-Hochberg FDR).
7
NM_000014_at
−2.0 −1.0 0.0 0.5 1.0 1.5 2.0
−3
−2
−1
01
23
Quantiles of Standard Normal
R1
NM_000016_at
−2.0 −1.0 0.0 0.5 1.0 1.5 2.0
−3
−2
−1
01
23
Quantiles of Standard NormalR
1
NM_000017_at
−2.0 −1.0 0.0 0.5 1.0 1.5 2.0
−3
−2
−1
01
23
Quantiles of Standard Normal
R1
NM_000018_at
−2.0 −1.0 0.0 0.5 1.0 1.5 2.0
−3
−2
−1
01
23
Quantiles of Standard Normal
R1
NM_000019_at
−2.0 −1.0 0.0 0.5 1.0 1.5 2.0
−3
−2
−1
01
23
Quantiles of Standard Normal
R1
NM_000020_at
−2.0 −1.0 0.0 0.5 1.0 1.5 2.0
−3
−2
−1
01
23
Quantiles of Standard NormalR
1
NM_000021_at
−2.0 −1.0 0.0 0.5 1.0 1.5 2.0
−3
−2
−1
01
23
Quantiles of Standard Normal
R1
NM_000022_at
−2.0 −1.0 0.0 0.5 1.0 1.5 2.0
−3
−2
−1
01
23
Quantiles of Standard Normal
R1
NM_000023_at
−2.0 −1.0 0.0 0.5 1.0 1.5 2.0
−3
−2
−1
01
23
Quantiles of Standard Normal
R1
NM_000024_at
−2.0 −1.0 0.0 0.5 1.0 1.5 2.0
−3
−2
−1
01
23
Quantiles of Standard Normal
R1
NM_000025_at
−2.0 −1.0 0.0 0.5 1.0 1.5 2.0
−3
−2
−1
01
23
Quantiles of Standard Normal
R1
NM_000026_at
−2.0 −1.0 0.0 0.5 1.0 1.5 2.0
−3
−2
−1
01
23
Quantiles of Standard Normal
R1
Figure 4: Assessment of whether the residuals are approximately normally distributed.Shown is the output from the single identifier alternative within anotaResidOutlierTest.The Q-Q plot for the identifier is compared to the outer limits of a set of Q-Q plots generatedby sampling from the normal distribution (described further in the introduction).
8
Figure 5: Assessment of whether the residuals are approximately normally distributed.Shown is the output from all identifiers using the anotaResidOutlierTest function. TheQ-Q plot for the identifiers is compared to the outer limits of a set of Q-Q plots generated bysampling from the normal distribution (described further in the introduction). The obtainedand expected percentage of outliers is indicated at each rank position and combined.
9
1 2 3 4 5
12
34
5
YDL223C Slope: 0.31
Transcription
Tran
slat
ion
noAAnoAAnoAA
richrichrich
YDL223C APV statistics without RVM
Contrast: 1rich vs. noAA
Effect: -1.37p-value: 0.001
adjusted p-v alue: 0.121
YDL223C APV statistics with RVM
Contrast: 1rich vs. noAAEffect: -1.37
p-value: 2e-04adjusted p-value: 0.051
Figure 6: The output from the anotaPlotSigGenes function. The left graph shows theidentifier per identifier regressions between translationally active and cytosolic mRNA levels.Plotting symbols are taken from the phenoVec argument supplied to the anotaGetSigGenes
function and the lines are the regression lines per sample class using the common slopeidentified in APV (shown in the main title). The right and middle graphs show key statisticsfor the analyzed gene with and without RVM respectively. When there is more than onecontrast all contrasts will be shown but any filterings defined within the anotaPlotSigGenesfunction will be applied to the selected contrast only.
pretation of the APV analysis and the key statistics from both the standard and the RVMbased analysis 6. See the function descriptions within the anota R package for each functionfor more details.
4 Random variance model (RVM) to improve power in
detection of differential translational activity within
anota
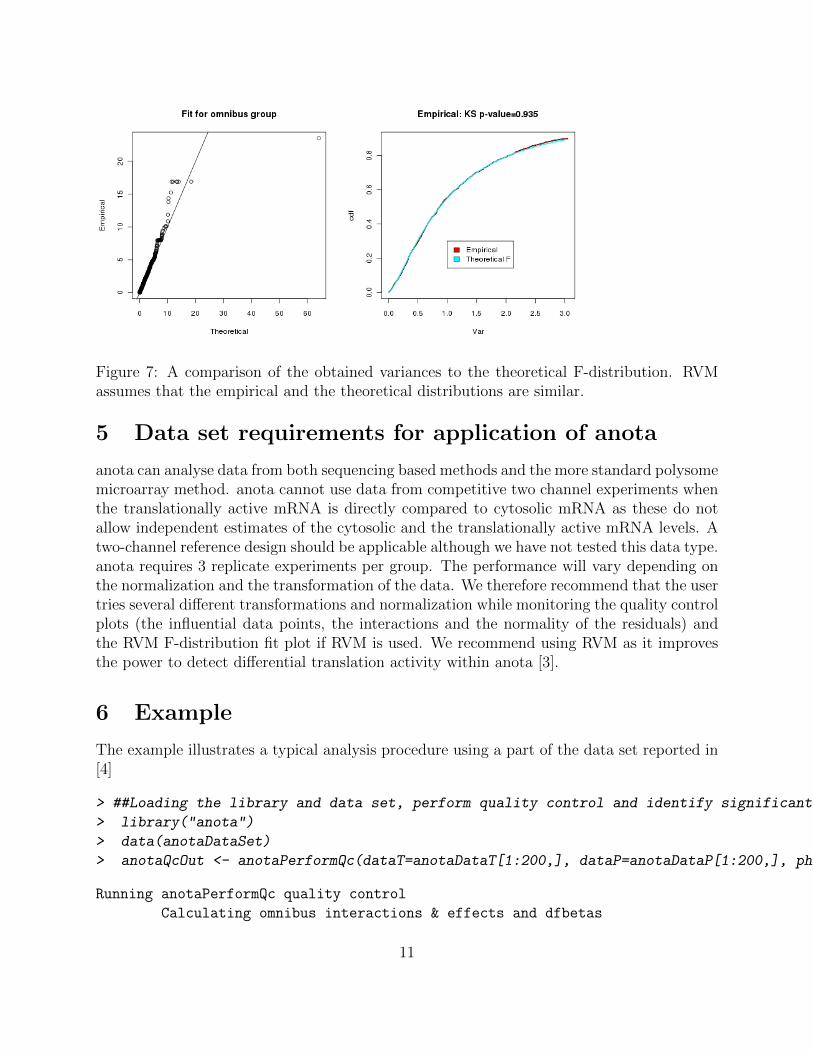
RVM is an empirical Bayes method which has been shown to increase statistical powerfor small N analysis [6]. In RVM, the within gene variance is adjusted using the varianceobtained from an inverse gamma distribution derived from the variances of all genes. A keyassumption in RVM is that the resulting variances follow a theoretical F-distribution. anotatest this for the analysis of omnibus interactions, omnibus group effects and the identificationof differential translational activity. Each of these analyses generates a comparison of theobtained empirical distribution compared to the theoretical distribution (similarity assessedusing a KS test which NULL hypothesis should not be rejected for a good fit). We havenoticed that the normalization of the data can strongly influence the fit but that RVM seemsto be applicable in most cases. It is necessary to validate that application of RVM does notinfluence the distribution of the interaction p-values. Figure 7 shows the output from thetest of the fit.
10
Figure 7: A comparison of the obtained variances to the theoretical F-distribution. RVMassumes that the empirical and the theoretical distributions are similar.
5 Data set requirements for application of anota
anota can analyse data from both sequencing based methods and the more standard polysomemicroarray method. anota cannot use data from competitive two channel experiments whenthe translationally active mRNA is directly compared to cytosolic mRNA as these do notallow independent estimates of the cytosolic and the translationally active mRNA levels. Atwo-channel reference design should be applicable although we have not tested this data type.anota requires 3 replicate experiments per group. The performance will vary depending onthe normalization and the transformation of the data. We therefore recommend that the usertries several different transformations and normalization while monitoring the quality controlplots (the influential data points, the interactions and the normality of the residuals) andthe RVM F-distribution fit plot if RVM is used. We recommend using RVM as it improvesthe power to detect differential translation activity within anota [3].
6 Example
The example illustrates a typical analysis procedure using a part of the data set reported in[4]
> ##Loading the library and data set, perform quality control and identify significant translational regulation. No RVM is applied in the example.
[1] Larsson, O. and Nadon, R. Gene expression: Time to change point of view? Biotech-nology and Genetic Engineering Reviews, 2008, 25 p77-92.
[2] Ingolia, NT et al. Genome-wide analysis in vivo of translation with nucleotide resolutionusing ribosome profiling. Science, 2009, 10;324(5924):218-23.
[3] Larsson, O. et al. Identification of differential translation in genome wide studies. PNAS,2010, 107;50:21487-21492.
[4] Larsson, O. et al. Fibrotic myofibroblasts manifest genome-wide derangements of trans-lational control. PLoS One, 2008, 3 (9) e3220.
12
[5] Venable, W.N. and Ripley, B.D. Modern applied statistics with S-PLUS. Springer, 1999.
[6] Writht, G.W. and Simon, R.M. A random variance model for detection of differentialgene expression in small microarray expeirments. Bioinformatics, 2003, 12;19(19):2448-55.