60
Analyst – Investor meeting London August 1, 2005

Analyst – Investor meeting
London August 1, 2005

First-half 2005 resultsA
BPB plcB
First-half 2005 results1
First-half 2005 results2
4 Outlook and targets forsecond-half 2005
First-half 2005 highlights
Operating performance infirst-half 2005
3
First-half 2005 highlights

Saint-Gobain in H1 2005: key figures
* average exchange rates for H1-2004
+10.9%642Net income, excluding capital gains
+13.9%632Net income
+10.5%+10.5%1,268Business income
+4.9%+4.6%1,372Operating income
+7.4%+7.0%16,877Net sales
ChangeH1-2005/H1-2004at constant
exchange rates*
ChangeH1-2005/H1-2004
€m
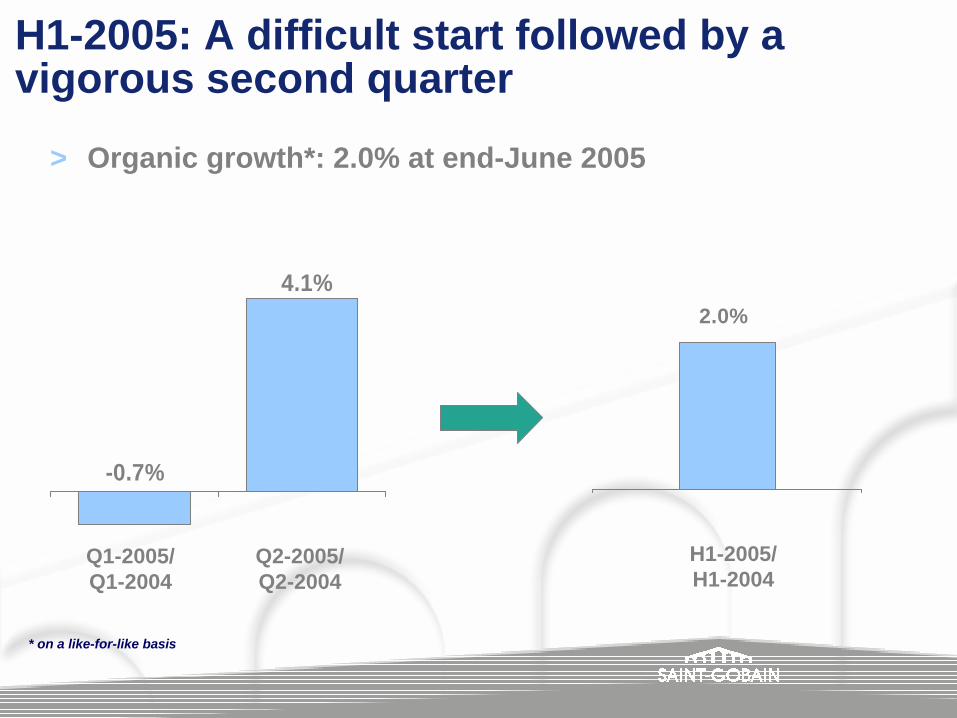
H1-2005: A difficult start followed by a vigorous second quarter
* on a like-for-like basis
> Organic growth*: 2.0% at end-June 2005
Q1-2005/Q1-2004
Q2-2005/Q2-2004
-0.7%
4.1%2.0%
H1-2005/H1-2004

H1-2005: A buoyant economic climate despite a harder-than-expected first quarterRising energy costs
Europe:> Stable manufacturing markets> Business in residential construction markets remained buoyant
in France, Scandinavia, Spain and Portugal
US:> Satisfactory industrial growth> Strong household demand (consumption and housing)
Emerging countries and Asia:> Robust growth in the Group's main markets > Adverse impact of bad weather on first-quarter 2005 results in
Eastern Europe
Operations launched since start-2005
> Further acquisitions: around 30 transactions bringingonboard more than €1bn in full-year sales
> Disposals: concrete products (Stradal), glass bricks, Ibiden JV
> Expansion in Asia and emerging countries▪ Various capital investments in Russia, Eastern
Europe and China▪ Acquisition of a controlling interest in Hankuk Glass
Industries (Korea)
First-half 2005 results
2. First-half 2005 results
A. Group
B. Update on asbestos-relatedclaims in the United States
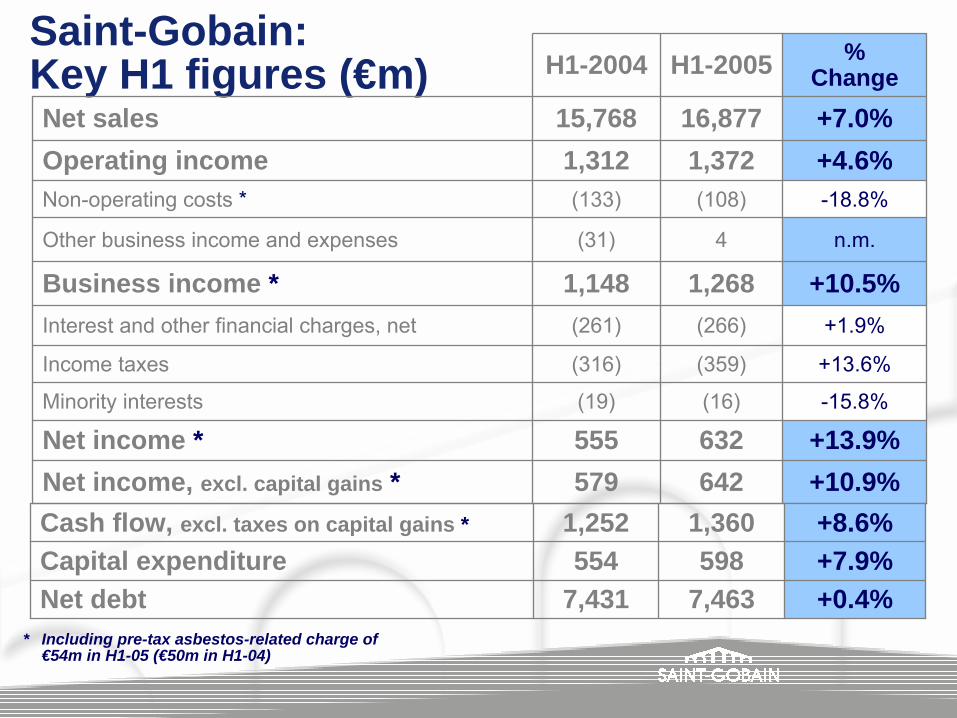
Saint-Gobain: Key H1 figures (€m)
n.m.4(31)Other business income and expenses
-18.8%(108)(133)Non-operating costs *
+10.9%642579Net income, excl. capital gains *+13.9%632555Net income *-15.8%(16)(19)Minority interests
+13.6%(359)(316)Income taxes
+1.9%(266)(261)Interest and other financial charges, net
+10.5%1,2681,148Business income *
+4.6%1,3721,312Operating income+7.0%16,87715,768Net sales
% ChangeH1-2005H1-2004
* Including pre-tax asbestos-related charge of €54m in H1-05 (€50m in H1-04)
+0.4%7,4637,431Net debt+7.9%598554Capital expenditure+8.6%1,3601,252Cash flow, excl. taxes on capital gains *
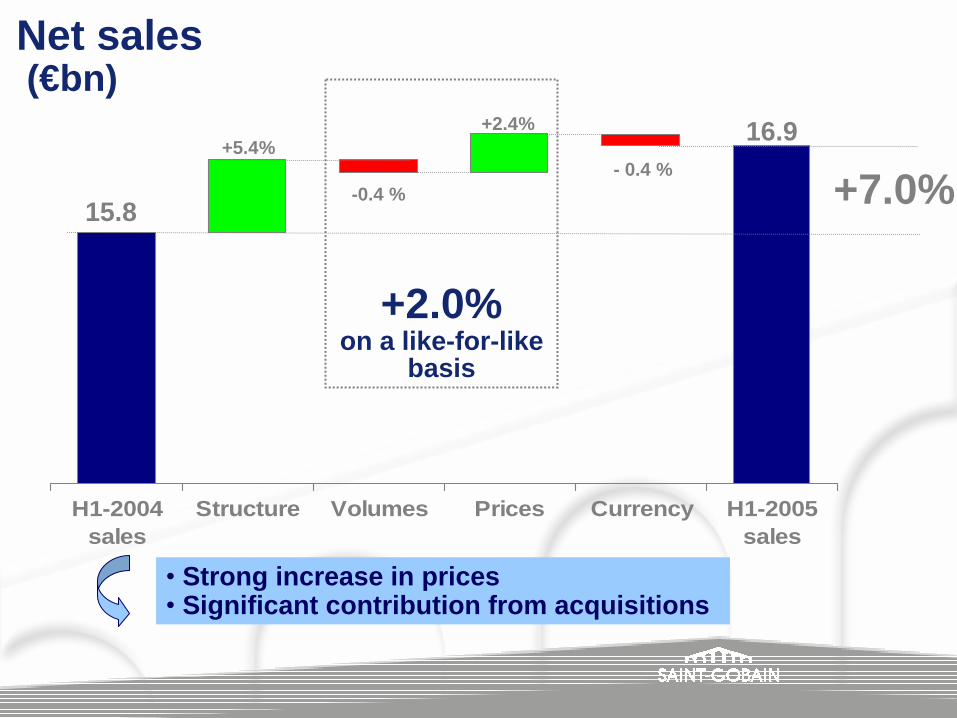
H1-2004sales
Structure Volumes Prices Currency H1-2005sales
+2.0%on a like-for-like
basis
Net sales(€bn)
+7.0%15.8
+5.4%+2.4%
- 0.4 %-0.4 %
16.9
• Strong increase in prices• Significant contribution from acquisitions
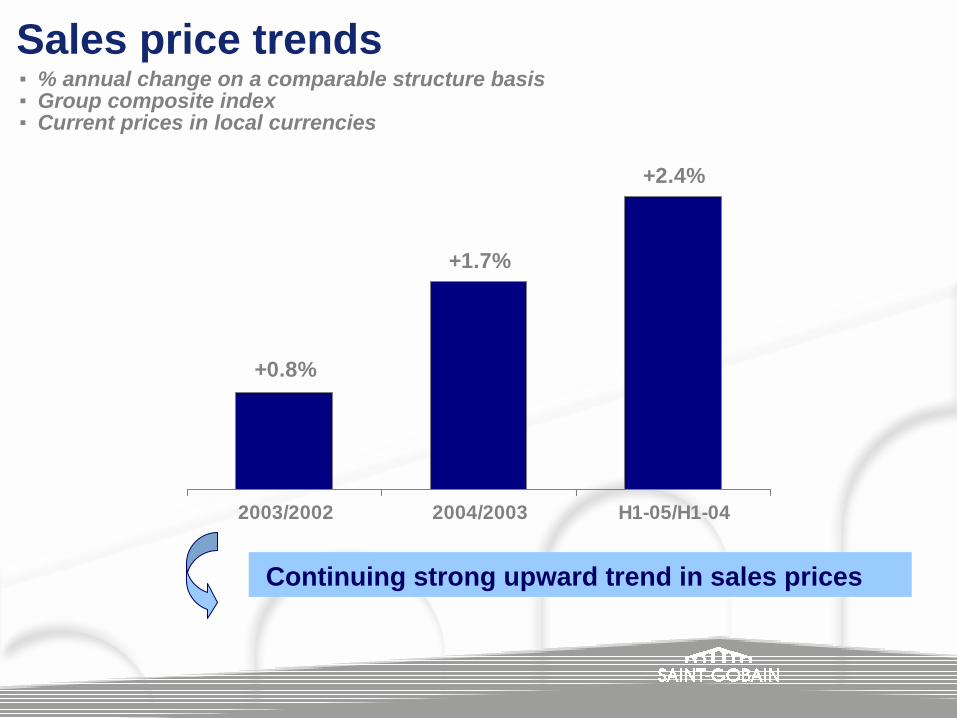
▪ % annual change on a comparable structure basis▪ Group composite index▪ Current prices in local currencies
Sales price trends
+2.4%
+1.7%
+0.8%
2003/2002 2004/2003 H1-05/H1-04
Continuing strong upward trend in sales prices
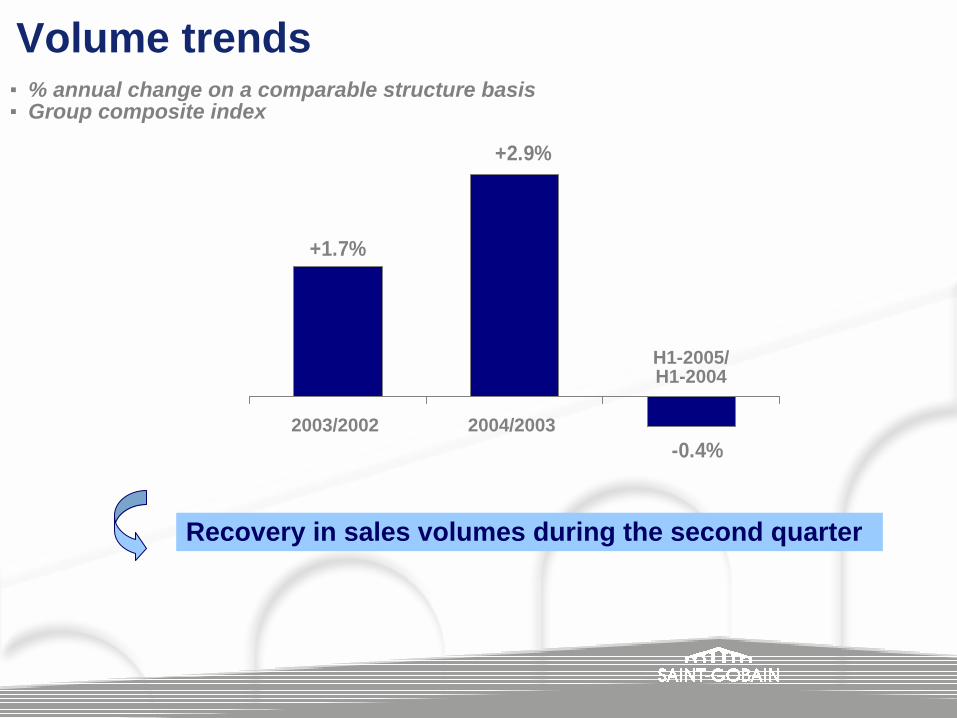
-0.4%
+2.9%
+1.7%
2003/2002 2004/2003
H1-2005/H1-2004
Volume trends
Recovery in sales volumes during the second quarter
▪ % annual change on a comparable structure basis▪ Group composite index
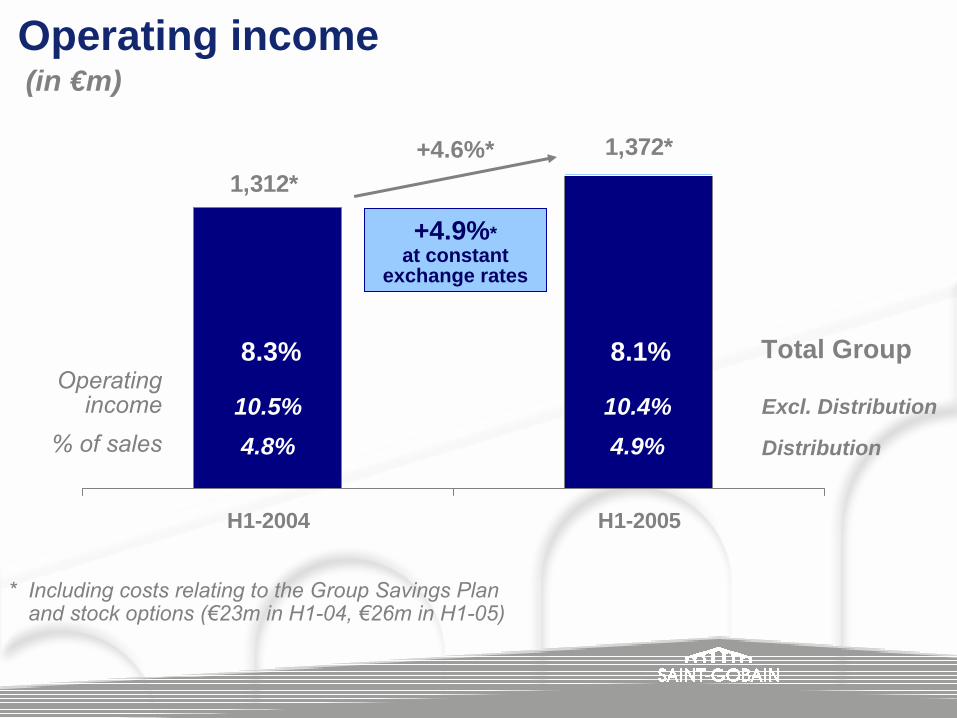
(in €m)Operating income
1,372*1,312*
H1-2004 H1-2005
+4.6%*
+4.9%*at constant
exchange rates
8.3%
10.5% Excl. Distribution
Total Group8.1%
10.4%4.8% Distribution4.9%
Operating income
% of sales
* Including costs relating to the Group Savings Plan and stock options (€23m in H1-04, €26m in H1-05)
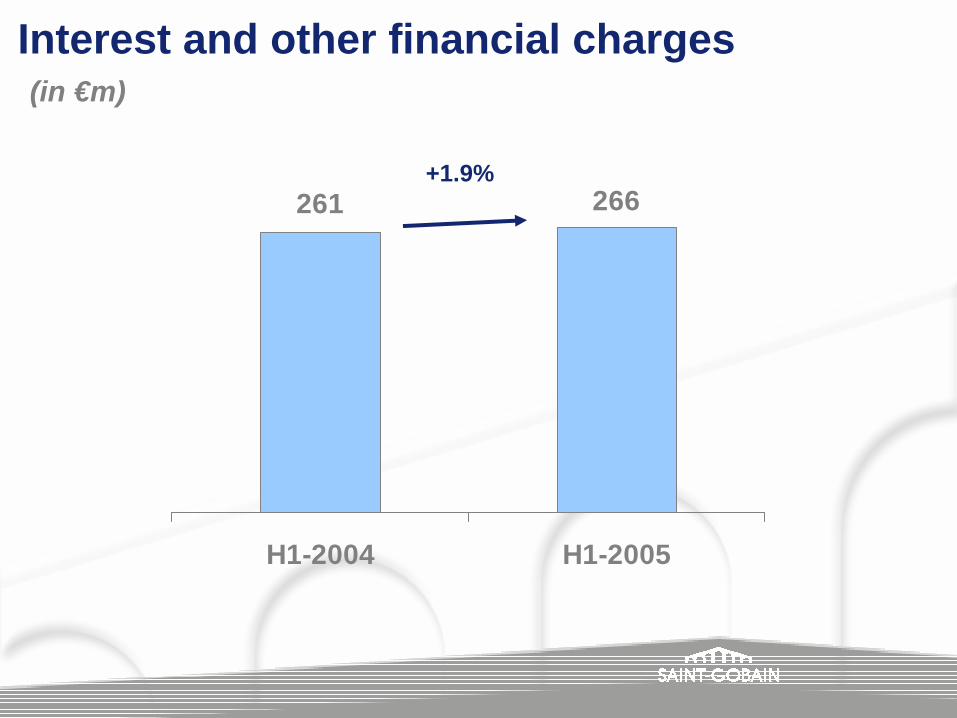
Interest and other financial charges
266261
H1-2004 H1-2005
+1.9%
(in €m)
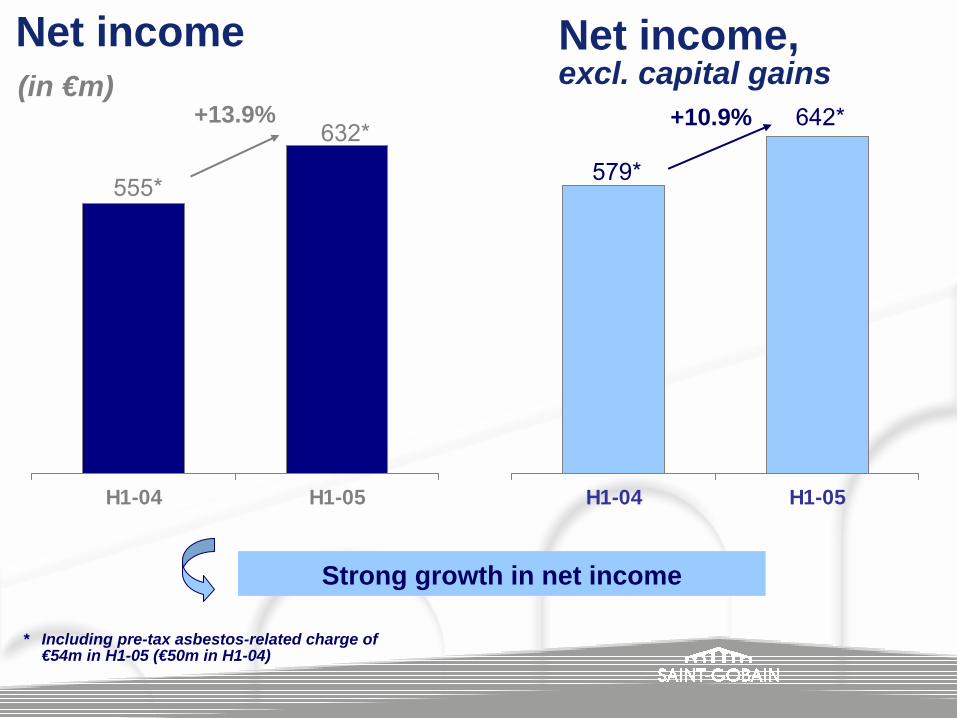
Net income(in €m)
Strong growth in net income
H1-04 H1-05
+13.9%
555*
632*
H1-04 H1-05
579*
+10.9% 642*
Net income, excl. capital gains
* Including pre-tax asbestos-related charge of €54m in H1-05 (€50m in H1-04)
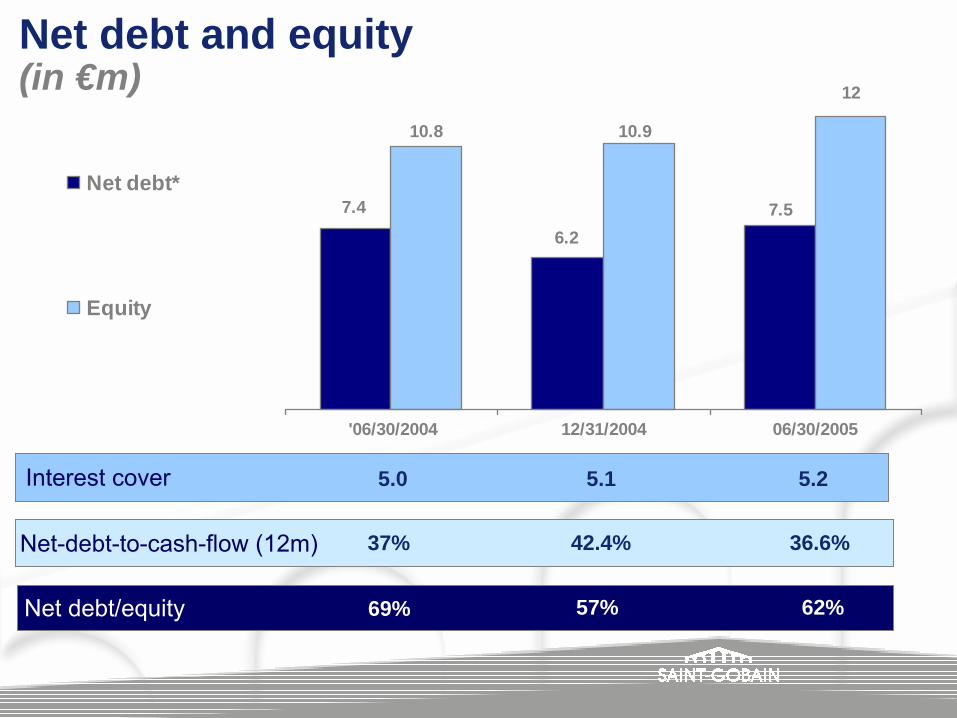
Net debt and equity(in €m)
7.4
6.27.5
10.8 10.9
12
'06/30/2004 12/31/2004 06/30/2005
Net debt*
Equity
Interest cover 5.0 5.1 5.2
Net debt/equity 69% 57% 62%
Net-debt-to-cash-flow (12m) 42.4% 36.6%37%
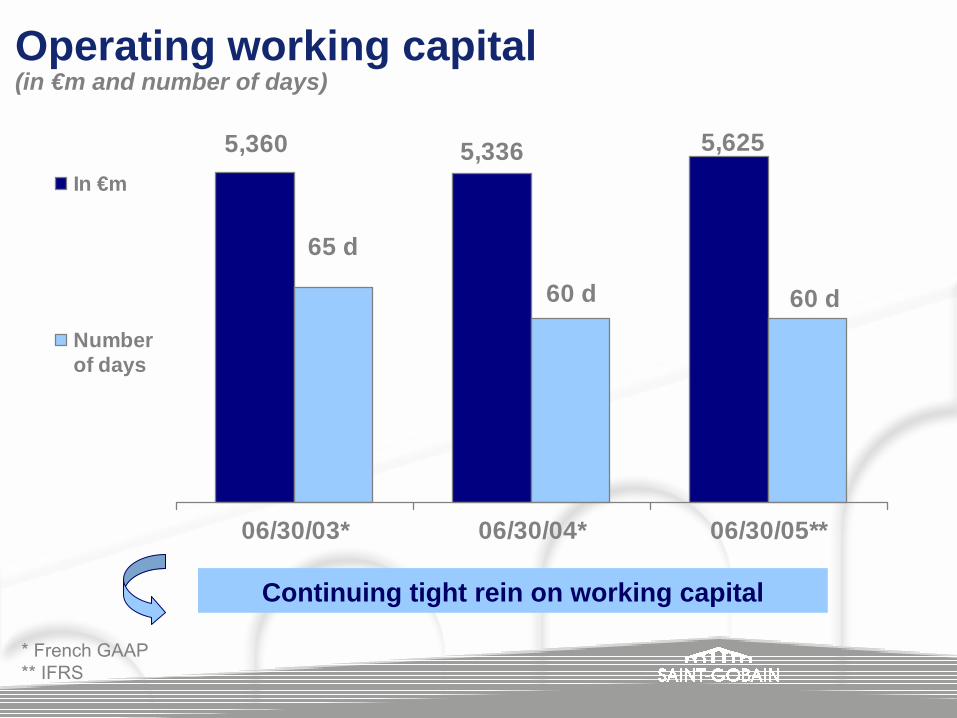
5,6255,3365,360
60 d60 d
65 d
06/30/03* 06/30/04* 06/30/05**
In €m
Numberof days
Operating working capital(in €m and number of days)
Continuing tight rein on working capital
* French GAAP** IFRS
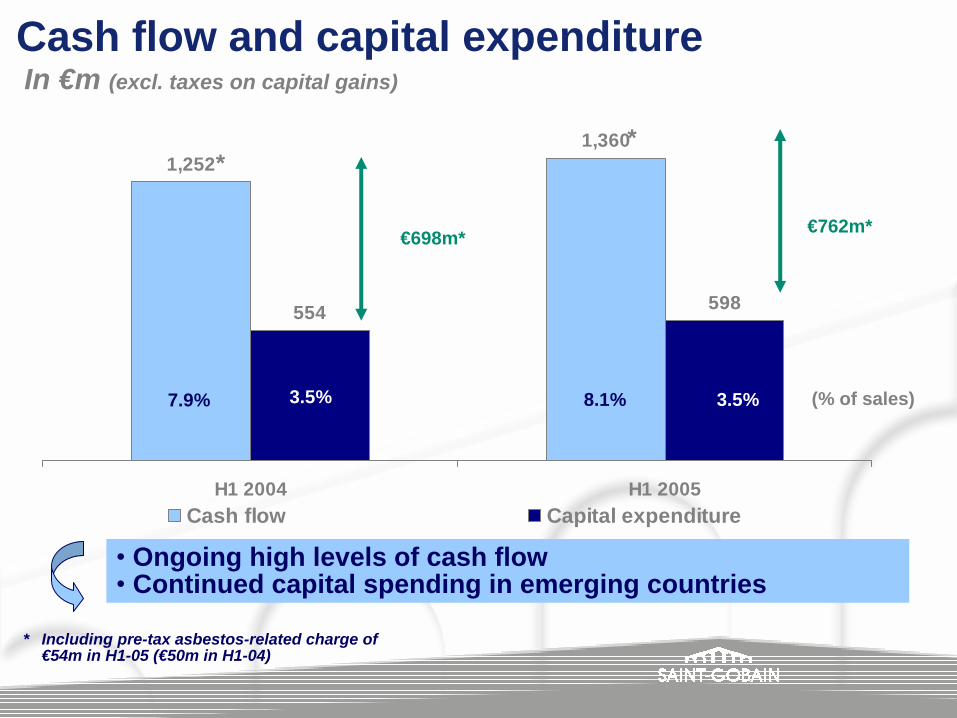
In €m (excl. taxes on capital gains)
Cash flow and capital expenditure
1,3601,252
598554
H1 2004 H1 2005Cash flow Capital expenditure
• Ongoing high levels of cash flow• Continued capital spending in emerging countries
7.9% (% of sales)3.5%
€698m*
8.1%
€762m*
3.5%
* Including pre-tax asbestos-related charge of €54m in H1-05 (€50m in H1-04)
**
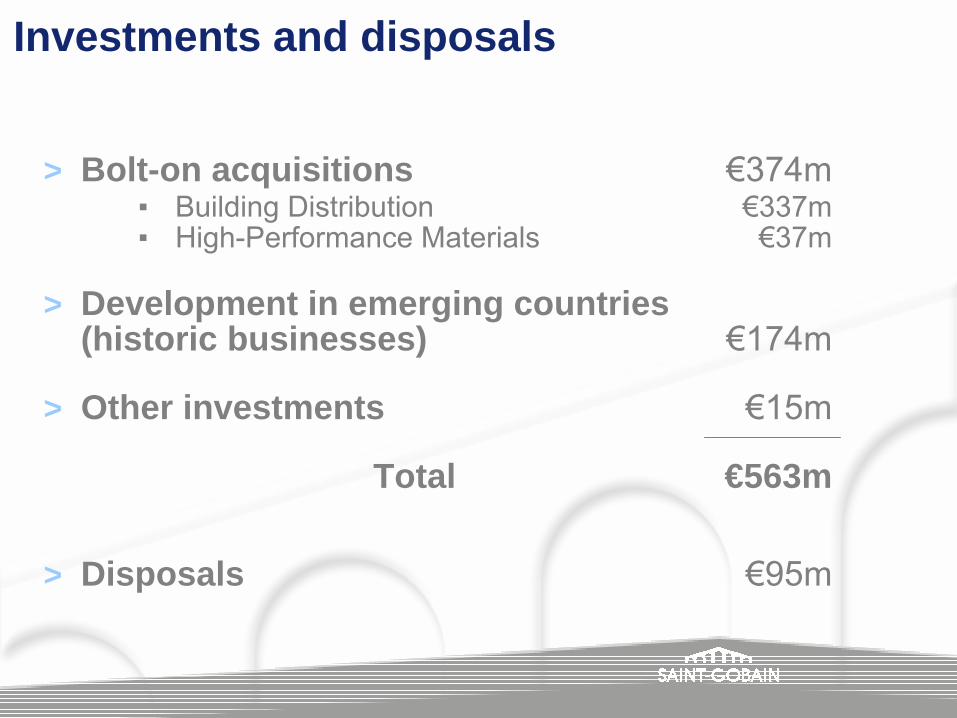
Investments and disposals
> Bolt-on acquisitions €374m▪ Building Distribution €337m▪ High-Performance Materials €37m
> Development in emerging countries(historic businesses) €174m
> Other investments €15m
Total €563m
> Disposals €95m
2. First-half 2005 results
A. Group
B. Update on asbestos-relatedclaims in the United States
Update on asbestos-related claims againstCertainTeed in the United States
> First-half 2005 litigation trends
> Current status of US asbestos legislation
Asbestos-related litigation against CertainTeed in the US
4
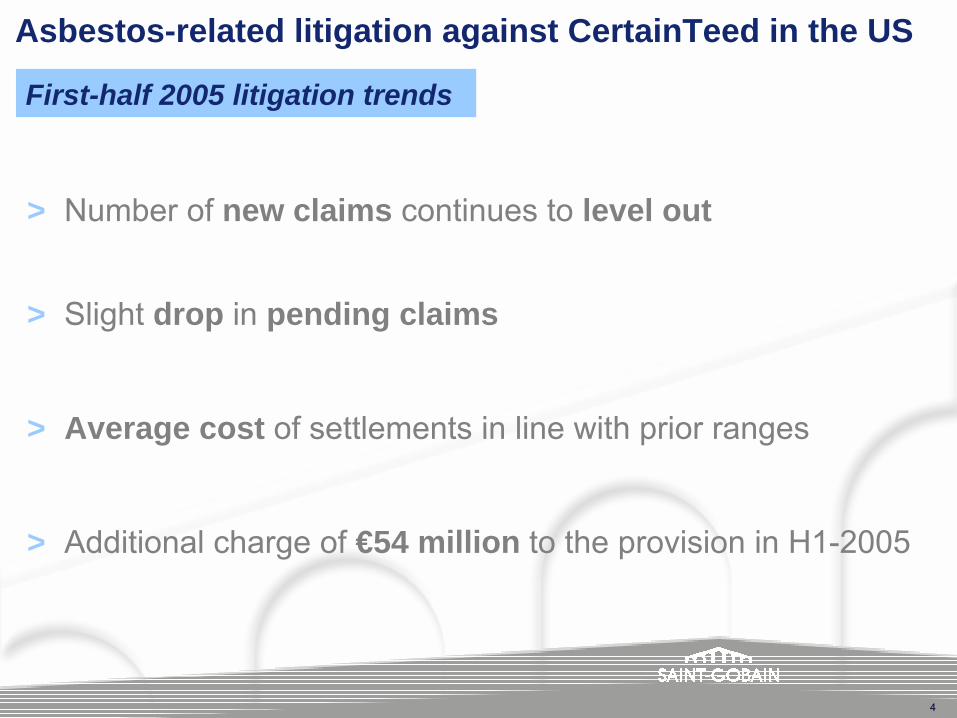
First-half 2005 litigation trends
> Number of new claims continues to level out
> Slight drop in pending claims
> Average cost of settlements in line with prior ranges
> Additional charge of €54 million to the provision in H1-2005
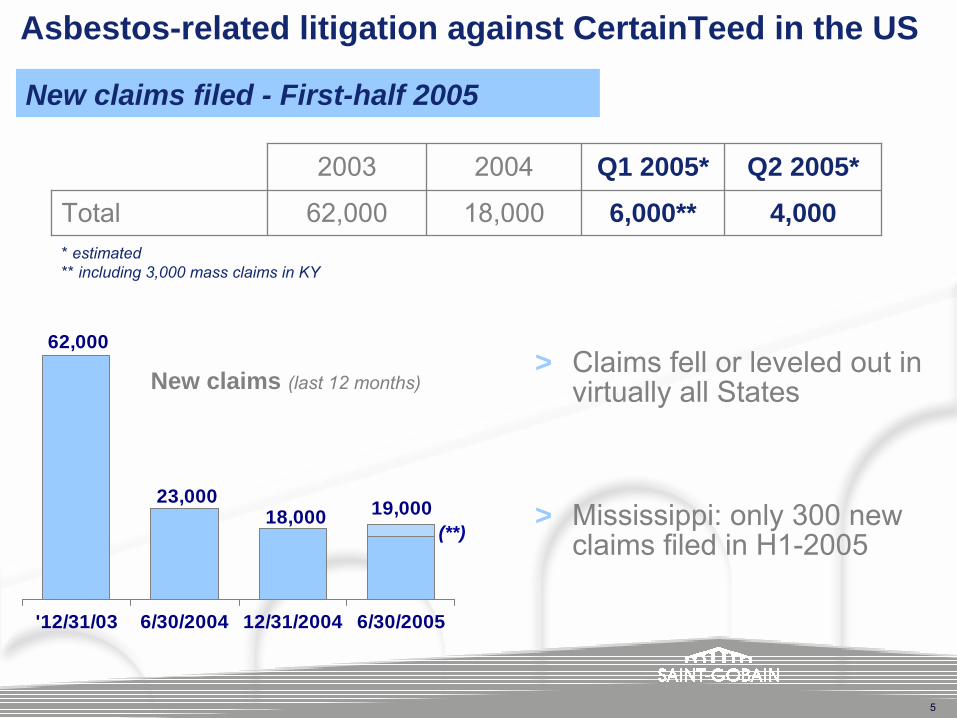
19,00018,000
62,000
23,000
'12/31/03 6/30/2004 12/31/2004 6/30/2005
New claims (last 12 months)
(**)
5
4,0006,000**18,00062,000Total
Q2 2005*Q1 2005*20042003
Asbestos-related litigation against CertainTeed in the US
New claims filed - First-half 2005
* estimated ** including 3,000 mass claims in KY
> Claims fell or leveled out in virtually all States
> Mississippi: only 300 new claims filed in H1-2005
6
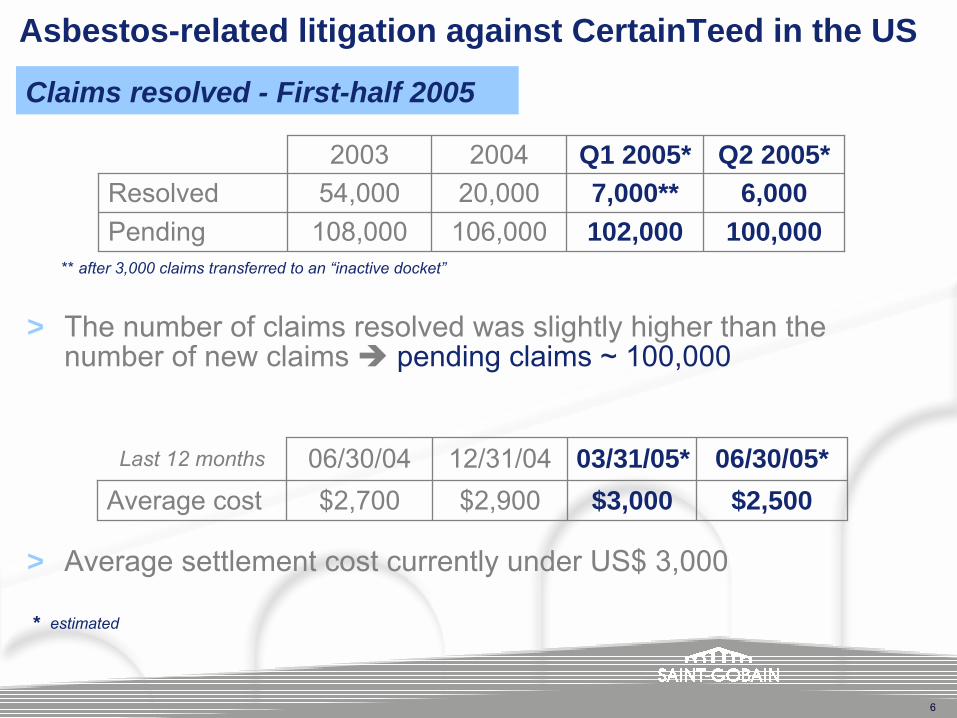
Asbestos-related litigation against CertainTeed in the US
100,000102,000106,000108,000Pending6,0007,000**20,00054,000Resolved
Q2 2005*Q1 2005*20042003
Claims resolved - First-half 2005
> The number of claims resolved was slightly higher than the number of new claims pending claims ~ 100,000
> Average settlement cost currently under US$ 3,000
$2,500$3,000$2,900$2,700Average cost06/30/05*03/31/05*12/31/0406/30/04Last 12 months
** after 3,000 claims transferred to an “inactive docket”
* estimated
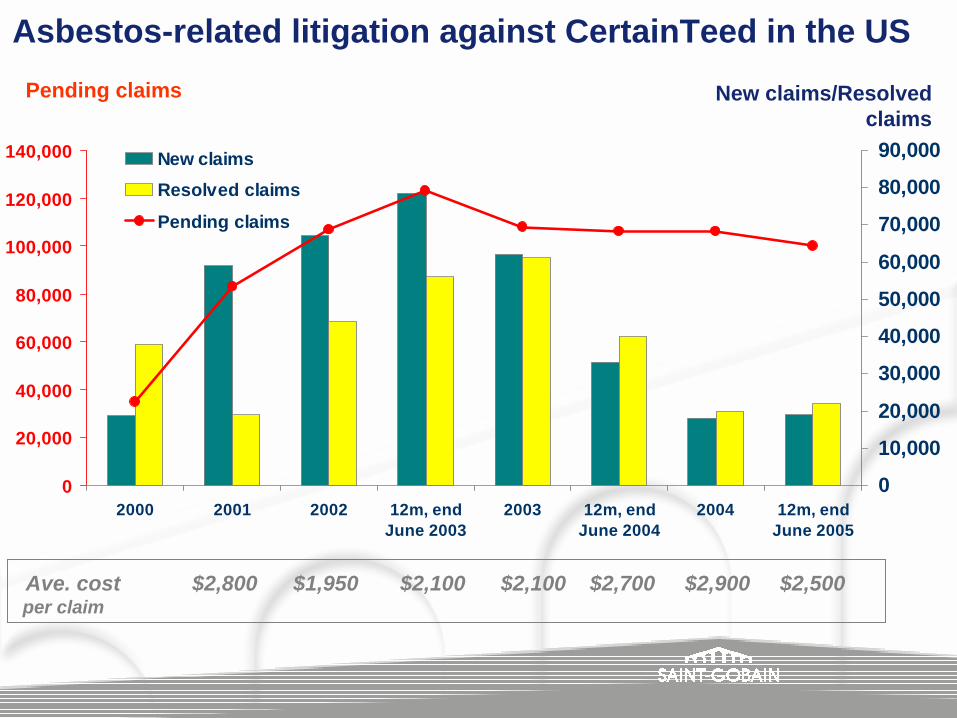
0
20,000
40,000
60,000
80,000
100,000
120,000
140,000
2000 2001 2002 12m, endJune 2003
2003 12m, endJune 2004
2004 12m, endJune 2005
0
10,000
20,000
30,000
40,000
50,000
60,000
70,000
80,000
90,000New claimsResolved claims
Pending claims
Pending claims New claims/Resolved claims
Ave. cost $2,800 $1,950 $2,100 $2,100 $2,700 $2,900 $2,500per claim
Asbestos-related litigation against CertainTeed in the US
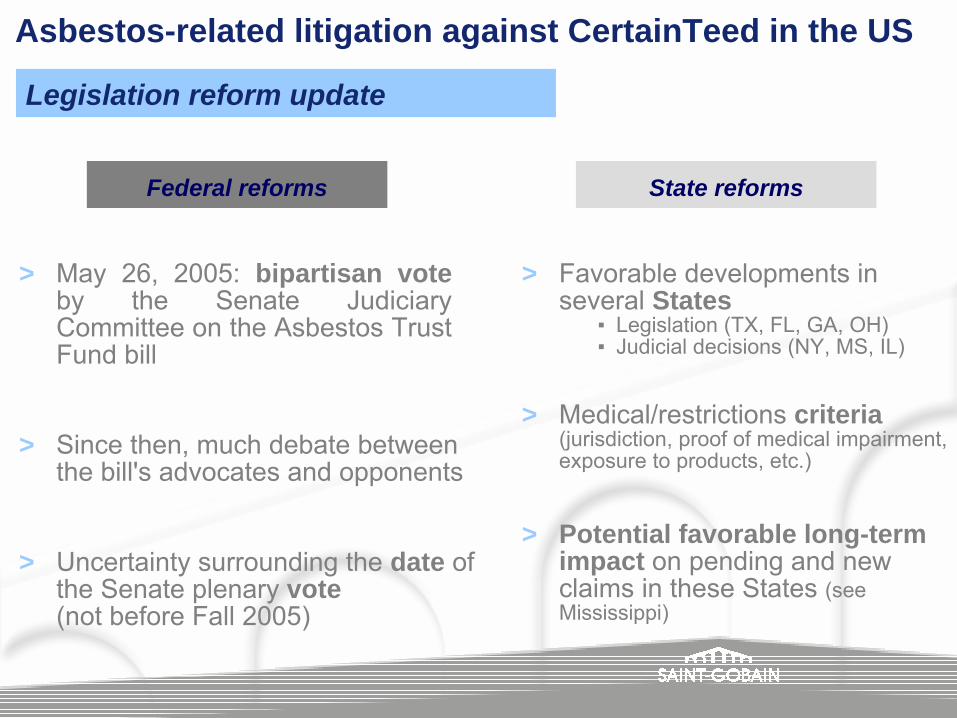
Asbestos-related litigation against CertainTeed in the US
Legislation reform update
> May 26, 2005: bipartisan voteby the Senate Judiciary Committee on the Asbestos Trust Fund bill
> Since then, much debate between the bill's advocates and opponents
> Uncertainty surrounding the date of the Senate plenary vote(not before Fall 2005)
Federal reforms
> Favorable developments in several States
▪ Legislation (TX, FL, GA, OH)▪ Judicial decisions (NY, MS, IL)
> Medical/restrictions criteria(jurisdiction, proof of medical impairment, exposure to products, etc.)
State reforms
> Potential favorable long-term impact on pending and new claims in these States (seeMississippi)
Operating performancein first-half 2005
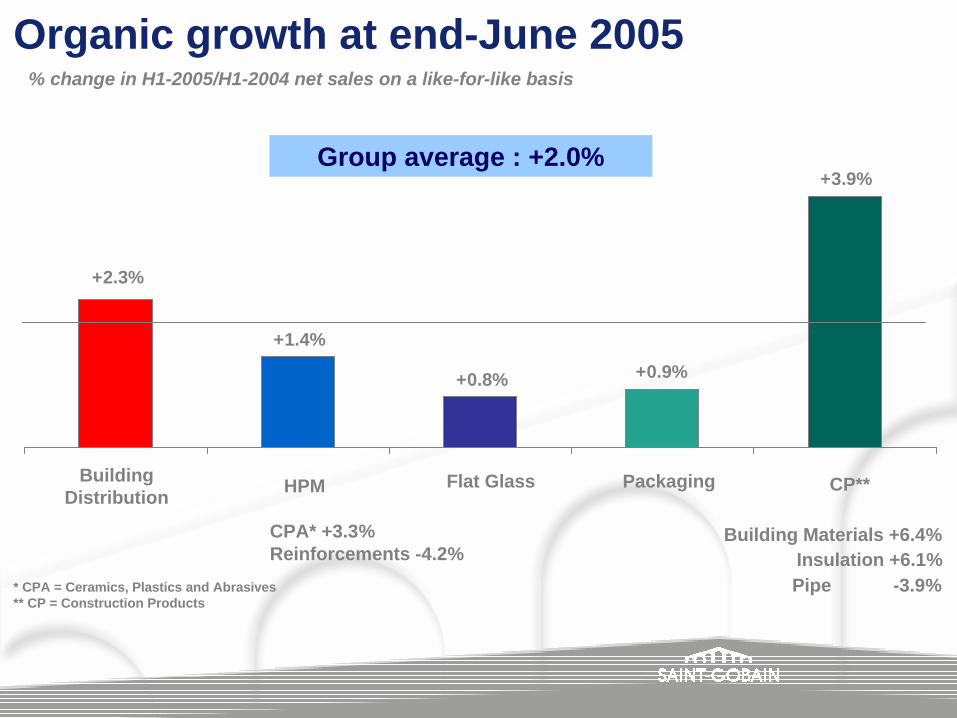
Organic growth at end-June 2005
+0.8%
+1.4%
+2.3%
+3.9%
+0.9%
Flat Glass
Insulation +6.1%
Packaging
CPA* +3.3% Building Materials +6.4%
Building Distribution
Pipe -3.9%
% change in H1-2005/H1-2004 net sales on a like-for-like basis
Reinforcements -4.2%
Group average : +2.0%
CP**HPM
* CPA = Ceramics, Plastics and Abrasives** CP = Construction Products
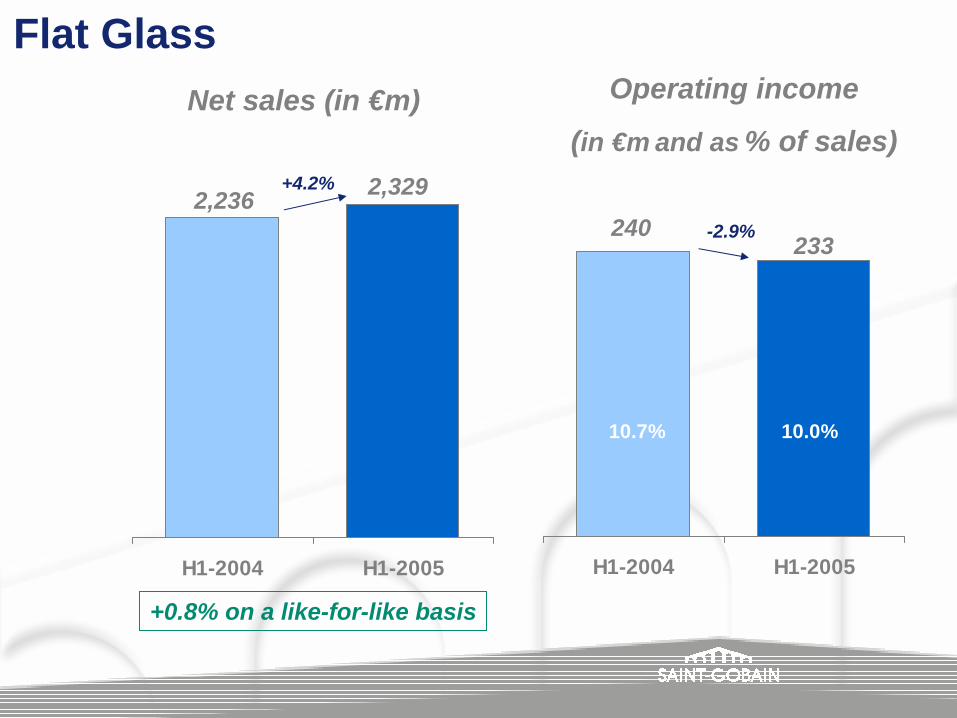
Flat GlassNet sales (in €m)
H1-2004 H1-2005
Operating income
(in €m and as % of sales)
+0.8% on a like-for-like basis
2,236
H1-2004 H1-2005
+4.2%
-2.9%
2,329
240233
10.7% 10.0%
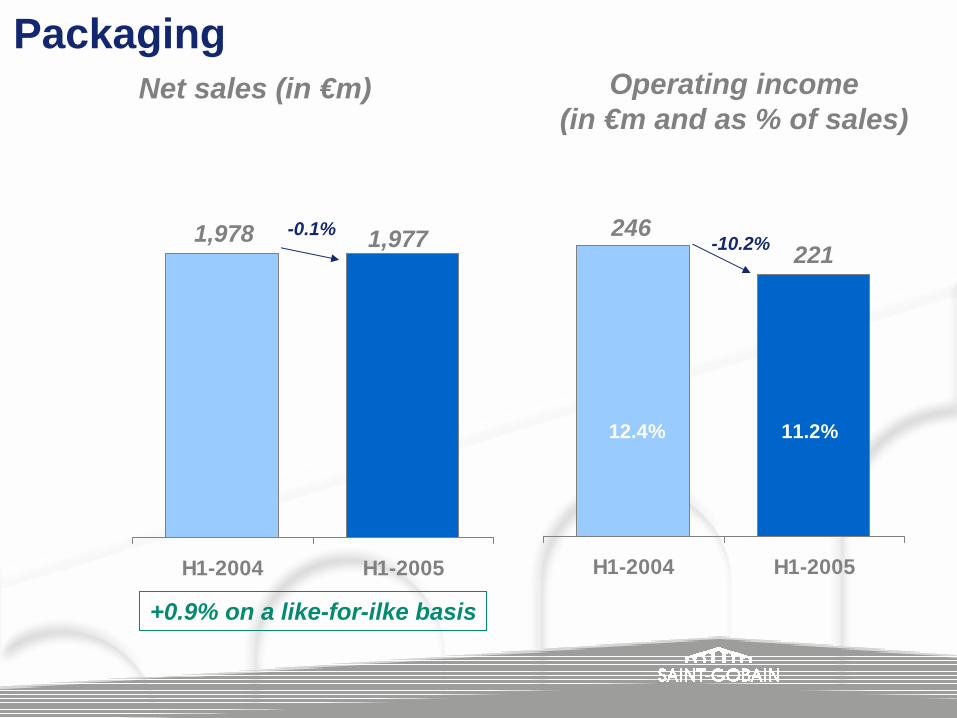
PackagingNet sales (in €m)
H1-2004 H1-2005
Operating income(in €m and as % of sales)
+0.9% on a like-for-ilke basis
H1-2004 H1-2005
-0.1%-10.2%1,978 1,977 246
221
12.4% 11.2%
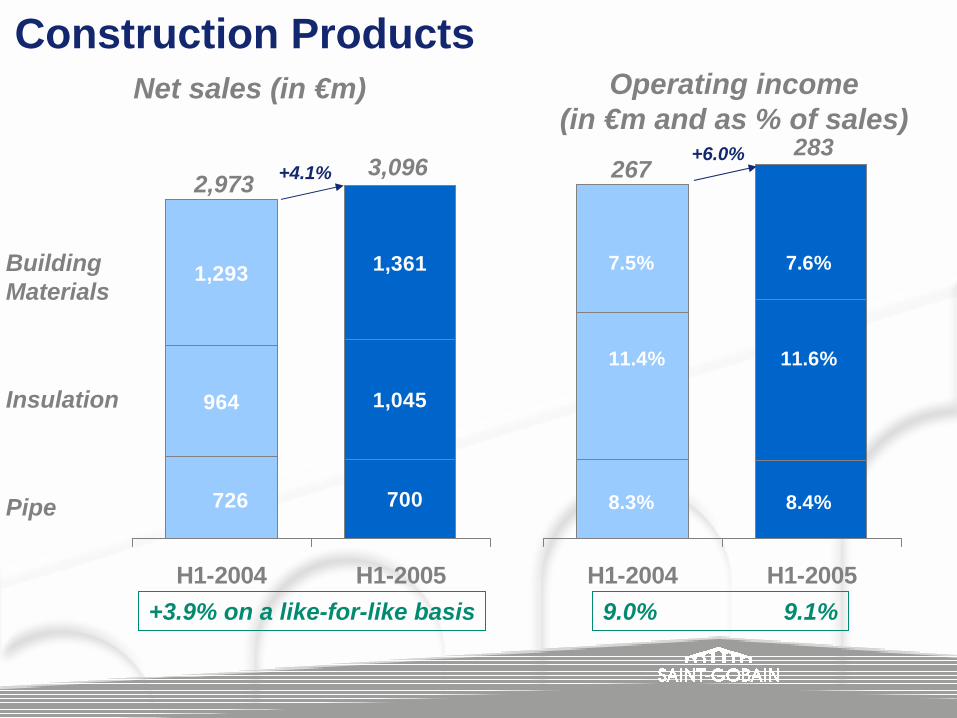
Construction ProductsNet sales (in €m)
964
700726
1,045
1,3611,293
H1-2004 H1-2005
Operating income(in €m and as % of sales)
+3.9% on a like-for-like basis
BuildingMaterials
Insulation
Pipe
H1-2004 H1-2005
7.5% 7.6%
11.4% 11.6%
8.3% 8.4%
9.0% 9.1%
+4.1%+6.0%
2,9733,096 267
283
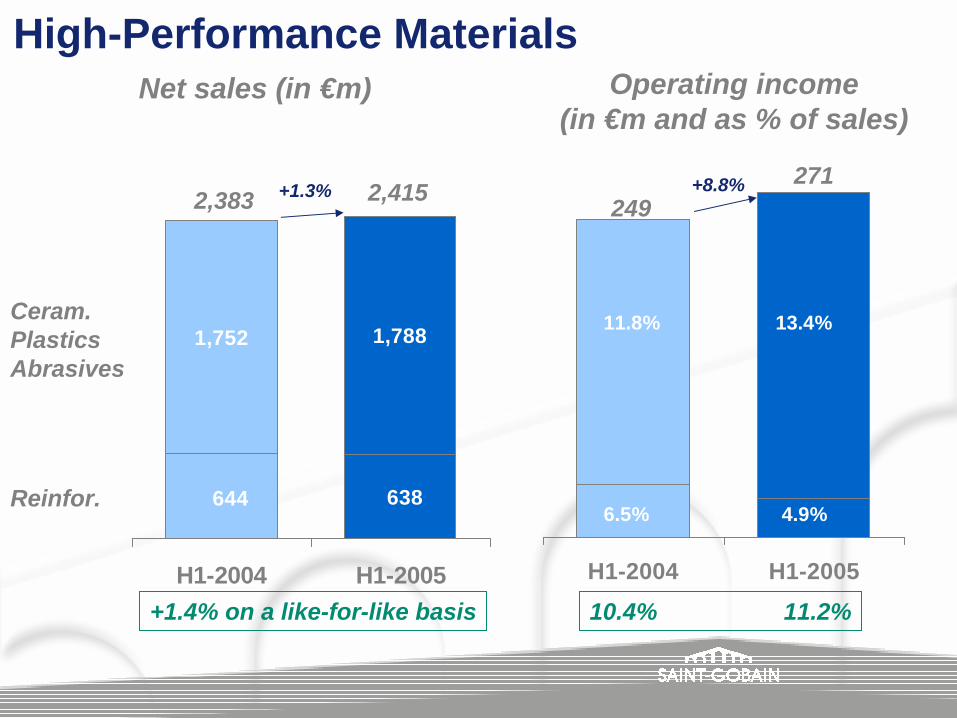
High-Performance MaterialsNet sales (in €m)
644 638
1,7881,752
H1-2004 H1-2005
Operating income(in €m and as % of sales)
+1.4% on a like-for-like basisH1-2004 H1-2005
Ceram.PlasticsAbrasives
Reinfor.
11.8% 13.4%
6.5% 4.9%
10.4% 11.2%
+1.3% +8.8%2,383 2,415 249
271
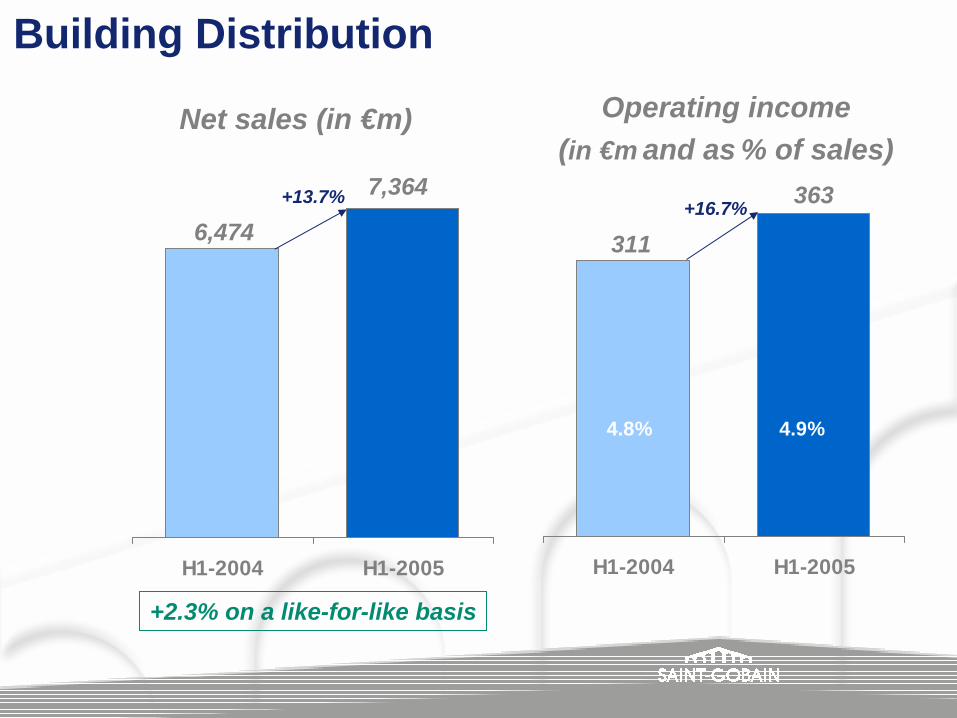
Building Distribution
H1-2004 H1-2005
+2.3% on a like-for-like basis
H1-2004 H1-2005
+13.7% +16.7%6,474
7,364
311
363
Net sales (in €m) Operating income(in €m and as % of sales)
4.8% 4.9%
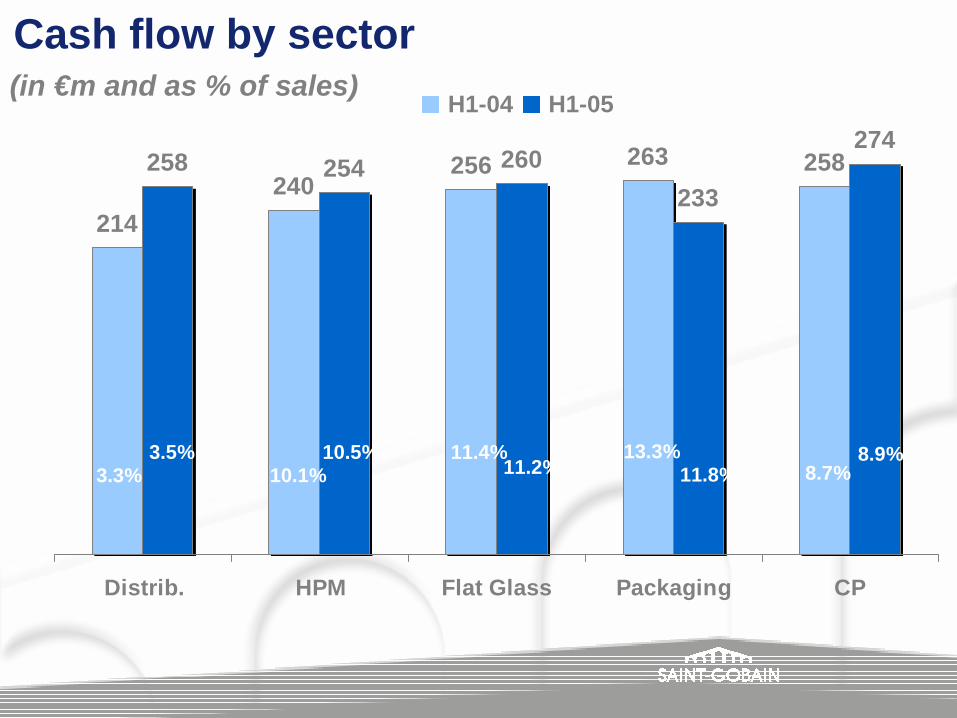
Cash flow by sector
256 258258 254 260233
274263240
214
Distrib. HPM Flat Glass Packaging CP
3.3%3.5%
10.1%10.5%
H1-04 H1-05(in €m and as % of sales)
11.4%11.2%
13.3%11.8%
8.9%8.7%
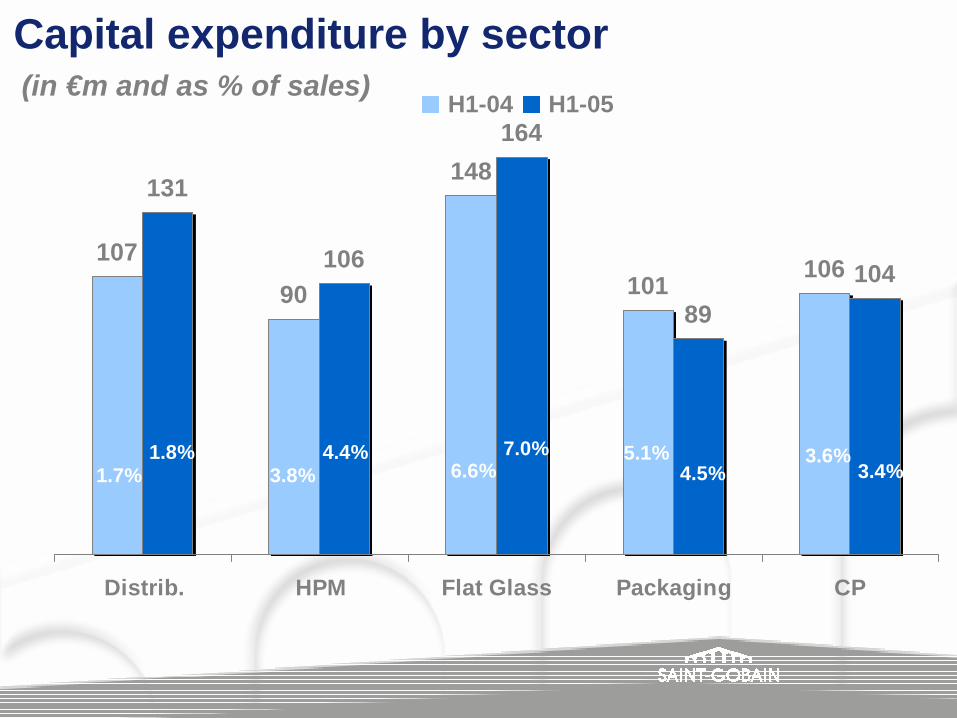
106101
148
90107
10489
164
106
131
Distrib. HPM Flat Glass Packaging CP
1.7%1.8%
3.8%4.4%
6.6%7.0% 5.1%
4.5% 3.4%3.6%
Capital expenditure by sectorH1-04 H1-05
(in €m and as % of sales)
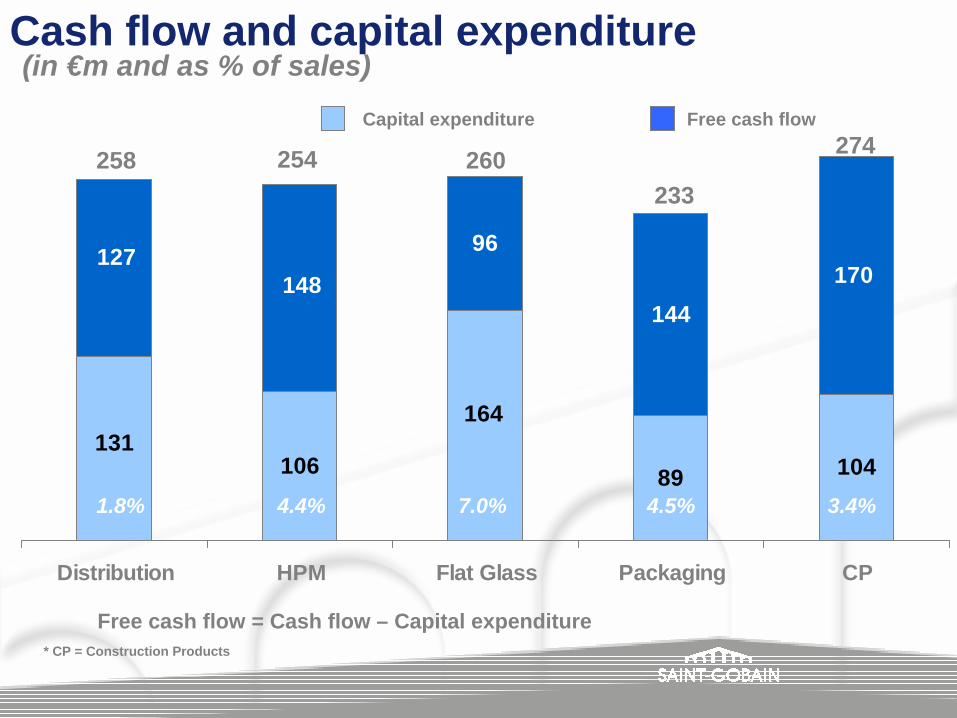
106 89 104
96
144
131164
127148 170
Distribution HPM Flat Glass Packaging CP
Cash flow and capital expenditure
Free cash flowCapital expenditure
Free cash flow = Cash flow – Capital expenditure
1.8% 4.4% 7.0% 4.5% 3.4%
258 254 260233
274
* CP = Construction Products
(in €m and as % of sales)
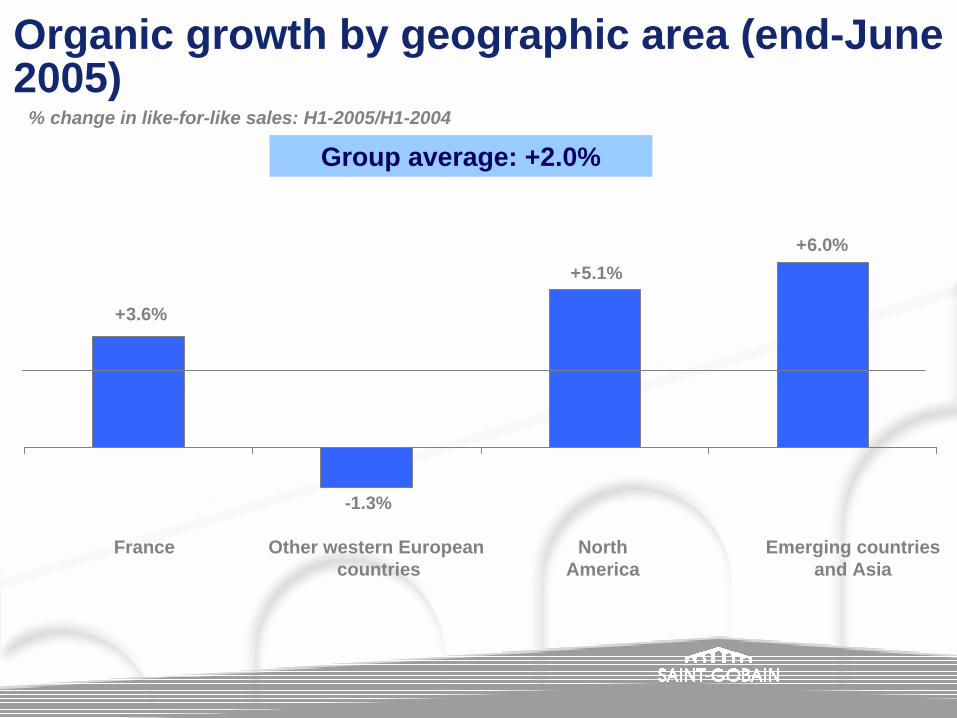
Organic growth by geographic area (end-June2005)
+5.1%
-1.3%
+3.6%
+6.0%
NorthAmerica
Emerging countriesand Asia
France
% change in like-for-like sales: H1-2005/H1-2004
Group average: +2.0%
Other western Europeancountries
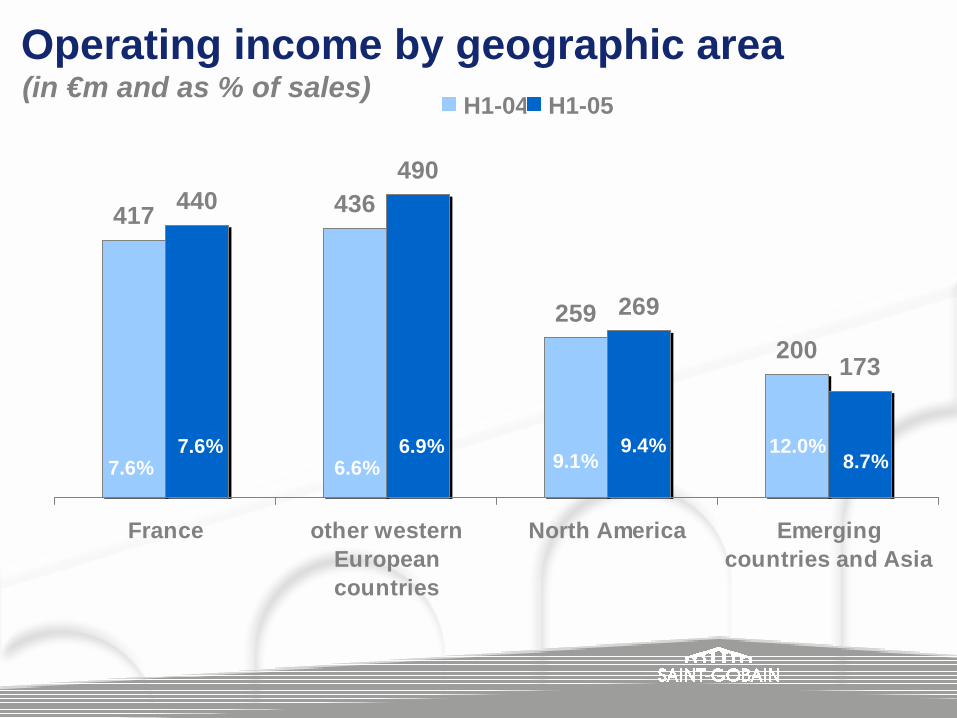
Operating income by geographic area
417 436
259200
440490
269
173
France other westernEuropeancountries
North America Emergingcountries and Asia
7.6%7.6%
6.6%6.9%
H1-04 H1-05(in €m and as % of sales)
9.1%9.4%
8.7%12.0%
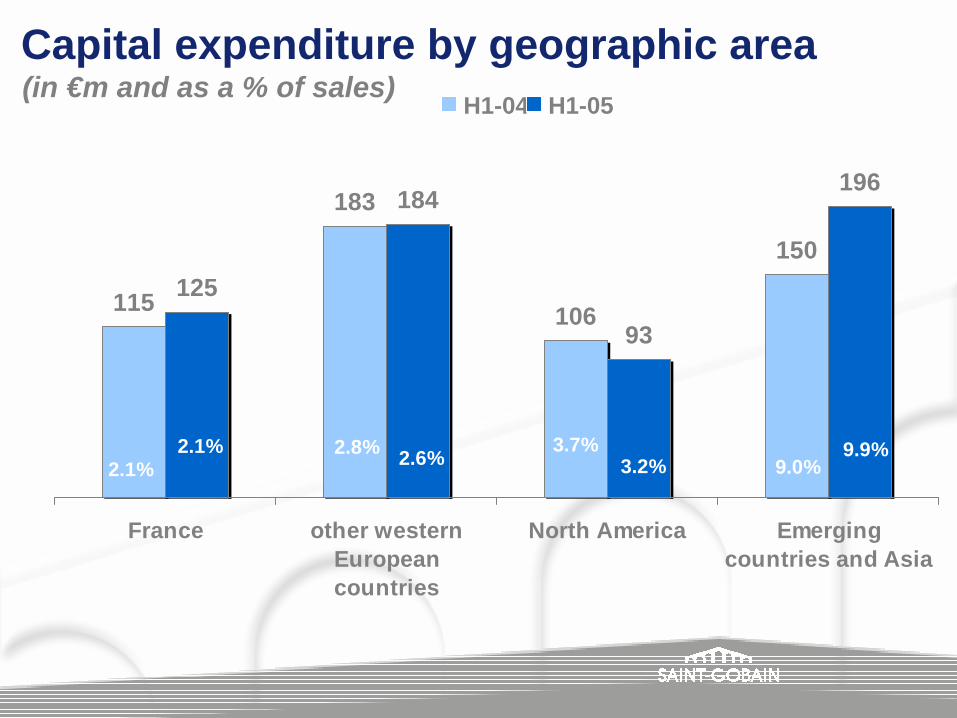
Capital expenditure by geographic area
115
183
106
150125
184
93
196
France other westernEuropeancountries
North America Emergingcountries and Asia
2.1%2.1% 2.8% 2.6%
H1-04 H1-05(in €m and as a % of sales)
3.7%3.2%
9.9%9.0%
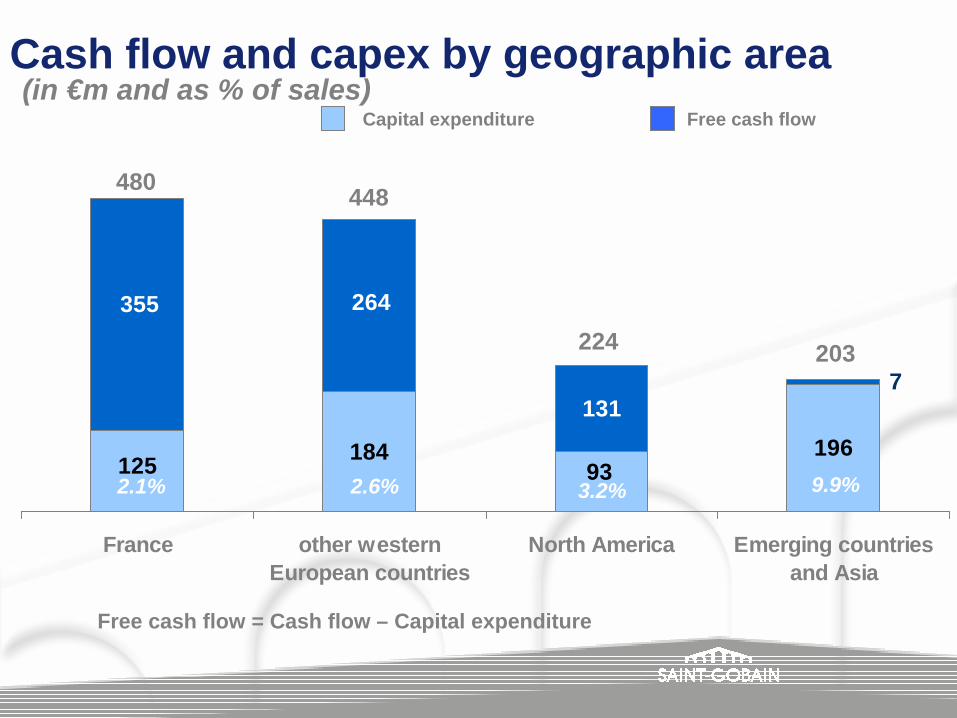
184 196131
125 93
7
355 264
France other westernEuropean countries
North America Emerging countriesand Asia
Cash flow and capex by geographic areaFree cash flowCapital expenditure
Free cash flow = Cash flow – Capital expenditure
2.1% 2.6% 3.2% 9.9%
480 448
224 203
(in €m and as % of sales)
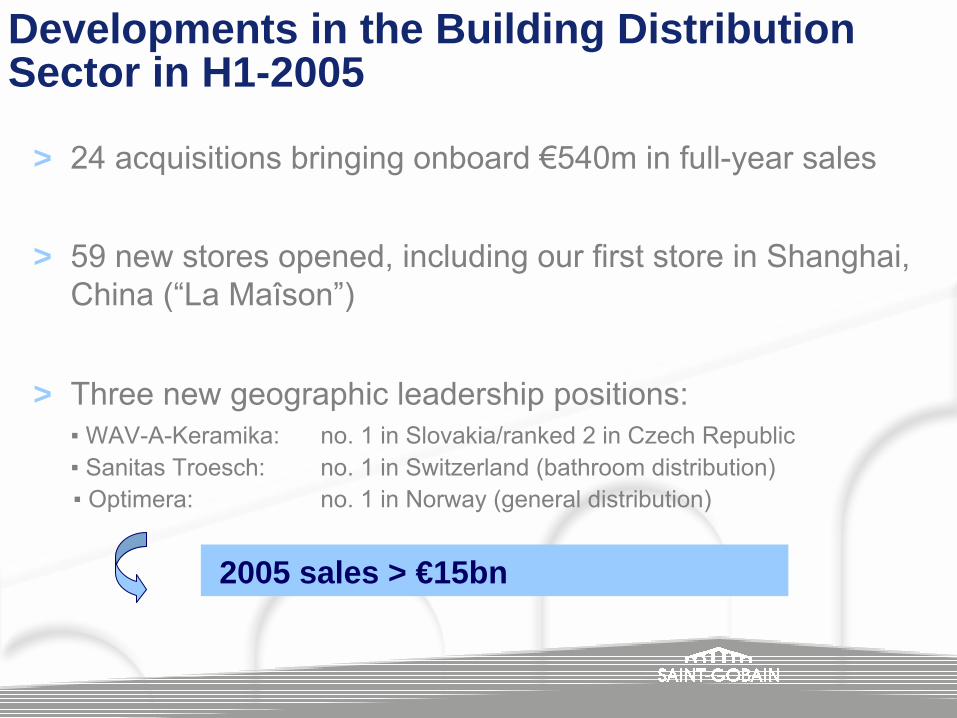
> 24 acquisitions bringing onboard €540m in full-year sales
> 59 new stores opened, including our first store in Shanghai, China (“La Maîson”)
> Three new geographic leadership positions:▪ WAV-A-Keramika: no. 1 in Slovakia/ranked 2 in Czech Republic▪ Sanitas Troesch: no. 1 in Switzerland (bathroom distribution)▪ Optimera: no. 1 in Norway (general distribution)
Developments in the Building Distribution Sector in H1-2005
2005 sales > €15bn
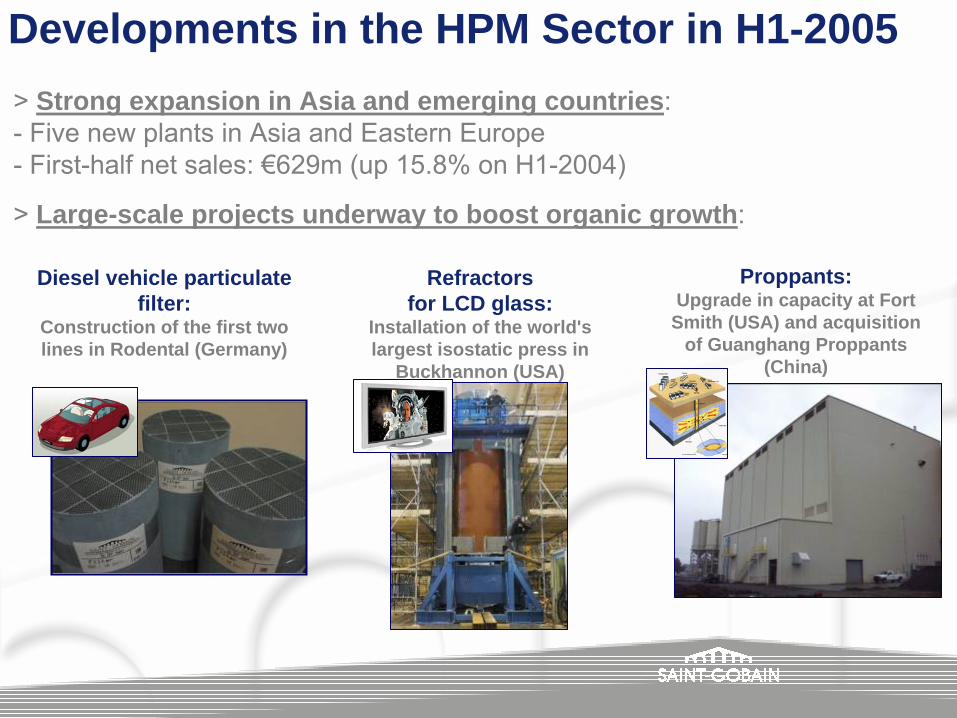
> Strong expansion in Asia and emerging countries: - Five new plants in Asia and Eastern Europe- First-half net sales: €629m (up 15.8% on H1-2004)
> Large-scale projects underway to boost organic growth:
Developments in the HPM Sector in H1-2005
Diesel vehicle particulate filter:
Construction of the first two lines in Rodental (Germany)
Refractors for LCD glass:
Installation of the world's largest isostatic press in
Buckhannon (USA)
Proppants:Upgrade in capacity at Fort
Smith (USA) and acquisition of Guanghang Proppants
(China)
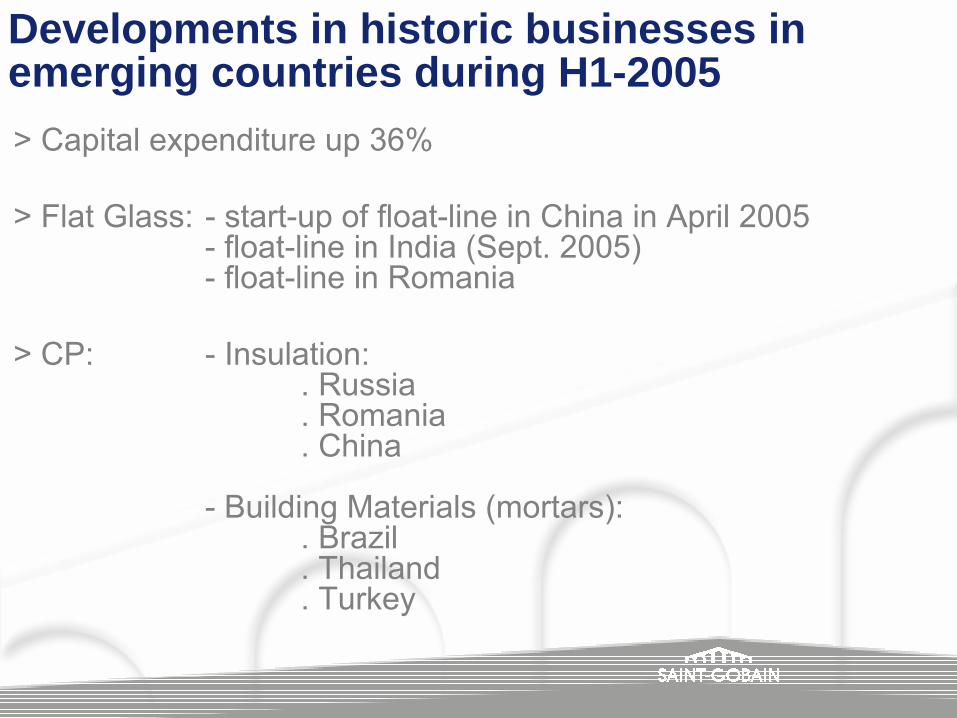
> Capital expenditure up 36%
> Flat Glass: - start-up of float-line in China in April 2005 - float-line in India (Sept. 2005)- float-line in Romania
> CP: - Insulation: . Russia. Romania. China
- Building Materials (mortars):. Brazil. Thailand. Turkey
Developments in historic businesses in emerging countries during H1-2005
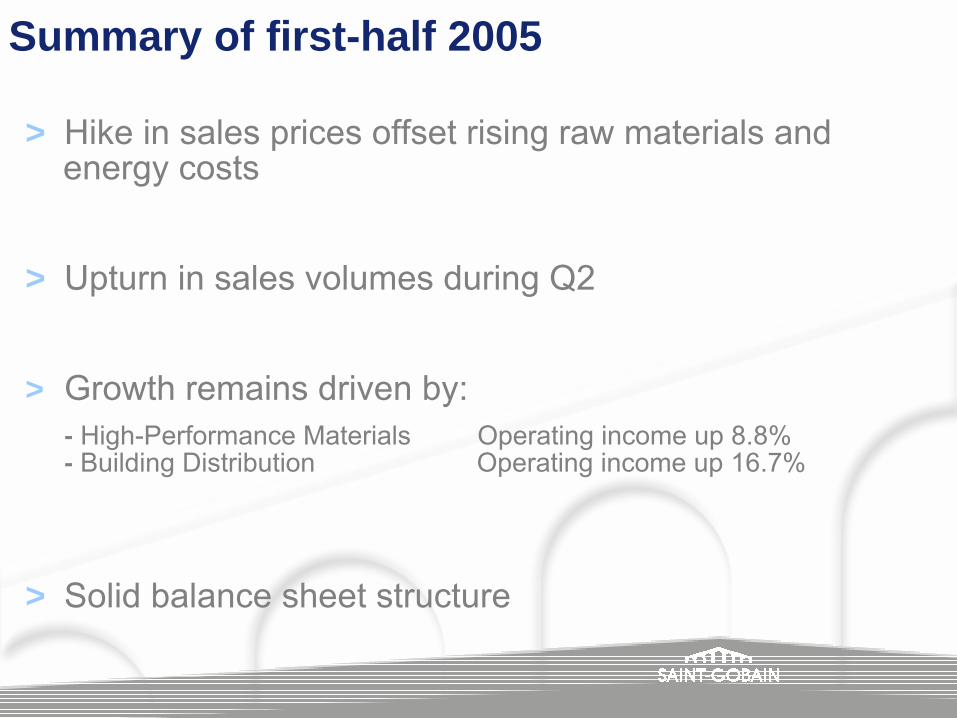
Summary of first-half 2005
> Hike in sales prices offset rising raw materials andenergy costs
> Upturn in sales volumes during Q2
> Growth remains driven by: - High-Performance Materials Operating income up 8.8% - Building Distribution Operating income up 16.7%
> Solid balance sheet structure
Outlook and targets
A. Outlook for second-half 2005
B. Targets for FY 2005
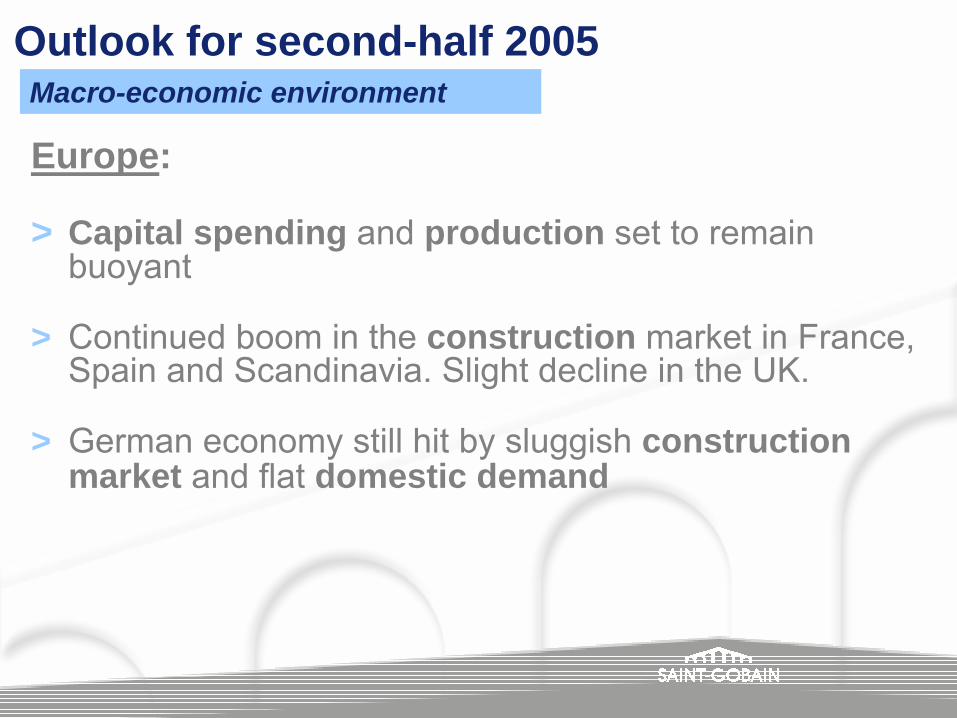
Europe:
> Capital spending and production set to remain buoyant
> Continued boom in the construction market in France, Spain and Scandinavia. Slight decline in the UK.
> German economy still hit by sluggish construction market and flat domestic demand
Outlook for second-half 2005Macro-economic environment

US:> Continued satisfactory levels of industrial activity> Residential construction market expected to remain
buoyant until year-end> Sustained household consumption, despite rising
energy costsEmerging countries:> Vigorous growth expected across all sectors in Asia
and Eastern Europe
Outlook for second-half 2005Macro-economic environment
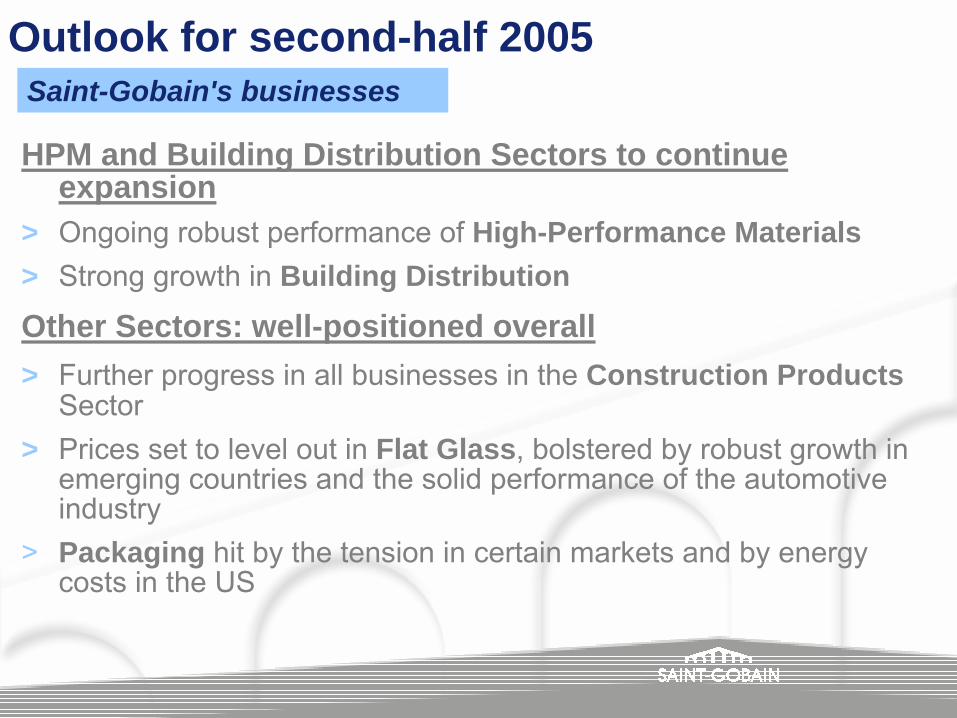
Outlook for second-half 2005
HPM and Building Distribution Sectors to continue expansion
> Ongoing robust performance of High-Performance Materials> Strong growth in Building Distribution
Other Sectors: well-positioned overall > Further progress in all businesses in the Construction Products
Sector> Prices set to level out in Flat Glass, bolstered by robust growth in
emerging countries and the solid performance of the automotiveindustry
> Packaging hit by the tension in certain markets and by energy costs in the US
Saint-Gobain's businesses
Continuation of the upturn observed in Q2
> Full-year effect of acquisitions in the Building Distribution Sector
> Overall, the European and US housing markets are set to hold firm
> Favorable price effects and productivity gains
> Robust growth in emerging countries
Targets for FY 2005
> Confirmation of 2005 target: 6% growth in operating income, at constant exchange rates*, thanks to a continuation of the favorable trends observed in Q2
> Sustained high levels of free cash flow
* average exchange rates for 2004
First-half 2005 resultsA
BPB plcB

Why have we approached BPB?
Why have we approached BPB? The opportunity to create a leader in building interiorsolutions
> Building interior solutions (partitions, ceilings, insulation,…), the core business of SG Insulation and BPB, presents attractive characteristics for Saint-Gobain :
- Growth- High profitability and strong free cash flow generation- Multi-regional markets
> A combination of BPB and SG Insulation would create a leader in this market
BPB : the leader in plasterboard
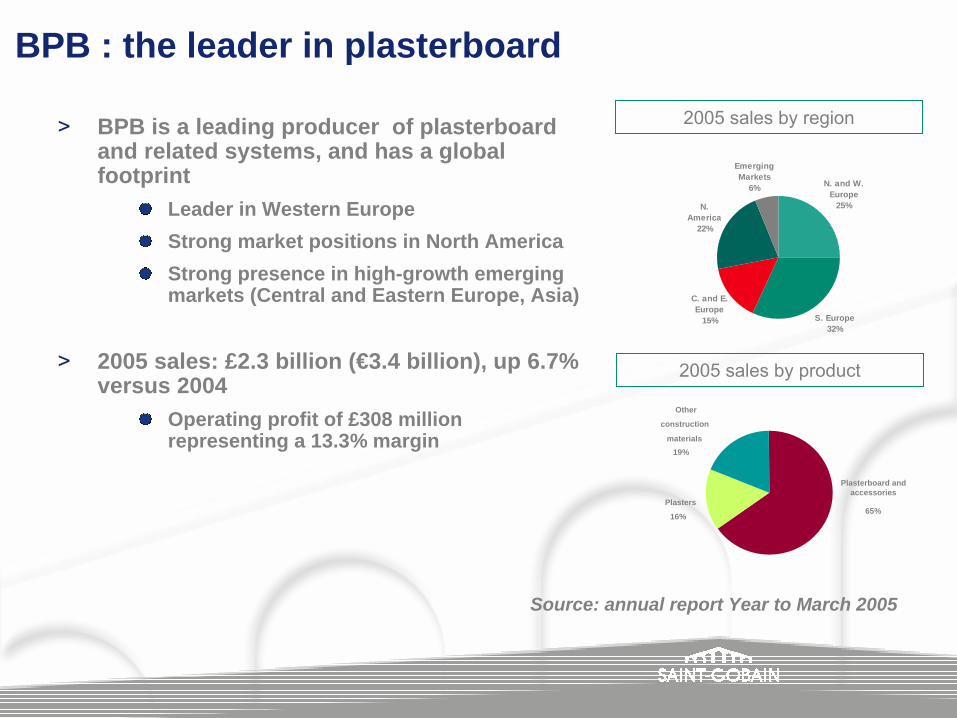
> BPB is a leading producer of plasterboard and related systems, and has a global footprint
Leader in Western EuropeStrong market positions in North AmericaStrong presence in high-growth emerging markets (Central and Eastern Europe, Asia)
> 2005 sales: £2.3 billion (€3.4 billion), up 6.7% versus 2004
Operating profit of £308 million representing a 13.3% margin
N. and W. Europe
25%
S. Europe32%
N. America
22%
C. and E. Europe
15%
Emerging Markets
6%
2005 sales by region
2005 sales by product
Other
construction
materials19%
Plasters
16%
Plasterboard and accessories
65%
Source: annual report Year to March 2005

Strong complementarities with our ‘Construction Products Sector’
> We target the same client base (contractors, distributors, installers)
> We offer complementary products
> Our respective geographical locations can facilitate rapid expansion in emerging markets
Why are we considering sizeable acquisitions now ?
Saint-Gobain is now in a position to pursue a more aggressive acquisition strategy, thanks to :
> A sound financial position
> A more favourable evolution of the asbestos issue
> Attractive interest rates environment
A new stage in external growth
What next?> On 22 July, Saint Gobain made an approach to BPB to buy
the company for 675p a share in cash> Our proposal was fully financed and subject to very limited
due diligence. It was rejected by BPB. While we were surprised by their response and disappointed that the management of BPB did not wish to enter into discussions with us, our objective remains to agree a recommended deal with BPB
> We have noted BPB’s trading statement and are currently assessing the situation and continue to evaluate our options in respect of BPB
> We will only do a deal at a price we believe adds value to our shareholders
> We have identified other sizeable growth opportunities that are consistent with our new acquisition strategy
Analyst – Investor meeting
London, August 1, 2005


![Analyst / Investor Meeting / Interaction - Presentation [Company Update]](https://static.documents.pub/doc/80x56/577c7a9d1a28abe05495a56e/analyst-investor-meeting-interaction-presentation-company-update.jpg)
