Novel assay of antibacterial components in manuka honey usinglucigenin-chemiluminescence-HPLC
Koji Karasawa*, Shiomi Haraya, Sachie Okubo, Hidetoshi ArakawaDepartment of Analytical Biochemistry, School of Pharmacy, Showa University, 1-5-8 Hatanodai, Shinagawa, Tokyo 142-8555, Japan
Five components (hydrogen peroxide, methylglyoxal, dihydroxyacetone, fructose and glucose) of NewZealand manuka honey (Leptospermum scoparium) were analyzed using lucigenin chemiluminescencehigh-performance liquid chromatography (lucigenin-CL-HPLC). We focused on active oxygen speciesproduced from the components in order to easily detect these five components contained in manukahoney. H2O2 and O2
� generated from these components were identified by lucigenin-CL and electron spinresonance (ESR), and the bactericidal effect of ROS was confirmed using E. coli. The previously reportedassays for Manuka honey components have low specificities and require complicated preprocessingmethods. As our results, the detection and identification of these components were possible within30 min in lucigenin-CL-HPLC system, without any special treatment. It is considered that lucigenin-CL-HPLC is useful for the quality control and the analysis of various honey.
Manuka honey is the major medical grade honey currentlyapproved for clinical application [1e3]. This substance is producedfrom the manuka bush (Leptospermum scoparium), a plant indige-nous to New Zealand and Australia. The honey used as a source formedical-grade manuka honey is collected from its natural
Karasawa).
environment. To date, the factors identified as contributing to theantibacterial activity of honeys are the high sugar concentration,hydrogen peroxide (H2O2), methylglyoxal (MGO), dihydroxyace-tone (DHA), antibacterial peptides, phenolic compounds, and lowpH [4]. Manuka honey has been made all over the world for use inelucidating the bactericidal effect of honey [5e7]. However, theexact mechanism of manuka honey action that leads to bacterialcell death is unknown. The antibacterial activity of manuka honeyis often expressed as an industry standard phenol-equivalent scale,the so-called unique manuka factor (UMF). This factor representsthe concentration of a phenol solution yielding a similar zone of
K. Karasawa et al. / Analytica Chimica Acta 954 (2017) 151e158152
growth inhibition as the honey when tested in a radial diffusionassay with Staphylococcus aureus as the target microorganism [8].Although the UMF designation suggests that the indicated level ofactivity is due to a manuka-specific compound, the UMF assay onlymeasures the level of antibacterial activity; this scale is not infor-mative regarding the identity of the components involved. Theantibacterial activity of manuka honey has been demonstratedagainst multiple target species, including Bacillus subtilis, Escher-ichia coli, extended-spectrum beta-lactamase-producing organisms(ESBL), S. aureus (including methicillin resistant S. aureus, MRSA),Enterococcus faecium (including vancomycin-resistant enterococci,VRE), Pseudomonas aeruginosa, Helicobacter pylori, and others[9e11]. UMF has been reported to correlate with the levels ofvarious manuka honey components such as MGO and leptosin[12e16]. The high levels of MGO in manuka honey are formed byconversion of DHA, which is present at exceptionally high con-centrations in the nectar of L. scoparium flowers. This conversionoccurs non-enzymatically at a slow rate during storage of the honey[4]. Based on a strong correlation between the MGO levels and theability of honey to inhibit the growth of S. aureus, it has beensuggested that MGO is fully responsible for the non-peroxideantibacterial activity of manuka honey. However, other work hasdemonstrated that the non-peroxide antibacterial activity ofmanuka honey is not solely attributable to MGO [3]. Thus, othernon-MGO components appear to contribute to the antibacterialactivity of manuka honey.
These results suggest that a simple analytical method with highsensitivity is required to detect the antibacterial components ofmanuka honey. Several analytical methods for the components ofmanuka honey and monofloral honeys have been reported to date[17e23]. However, techniques for detecting MGO face issues suchas low specificities and complicated preprocessing methods. Sim-ple analytical methods for the simultaneous detection of antibac-terial components like MGO, DHA, fructose (Fru), glucose (Glu), andH2O2, have not been reported. We have focused on reactive oxygenspecies (ROS) produced from these five components to permit easydetection of these compounds in manuka honey. We report herethat superoxide (O2
�) are generated from four of these five com-ponents (with the exception of H2O2), and have used the resultingvalues to estimate the antibacterial content. We subsequentlyanalyze the levels of all five components using a lucigenin chem-iluminescence method (lucigenin-CL) for detection of ROS.Lucigenin-CL is used primarily for the measurement of ROS such asO2� [24]. Previously, we used lucigenin-CL for a high-sensitivity
measurement of alkaline phosphatase as the substrate forreducing sugars and dihydroxyacetone phosphate (DHAP) [25]. Thetechnique takes advantage of the reaction mechanism of lucigenin-CL, such that O2
� activates a reducing substance, in turn leading toreduction of lucigenin, which then emits light. Lucigenin also per-mits the detection of hydrogen peroxide by a similar mechanism[26]. Thus, lucigenin-CL is expected to be of use in the analysis ofthe ROS-generating antibacterial components contained inmanukahoney.
In this study, in order to obtain a convenient and highly sensitiveanalytical method for five components of manuka honey, wedeveloped a novel analytical method using the lucigenin chem-iluminescence high-performance liquid chromatography (lucige-nin-CL-HPLC), which was based on a ROS detection system. Inaddition, we studied the antibacterial activity against E. coli of theMGO and DHA contained in samples of the samemanuka honey. Bycorrelating MGO and DHA antibacterial activity with detection ofO2�, we verified the validity of lucigenin-CL-HPLC as a specific
analytical method for detecting components with antibacterialactivity.
2. Materials and methods
2.1. Reagents
Bis-N-methylacridinium nitrate (lucigenin), bis-(2,4,6-trichlorophenyl) oxalate (TCPO), and 2-bromo-4’-nitroacetophenone wereobtained from Tokyo Chemical Industry Co., Ltd. MGO and micro-peroxidase were obtained from Sigma-Aldrich Co. LLC. DHA,hydrogen peroxide, Glu, Fru, acetonitrile, and superoxide dismutase(SOD) were obtained from Wako Pure Chemical Industries, Ltd.Catalase was obtained from Nacalai Tesque, Inc. All other reagentswere of analytical grade.
2.2. Honey samples
Manuka honeys were kindly provided by Mr. Iwasaki et al.,Medical Incubation System Co., and Tokyo, Japan. Manuka honeysin this study were used 100% New Zealand UMF 10þ (#1) and 100%New Zealand UMF 15þ (#2) that had been stored for less than ayear at the time of testing, and UMF 10þ (#3) and UMF 15þ (#4)that had been stored for 3 years. Separate preparations of manukahoney UMF 10þ (#5), UMF 15þ (#6), MGO 100þ (#7) andMGO150þ (#8) were obtained from 100% Pule New Zealand LtdandManuka Health New Zealand Ltd. these honeys had been storedfor 3 years at the time of testing. Following arrival in our laboratory,these manuka honeys were stored at room temperature. For eachhoney, a sample (0.1e0.5 g) of the substance was dissolved inanalytical grade water (1 mL) and filtered through a hydrophilicmembranewith pore size of 0.45-mm (Kurabo Industries Ltd, Osaka,Japan). Manuka honey #4was used for all assays. The other manukahoneys were used for only the lucigenin-CL-HPLC.
2.3. Enzyme reactions
Each solution of catalase and SOD was formulated by dissolvingthe respective enzyme (100e10,000 units/assay) in analytical gradewater. A honey sample was combined with an enzyme solution andthe mixture was incubated for 30 min at 37 �C.
2.4. TCPO/ANS-CL assay for H2O2
The ANS solution (pH 9.0) was formulated as 0.02% 8-anilinonaphthalene-1-sulfonic acid (ANS), 0.1% bovine serum al-bumin (BSA), and 0.2 mol/L barbital. Sample solution (10 mL) wasmixed with 100 mL of ANS solution and 100 mL of 0.05 mmol/L TCPOin ethyl acetate [27,28]. The combinationwas mixed and allowed toequilibrate for 10 s, and the intensity of luminescence wasmeasured over a 10-s interval using a BLR-301 luminescence reader(Aloka; Tokyo, Japan).
2.5. Lucigenin-CL assay for O2� and reducible components
The lucigenin solution was formulated as 2.4 � 10�5 mol/Llucigenin, 0.16 mol/L KOH, and 0.02% Triton X-100. Sample solution(10 mL) was mixed with 100 mL of lucigenin solution [24,29]. Thecombinationwas mixed and allowed to equilibrate for 10 s, and theintensity of luminescencewasmeasured over a 10-s interval using aBLR-301 luminescence reader (Aloka).
2.6. Detection of O2� and reducible components using electron spin
resonance (ESR) spectrum
The lucigenin solution was used here as the spin trapping so-lution. An aliquot (200 mL) of spin trapping solution was combinedwith 5 mL of 5,5-dimethyl-1-pyrroline-N-oxide (DMPO), and then
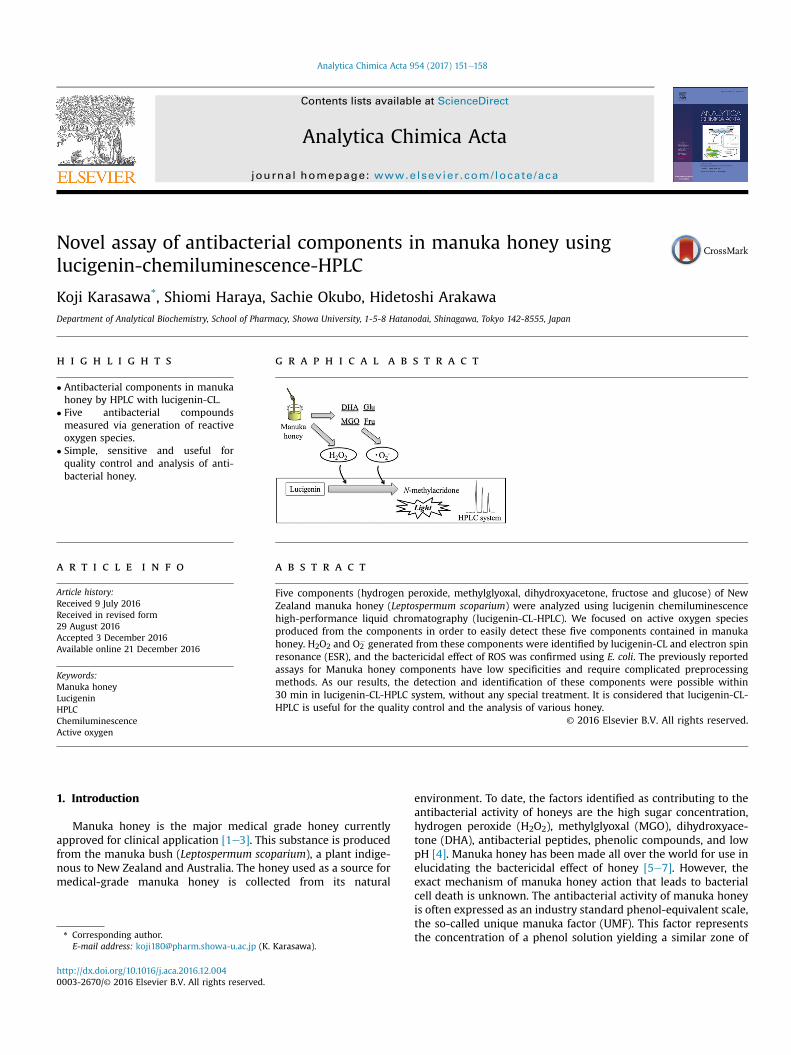
Fig. 1. Scavenging of O2� in 20% manuka honey (MH) in the presence and absence of
SOD (0e10,000 units).
K. Karasawa et al. / Analytica Chimica Acta 954 (2017) 151e158 153
30 mL of a honey sample solution was added in a timely fashion(within 1 min following introduction of DMPO) and the combina-tion was mixed. The reaction was conducted at room temperature.The reacted solution was then immediately placed within the ESRcell cavity and the spectrum was determined at 40 s after themixing step [24,28]. A mixture of xanthine and xanthine oxidase,which was prepared by combining 20 mL of 20 mmol/L xanthine,20 mL of 1 U/mL xanthine oxidase, 200 mL of 0.1 mol/L phosphatebuffer (pH 7.4), and 5 mL of DMPO was used as the control solution.The spectrum was obtained using a JES-FR30 ESR spectrometer(JEOL RESONANCE Inc.). ESR conditions were as follows: microwavepower, 4 mW; modulation frequency, 9420.0 MHz; field center,335.250mT (width 5.0� 1mT); mod,100 kHz (width 1.0� 0.1 mT);amplitude, 5.0 � 10; time constant, 0.03 s; and sweep time, 1 min.
2.7. Bacterial strain and culture conditions
The antibacterial assay used strain Escherichia (E.) coli ATCC25,922. Bacterial cells were grown overnight in 3 mL of peptonebroth (pH 7.2) at 37 �C. The culture solution was diluted with100 mmol/L phosphate-buffered saline (pH 7.0) to a bacterialdensity of 1.0 � 107 colony-forming units (CFU)/mL. An aliquot(100 mL, 106 CFU) of this bacterial suspension was combined with900 mL of a PBS dilution of honey and the mixtures was culturedovernight at 37 �C. PBS-diluted suspensions of bacteria were mixedwith dilutions of manuka honey (at 5e25%). In control cultures,bacterial suspensions were grown in the presence of MGO(0.1e10 mmol/L) or DHA (0.1e10 mmol/L). A 100-mL volume ofsamples were spread on nutrient agar plates (Eiken Chemical Co.,Tokyo, Japan). Following incubation overnight at 37 �C, the numberof colonies on the plates was counted. Data are presented as CFU/mL in the form of graphs [28].
2.8. Lucigenin-CL-HPLC
HPLC analyses were performed using a HPLC system with anintelligent HPLC pump (Jasco Co.) and a CLD-110 chem-iluminescence detector (Tohoku Electronic Industrial Co., Ltd.). Theseparation of honey components was performed using a bi-connected Inertsil NH2 column (4.6 mm � 250 mm, 5-mm particlesize) (GL Sciences, Inc.). A gradient elution was performed at 1 mL/min. Eluent A was 90% acetonitrile in water and Eluent B waslucigenin chemiluminescence reagent (a ten-fold dilution in waterof the lucigenin solution described above). A sample of manukahoney (0.1e0.5 g) was dissolved in HPLC grade water (1 mL) andfiltered over a hydrophilic 0.45-mm membrane. An aliquot (1 mL) ofthe filtered sample then was injected onto the HPLC system. Anaqueous solution of 4.1 � 10�3 mol/L 2-bromo-40-nitro-acetophenone (2B) was used as an internal standard (IS) for theHPLC.
3. Results and discussion
3.1. Lucigenin-CL detection of superoxide generated from thecomponents in manuka honey
Since the original observation of H2O2 in honey in 1962, theantibacterial role of this honey component has been the subject ofmultiple studies [30]. Prior to assessment via a lucigenin-CL assay,we tested the level of H2O2 in the manuka honey used in the pre-sent study by employing the peroxyoxalate chemiluminescencemethod (TCPO/ANS-CL) [27]. This assay revealed that 100%manukahoney contained H2O2 at about 2 � 10�4 mol/L. We furtherobserved that the light emission by manuka honey in the TCPO/ANS-CL assay was increased 1.9-fold when the honey was
preincubatedwith SOD (data not shown). Presumably, O2� produced
from some components of manuka honey was converted to H2O2by SOD, resulting in increased light emission. Thus, we postulatedthat other ROS such as O2
�, in addition to H2O2, are involved in theantibacterial effect of manuka honey. We therefore elected to usethe lucigenin-CL assay to assess the ROS content of manuka honey.In preliminary experiments, we used the lucigenin-CL assay toexamine ROS production by each of 5 purified compoundsdH2O2,MGO, DHA, Glu, and Frudknown to be components of manukahoney. ROS production by each component could be detected bylucigenin-CL. Comparison to calibration curves revealed detectionlimits (blank þ3SD) for the individual components as follows:MGO, 7.5 � 10�4 mol/L; H2O2, 4.8 � 10�6 mol/L; DHA,1.6 � 10�5 mol/L; Fru, 1.3 � 10�4 mol/L; and Glu, 3.0 � 10�4 mol/L.Like H2O2, the four non-peroxide components were estimated torelease electrons by reaction with lucigenin and to generate O2
� bysubsequent reaction with oxygen.
In the next step, 20% manuka honey solution was tested for ROSproduction using the lucigenin-CL assay and was observed togenerate high levels of chemiluminescence, with a signal/noiseratio (S/N ratio) of 1681. We postulated that this strong emissionwas the result of light emission in response to H2O2 and O2
�
generated from the four non-peroxide components. From theabove, it was suggested that O2
� has occurred from the four com-ponents inmanuka honey by lucigenin-CL. Next, in order to identifythe contribution of O2
� to the ROS level in manuka honey, the honeywas assayed following reaction with SOD. Specifically, a 20% man-uka honey solution was reacted with SOD at 100e10,000 U/assay.At 100 U SOD, lucigenin-CL-associated light emission by honeyexhibited little or no decrease, but this luminescence graduallydecreased as the number of enzyme units rose (Fig. 1). Our resultsindicated that much of the honey-associated luminescence derivesfrom O2
�. Presumably the H2O2 generated from O2� by SOD was not
sufficient to compensate for the loss of O2�-associated light emis-
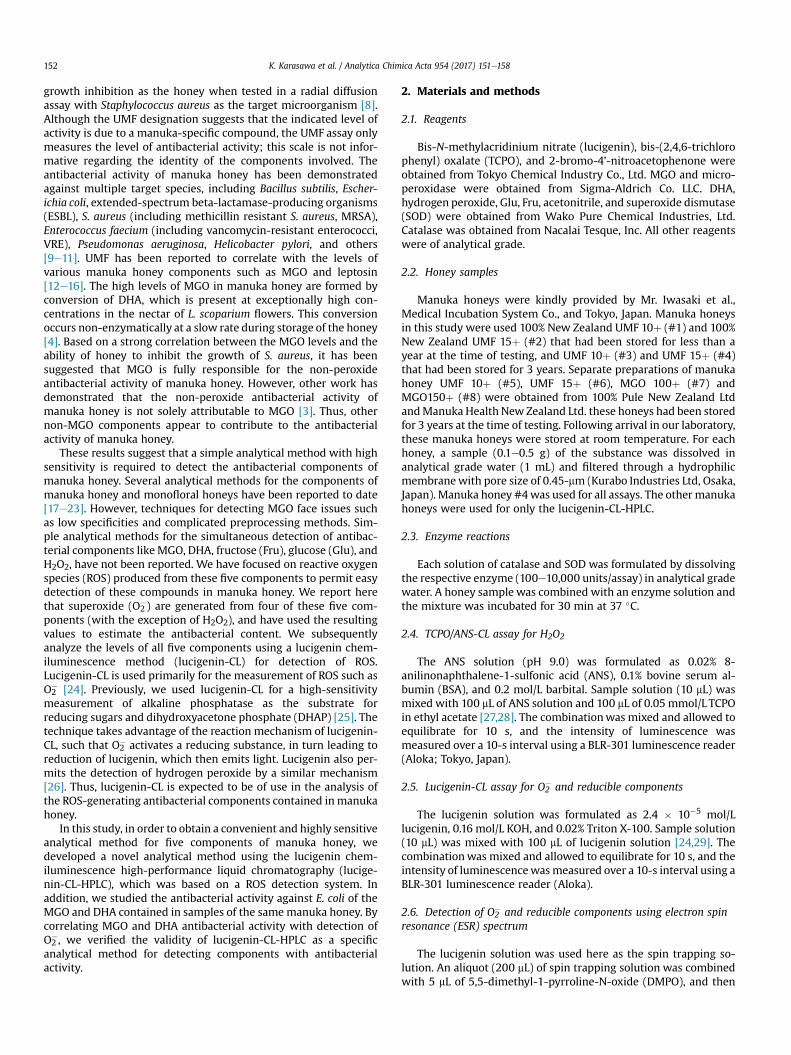
sion. This point can be inferred from results of the measurement ofthe lucigenin luminescence in honey solutions treated with eithercatalase or SOD at the highest tested enzyme levels (10,000 units/reaction), as shown in Fig. 2. Thus H2O2-derived luminescence andO2�-derived luminescence by honey can be distinguished by
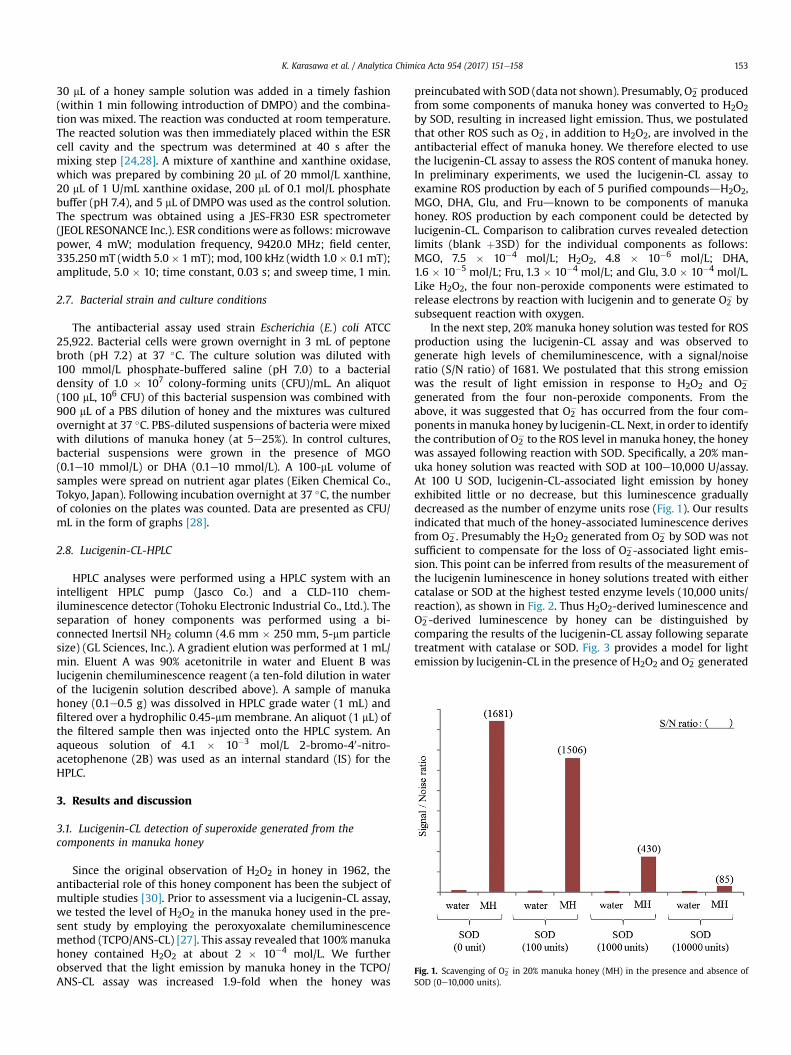
comparing the results of the lucigenin-CL assay following separatetreatment with catalase or SOD. Fig. 3 provides a model for lightemission by lucigenin-CL in the presence of H2O2 and O2
� generated
Fig. 2. Effect of catalase and SOD on lucigenin-CL-associated luminescence.
K. Karasawa et al. / Analytica Chimica Acta 954 (2017) 151e158154
from the four non-peroxide components of the manuka honey [24].In the subsequent experiments, we used this model of lucigenin-CLluminescence to determine ROS levels in manuka honeys.
3.2. Use of ESR to elucidate properties of the lucigenin-CL systemand to detect O2
� generated from manuka honey components
The properties of the lucigenin-CL system and the O2� generation
bymanuka honey components were studied using ESR. ESR spectrawere measured using a reaction mixture that was prepared by thecombination of 200 mL of spin trapping solution, 5 mL of DMPO, and30 mL of honey sample. First, the component reference standards
Fig. 3. Schematic of H2O2 and O2� me
capable of generating O2� were measured by ESR. Individual solu-
tions of 20 mg/mL Glu, 20 mg/mL Fru, 1 mmol/L MGO, and 1 mmol/L DHA were used as the reference standards. This control systemdemonstrated that O2
� generated from the component referencestandards could be detected (Fig. 4A). Subsequently, 50% manukahoney solution was assayed by ESR and the generated O2
� wasdetected as a spectrum (Fig. 4B). In a control reaction, we demon-strated that the spectrum of generated O2
� was eliminated upontreatment of manuka honey with 10,000 units of SOD. Together,these results showed that O2
� was being generated from compo-nents contained in manuka honey (Fig. 4C). For all ESR studies, theO2� spectra were not detected when the assay employed a spin
asurement by lucigenin-CL assay.
Fig. 4. ESR spectra of superoxide produced from components of manuka honey.
K. Karasawa et al. / Analytica Chimica Acta 954 (2017) 151e158 155
trapping solution that lacked lucigenin. Thus, the presence of anelectron acceptor such as lucigenin permitted the generation of O2
�
from the four non-peroxide components (Glu, Fru, DHA, and MGO)of manuka honey.
3.3. Bactericidal effect of manuka honey
As noted in the Introduction, multiple studies have reported thebactericidal effects of manuka honey. In the work described above,we demonstrated the generation of ROS from the componentscontained in manuka honey. In this part of the study, we examinedwhether O2
� was involved in the bactericidal effect of this sub-stance. The bactericidal effect of O2
� generated in manuka honeywas confirmed using E. coli ATCC 25,922, as assessed by a colony-counting method, as described in the Methods section. In short,Manuka honey at � 10% or MGO at � 1 mmol/L was bactericidal in
this assay. DHA exhibited lower potency, with bactericidal activitiesof 89% at 10 mmol/L, 67% at 1 mmol/L and 53% at 0.1 mmol/L.UMF15þ manuka honey has been reported to contain MGO at3.5 � 10�3 mmol/L (about 250 mg/kg for a compound with a mo-lecular weight of 72) [18] and higher UMF values are indicative ofhigher bactericidal effects. As seen in other studies, MGO exhibitedhigh bactericidal potency in our study. In contrast, although thelucigenin-CL assays indicated that DHA is a potent generator of O2
�,DHA showed lower potency than MGO in the bactericidality assay.We postulate that this distinction reflects the different environ-ments used in these two assays, which presumably affect the effi-ciency of O2
� generation. To directly assess the effects of O2�, we
repeated the bactericidality tests with manuka honey (or 1 mmol/LMGO) in the additional presence of 10,000 units SOD or of 10,000units of both SOD and catalase. As shown in Fig. 5, assays performedwith enzyme supplementation demonstrated that the bactericidal
Fig. 5. Bactericidal effects of manuka honey and 1 mmol/L MGO in the presence of SOD or of SOD plus catalase.
Table 1Retention times of five components by lucigenin-CL-HPLC.
Component Retention time (min)
IS 5.9
K. Karasawa et al. / Analytica Chimica Acta 954 (2017) 151e158156
action of manuka honey and of MGO were decreased in the pres-ence of SOD or of SOD þ catalase. Thus, the bactericidal effects ofmanuka honey and of MGOwere attenuated by the depletion of O2
�
in the presence of SOD; bactericidality appeared to be furtherattenuated in the additional presence of catalase, suggesting thatthe depletion of H2O2 also contributed to bacterial survival.
Our earlier results indicated that lucigenin was required for thegeneration of O2
� in the ESR and lucigenin-CL experiments. Wepostulated that some other electron acceptor is responsible for thegeneration of O2
� in the bactericidal assay (i.e., in the absence oflucigenin). While MGO is the primary suspected source of thisbactericidal activity, other properties of manuka honey, includinghigh concentrations of sugars (Glu or Fru), H2O2, and pH, also havebeen implicated in the bactericidal effect of this honey [15]. In otherwork, we have reported that H2O2 generated from catechin in greentea has a very strong bactericidal effect [28]. The consumption ofGlu by glucose oxidase generates H2O2. And the reaction of Glu orFru with an electron acceptor generates O2
�. Thus, each of fiveknown components (DHA, MGO, Glu, Fru and H2O2) of manukahoney can be shown to exhibit bactericidal action. Therefore, it isvery important for any method for analysis of manuka honey tomeasure these five components together.
MGO 6.9H2O2 7.7DHA 8.8Fru 21.4Glu 25.8
Table 2Rs of five components by lucigenin-CL-HPLC.
Pair of components Rs
IS - MGO 7.1MGO - H2O2 3.9H2O2 - DHA 5.3DHA - Fru 38.3Fru - Glu 8.5
3.4. Detection of antibacterial components in manuka honey bylucigenin-CL-HPLC
In the subsequent experiments, a novel assay using lucigenin-CL-HPLC was evaluated as a simple method for simultaneousdetection of ROS and reducing components in manuka honey.First, the conditions of column selection, eluent, flow rate, thelight-emitting reagent concentration, and IS substance wereexamined using the reference standard samples (Glu, Fru, H2O2,DHA, and MGO). A single peak was detected for each standardsample within 30 min of column loading. 2B at 4.1 � 10�3 mol/Lwas used as the IS for lucigenin-CL-HPLC. The best separation wasobtained by a doubly connected NH2 column. The peak resolution
was determined by calculating the resolution of separation (Rs)using the following formula: Rs ¼ 1.18 � (tR2 � tR1)/(w0.5h1 þw0.5h2), (tR2, tR1 ¼ retention time; w0.5h1, w0.5h2 ¼ the peak widthin the middle point of peak height). Rs values of 1.5 or more wereobtained for all of the components. The retention times and the Rsbetween the pairs of components are shown in Table 1 andTable 2, respectively. The optimal conditions for HPLC were asshown in the Methods (Section 2.8). Next, this method was usedto generate calibration curves for each of the five components.This work indicated detection limits (blank þ 2 SD) for eachcomponent as Table 3. The detection limit of lucigenin-CL-HPLCwas inferior to that of lucigenin-CL without HPLC in terms of thedetection sensitivity. Nonetheless, lucigenin-CL-HPLC was judgedto have a sensitivity sufficient for analysis of the components ofmanuka honey. As a next step, we analyzed manuka honey usingthese conditions. The dilution curves for MGO and DHA were
Table 3Detection limits of five components by lucigenin-CL and lucigenin-CL-HPLC.
Method of detection limit assay MGO (mol/L) H2O2 (mol/L) DHA (mol/L) Fru (mol/L) Glu (mol/L)
Fig. 6. Dilution curves of DHA and MGO in manuka honey by lucigenin-CL-HPLC.
Fig. 7. Chromatogram of manuka honey (#4) by lucigenin-CL-HPLC.
K. Karasawa et al. / Analytica Chimica Acta 954 (2017) 151e158 157
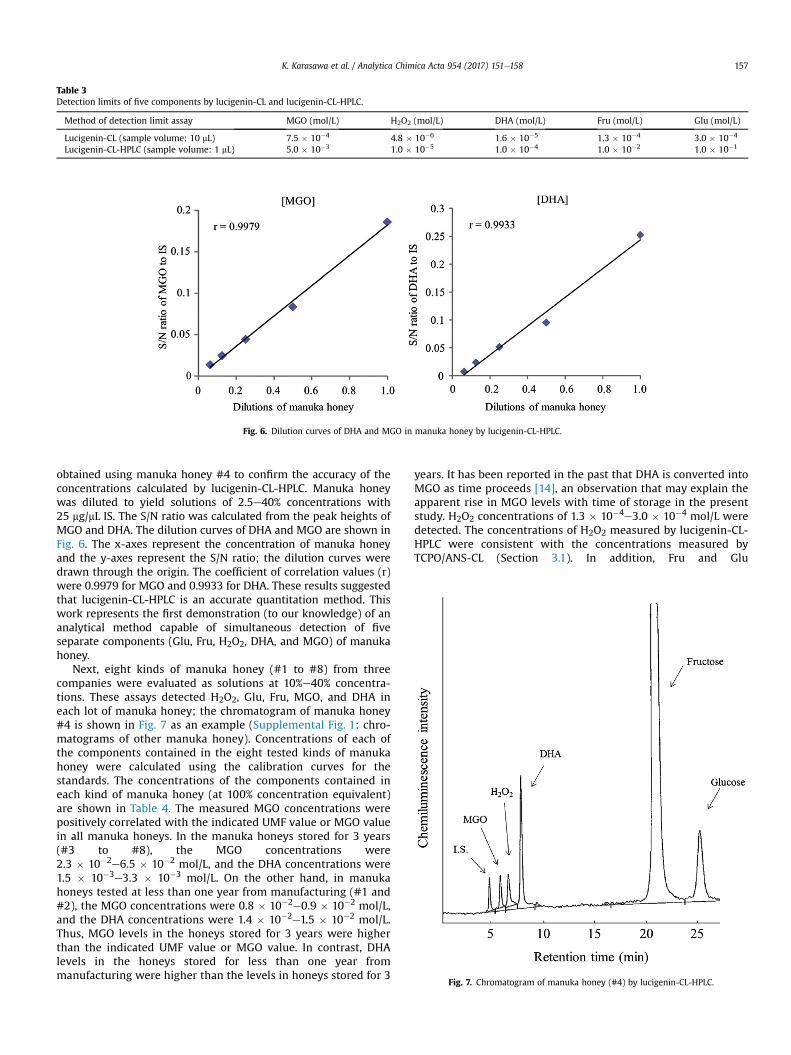
obtained using manuka honey #4 to confirm the accuracy of theconcentrations calculated by lucigenin-CL-HPLC. Manuka honeywas diluted to yield solutions of 2.5e40% concentrations with25 mg/mL IS. The S/N ratio was calculated from the peak heights ofMGO and DHA. The dilution curves of DHA and MGO are shown inFig. 6. The x-axes represent the concentration of manuka honeyand the y-axes represent the S/N ratio; the dilution curves weredrawn through the origin. The coefficient of correlation values (r)were 0.9979 for MGO and 0.9933 for DHA. These results suggestedthat lucigenin-CL-HPLC is an accurate quantitation method. Thiswork represents the first demonstration (to our knowledge) of ananalytical method capable of simultaneous detection of fiveseparate components (Glu, Fru, H2O2, DHA, and MGO) of manukahoney.
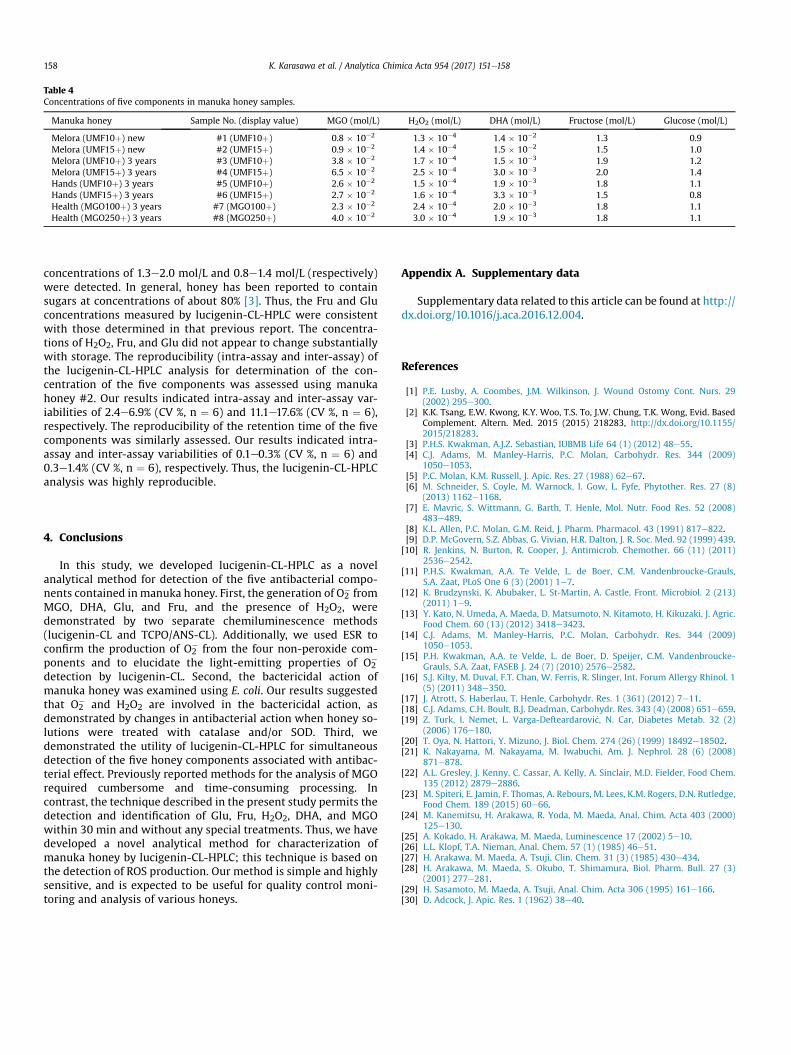
Next, eight kinds of manuka honey (#1 to #8) from threecompanies were evaluated as solutions at 10%e40% concentra-tions. These assays detected H2O2, Glu, Fru, MGO, and DHA ineach lot of manuka honey; the chromatogram of manuka honey#4 is shown in Fig. 7 as an example (Supplemental Fig. 1: chro-matograms of other manuka honey). Concentrations of each ofthe components contained in the eight tested kinds of manukahoney were calculated using the calibration curves for thestandards. The concentrations of the components contained ineach kind of manuka honey (at 100% concentration equivalent)are shown in Table 4. The measured MGO concentrations werepositively correlated with the indicated UMF value or MGO valuein all manuka honeys. In the manuka honeys stored for 3 years(#3 to #8), the MGO concentrations were2.3 � 10�2e6.5 � 10�2 mol/L, and the DHA concentrations were1.5 � 10�3e3.3 � 10�3 mol/L. On the other hand, in manukahoneys tested at less than one year from manufacturing (#1 and#2), the MGO concentrations were 0.8 � 10�2e0.9 � 10�2 mol/L,and the DHA concentrations were 1.4 � 10�2e1.5 � 10�2 mol/L.Thus, MGO levels in the honeys stored for 3 years were higherthan the indicated UMF value or MGO value. In contrast, DHAlevels in the honeys stored for less than one year frommanufacturing were higher than the levels in honeys stored for 3
years. It has been reported in the past that DHA is converted intoMGO as time proceeds [14], an observation that may explain theapparent rise in MGO levels with time of storage in the presentstudy. H2O2 concentrations of 1.3 � 10�4e3.0 � 10�4 mol/L weredetected. The concentrations of H2O2 measured by lucigenin-CL-HPLC were consistent with the concentrations measured byTCPO/ANS-CL (Section 3.1). In addition, Fru and Glu
Table 4Concentrations of five components in manuka honey samples.
K. Karasawa et al. / Analytica Chimica Acta 954 (2017) 151e158158
concentrations of 1.3e2.0 mol/L and 0.8e1.4 mol/L (respectively)were detected. In general, honey has been reported to containsugars at concentrations of about 80% [3]. Thus, the Fru and Gluconcentrations measured by lucigenin-CL-HPLC were consistentwith those determined in that previous report. The concentra-tions of H2O2, Fru, and Glu did not appear to change substantiallywith storage. The reproducibility (intra-assay and inter-assay) ofthe lucigenin-CL-HPLC analysis for determination of the con-centration of the five components was assessed using manukahoney #2. Our results indicated intra-assay and inter-assay var-iabilities of 2.4e6.9% (CV %, n ¼ 6) and 11.1e17.6% (CV %, n ¼ 6),respectively. The reproducibility of the retention time of the fivecomponents was similarly assessed. Our results indicated intra-assay and inter-assay variabilities of 0.1e0.3% (CV %, n ¼ 6) and0.3e1.4% (CV %, n ¼ 6), respectively. Thus, the lucigenin-CL-HPLCanalysis was highly reproducible.
4. Conclusions
In this study, we developed lucigenin-CL-HPLC as a novelanalytical method for detection of the five antibacterial compo-nents contained in manuka honey. First, the generation of O2
� fromMGO, DHA, Glu, and Fru, and the presence of H2O2, weredemonstrated by two separate chemiluminescence methods(lucigenin-CL and TCPO/ANS-CL). Additionally, we used ESR toconfirm the production of O2
� from the four non-peroxide com-ponents and to elucidate the light-emitting properties of O2
�
detection by lucigenin-CL. Second, the bactericidal action ofmanuka honey was examined using E. coli. Our results suggestedthat O2
� and H2O2 are involved in the bactericidal action, asdemonstrated by changes in antibacterial action when honey so-lutions were treated with catalase and/or SOD. Third, wedemonstrated the utility of lucigenin-CL-HPLC for simultaneousdetection of the five honey components associated with antibac-terial effect. Previously reported methods for the analysis of MGOrequired cumbersome and time-consuming processing. Incontrast, the technique described in the present study permits thedetection and identification of Glu, Fru, H2O2, DHA, and MGOwithin 30 min and without any special treatments. Thus, we havedeveloped a novel analytical method for characterization ofmanuka honey by lucigenin-CL-HPLC; this technique is based onthe detection of ROS production. Our method is simple and highlysensitive, and is expected to be useful for quality control moni-toring and analysis of various honeys.
Appendix A. Supplementary data
Supplementary data related to this article can be found at http://dx.doi.org/10.1016/j.aca.2016.12.004.
References
[1] P.E. Lusby, A. Coombes, J.M. Wilkinson, J. Wound Ostomy Cont. Nurs. 29(2002) 295e300.
[15] P.H. Kwakman, A.A. te Velde, L. de Boer, D. Speijer, C.M. Vandenbroucke-Grauls, S.A. Zaat, FASEB J. 24 (7) (2010) 2576e2582.
[16] S.J. Kilty, M. Duval, F.T. Chan, W. Ferris, R. Slinger, Int. Forum Allergy Rhinol. 1(5) (2011) 348e350.
[17] J. Atrott, S. Haberlau, T. Henle, Carbohydr. Res. 1 (361) (2012) 7e11.[18] C.J. Adams, C.H. Boult, B.J. Deadman, Carbohydr. Res. 343 (4) (2008) 651e659.[19] Z. Turk, I. Nemet, L. Varga-Defteardarovi�c, N. Car, Diabetes Metab. 32 (2)
(2006) 176e180.[20] T. Oya, N. Hattori, Y. Mizuno, J. Biol. Chem. 274 (26) (1999) 18492e18502.[21] K. Nakayama, M. Nakayama, M. Iwabuchi, Am. J. Nephrol. 28 (6) (2008)
871e878.[22] A.L. Gresley, J. Kenny, C. Cassar, A. Kelly, A. Sinclair, M.D. Fielder, Food Chem.
135 (2012) 2879e2886.[23] M. Spiteri, E. Jamin, F. Thomas, A. Rebours, M. Lees, K.M. Rogers, D.N. Rutledge,
Food Chem. 189 (2015) 60e66.[24] M. Kanemitsu, H. Arakawa, R. Yoda, M. Maeda, Anal. Chim. Acta 403 (2000)
125e130.[25] A. Kokado, H. Arakawa, M. Maeda, Luminescence 17 (2002) 5e10.[26] L.L. Klopf, T.A. Nieman, Anal. Chem. 57 (1) (1985) 46e51.[27] H. Arakawa, M. Maeda, A. Tsuji, Clin. Chem. 31 (3) (1985) 430e434.[28] H. Arakawa, M. Maeda, S. Okubo, T. Shimamura, Biol. Pharm. Bull. 27 (3)
(2001) 277e281.[29] H. Sasamoto, M. Maeda, A. Tsuji, Anal. Chim. Acta 306 (1995) 161e166.[30] D. Adcock, J. Apic. Res. 1 (1962) 38e40.


![Analytica Chimica Acta - sklac.nju.edu.cnsklac.nju.edu.cn/hxju/lunwenlunzhu/paper2014/470 Anal Chim Acta Zhu... · instrumentation [11–13]. For the past fewyears, avarietyof amplification](https://static.documents.pub/doc/80x56/5c65ec8509d3f230488b5a64/analytica-chimica-acta-sklacnjuedu-anal-chim-acta-zhu-instrumentation.jpg)


